Geochemistry of Shale Gas Basins including NORMs and Trace Elements Jean-Philippe ‘JP’ Nicot Bureau of Economic Geology Jackson School of Geosciences The University of Texas at Austin Ground Water Protection Council UIC Conference Houston, TX – January 23, 2012
Transcript
Geochemistry of Shale Gas Basins including NORMs and
Trace Elements
Jean-Philippe ‘JP’ Nicot
Bureau of Economic GeologyJackson School of GeosciencesThe University of Texas at Austin
Ground Water Protection Council UIC Conference
Houston, TX – January 23, 2012
2
Bureau of Economic Geology
Outline
•Basin hydrodynamics: water does flow•Chemical composition, trace elements, NORMs
•How much is too much?•No (easy to find) data
3
Bureau of Economic Geology
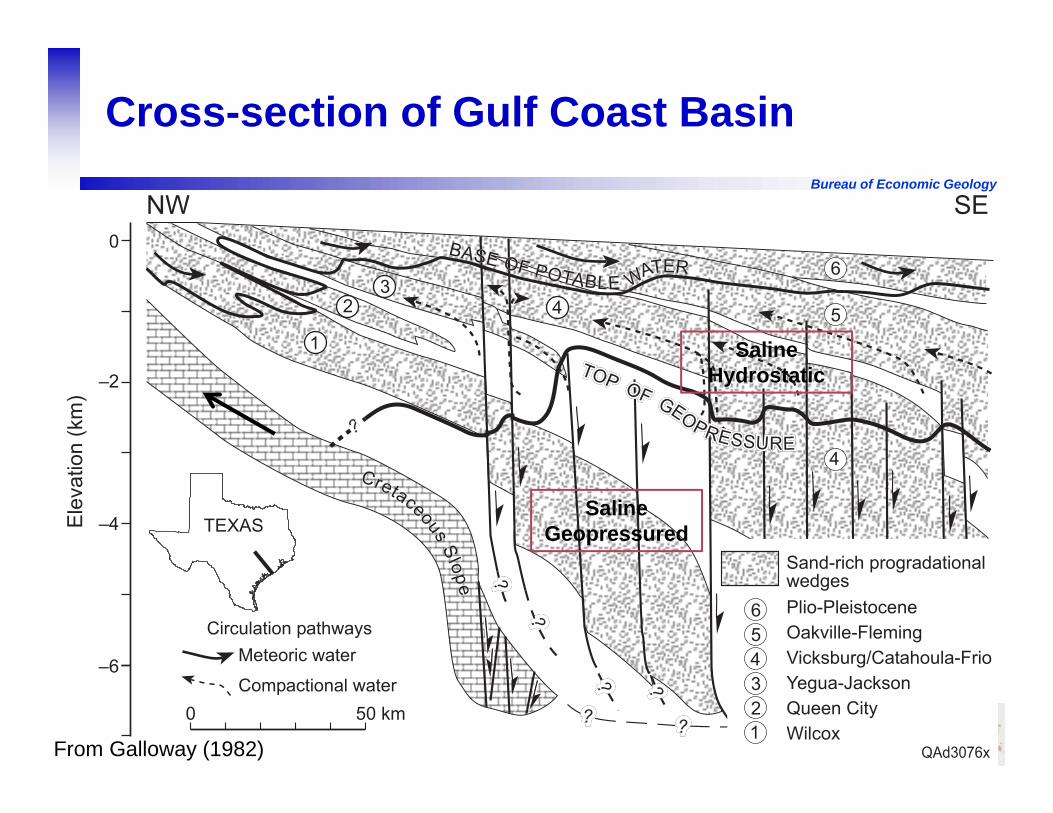
Hydrogeology of Sedimentary Basins
•Variable!
4
Bureau of Economic Geology
N
LLANOUPLIFT
ANADARKOBASIN
H ARDEMANBASIN
RED RIV ER UPLIFT
EAST
TEXAS
EMBAYMENT
SABIN EU PLIFT
RIO
GRANDE
EMBAYMENT
Uplift
Moderate downwarp ing
Intensive downwarping
0
0 100 200
100 200 m
300 mQAd3 853 x
From Kreitler (1989)
5
Bureau of Economic Geology
>30,000 wells fracedin the past 5 years
BARNETT SHALE
HAYNESVILLE SHALE
EAGLE FORD SHALEPEARSALL SHALE
SHALES
TIGHT GAS
Granite wash, Cleveland, Marmaton
BOSSIER SHALE
Cotton Valley,Travis Peak
Wolfberry
Canyon Sands
Vicksburg,Wilcox
Olmos
WOODFORD SHALEBARNETT SHALE
6
Bureau of Economic Geology
Hydrogeology of Sedimentary Basins
•Variable!•Water/Brine are highly mobile (geologic scale)•Driving forces: compaction, gravity (uplift), convection (density-driven by salinity or temperature contrasts), diffusion of chemical species
•Flow is not restricted along layers; regional leakage across aquitards (“shales” / mudrocks)
•Variable!•Water/Brine are highly mobile (geologic scale)•Driving forces: compaction, gravity (uplift), convection (density-driven by salinity or temperature contrasts), diffusion of chemical species
•Flow is not restricted along layers; regional leakage across aquitards (“shales” /mudrocks)
•Source of water: connate (“born with”), meteoric, deeper brines, or mixed
9
Bureau of Economic Geology
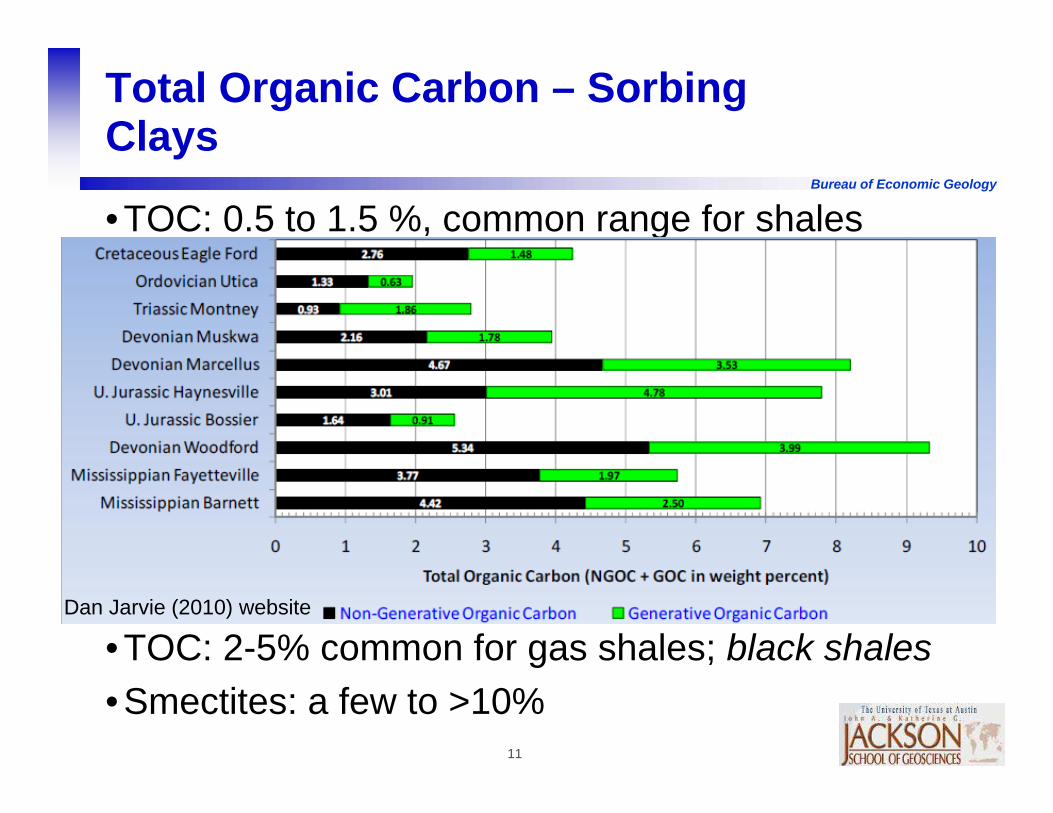
Chemical Composition
•Salinity in general increases with depth to a maximum value variable for each basin; however salinity reversal are not uncommon and salinity may stay <seawater
•Na-Cl or Na-Ca-Cl w/ or w/o SO4•Controlled by presence of evaporites in the basin, reflux of bitterns, water-rock interactions (Ba from degraded feldspar could precipitate if SO4), diffusion, organic carbon and microbial activity, mixing
•Crust aver.: Th ~10 ppm; U ~3 ppm ; Sr ~400 ppm•U, Th not soluble in water in reducing conditions but decay products (Ra-226 and Ra-228) are soluble
• Injection of fresh/brackish water: some defloculation(additives?), trace metal mobilization/leaching
•Fracking: quickly exposed a large surface area
20
Bureau of Economic Geology
NORM metrics
•Curie: unit of radioactivity measuring the number of disintegrations per second
•1 Ci =~ 1g Ra-226, that is, 1 pCi/L =~ 1 ppt Ra-226•Another concept: dose (mrem/time) =f(energy, impact on living tissue)
•Produced water: from ~0 to >10,000 pCi/L (10 ppb Ra-226)
21
Bureau of Economic Geology
Radium in Marcellus
•Higher concentrations but more samples too but still…..
USGS SIR-2011-5135
22
Bureau of Economic Geology
USGS SIR-2011-5135USGS SIR-2011-5135
23
Bureau of Economic Geology
USGS SIR-2011-5135USGS SIR-2011-5135
Woodford – OK:
TDS = 13,833 mg/L
TSS = 64.5 mg/L
Ra-226: 81.8 pCi/L
Ra-228: 7.34 pCi/L
U-234: 1.12 pCi/L
U-238: 0.96 pCi/L
G. alpha: 265 pCi/L
G. beta: 72 pCi/L
in SPE #121104
Horn et al. 2009
24
Bureau of Economic Geology
USGS SIR-2011-5135USGS SIR-2011-5135
5 pCi/L with TDS = 1000 ppm
1:1
25
Bureau of Economic Geology
Conclusions
• Immense variability in the geochemistry•Shale richer in trace elements (whole rock), not clear how much partitions into the water
•Better knowledge of trace elements, (organics) and NORMs is needed to better understand relationship between suite of elements detrimental to treatment


![Benin and Western Nigeria Offshore Basins: A Stratigraphic ...offshore basin is correlated with the Nkporo Shale in the Anambra Basin by [13]. Therefore, the Npkoro shale, as it named](https://static.documents.pub/doc/80x56/5e6f81aaec5eee485975692f/benin-and-western-nigeria-offshore-basins-a-stratigraphic-offshore-basin-is.jpg)


![Sandstone-Shale Geochemistry of Miocene Surma Group in ...article.esjournal.org › pdf › 10.11648.j.earth.20200901.15.pdf · 3]. Hence, the geochemistry of clastic sediments represents](https://static.documents.pub/doc/80x56/5ed930046714ca7f47694ec3/sandstone-shale-geochemistry-of-miocene-surma-group-in-a-pdf-a-1011648jearth2020090115pdf.jpg)


