Prepared in cooperation with the NATIONAL PARK SERVICE Geochemistry of the Johnson River, Lake Clark National Park and Preserve, Alaska Water-Resources Investigations Report 03-4252 U.S. DEPARTMENT OF THE INTERIOR U.S. GEOLOGICAL SURVEY
Transcript
Prepared in cooperation with theNATIONAL PARK SERVICE
Geochemistry of the Johnson River,Lake Clark National Park and Preserve, Alaska
Water-Resources Investigations Report 03-4252
U.S. DEPARTMENT OF THE INTERIORU.S. GEOLOGICAL SURVEY
Cover photograph: View of the Johnson River upstream from the gaging station. Photograph by Tim Bra-bets, U.S. Geological Survey, July 1999.
U.S. Department of the InteriorU.S. Geological Survey
Geochemistry of the Johnson River, Lake Clark National Park and Preserve, Alaska
By Timothy P. Brabets and James R. Riehle
Water-Resources Investigations Report 03-4252
Prepared in cooperation with the
NATIONAL PARK SERVICE
Anchorage, Alaska 2003
U.S. DEPARTMENT OF THE INTERIORGALE A. NORTON, Secretary
U.S. GEOLOGICAL SURVEYCharles G. Groat, Director
Use of trade names in this report is for identification purposes only and does not constitute endorsement by the U.S. Geological Survey
For additional information: Copies of this report may be purchased from:
Alaska Science CenterChief, Water Resources Office U.S. Geological SurveyU.S. Geological Survey Branch of Information Services4230 University Drive, Suite 201 Box 25286Anchorage, AK 99508-4664 Denver, CO 80225-0286
Purpose and scope ............................................................................................................................................................4Acknowledgements ..........................................................................................................................................................4
Description of study area ....................................................................................................................................................... 4Methods of data collection and analysis ................................................................................................................................ 4Bedrock geology of the Johnson River study area ................................................................................................................ 8
Geologic setting................................................................................................................................................................8Modifications to the geologic map...................................................................................................................................9
Flow and water-quality characteristics of the Johnson River ................................................................................................ 9Discharge..........................................................................................................................................................................9Specific conductance........................................................................................................................................................9pH.....................................................................................................................................................................................12Water temperature ............................................................................................................................................................12Dissolved oxygen .............................................................................................................................................................14Alkalinity..........................................................................................................................................................................14Nutrients ...........................................................................................................................................................................14Organic carbon .................................................................................................................................................................16Suspended sediment .........................................................................................................................................................16
Geochemistry and water quality of the study area................................................................................................................. 16Chemical composition and classification of rocks...........................................................................................................16Mineralization at the Johnson River Prospect..................................................................................................................16Alteration at the Johnson River Prospect and elsewhere in the study area ......................................................................17Discussion of geochemical data .......................................................................................................................................17Discussion of water-quality data ......................................................................................................................................19
Summary and conclusions ..................................................................................................................................................... 26References ............................................................................................................................................................................. 26Appendix 1. Trace element concentrations measured in 18 water samples collected from Johnson River above Lateral
Glacier near Tuxedni Bay, Alaska .................................................................................................................................. 29Appendix 2. Trace element concentrations measured in streambed sediment samples collected from sites located in the
Johnson River Basin, Alaska........................................................................................................................................... 31
FIGURES
Figures 1-6. Maps showing:1. Location of Lake Clark National Park and Preserve, Johnson River and Cook Inlet Basin, Alaska .................. 22. Location of Johnson River Prospect in the upper Johnson River Basin.............................................................. 33. Locations of water quality and discharge measurement sites.............................................................................. 54. Locations of geologic field sites and geology map of the study area.................................................................. 65. Geology of the study area .................................................................................................................................... 10
Figures 6-19. Graphs showing:6. Discharge hydrograph of the Johnson River above Lateral Glacier near Tuxedni Bay, Alaska, 1995-2002...... 127. Average monthly discharge for the Johnson River above Lateral Glacier near Tuxedni Bay ............................ 128. Relation between instantaneous discharge and instantaneous suspended sediment for the Johnson
River above Lateral Glacier near Tuxedni Bay, 1999-2001............................................................................... 169. Classification of chemically analyzed samples of the Talkeetna Formation and of the Alaska–Aleutian
Ranges batholith ................................................................................................................................................. 1610. Photographs of the Johnson River Prospect gossan and secondary veins ......................................................... 1811. Trilinear diagrams of water samples from the Johnson River Basin................................................................. 2012. Relation between total aluminum, total iron, and total manganese, and suspended sediment at Johnson
River above Lateral Glacier near Tuxedni Bay, Alaska..................................................................................... 23
i
TABLES
1. Selected minerals present in the Johnson River Basin ..................................................................................................... 3
2. Water-quality and discharge measurement sites in the Johnson River study area ........................................................... 8
3. Major elements as oxides in percent of Johnson River rock samples .............................................................................. 11
4. Discharge and physical properties measured at selected sites in the Johnson River study area ...................................... 13
5. Discharge, physical properties, and suspended sediment measured at Johnson River above Lateral Glacier near Tuxedni Bay, Alaska......................................................................................................................................................... 13
6. Nutrient and organic carbon concentrations measured in 18 water samples collected from Johnson River above Lateral Glacier near Tuxedni Bay, Alaska........................................................................................................................ 15
7. Alteration minerals of the Johnson River Prospect and associated gossans in the nearby Talkeetna Formation and batholith ............................................................................................................................................................................ 19
8. Major dissolved inorganic constituents measured in 18 water samples collected from Johnson River above Lateral Glacier near Tuxedni Bay, Alaska .................................................................................................................................... 21
9. Major dissolved inorganic constituents measured in water samples collected from sites in the Johnson River study area, July 2000 ........................................................................................................................................................ 21
10. Dissolved trace element concentrations measured in water samples collected from sites in the Johnson River study area, July 2000............................................................................................................................................... 22
11. Concentrations of selected trace elements in streambed sediments from various studies.............................................. 24
12. Concentrations of trace elements, percent organic carbon, and mean PEC quotient for streambed sediments at sites located in the Johnson River study area ................................................................................................................... 25
13. Results of acid based accounting tests on 11 rock samples from the Johnson River study area.................................... 25
CONVERSION FACTORS, VERTICAL DATUM, AND WATER-QUALITY INFORMATION
Multiply by To obtain
inch (in.) 25.4 millimeter
foot (ft) 0.3048 meter
mile (mi) 1.609 kilometer
cubic foot per second (ft3/s) 0.02832 cubic meter per second
In this report, temperature is reported in degrees Celsius (°C), which can be converted to degrees Fahrenheit (°F) by the
following equation:
°F = 1.8 (°C) + 32
ABBREVIATED WATER-QUALITY UNITS
Chemical concentration and water temperature are given only in metric units. Chemical concentration in water is given in milligrams per liter (mg/L) or micrograms per liter (µg/L). Milligrams per liter is a unit expressing the solute mass per unit volume (liter) of water. One thousand micrograms per liter is equivalent to 1 milligram per liter. For concentrations less than 7,000 milligrams per liter, the numerical value is about the same as for concentrations in parts per million. Specific conduc-tance is given in microsiemens per centimeter (µS/cm) at 25°C.
VERTICAL DATUM
Sea level: In this report, “sea level” refers to the National Geodetic Vertical Datum of 1929—A geodetic datum derived from a general adjustment of the first-order level nets of the United States and Canada, formerly called Sea Level Datum of 1929.
ii
Geochemistry of the Johnson River, Lake Clark National Park and Preserve, Alaska
By Timothy P. Brabets and James R. Riehle
ABSTRACT
The Johnson River Basin, located in Lake Clark National Park and Preserve, drains an area of 96 square miles. A pri-vate inholding in the upper part of the basin contains a gold deposit that may be developed in the future. To establish a natural baseline to compare potential effects on water qual-ity if development were to occur, the upper part of the Johnson River Basin was studied from 1999 to 2001 as part of a cooperative study with the National Park Service.
Two basic rock types occur within the drainage basin of the study: the Jurassic Talkeetna Formation of interbedded volcanic and volcaniclastic rocks, and the slightly younger plutonic rocks of the Aleutian-Alaska Ranges batholith. The Johnson River gold prospect reflects widespread, secondary mineralization and alteration of the Talkeetna Formation. Metals found at the prospect proper are: arsenic, cadmium, copper, gold, iron, lead, mercury, molybdenum, selenium, silver, and zinc.
The Johnson River Prospect is located in the East Fork Ore Creek Basin, a 0.5 square mile watershed that is a trib-utary to the Johnson River. Water quality data from this stream reflect the mineralization of the basin and the highest concentrations of several trace elements and major ions of the water column were found in this stream. Presently, pH in this stream is normal, indicating that there is sufficient buff-ering capacity. At the Johnson River streamgage, which drains approximately 25 mi2 including the East Fork Ore Creek, concentrations of these constituents are significantly lower, reflecting the runoff from Johnson Glacier and Dou-ble Glacier, which account for approximately 75 percent of the total discharge.
Streambed concentrations of cadmium, lead, and zinc from East Fork Ore Creek and its receiving stream, Ore Creek, typically exceed concentrations where sediment
dwelling organisms would be affected. Similar to the water column chemistry, concentrations of these elements are lower at the Johnson River streamgage, reflecting the fine sediment input from the glacier streams draining Johnson Glacier and Double Glacier. The amount of organic carbon present in the study area is relatively low and most sites indi-cate that some degree of toxicity is present even though these basins do not contain mineralized areas.
Acid based accounting tests on rock samples in the study area indicate a neutralizing capacity in the Talkeetna Forma-tion rocks. These results should be used with caution because similar tests were not done on rocks from narrow veins or faults that could have acid generating potential. In addition, based on field tests during the study, carbonate-bearing rocks in streambeds are armored by a carbonate-depleted shell and would not readily neutralize acidic water.
INTRODUCTION
The Johnson River is located in Lake Clark National Park and Preserve, on the west side of Cook Inlet, Alaska (fig. 1). Like many rivers and streams in the park, the Johnson River supports resident and anadromous fish popu-lations. Coho salmon, chum salmon, and Dolly Varden char can all be found in the river. The intertidal estuary and mud flats near the mouth of the river are important to resident and migratory birds, especially shorebirds. Bald eagle and pere-grine falcon nests are found along the Johnson River and the river valley supports the largest breeding population of trumpeter swans in western Cook Inlet.
In 1975, Resource Associates of Alaska, under contract to Cook Inlet Region, Incorporated (CIRI), an Alaska Native corporation, discovered a mineral prospect in the Johnson River Basin (fig. 2) (Steefel, 1987). In 1976, CIRI selected the land, including the mineral rights underlying the Johnson River Prospect, under the Alaska Native Claims
1
2
Lake Clark National Park and Preserve
63o
152o
63o
146o
60o
154o
149o
60o Johnson River
TuxedniBay
Anchorage
100 MILES75
100 KILOMETERS
50
75
25
5025
0
0
EXPLANATION
CO
OK
IN
LE
T
Figure 1. Location of Lake Clark National Park and Preserve, Johnson River and Cook Inlet Basin, Alaska.
LAKE CLARK NATIONAL PARKAND PRESERVE
Cook Inlet Basin
ALASKA
Glacier
Gaging Station
EXPLANATION
Glacier
0
0 1
1
2
2
3
3
4
4
5 KILOMETERS
5 MILES
Figure 2. Location of Johnson River Prospect in the upper Johnson River Basin.
Johnso
n Glacie
r
Lateral G
lacier
Double Glacier
Johnson RiverProspect
Private inholding
Johnson River
152o50' 152o40'153o
60o
06'
60o
09'
60o
02'
Table 1. Selected minerals present in the Johnson River Basin (modi-fied from Steefel (1987), and Gray (1988))
Element Symbol Mineral associations
Arsenic As Possibly as arsenopyrite with iron
Cadmium Cd Probably dissolved in sphalerite
Copper Cu Chalcopyrite
Gold Au Native gold
Iron Fe Pyrite
Lead Pb Galena
Mercury
Hg
Several possible forms (sulfide, sulfate, chlo-ride, or native mercury), most likely as either trace amounts of cinnabar or dissolved in sphalerite.
Molybdenum Mo Probably molybdenite
Selenium
Se
Typically occurs dissolved in sulfides, in gossans developed from sulfides, can also be adsorbed on surfaces of clays or iron-manga-nese oxides.
Silver Ag Possible native silver.
Zinc Zn Sphalerite
Settlement Act (ANCSA, 1971). This 33 mi2 area of land became known as the “Johnson River Tracts.” In 1981, a joint-venture agreement was signed between CIRI and Ana-conda Minerals Company to evaluate the mineral potential of the prospect. One drill hole intersected about 160 feet of ore, grading 0.59 ounces of gold per ton, 9.4 percent zinc, 2.8 percent lead, and 1.1 percent copper. Overall, Anaconda Minerals Company estimated 1-2 million tons of ore grad-ing 0.27 ounces of gold per ton, 7 percent zinc, and lesser amounts of copper and lead (Steefel, 1987). Other metal-bearing minerals known to occur in the area have been doc-umented by Steefel (1987) and Gray (1988) (table 1).
If the Johnson River Tracts were developed, the National Park Service is concerned about the effects of development on the water quality of the Johnson River. Weathering and breakdown of rocks in the natural environment usually takes place over an extended period of time; however, the break-down process in physically and chemically treated tailings and wastes from mines is accelerated. If ore and waste rock
3
were kept near the mine site or near the Johnson River flood-plain, the material could potentially increase the metal load and acidity of water in the Johnson River, resulting in acid mine drainage.
Purpose and Scope
This report summarizes the results of a cooperative study by the National Park Service (NPS) and the U.S. Geological Survey (USGS) during 1999 through 2001 to study the water quality of the Johnson River. The purpose of this study was to characterize the geochemistry of the Johnson River Prospect, to identify potential environmental hazards, and to determine baseline levels for selected water-quality constit-uents. The area of study is limited to the upper part of the Johnson River in the vicinity of the Johnson River Prospect (fig. 2).
Acknowledgements
The authors gratefully acknowledge the assistance of Cory Stephens and Peter Oswald of the U.S. Geological Survey with field work done in 2000. Additional resources were provided to the study from the U.S. Geological Survey National Water-Quality Assessment (NAWQA) Program, Cook Inlet Basin Study Unit. The authors gratefully appre-ciate Cook Inlet Region, Inc. for allowing access to corpo-ration lands.
DESCRIPTION OF STUDY AREA
The Johnson River Basin, located on the west side of Cook Inlet in south central Alaska, drains an area of about 96 mi2(fig. 2). Glaciers cover approximately 20 mi2 of the entire basin. The topography of the watershed ranges from relatively steep in the upper part of the basin to relatively flat in the lower part of the basin. Precipitation is also variable. Mean annual precipitation is about 67 inches, but ranges from 70 inches in the headwaters to about 55 inches at the mouth at Cook Inlet. Snow accounts for about one-half the precipitation. The primary land cover is alpine tundra, and inceptisols are the primary soils. Vegetative cover and soils are generally discontinuous and thinly developed in the upper portion of the basin.
The study area, located upstream of the gaging station (site 52, fig. 3), is approximately 25 mi2. The area includes the Johnson River Prospect, several small tributaries, and two glaciers, Johnson Glacier and Double Glacier that cover approximately 9 mi2 of the study area. Only the small basins in the vicinity of the Johnson River Prospect, Ore Creek, and
4
Kona Creek were studied. The Johnson River Prospect is located in the East Fork Ore Creek drainage basin (fig. 3).
METHODS OF DATA COLLECTION AND ANALYSIS
The primary factors that could affect the water quality in the Johnson River study area include the type of bedrock, occurrence of altered rock, and streamflow characteristics. For example, altered or mineralized rocks are important in geochemical studies because toxic metals and acids formed during weathering typically originate in these rocks. If met-als and acids enter the stream, they may or may not be diluted, depending on the flow characteristics. Thus, efforts were made towards collecting and analyzing these types of data.
Geologic mapping of the study area was first done by Detterman and Hartsock (1966). Because the authors focused on the sedimentary rocks and their potential for hydrocarbons, the Johnson River Prospect was not studied or mapped in further detail. Additional geologic mapping and interpretation of the area was done by Detterman and Reed (1980). In addition to detailed geologic mapping, a cross section of the Johnson River Prospect was developed by Steefel (1987). The Johnson River Prospect is included in the summary work by Nokleberg and others (1994). Aerial photography obtained in 1995 provided additional informa-tion on the geology of the area for this study.
Field work was done in the summer of 2000 to enhance and build upon the previous geology studies. Thirty-eight study sites were selected to examine the geology (fig. 4). From these sites, 69 rock samples were collected and sub-mitted for trace element analysis. Analytical procedures for trace elements are outlined in Baedecker (1987). Fourteen of the samples also were analyzed for major-element con-tent for use in rock classification. The major-element con-tent of the rocks was determined by x-ray fluorescence at the USGS laboratory in Lakewood, Colorado (Taggert and oth-ers, 1987).
Discharge data have been collected during open water periods (May through October) at one site located on the Johnson River since 1995 (fig. 3, site number 52, USGS sta-tion ID 15294700, Johnson River above Lateral Glacier near Tuxedni Bay, Alaska). These data provide a good overview of the flow characteristics of the Johnson River. In addition, discharge measurements were obtained at tributaries to the Johnson River located in the study area during 2000 to char-acterize their respective flow characteristics (table 2).
52
113112
110
111
114
115116
117
118
Johnson River Prospect
USGS Gaging Station
15294700
Kon
a C
r.
Ore C
r.
Double Glacier
John
son G
lacie
r
Johnson River
East Fork
Ore Cr.
North Fork
Ore Cr.
0
0 1
1
2 KILOMETERS
2 MILES
Johnson River drainage basin
Secondary drainage divide
EXPLANATION
Glacier
52 Water quality and Dischargesampling site (see table 2)
Gravel
Small drainage basins
Figure 3. Locations of water quality and discharge measurement sites (see table 2 for station names).
152o55'153o
60o
09'
60o
05'
Water samples were collected from the Johnson River at the gaging station (site number 52, fig. 3) from 1999-2001. These samples were collected over a range of discharge and provided a broad overview of the water quality of the Johnson River. Additional water samples were collected at nine sites located near the Johnson River Prospect during
summer 2000 to determine the water-quality characteristics of these small streams and their relative contributions to the total discharge in the Johnson River (fig. 3, table 2).
Water samples were analyzed for major ions, dissolved solids, nutrients, trace elements, organic carbon, and sus-
5
6
152o50'152o55'153o
60o
05'
60o
10'
1P
2PR101
R10015P
5P R117
R118
8P
16P
9P
19P
R120
18P
17P
R119
R1077P4P
R105R106
3P
R104R103R102
R116
6PR108
R109
R110
10P
R111
14P
13PR114
R115
R113
11P, R112 12P
Bru
in B
ay f
ault
Bru
in
Bay
fa
ult
Johnson R
Kona Creek
Jtkm
Jtkm
Jtkm
USGSGage
EXPLANATION3P
Geologic field station occupied during 2000 fieldwork
Boundary of drainage basin
Johnson River Prospect drainage basin
R106
Figure 4. Locations of geologic field sites and geology map of the study area.
0 1 2 3 4 5 MILES
0 1 2 3 4 5 KILOMETERS
CONTOUR INTERVAL 100 FEETDATUM IS MEAN SEA LEVEL
Metamorphic rocks: metamorphosed limestone, sandstone, siltstone, volcanic tuff, and greenstone; protoliths presumably mainly of Triassic (ie, pre-Talkeetna Formation) age
Marsh Creek breccia member: massive volcanic breccia and lava flows, in part marine; interbedded siltstone and tuff. Low-rank metamorphism of lower part
Portage Creek agglomerate member: massive agglomerate, some breccia, minor lava flows; interbedded metasedimentary rocks
Horn Mountain tuff member: andesitic tuff, tuffaceous sandstone, and siltstone; locally, some lava flows
Mainly biotite- and hornblende-bearing quartz diorite (plutonic rock)
Medium- to coarse-grained quartz monzonite (plutonic rock)
Talk
eetn
aF
orm
atio
n A
lask
a-A
leut
ian
Ran
ges
bath
olith
Reverse or thrust fault, teeth on upthrown side
Other faults, dashed where approximately located, dotted where concealed. U on upthrown side, D on downthrown side.
Contact of geologic unit, dashed where approximately located or indefinite
27Strike and dip in degrees of bedded rocks
Qal, Qo, Qgt etc: unconsolidated, mainly sand and gravel deposits of streams, mass movements, and glaciers; details not relevent to this study
Tria
ssic
Low
er J
uras
sic
Mid
dle
Jura
ssic
and
youn
ger
Qua
tern
ary
Trm
Jtkm
Jtkp
Jtkh
Jqd
Jqm
Explanation for the base geology map of the Johnson River area, Alaska (Detterman and Hartsock, 1966). Base used in Figures 4 and 5.
Note: Line weights shown as on enlarged base for Figure 5 .
pended-sediment. The field-collection and processing equipment used was made from Teflon, glass, or stainless steel to prevent sample contamination and to minimize ana-lyte losses through adsorption. All sampling equipment was cleaned prior to use with a non-phosphate laboratory deter-gent, rinsed with distilled water, and rinsed with stream water just prior to sample collection. Depth-integrated water samples were collected across the river by using the equal-width-increment method (Edwards and Glysson, 1988) and processed onsite using methods and equipment
described by Shelton (1994). Samples for organic-carbon analysis were collected separately by dipping a baked glass bottle in the centroid of flow. Samples to be analyzed for dissolved constituents were filtered either onsite or at the USGS office in Anchorage through 0.45 -um capsule filters. Water samples were sent to the USGS National Water-Qual-ity Laboratory in Lakewood, Colorado, for analysis using standard USGS analytical methods (Fishman and Friedman, 1989; Patton and Truitt, 1992; Fishman, 1993). Suspended-sediment samples were sent to the USGS Sediment Analy-
7
Table 2. Water-quality and discharge measurement sites in the Johnson River study area.
Site identifier1
(figure 3)
1The Cook Inlet NAWQA study unit established a uniform numbering system for all surface water sites in the study basin. For a complete list of stations and numbers see http://alaska.usgs.gov/projects/Nawqa/water.sites.htm
Latitude/longitude or USGS station number
Sampling site Drainage area (mi2)
52 15294700 Johnson River above Lateral Glacier near Tuxedni Bay 24.8
110 60o08’26” 152o55’44” Kona Creek 3 miles above mouth near Tuxedni Bay 2.3
111 60o08’03” 152o55’24” Kona Creek 2.5 miles above mouth near Tuxedni Bay 2.7
112 60o06’35” 152o55’09” Kona Creek tributary above Lateral Glacier near Tuxedni Bay 0.2
113 60o06’36” 152o55’14” Kona Creek 0.8 miles above mouth near Tuxedni Bay 5.5
114 60o07’39” 152o57’07” Unnamed Spring
115 60o07’15” 152o57’28” East Fork Ore Creek near mouth near Tuxedni Bay 0.5
116 60o07’13” 152o57’40” North Fork Ore Creek near mouth near Tuxedni Bay 0.5
117 60o06’58” 152o58’14” Ore Creek near mouth near Tuxedni Bay 1.1
118 60o06’09” 152o56’11” Johnson River tributary above Lateral Glacier near Tuxedni Bay 0.1
sis Laboratory in Vancouver, Washington, for concentration and particle size analysis.
Streambed sediments were sampled at the gaging site and at the sites near the Johnson River Prospect. At each site, sediments were collected from the surface of the stre-ambed at several depositional areas using Teflon tubes or Teflon coated spoons and composited in glass bowls (Shelton and Capel, 1994). This ‘composite sample’ was then sieved through a 0.063-mm Nylon sieve and analyzed for trace elements. About 250 mL of stream water was used for sieving the trace-element sample. Water included in the trace elements was decanted after very fine-grained sedi-ments had settled. Arbogast (1990) describes laboratory procedures for processing streambed sediment samples for trace element analysis.
Since mining has yet to occur in the study area, there are no mined rock piles that could be studied to determine their neutralizing capacity or acid-generating capacity. Instead, eleven of the rock samples, representing different suites of minerals, were analyzed by acid-base accounting (ABA) techniques. ABA is a method developed in the 1960’s and 1970’s (Sobek and others, 1978) and is based on the assumption that drainage chemistry is a net result of reacting minerals and that the minerals that last longest and react fastest will determine long-term and overall chemistry. Samples were crushed, then soaked in strong acid to deter-mine neutralizing capacity and analyzed for sulfur content to determine acid-generating capacity. In reality, the fastest reacting minerals often do not last long and thus affect only short-term chemistry. ABA simplifies this complexity to predict the outcome as “acidic”, “near-neutral”, or “alka-
line” drainage based primarily on mineral balance (Morin and Hutt, 1997).
After the data were collected, checked, and compiled, data analysis was undertaken. Geologic data collected dur-ing 2000 were used to update the original Detterman and Hartsock (1966) map, and to determine the chemical com-position of the Johnson River Prospect. Analyses of the rock samples were compared to the water-quality data to deter-mine the effects of geology on water quality. Water quality changes were examined in a downstream direction from Ore Creek and Kona Creek to the Johnson River streamgage for dilution effects. Flow statistics from the Johnson River streamgage were analyzed and compared to flow values from the small tributaries near the Johnson River Prospect to determine their relative contribution to the total streamflow. ABA tests determined whether a particular rock type would be acidic or alkaline.
BEDROCK GEOLOGY OF THE JOHNSON RIVER STUDY AREA
Geologic Setting
The study area is part of the Peninsular Terrain, which is thought to have attached to mainland Alaska by the end of the Cretaceous Period 55-65 million years ago (Hillhouse and Coe, 1994). Late Paleozoic and Triassic, marine sedi-mentary and volcanic rocks are the oldest known rocks of the terrain. Although not well exposed in the vicinity of Johnson River (fig. 4), these Paleozoic and Triassic rocks crop out to the south of the study area where limestone, chert, and greenstone (metamorphosed oceanic basalt flows) were described by Detterman and Reed (1980).
8
These rocks are overlain by deposits of a major oceanic vol-canic arc, the Talkeetna Formation of Lower to Middle Jurassic age (Detterman and Harstock, 1966, Detterman and Reed, 1980). Two major rocks units are exposed in the Johnson River study area: the Lower-to-Middle Jurassic Tal-keetna Formation, and the Middle Jurassic and younger intrusive rocks of the Alaska-Aleutian Ranges batholith.
A major regional fault on the Alaska Peninsula, the Bruin Bay fault, trends north to south through the study area (fig. 4). The Bruin Bay fault is a thrust fault of vertical offset to the west and may also have had some left-lateral offset. The close succession of the intrusions to the volcanic-arc activity is interpreted (Reed and Lanphere, 1969 and 1973) to mean that the Jurassic part of the batholith is probably the intrusive equivalent of the Talkeetna Formation volcanic rocks, the geologically slightly younger ages reflecting slower cooling of the intrusions. Rather than a single fault, Detterman and Hartsock (1966) show multiple individual fault strands.
Modifications to the Geologic Map
Based on our 2000 field work, the Detterman and Hart-sock (1966) geologic map was modified to show an intrusive body between Kona Creek and Ore Creek (fig. 5). The mod-ified geologic map (fig. 5) shows other outlying domes that are separate from the main dome at the ground surface, but that may connect in the subsurface to the main body. Both Steefel (1987) and Gray (1988) refer to this body as “dacite” (intermediate-silica, fine-grained volcanic rock); although the two analyzed samples (R117-A and 10P-A) are low-sil-ica dacite and low-silica rhyolite (table 3). A second modi-fication to the Detterman and Hartsock (1966) map was the removal of the unit Trm (Triassic metamorphic rocks) that straddles Kona Creek at the Bruin Bay fault. Rocks exam-ined at three stations (11P, R112, and R113, fig. 4) where Detterman and Hartsock (1966) mapped this unit could not be distinguished from typical Talkeetna Formation.
FLOW AND WATER-QUALITY CHARACTERISTICS OF THE JOHNSON RIVER
The following section is intended to provide background on the flow and water-quality characteristics of the Johnson River study area. Water-quality data dealing with the geochemistry of the Johnson River are provided in a later section of the report.
Discharge
Continuous discharge records for May through October are available from the streamgage at the Johnson River (sta-tion ID 15294700, site number 52, fig. 3) from 1995 through 2002 (URL: http://ak.waterdata.usgs.gov/nwis). Discharge records are not available during the winter due to logistical considerations. However, since the Johnson River is a gla-cial-fed river, flow is probably close to or equal to 0 ft3/s during this period. The available flow records at the Johnson River indicate that daily discharge has ranged from 1.5 ft3/s to 5,020 ft3/s (fig. 6). High flows occur in late June or early July due to snowmelt. Ice melt from Johnson Glacier and Double Glacier sustain the flow during July and August. High flows may also occur during the summer due to rain-fall. Based on a per unit runoff basis, runoff can ranged from 0 ft3/s/mi2 to 202 ft3/s/mi2. Monthly average discharge from May through October for 1995 to 2002 ranged from 183 ft3/s in May to 719 ft3/s in July (fig. 7). The highest instan-taneous peak discharge for this period was 8,800 ft3/s.
During late July 2000, measured discharge at the selected sites ranged from 0.04 ft3/s to 123 ft3/s (table 4). Discharges measured on July 24 at Ore Creek and Kona Creek were 24 ft3/s and 123 ft3/s, respectively. Based on the concurrent flow at the Johnson River streamgage, 603 ft3/s, the flows at Ore Creek and Kona Creek represent 4 percent and 20 percent respectively, of the total flow measured at the streamgage. The remaining flow is derived from Johnson Glacier and Double Glacier. Flow conditions at this time probably represented average flow and the flows were not affected by rainfall or snowmelt. Depending on flow condi-tions, the relative contributions could change.
Specific Conductance
Specific conductance is determined by the type and con-centration of ions in solution. It is a readily measured prop-erty that can be used to indicate the dissolved-solids or ion content in water. Values of conductance ranged from 32 to 105 µs/cm at the Johnson River streamgage (table 5). Higher values of specific conductance were measured at the lowest discharge, usually in May, reflecting contributions from groundwater or snowmelt. As discharges increase due to snow and ice melt, values of conductance were lower than the May values. In September, when there is no discharge from ice or snowmelt, values of conductance increased.
At the sites visited in 2000, conductance values showed some variation (table 4). Values measured at the two sites on Kona Creek above Kona Creek tributary ranged from 22- 26 µs/cm. The water from Kona Creek tributary (conductance
9
10
152o55'153o
60o
07'
60o
09'
EXPLANATION
Dacite dome; margins approximate
Talkeetna Formation, undifferentiated
Photointerpreted Features:
Physiographic lineaments
Prominent gossan
Johnson RiverProspect
Figure 5. Geology of the study area (modified from Detterman and Hartsock, 1966).
Kona Creek
Ore Creek
ProspectGossan
KonaGossan
JohnsonGossan
0 1 2 3 MILES
0 1 2 3 KILOMETERS
CONTOUR INTERVAL 100 FEETDATUM IS MEAN SEA LEVEL
11
Tabl
e 3.
Maj
or e
lem
ents
as
oxid
es in
per
cent
of
John
son
Riv
er r
ock
sam
ples
.
[Ana
lyse
s by
US
GS
Den
ver
labo
rato
ry. A
ll b
y x-
ray
fluo
resc
ence
(Ta
ggar
t and
oth
ers,
198
7) e
xcep
t FeO
by
titr
atio
n (J
acks
on a
nd o
ther
s, 1
987)
, val
ues
show
n ar
e in
per
cent
]
Sit
e id
enti
fier
(f
igur
e 4)
Sam
ple
Des
crip
tion
Lat
itud
eL
ongi
tude
Al 2
O3
CaO
Fe 2
O3
FeO
K
2OM
gOM
nON
a 2O
P2O
5T
iO2
SiO
2C
O2
H2O
+H
2O-
Tota
lS
iO2
(n
orm
aliz
ed,
vola
tile
-fre
e)
K20
+ N
a 2O
(v
olat
ile-
free
)
R10
5-A
fine
gra
ined
di
orit
e or
ho
rnfe
ls
60°0
7′31
″15
2°57
′53″
19.2
9.93
6.53
6.61
0.18
4.51
0.22
2.93
0.26
1.11
48.1
00.
90.
110
0.58
48.3
3.12
R10
9pi
llow
lava
fl
ow60
°07′
43″
152°
54′2
7″19
.511
.73.
365.
270.
094.
830.
161.
590.
150.
6549
.70.
081.
40.
999
.38
51.2
1.73
R11
1-B
2la
va f
low
w
ithi
n
tuff
-bre
ccia
60°0
8′22
″15
2°55
′40″
17.8
5.75
3.99
5.65
0.57
5.47
0.26
4.37
0.16
0.68
48.2
2.19
4.1
0.5
99.6
951
.95.
32
R11
7-A
daci
te p
lug
60°0
7′00
″15
2°55
′19″
164.
422.
582.
891.
333.
50.
033.
230.
210.
659
.80.
025.
20.
510
0.31
63.2
4.82
1P-A
gran
odio
rite
60°0
7′00
″15
2°57
′58″
12.2
2.44
0.86
0.64
1.14
0.4
0.04
3.64
0.13
0.18
77.4
00.
50.
199
.67
78.1
4.83
3P-B
lava
flo
w60
°07′
42″
152°
56′5
3″12
.22.
111.
494.
750.
392.
020.
193.
370.
160.
669
.21.
42.
60.
110
0.58
71.7
3.90
4P-A
gran
odio
rite
w
/ pyr
ite
60°0
7′30
″15
2°58
′37″
15.4
5.26
2.38
1.99
0.29
1.19
0.08
3.22
0.2
0.42
67.9
00.
70.
199
.13
69.1
3.57
4P-B
gran
odio
rite
60°0
7′30
″15
2°58
′37″
12.5
7.54
5.15
7.32
0.29
5.89
0.23
1.73
0.23
1.08
57.3
01.
30.
110
0.66
----
6P-G
maf
ic
gran
odio
rite
60°0
8 ′02
″15
2°56
′48″
16.5
7.38
2.69
4.94
0.55
3.81
0.16
2.97
0.24
0.76
580
1.4
0.1
99.5
59.2
3.59
6P-H
fels
ic
gran
odio
rite
60°0
8′02
″15
2°56
′48″
16.6
8.67
4.68
5.2
0.51
5.3
0.2
2.6
0.18
0.77
52.9
01.
50.
199
.21
54.2
3.19
9P-J
lava
flo
w60
°07′
28″
152°
54′0
4″19
.611
.54.
324.
940.
284.
470.
151.
790.
170.
7149
.10.
471.
60.
910
050
.62.
13
10P
-Ada
cite
plu
g60
°08′
05″
152°
53′3
9″13
.61.
153.
020.
963.
342.
110.
043.
830.
160.
4468
0.46
1.8
0.3
99.2
170
.47.
42
10P
-Em
afic
dik
e60
°08′
05″
152°
53′5
7″19
.611
6.09
3.4
0.17
5.26
0.16
1.79
0.17
0.73
46.9
0.16
2.3
1.5
99.2
349
.22.
06
14P
-Dm
afic
dik
e60
°08′
34″
152°
54′5
6″17
.64.
083.
794.
491.
324.
560.
163.
560.
20.
6954
.40.
553.
50.
499
.357
.45.
14
Figure 6. Discharge hydrograph of the Johnson River above Lateral Glacier near Tuxendi Bay, Alaska, 1995-2002.
1
2
5
10
20
50
100
200
500
1000
2000
5000
8000
ME
AN
DA
ILY
DIS
CH
AR
GE
, IN
CU
BIC
FE
ET
PE
R S
EC
ON
D
Oct14 28
Nov14 28
Dec14 28
Jan14 28
Feb14 28
Mar14 28
Apr14 28
May14 28
Jun14 28
Jul14 28
Aug14 28
Sep14 28
No Record
Maximum daily dischargeAverage daily dischargeMinimum daily discharge
Figure 7. Average monthly discharge for the Johnson River above Lateral Glacier near Tuxedni Bay, 1995-2002.
AV
ER
AG
E M
ON
TH
LY D
ISC
HA
RG
E,
IN C
UB
IC F
EE
T P
ER
SE
CO
ND
100
500
1000
JOHNSON RIVER ABOVE LATERAL GLACIER NEAR TUXEDNI BAY
O N D J F M A M J J A S
No Record
of 111 µs/cm) elevated the conductance at the site near the mouth of Kona Creek (40 µs/cm). At the Ore Creek sites, values of conductance were consistent and ranged from 78-80 µs/cm. The highest conductance value measured was
12
from the unnamed spring in the North Fork Ore Creek watershed (227µs/cm).
pH
The pH of water is a measure of its hydrogen-ion activity and can range from less than zero (very acidic) to 14 (very alkaline) standard units. The pH of river water not affected by contamination is typically between 6.5 and 8.0 standard units (Hem, 1985) and for fish growth and survival, the pH should remain in the 6.5 - 9.0 standard unit range. Values of pH at the Johnson River streamgage ranged from 6.9 to 7.9 for the period of sampling. Similar values were found at the other sites measured in 2000. (tables 4-5).
Water Temperature
Water temperature determines the amount of oxygen water can contain when at equilibrium with the atmosphere and it also controls the metabolic rates of fish and their rates of growth. Ranges in water temperature at the Johnson River were highly seasonal (tables 4-5). Measured water temperatures were the coldest in May (0.0 oC, 0.2 oC, and
13
Tab
le 4
. Dis
char
ge a
nd p
hysi
cal p
rope
rtie
s m
easu
red
at s
elec
ted
site
s in
the
John
son
Riv
er s
tudy
are
a.
[ft3 /s
, cub
ic f
eet p
er s
econ
d, u
s/cm
, mic
rosi
emen
s pe
r ce
ntim
eter
at 2
5 de
gree
s C
elsi
us]
Site
iden
tifi
er
(fig
ure
3)St
atio
n N
ame
Dat
eD
isch
arge
(f
t3 /s)
Spe
cifi
c C
ondu
ctan
ce (
µs/c
m)
Dis
solv
ed O
xyge
n (m
g/L
)W
ater
Tem
pera
ture
(o C
)pH
(s
tand
ard
unit
s)A
lkal
inity
(m
g/L
as
CaC
O3)
110
Kon
a C
reek
3 m
iles
abov
e m
outh
7-26
5626
13.0
2.0
6.7
5
111
Kon
a C
reek
2.5
mile
s ab
ove
mou
th7-
2667
2213
.03.
47.
46
112
Kon
a C
reek
trib
utar
y7-
272.
311
113
.04.
57.
232
113
Kon
a C
reek
0.8
mile
s ab
ove
mou
th7-
2412
340
12.8
3.9
7.5
9
115
Eas
t For
k O
re C
reek
nea
r m
outh
7-25
1680
13.2
2.6
6.8
6
116
Nor
th F
ork
Ore
Cre
ek n
ear
mou
th7-
257.
878
13.1
3.1
7.5
29
117
Ore
Cre
ek n
ear
mou
th7-
2424
7813
.33.
57.
218
118
John
son
Riv
er tr
ibut
ary
7-27
0.04
4610
.09.
87.
316
114
Unn
amed
Spr
ing
7-25
--22
7--
4.8
7.9
95
Tabl
e 5.
Dis
char
ge, p
hysi
cal p
rope
rtie
s, a
nd s
uspe
nded
sed
imen
t mea
sure
d at
Joh
nson
Riv
er a
bove
Lat
eral
Gla
cier
nea
r T
uxed
ni B
ay, A
lask
a (s
ite 5
2).
[ft
3 /s, c
ubic
fee
t per
sec
ond;
ft3 /s
/mi2 , c
ubic
fee
t per
sec
ond
per
squa
re m
ile;
mg/
L, m
illi
gram
s pe
r li
ter;
o C, d
egre
e C
elsi
us;]
Dat
eD
isch
arge
(ft
3 /s)
Uni
t Dis
char
ge
(ft3 /s
/mi2 )
Spe
cifi
c C
ondu
ctan
ce
(us/
cm)
Dis
solv
ed O
xyge
n (m
g/L
)W
ater
Tem
pera
ture
(o C
)pH
(s
tand
ard
unit
s)A
lkal
inity
(m
g/L
as
CaC
O3)
Sus
pend
ed s
edim
ent
(mg/
L)
5-17
-99
20.0
0.8
6913
.70.
07.
115
5
6-10
-99
602
24.3
5713
.12.
57.
616
174
6-30
-99
580
23.4
45--
6.0
7.6
1464
7-21
-99
627
25.3
3713
.25.
07.
8--
72
8-6-
9924
6099
.232
12.0
3.0
7.9
1288
2
8-24
-99
521
21.0
4111
.96.
77.
012
33
9-16
-99
451
18.2
5514
.22.
87.
115
13
10-7
-99
200
8.1
7812
.74.
37.
521
2
5-9-
0045
.01.
810
515
.20.
27.
215
13
6-15
-00
497
20.0
6415
.32.
17.
014
22
7-26
-00
603
24.3
4213
.23.
07.
112
47
8-16
-00
439
17.7
4213
.63.
87.
213
60
9-18
-00
89.0
3.6
8712
.42.
27.
519
4
5-23
-01
174
7.0
9314
.21.
27.
218
25
6-26
-01
1220
49.2
4512
.82.
57.
212
118
8-1-
0182
733
.338
12.9
5.8
7.1
1075
9-3-
0169
327
.946
11.5
4.3
7.2
1216
9-27
-01
280
11.3
5813
.33.
36.
914
5
1.2 oC), reflecting the beginning of snowmelt. By June, water temperatures had risen to 2.0 oC or higher. From June, temperatures varied, ranging from 3.0 oC to 6.7 oC. By mid-to-late September, water temperatures had cooled to 3.3 oC or lower.
At other sites visited in the summer of 2000, water tem-peratures ranged from 2.0 to 9.8 oC (table 4). The highest water temperatures were found at the unnamed spring, and at tributaries to Kona Creek and the Johnson River (site numbers 112 and 118). Since discharge was relatively low at these two sites, water temperature was likely influenced by air temperature. Water temperature at the sites on Kona Creek and Ore Creek was similar to the water temperature at the Johnson River gage.
Dissolved Oxygen
The dissolved-oxygen concentration in a stream is con-trolled by several factors, including water temperature, air temperature and pressure, hydraulic characteristics of the stream, photosynthetic or respiratory activity of stream biota, and the quantity of organic matter present. Salmon and other fish require well-oxygenated water at every stage in their life, but young fish are more susceptible to oxygen deficiencies than adult fish. Dissolved oxygen concentra-tions at the Johnson River ranged from 11.9 to 15.3 mg/L. and from 10.0 to 13.3 mg/L at other sites visited in the sum-mer of 2000 (tables 4-5). Measured concentrations of dis-solved oxygen were sufficient to support fish.
Alkalinity
Alkalinity is a measure of the capacity of the substances dissolved in water to neutralize acid. In most natural waters, alkalinity is produced mainly by bicarbonate and carbonate (Hem, 1985), which are ions formed when carbon dioxide or carbonate rocks dissolve in water. Alkalinity concentrations (reported as equivalent concentrations of calcium carbonate (CaCO3)) for the Johnson River ranged from 12 to 21 mg/L (table 5). These alkalinity concentrations indicate that water in the Johnson River has a low buffering capacity and lim-ited availability of inorganic carbon (Hem, 1985). Also, given the range of pH values of the Johnson River, all of the alkalinity can be assigned to dissolved bicarbonate (Hem, 1985).
At the sites visited in the summer of 2000, alkalinity con-centrations ranged from 5 mg/L to 95 mg/L (table 4). Sites in the Kona Creek Basin had relatively low alkalinity (less than 10 mg/L) while the small tributary to Kona Creek,
North Fork Ore Creek, and the unnamed spring had rela-tively high values of alkalinity (29 mg/L).
Nutrients
In aquatic ecosystems, nitrogen commonly occurs in the following forms: nitrate (NO3), nitrite (NO2), and ammo-nium (NH4). In the laboratory, ammonium is analyzed as ammonia (NH3); thus nitrogen concentrations are reported as total and dissolved ammonia plus organic nitrogen (often called Kjeldahl nitrogen), dissolved ammonia, dissolved nitrite plus nitrate, and dissolved nitrite. Nitrite readily oxi-dizes to nitrate in natural water; therefore nitrate is generally more abundant than nitrite in water bodies. Total ammonia plus organic nitrogen concentrations represent the ammo-nium and organic nitrogen compounds in solution and asso-ciated with colloidal material. Nitrite and nitrate are oxidized forms of inorganic nitrogen that together make up most of the dissolved nitrogen in well-aerated streams.
All concentrations of the various nitrogen forms were less than 1.0 mg/L (table 6). Due to its toxicity to freshwater aquatic life, the U.S. Environmental Protection Agency (USEPA, 1976) suggests a limitation of 0.02 mg/L of ammonia (as un-ionized ammonia, NH3) for waters to be suitable for fish propagation. Based on the values of pH, water temperature, and ammonia in the Johnson River (table 5) the un-ionized ammonia, was calculated as 0.2 percent of dissolved ammonia (interpolated from table 3, United States Environmental Protection Agency, 1976, p. 11). Thus, even at the maximum concentration of dissolved ammonia (0.056 mg/L), the concentration of un-ionized ammonia is well below the recommended criteria for fish propagation.
Phosphorus is an essential element in the growth of plants and animals. It occurs as organically bound phospho-rus or as phosphate. High concentrations of phosphorus in water are not considered to be toxic to human or aquatic life. However, its presence can stimulate the growth of algae in lakes and streams. It was first noted by Sawyer (1947) that nuisance algal conditions could be expected in lakes when concentrations of inorganic nitrogen (NH3 + NO2 + NO3 as N) as low as 0.3 mg/L are present in conjunction with as much as 0.01 mg/L of phosphorus.
Phosphorus concentrations are reported as total phos-phorus, dissolved phosphorus, and dissolved orthophos-phate. The orthophosphate ion, PO4, is the most important form of phosphorus because it is directly available for met-abolic use by aquatic plants. Concentrations of total phos-phorus and dissolved phosphorus were less than 0.6 mg/L for all samples collected at the Johnson River (table 6).
14
15
Tab
le 6
. Nut
rien
t and
org
anic
car
bon
conc
entr
atio
ns m
easu
red
in 1
8 w
ater
sam
ples
col
lect
ed f
rom
Joh
nson
Riv
er a
bove
Lat
eral
Gla
cier
nea
r T
uxed
ni B
ay, A
lask
a (s
ite
52).
[all
val
ues
in m
g/L
; NO
2 +
NO
3, n
itri
te p
lus
nitr
ate,
E, e
stim
ated
, <, l
ess
than
].
Dat
eN
itro
gen
nitr
ite,
di
ssol
ved
Nitr
ogen
N
O2
+ N
O3,
diss
olve
d
Nitr
ogen
am
mon
ia,
diss
olve
d
Nitr
ogen
am
mon
ia +
or
gani
c, to
tal
Nitr
ogen
am
mon
ia +
or
gani
c,
diss
olve
d
Phos
phor
us,
tota
lP
hosp
horu
s,
diss
olve
dPh
osph
orus
or
tho,
dis
solv
ed
Org
anic
ca
rbon
, di
ssol
ved
Org
anic
ca
rbon
, pa
rtic
ulat
e
5-17
-99
0.00
10.
300
0.00
4E
0.09
<0.
100.
006
<0.
004
0.00
20.
30<
0.20
6-10
-99
0.00
10.
130
0.00
3<
0.10
<0.
100.
089
<0.
004
0.00
10.
20<
0.20
6-30
-99
0.00
10.
048
0.00
3<
0.10
E0.
060.
045
<0.
004
0.00
3<
0.10
<0.
20
7-21
-99
0.00
10.
014
<0.
002
0.11
0.15
0.05
8<
0.00
40.
001
0.30
0.20
8-6-
990.
001
0.03
10.
002
0.11
E0.
050.
594
<0.
004
0.00
10.
20<
0.20
8-24
-99
<0.
001
0.02
30.
005
0.12
E0.
050.
021
<0.
004
<0.
001
0.20
<0.
20
9-16
-99
<0.
001
0.03
00.
007
<0.
10<
0.10
0.01
6<
0.00
4<
0.00
10.
39<
0.20
10-7
-99
<0.
001
0.07
6<
0.00
2E
0.07
E0.
05E
0.00
4<
0.00
60.
008
0.36
<0.
20
5-9-
000.
001
0.30
2<
0.00
2E
0.09
<0.
100.
038
<0.
006
<0.
001
0.90
<0.
20
6-15
-00
<0.
001
0.16
00.
056
<0.
10E
0.05
0.01
3<
0.00
6<
0.00
1<
0.33
<0.
20
7-26
-00
0.00
10.
032
<0.
002
<0.
10<
0.10
0.03
2<
0.00
60.
002
<0.
33<
0.20
8-16
-00
0.00
10.
047
0.01
1<
0.10
<0.
100.
029
<0.
006
0.00
3<
0.33
<0.
20
9-18
-00
<0.
001
0.03
00.
004
<0.
10<
0.10
<0.
008
E0.
003
<0.
001
E0.
24<
0.20
5-23
-01
<0.
001
0.18
1<
0.00
2<
0.08
<0.
100.
017
<0.
006
<0.
007
E0.
190.
10
6-26
-01
<0.
001
0.07
90.
002
E0.
06<
0.10
0.05
9<
0.00
6<
0.00
7<
0.30
0.30
8-1-
01<
0.00
10.
025
<0.
002
<0.
08<
0.10
0.04
2<
0.00
6<
0.00
7<
0.30
0.40
9-3-
01<
0.00
1E
0.02
3E
0.00
5<
0.08
E0.
060.
012
<0.
006
<0.
007
<0.
300.
10
9-27
-01
0.00
10.
024
0.00
2<
0.08
<0.
100.
006
<0.
006
<0.
007
<0.
30<
0.10
50 100 500 1000 3000
2.5
5.0
7.5
25
50
75
250
500
750
10
INS
TA
NT
AN
EO
US
SU
SP
EN
DE
D S
ED
IME
NT
, IN
MIL
LIG
RA
MS
PE
R L
ITE
R
INSTANTANEOUS DISCHARGE, IN CUBIC FEET PER SECOND
Figure 8. Relation between instantaneous discharge and instantaneous suspended sediment for the Johnson River above Lateral Glacier near Tuxedni Bay, Alaska, 1999-2001.
(Gabbro or Diorite)
Alaska-Aleutian Ranges batholith
Talkeetna Formation
Dacite dome Tuff or lava flow
Dike Average of 7 tuffs (Steefel, 1987)
SiO2
40 50 60 70 80weight percent
(Na 2
O +
K2O
) w
eigh
t per
cent
10
8
6
4
2
Dacite
Rhyolite
Basalt
And
esite
Basaltic andesite
EXPLANATION
Alkalic Types
(Quartz and Diorite)
(Gabbro or Diorite)
(Ton
alite
)
(Granodiorite)
(Granite)
Figure 9. Classification of chemically analyzed samples of the Talkeetna Formation and of the Alaska-Aleutian Ranges batholith (Names of coarse-grained equivalentsgiven in parenthesis).
Organic Carbon
Dissolved organic carbon (DOC) is commonly a major pool of organic matter in ecosystems. DOC is defined as organic carbon in the filtrate (dissolved and colloidal phases) that has passed through a 0.45 -µm pore-size filter. Generally, DOC is in greater abundance than particulate organic carbon (POC), accounting for approximately 90 percent of the total organic carbon of most waters (Aiken and Cotsaris, 1995). In the aquatic system, the sources of DOC can be categorized as (1) allochthonous - entering the system from a terrestrial source, and (2) autochthonous - being derived from biota (algae, bacteria, macrophytes) growing in the water body.
At the Johnson River, concentrations of DOC ranged from less than 0.10 mg/L to 0.90 mg/L. All POC concentra-tions were less than 1.0 mg/L (table 6). The relatively low concentrations of DOC are likely related to the lack of well developed soil within the study area.
Suspended sediment
Suspended-sediment concentrations of the Johnson River ranged from 2 mg/L to 882 mg/L (table 5). Low con-centrations of suspended sediment were usually noted at low flow or before snow melt begins. The Johnson River is relatively clear during these times. Greater suspended sedi-ment concentrations are present in the river during high flows. Suspended sediment concentrations show a good correlation (R = 0.74) with discharges greater than 200 ft3/s (fig. 8).
GEOCHEMISTRY AND WATER QUALITY OF THE STUDY AREA
Chemical Compositions and Classification of Rocks
Only one of the analyzed rock samples of the Talkeetna Formation is true andesite (fig. 9); most fall near the basalt-basaltic andesite boundary. The dome and its related tuffs and lava flows are low-silica dacite or low-silica rhyolite. Rock samples from the batholith range in silica content from basalt to rhyolite (fig. 9) and only two samples would be considered andesites. The older lava flows and tuffs are mafic (basaltic andesite) while the dome and equivalent tuffs--the youngest rocks and deposits of the Talkeetna arc—are the most silicic.
1
Mineralization at the Johnson River Prospect
The Johnson River Prospect is located within several square miles of orange-stained rocks, referred to as the Pros-pect and Kona gossans (fig. 5), developed in the Talkeetna Formation adjacent to and up to 2 mi east of the Bruin Bay
6
fault (fig. 5). Upper-plate plutonic rocks of the batholith immediately west of the Bruin Bay fault also show gossan colors (fig. 10). “Gossan” is iron oxide formed during weathering oxidation of pyrite (iron sulfide). Oxidation of sulfur forms acid, which in turn increases the solubility of metals in surface waters. The major implication of gossans to geologists is that gossan rock has undergone enrichment of sulfur and also metals. Mineralization is divided by Steefel (1987) into two stages: an early anhydrite-pyrite-sericite-chlorite-calcite stage, and a later stage during which quartz, gold, barite, and sulfides were added. Metal miner-als of the later stage--native gold, sphalerite, chalcopyrite, silver, and galena—are zoned with zinc and silver occurring near the top, followed next by a copper, gold, lead zone, and finally by a copper and pyrite zone.
Alteration at the Johnson River Prospect and Elsewhere in the Study Area
Alteration associated with the Johnson River Prospect mineralization and with the more extensive Prospect gossan is not easily identified in detail. Alteration minerals are typ-ically very fine, occur in trace amounts, and comprise sev-eral mineral groups that each vary widely in chemical composition and environmental implications. Sericitic alteration is characterized by quartz, pyrite, and sericite (a potassium mica) and typically occurs at veins which were pathways (fractures) for acidic fluids that added sulfur and removed alkalis from the altered rock (table 7).
Pyrite is a common crustal mineral and its significance is dependent on the other minerals present with it. At the Johnson River Prospect, pyrite provided the iron that was later oxidized to create the striking color gossan on both sides of the Bruin Bay fault. A gossan typically involves secondary permeability (fractures and faults), which allows for later incursion of oxygenated ground water. In the case of intensive gossans, iron was probably added to the origi-nal rock, potentially along with other metals of economic interest. The orange color means that much of the pyrite has already been oxidized and cannot further contribute to acid-ity. The uncertainty, however, is how much unoxidized pyrite remains beneath the oxidized rock surface, awaiting exposure by landslides or human activity. Sulfur content of the rocks is one measure of this potential. A number of ana-lyzed samples of the Talkeetna Formation were high in sul-fur (analyses available at USGS office). This supports the likelihood that unoxidized Talkeetna Formation rocks in the subsurface have moderate to high pyrite contents.
1
Discussion of Geochemical Data
Major-element analyses (table 3) provide a basis for classification of igneous rocks and have been previously dis-cussed. Rock samples analyzed for minor elements were grouped according to rock type and the averages for each rock category were calculated (data available at USGS office). Rock samples from the fault-fracture-controlled mineralization at the Johnson River Prospect contained high amounts of gold, mercury, silver, arsenic, cadmium, copper, molybdenum, lead, zinc, and selenium. These include the same metals (gold, silver, copper, lead and zinc) noted by Steefel (1987) and Gray (1988). Molybdenum is not men-tioned by Steefel, and it does not occur in significant concen-trations in our samples. Mercury and arsenic are associated worldwide in shallow hot-springs deposits or commonly occur in trace amounts together with cadmium and selenium in a variety of precious- and base-metal deposits, especially those formed as veins with quartz or calcite (Rose and oth-ers, 1979; Levinson, 1974). Johnson River Prospect samples are also elevated in carbon dioxide and sulfur, indicative of calcite, sulfides, or anhydrite dissolution.
Non-mineralized samples from the Talkeetna Formation were compared with those from the Prospect and Kona gos-sans. Gossan samples are generally much higher in mercury, arsenic, cadmium, and zinc, and slightly higher in copper, manganese, molybdenum, lead (one sample), and selenium. The gossan Talkeetna Formation is also higher in carbon dioxide and sulfur. This suite of elevated elements is essen-tially identical to that of the Johnson River Prospect, sug-gesting that the broad areas of the Kona gossan in the Talkeetna Formation to the north and east of the Prospect drainage were formed by similar processes, such as, a com-bination of magmatic heat, sulfur, and seawater convecting through permeable deposits above and adjacent to intrusives.
Sulfur content of gossan samples varies widely, reflect-ing both variable sulfur addition during mineralization as well as variable degree of oxidation of pyrite during subse-quent weathering and consequent loss of sulfur from the rock. In general, sulfur in the rock samples is not extremely high, and the highest values are found in rock samples imme-diately adjacent to the Johnson River Prospect (Prospect Gossan). Sulfur in this area may not occur as pyrite, but as anhydrite, in which sulfur is already in its most oxidized state. However, future disturbance of gossan areas such as natural landslides, faulting in earthquakes, or human activity could expose higher levels of sulfur assuming that unoxi-dized pyrite is more abundant beneath the present weather-ing zone.
7
18
Secondary veins (white) can be seen clearly cutting fault-breccia pieces of Talkeetna Formation (dark gray) at the Johnson River Prospect. Very little oxidation of sulfides has occurred as indicated by the lack of orange staining. This may be because the rock surface was only recently exposed and has not yet weathered, or because the secondary vein minerals are chiefly carbonates and silicates and do not include many sulfides.
A section of the vein system at the Johnson River Prospect, that has much greater abundance of oxidized metals, which yield the bright orange stain (rust and other hydrated iron oxides). The entire region of the prospect shows such orange staining (a "gossan"), indicating pervasive enrichment, though at lower levels than the prospect proper, in iron, sulfur, and other metals.
Figure 10. Photographs of the Johnson River Prospect gossan and secondary veins.
Table 7. Alteration minerals of the Johnson River Prospect and associated gossans in the nearby Talkeetna Formation and batholith (identi-fied by Gray, 1988).
Subtype Occurrence
Sericitic alteration: acidic fluids, addition of sulfur
Pyrite Low levels in Talkeetna Formation, including dacite dome; responsible for gossan
Quartz-sericitic-pyrite Veins/fractures in gossan areas of Talkeetna Formation; intensive at Johnson River Prospect where fault controlled
Anhydrite-chlorite-pyrite Intensive at Johnson River Prospect where fault controlled
Propylitic alteration: breakdown of plagioclase, addition of water and carbon dioxide
Chlorite-calcite (epidote) Pervasive and low levels throughout Talkeetna Formation
Zeolite Low levels, especially in porous silica-rich tuffs of Talkeetna Formation
Carbonate in the rocks provides the neutralizing capacity to affect the potential acidity generated by pyrite and sulfur. Calcite is the most soluble of the common carbonate miner-als and was detected frequently during the fieldwork by applying hydrochloric acid to rocks. Calcite found in batholith rocks is confined to minor fractures and is not abundant. Carbonate xenoliths in batholith rocks derived from Triassic or Permian limestones are known to occur in the geologic column elsewhere on the Alaska Peninsula, but none were identified during this study nor reported by Det-terman and Hartsock (1966). There is, however, an abundant amount of calcite in both lavas and volcaniclastic rocks of the Talkeetna Formation from the analyses of thin sections from the rock samples (analyses available at USGS office).
Discussion of Water-Quality Data
The water samples collected for this study have approx-imately the same anion and cation content (tables 8 and 9). At the Johnson River gage, calcium is the dominant cation while bicarbonate is the dominant anion (fig. 11). Samples from Kona Creek and Kona Creek tributary indicate the same type of cation/anion relation. In the Ore Creek Basin, there are differences that reflect the geology of the water-shed. Calcium is the dominant cation and sulfate is the dom-inant anion in East Fork Ore Creek, which drains the Johnson River Prospect (fig. 11). The high sulfate reflects the elevated amounts of sulfur found in the Johnson River Prospect. North Fork Ore Creek and the unnamed spring adjacent to the Johnson River Prospect, however, have char-acteristics similar to the Kona Creek and Johnson River gage sites - calcium is the dominant cation and bicarbonate the dominant anion (fig. 11), reflecting the relatively low amounts of sulfur found in rock samples from these areas. Water from the North Fork Ore Creek has a dilution affect on the water of East Fork Ore Creek, which is indicated by the approximately equal percentage of the anions sulfate and bicarbonate found at the mouth of Ore Creek.
Water samples from the Johnson River gage site were analyzed for 23 trace elements, both in the dissolved phase and total content (appendix 1). These samples cover a range of discharge (20 ft3/s to 2,460 ft3/s) for 1999-2001. Most of these same elements, though only in the dissolved phase, were analyzed from water samples collected from the sites visited during summer 2000 (table 10).
At the Johnson River gage site, concentrations of about one-half the trace elements analyzed were less than 5.0 µg/L (appendix 1). At the other sites sampled in 2000, concentra-tions of 9 trace elements were less than 1.0 µg/L (table 10). In comparing the concentrations of the trace elements to published or known values and with standards that have been established for the protection of aquatic life, concen-trations of all trace elements were within the normal ranges and did not exceed standards for protection of aquatic life (Smith and Huyck, 1999).
There were some notable characteristics of the trace ele-ment data from the water samples. The highest concentra-tions of several dissolved trace elements (aluminum, cadmium, copper, lead, manganese, and zinc) were found at East Fork Ore Creek, which drains the Johnson River Pros-pect, reflecting the mineralization of the basin. At Ore Creek, concentrations of these elements were lower, due to the dilution effect from North Fork Ore Creek. At the Johnson River gage site, concentrations of these elements were further diluted, reflecting the additional runoff from Johnson Glacier, Double Glacier, and Kona Creek. In addi-tion, three trace elements (total aluminum, total iron, and total manganese) showed a strong correlation with sus-pended sediment that suggest these three elements are adsorbed onto the sediment (fig. 12).
Streambed sediments of the Johnson River at the gage site and at seven other sites in the study area were collected and analyzed for 39 trace elements (appendix 2). The high-est concentrations of several trace elements (arsenic,
19
20
Johnson River
Kona Creek
Ore CreekJohnson River tributary
Unnamed Spring
East Fork
NorthFork
Ore
SULF
ATE
PLU
S C
HLO
RID
E
CA
LCIU
M P
LUS
MA
GN
ES
IUM
BIC
ARBO
NAT
E
SO
DIU
M P
LUS
PO
TAS
SIU
M
MAG
NES
IUM
CALCIUM
PERCENT
CHLORIDE, FLUORIDE, NITRITE PLUS NITRATE
SU
LFATE
PER
CEN
T
PE
RC
EN
TSU
LFAT
E PL
US
CH
LOR
IDE
CA
LCIU
M P
LUS
MA
GN
ES
IUM
BIC
ARBO
NAT
E
SO
DIU
M P
LUS
PO
TAS
SIU
M
MAG
NES
IUM
CALCIUM
PERCENT
CHLORIDE, FLUORIDE, NITRITE PLUS NITRATE
SU
LFATE
PER
CEN
T
PE
RC
EN
T0
20
40
60
80
100
0 20
40 60
80 100 10
0 80
60
40
20
0
100 80
60 40
20 0
0 20
40
60
80
100
100 80
60 40
20
0 100
80
60
40
20
0 100
80
60
40
20
0
0
20
40
60
80
100 0
20
40
60
80
100
0 20
40
60
80
10
0
0 20
40 60
80 100 10
0 80
60
40
20
0
100 80
60 40
20 0
0 20
40
60
80
100
100 80
60 40
20
0 100
80
60
40
20
0 100
80
60
40
20
0
0
20
40
60
80
100 0
20
40
60
80
100
Figure 11. Trilinear diagrams of water samples from the Johnson River Basin.
21
Tab
le 8
. Maj
or d
isso
lved
inor
gani
c co
nsti
tuen
ts m
easu
red
in 1
8 w
ater
sam
ples
col
lect
ed f
rom
Joh
nson
Riv
er a
bove
Lat
eral
Gla
cier
nea
r T
uxed
ni B
ay, A
lask
a (s
ite
52).
[all
val
ues
in m
g/L
, E, e
stim
ated
]
Dat
eC
alci
umM
agne
sium
Sodi
umPo
tass
ium
Bic
arbo
nate
Sul
fate
Chl
orid
eSi
lica
Dis
solv
edS
olid
s
5-17
-99
9.5
0.92
1.3
0.18
1812
.01.
04.
242
6-10
-99
8.1
0.73
0.9
0.27
178.
40.
73.
241
6-30
-99
6.8
0.62
0.8
0.30
166.
40.
52.
651
7-21
-99
5.3
0.43
0.6
0.22
--5.
20.
31.
827
8-6-
995.
40.
370.
50.
3512
3.7
<0.
11.
826
8-24
-99
6.6
0.52
0.7
0.29
155.
80.
32.
323
9-16
-99
7.8
0.64
0.8
0.28
188.
8<
0.3
2.7
34
10-7
-99
11.2
0.98
1.1
0.35
2613
.50.
64.
446
5-9-
0015
.01.
242.
5E
0.20
2617
.91.
75.
668
6-15
-00
8.6
0.80
1.1
0.32
189.
91.
43.
536
7-26
-00
5.9
0.52
0.7
0.27
165.
60.
62.
324
8-16
-00
6.5
1.23
0.7
0.40
176.
60.
52.
028
9-18
-00
12.0
0.90
1.3
0.46
2515
.60.
83.
850
5-23
-01
13.8
1.04
1.8
0.31
2317
.82.
04.
744
6-26
-01
6.4
0.58
0.9
0.27
165.
90.
72.
723
8-01
-01
5.3
0.45
0.6
0.40
135.
30.
52.
020
9-3-
016.
70.
540.
70.
2116
7.0
0.5
2.4
20
9-27
-01
8.7
0.72
0.9
0.24
1810
.80.
53.
234
Tab
le 9
. Maj
or d
isso
lved
inor
gani
c co
nstit
uent
s m
easu
red
in w
ater
sam
ples
col
lect
ed f
rom
site
s in
the
John
son
Riv
er s
tudy
are
a, J
uly
2000
.
[all
val
ues
in m
g/L
; E, e
stim
ated
]
Sit
e id
entif
ier
(fig
ure
3)Sa
mpl
ing
site
Cal
cium
Mag
nesi
umS
odiu
mPo
tass
ium
Bic
arbo
nate
Sul
fate
Chl
orid
eS
ilica
115
Eas
t For
k O
re C
reek
9.4
1.3
0.9
<0.
28
240.
83.
5
114
Unn
amed
Spr
ing
2912
1.6
0.3
124
145.
05.
1
116
Nor
th F
ork
Ore
Cre
ek8.
73.
21.
0<
0.2
385.
50.
53.
7
117
Ore
Cre
ek9.
92.
21.
0<
0.2
2317
0.6
3.9
118
John
son
Riv
er tr
ibut
ary
6.7
0.4
0.6
<0.
221
3.9
0.4
2.9
110
Kon
a C
reek
3 m
iles
abov
e m
outh
2.8
0.4
0.6
<0.
26
4.7
0.4
2.1
111
Kon
a C
reek
2.5
mil
es a
bove
mou
th2.
90.
41.
8<
0.2
84.
50.
52.
2
112
Kon
a C
reek
trib
utar
y19
0.9
1.0
0.4
4217
0.6
4.6
113
Kon
a C
reek
0.8
mil
es a
bove
mou
th4.
90.
60.
8<
0.2
125.
90.
82.
8
22
Tabl
e 10
. Dis
solv
ed tr
ace
elem
ent c
once
ntra
tion
s m
easu
red
in w
ater
sam
ples
col
lect
ed f
rom
sit
es in
the
John
son
Riv
er s
tudy
are
a, J
uly
2000
.
[all
val
ues
in u
g/L
; E, e
stim
ated
; M, p
rese
nce
veri
fied
, but
not
qan
tifi
ed]
Site
iden
tifi
er(f
igur
e 3)
Sam
plin
g si
teA
lum
inum
Ant
imon
yA
rsen
icB
ariu
mB
eryl
lium
Bor
onC
adm
ium
115
Eas
t For
k O
re C
reek
40<
1.0
<1
13<
1.0
<12
3.4
114
Unn
amed
Spr
ing
25<
1.0
345
<1.
057
<1.
0
116
Nor
th F
ork
Ore
Cre
ek24
<1.
01
23<
1.0
32<
1.0
117
Ore
Cre
ek47
<1.
0E
120
<1.
024
1.5
118
John
son
Riv
er tr
ibut
ary
27<1
.0<1
1.8
<1.
0E
7.3
<1.
0
110
Kon
a C
reek
3 m
iles
abov
e m
outh
28<1
.0<1
7.9
<1.
0E
8.6
<1.
0
111
Kon
a C
reek
2.5
mile
s ab
ove
mou
th24
<1.0
<19.
1<
1.0
E9.
0<
1.0
112
Kon
a C
reek
trib
utar
y5.
3<
1.0
<1
1.0
<1.
022
<1.
0
113
Kon
a C
reek
0.8
mile
s ab
ove
mou
th31
<1.0
<17.
3<
1.0
E8.
7<
1.0
Site
iden
tifi
er(f
igur
e 3)
Sam
plin
g si
teC
hrom
ium
Cob
alt
Cop
per
Iron
Lea
dL
ithi
umM
anga
nese
115
Eas
t For
k O
re C
reek
<0.
8<
1.0
1.6
<10
1.6
M28
114
Unn
amed
Spr
ing
<0.
8<
1.0
<1.
0<
10<
1.0
4<
1.0
116
Nor
th F
ork
Ore
Cre
ek<
0.8
<1.
0<
1.0
<10
<1.
01
<1.
0
117
Ore
Cre
ek<
0.8
<1.
0<
1.0
E6.
7<
1.0
114
118
John
son
Riv
er tr
ibut
ary
<0.
8<
1.0
<1.
0<
10<
1.0
M<
1.0
110
Kon
a C
reek
3 m
iles
abo
ve m
outh
<0.
8<
1.0
<1.
0<
10<
1.0
<1
1.6
111
Kon
a C
reek
2.5
mil
es a
bove
mou
th<
0.8
<1.
0<
1.0
<10
<1.
0<
11.
3
112
Kon
a C
reek
trib
utar
y<
0.8
<1.
0<
1.0
<10
<1.
0M
<1.
0
113
Kon
a C
reek
0.8
mil
es a
bove
mou
th<
0.8
<1.
0<
1.0
<10
<1.
0<
12.
0
Site
iden
tifi
er(f
igur
e 3)
Sam
plin
g si
teM
olyb
denu
mN
icke
lS
elen
ium
Silv
erSt
ront
ium
Tha
llium
Van
adiu
mZ
inc
115
Eas
t For
k O
re C
reek
<1.
0<
1.0
<1
<1.
039
<0.
9<
168
7
114
Unn
amed
Spr
ing
1.7
<1.
0<
1<
1.0
72<
0.9
<1
6.5
116
Nor
th F
ork
Ore
Cre
ek<
1.0
<1.
0<
1<
1.0
18<
0.9
<1
5.2
117
Ore
Cre
ek<
1.0
<1.
0<
1<
1.0
33<
0.9
<1
303
118
John
son
Riv
er tr
ibut
ary
<1.
0<
1.0
<1
<1.
07.
8<
0.9
<1
4.1
110
Kon
a C
reek
3 m
iles
abo
ve m
outh
<1.
0<
1.0
<1
<1.
08.
5<
0.9
<1
6.1
111
Kon
a C
reek
2.5
mil
es a
bove
mou
th<
1.0
<1.
0<
1<
1.0
9.1
<0.
9<
16.
1
112
Kon
a C
reek
trib
utar
y<
1.0
<1.
0<
1<
1.0
16<
0.9
<1
<1.
0
113
Kon
a C
reek
0.8
mil
es a
bove
mou
th<
1.0
<1.
0<
1<
1.0
10<
0.9
<1
9.0
Figure 12. Relation between (A) total aluminum, (B) total iron, and (C) total magnesium and suspended sediment at Johnson River above Lateral Glacier near Tuxedni Bay, Alaska.
SUSPENDED SEDIMENT, IN MILLIGRAMS PER LITER
TOTA
L M
AN
GA
NE
SE
, IN
MIC
RO
GR
AM
S P
ER
LIT
ER
2.5 7.5 25.0 50.0 250.0 750.06
10
50
100
500
C
200
500
1000
5000
10000
20000
200
1000
5000
10000
20000
30000TO
TAL
IRO
N, I
N M
ICR
OG
RA
MS
PE
R L
ITE
RTO
TAL
ALU
MIN
UM
, IN
MIC
RO
GR
AM
S P
ER
LIT
ER
B
A
barium, cadmium, copper, lead, selenium, and zinc) were found in East Ore Creek and to a lesser extent, Ore Creek, reflecting the mineralization of the Johnson River Prospect. Concentrations of these trace elements were substantially lower at the most downstream site of the study area, the Johnson River gage. This suggests that discharge from Kona Creek, Johnson Glacier, and Double Glacier transport fine sediment that mixes with the sediment from Ore Creek.
The focus in the literature on criteria for streambed sedi-ments has been limited to nine trace elements: arsenic, cad-
23
mium, chromium, copper, lead, mercury, nickel, selenium, and zinc. Trace-element concentrations in the streambed sediments were compared with those of previous studies (table 11). Gilliom and others (1998) determined national median concentrations (in micrograms per gram, dry weight) for these elements. As part of the NAWQA pro-gram, a NAWQA data base has been established where users may retrieve water-quality data from other NAWQA study units based on criteria such as land use. From this data base, trace element data for basins listed as “mined” were retrieved and the median concentration values determined. The Canadian Council of Ministers of the Environment (1999) has established guidelines for some trace elements in unsieved streambed sediment. These guidelines use two assessment values: a lower value, called the “interim fresh-water sediment quality guideline” (ISQG), is the concentration below which adverse effects are expected to occur rarely and the upper value, called the “probable effect level” (PEL), is the concentration above which adverse effects are expected to occur frequently. Because trace-ele-ment samples for the NAWQA program are from sediments finer than 0.063 mm where concentrations tend to be great-est, comparisons with the Canadian guidelines may overes-timate the effects on aquatic organisms (Deacon and Stephens, 1998). However, it was felt that the PEL would be useful for comparative purposes when applied to the finer than 0.063 mm size fraction sediment samples analyzed for this study.
MacDonald and others (2000) established sediment quality guidelines (SQGs) for seven trace elements and Van Derveer and Canton (1997) established guidelines for sele-nium. These guidelines use the following two concentra-tions for a given trace element: the threshold effect concentration (TEC) and the probable effect concentration (PEC) and assume a one-percent organic carbon concentra-tion. The TEC is the concentration below which sediment-dwelling organisms are unlikely to be adversely affected, and the PEC is the concentration above which toxicity is likely. In addition, MacDonald and others (2000) developed a Mean PEC Quotient (table 12) which is the toxicity of the combined trace element concentrations. This value is deter-mined by summing the concentrations of all the trace ele-ments analyzed and dividing by the number of elements. MacDonald and others found that sediments with mean PEC quotients of less than 0.5 accurately predicted the absence of toxicity in 83 percent of the samples they exam-ined. Mean PEC quotients greater than 0.5 accurately pre-dicted toxicity in 85 percent of the samples.
Comparison of the concentrations of the bed sediments of the nine trace elements with median values from Gilliom and others (1998) and the NAWQA data base
Table 11. Concentrations of selected trace elements in streambed sediments from various studies.
[values in micrograms per gram; --; no data]
Trace elementGilliom and
others (1998)1
1Median values
NAWQA database2
2 Median values among mined sites
Interim Freshwater Sediment Quality
Guideline (ISQG)3
3Canadian Council of Ministers of the Environment (1995)
Probable Effect Level3 (PEL)
Threshold Effect Concentration
(TEC)4
4MacDonald and others (2000)
Probable Effect Concentration
(PEC)4
East Fork Ore Creek
Ore Creek
Arsenic 6.4 13.0 5.9 17.0 9.8 33.0 64 44
Cadmium 0.4 0.9 0.6 3.5 0.99 5.0 4.3 4.6
Chromium 62 68.5 37.3 90 43.4 111 14 23
Copper 26 36 35.7 197 31.6 149 76 92
Lead 24 41.5 35.0 91.3 35.8 128 230 180
Mercury 0.06 0.08 0.17 0.49 0.18 1.06 0.93 0.28
Nickel 25 38 -- -- 22.7 48.6 4.0 8.0
Selenium 0.7 0.8 -- -- 52.5
5VanDerveer and Canton (1997)
54.0 2.6 1.2
Zinc 110 235 123 315 121 459 1000 1800
(http://water.usgs.gov/nawqa/data, accessed July, 2002) indicated that with the exception of chromium and nickel, concentrations of trace elements at East Fork Ore Creek and Ore Creek exceeded the median values (table 11). Concen-trations of arsenic, copper, and mercury from the Kona Creek sites and the Johnson River gage sites also exceeded these median values (tables 11). Concentrations of cad-mium, lead, and zinc from East Fork Ore Creek and Ore Creek exceeded the ISQG limits. PEL concentrations of arsenic, cadmium, lead, mercury, and zinc were exceeded only at East Fork Ore Creek and Ore Creek. There was some variation in TEC levels. TEC levels of arsenic and copper were exceeded at all sites and TEC levels of cadmium, lead, selenium, and zinc were exceeded only at East Fork Ore Creek and Ore Creek. Finally, only concentrations of arsenic, lead, and zinc at East Fork Ore Creek and Ore Creek exceeded the PEC (table 11).
Comparison of the concentrations of the trace elements with the percent organic carbon and PEC quotient offer some insights about the bioavailability of these elements (table 12). The highest concentration of organic carbon (1.30 percent) and the lowest PEC quotient (0.23) was found at Kona Creek Tributary. All other sites had organic carbon concentrations from 0.05 percent to 1.00 percent and PEC quotient values greater than 0.5, which would indicate some level of potential toxicity (table 12). As MacDonald and oth-ers (2000) noted, sites containing relatively low concentra-tions of organic carbon have higher potential toxicity.
As a preliminary survey of the neutralizing potential of Johnson River bedrock, 11 samples were submitted to an acid-base accounting (ABA) test. The samples (table 13) have low sulfur contents: 0.50 percent in a gossaned, sheared granodiorite and 0.58 percent in limey volcaniclas-tic sandstone from the upper part of the Talkeetna Formation were the only detectable abundances. Neutralizing potential ranged by two orders of magnitude, from 4 to 590. The high-est values were three tuff-breccia samples and a volcaniclas-tic sandstone (Talkeetna Formation) and the gossaned granodiorite sample that also had 0.58 percent sulfur. Such high values in Talkeetna Formation volcaniclastic rocks reflect secondary veins and vesicles of calcite (propylitic alteration) as well as clasts of limestone that were probably eroded from reefs growing in the vicinity of the volcanic arc.
As noted previously, ABA maximizes the reported neu-tralizing potential by crushing the sample so that the entire volume is exposed to the test acid. Field tests for this study indicated that stream cobbles had lost most of the calcite originally in the outer shell, and, unless broken open, had lit-tle or no reaction to acid. Thus, in the case of a natural or manmade exposure of unweathered sulfide-bearing rock, the effect on downstream acidity will depend on how much calcite is also exposed or if the existing calcite is crushed. If sulfide significantly outweighs calcite, then bed sediments in the adjacent drainage may not be effective in buffering the resulting acidity because they are now armored by a calcite-depleted shell.
24
25
Tab
le 1
2. C
once
ntra
tion
s of
trac
e el
emen
ts, p
erce
nt o
rgan
ic c
arbo
n, a
nd m
ean
PE
C q
uoti
ent f
or s
trea
mbe
d se
dim
ent a
t site
s lo
cate
d in
the
John
son
Riv
er s
tudy
are
a.
[val
ues
in m
icro
gram
s pe
r gr
am; b
old
indi
cate
s va
lues
exc
eeds
TE
C o
r PE
C w
hen
norm
aliz
ed f
or o
rgan
ic c
arbo
n co
nten
t or
valu
e ex
ceed
s 0.
5 fo
r PE
C q
uoti
ent]
Site
id
entif
ier
(fig
ure
3)S
ampl
ing
site
Ars
enic
Cad
miu
mC
hrom
ium
Cop
per
Lea
dM
ercu
ryN
icke
lS
elen
ium
Zin
c O
rgan
ic
Car
bon
(pe
rcen
t)
Mea
n PE
C
quot
ient
52Jo
hnso
n R
iver
abo
ve L
ater
al G
laci
er16
0.2
6675
40.
1317
0.3
130
0.05
6.02
110
Kon
a C
reek
3 m
iles
abo
ve m
outh
19<
0.1
3856
60.
7511
0.6
120
0.25
1.27
111
Kon
a C
reek
2.5
mile
s ab
ove
mou
th18
0.1
4257
50.
1611
0.6
140
0.26
0.98
112
Kon
a C
reek
trib
utar
y 18
<0.
177
474
0.10
250.
285
1.30
0.23
113
Kon
a C
reek
0.8
mile
s ab
ove
mou
th16
0.4
4863
170.
2814
0.7
150
0.49
0.62
115
Eas
t For
k O
re C
reek
644.
314
7623
00.
934
2.6
1,00
01.
000.
72
116
Nor
th F
ork
Ore
Cre
ek34
<0.
141
54<
10.
5315
0.2
120
0.16
2.21
117
Ore
Cre
ek44
4.6
2392
180
0.28
81.
21,
800
0.24
4.60
Tabl
e 13
. Res
ults
of
acid
bas
ed a
ccou
ntin
g te
sts
on 1
1 ro
ck s
ampl
es f
rom
the
John
son
Riv
er s
tudy
are
a.
[uni
ts f
or M
PA, N
P, a
nd N
NP
are
kil
ogra
ms
CaC
O3
per
met
ric
ton]
Sit
e lo
cati
on
(fig
ure
4)S
ampl
e id
enti
fier
Sam
ple
type
Sul
fate
(p
erce
nt S
)S
ulfu
r (p
erce
nt)
Sul
fur
(per
cent
tota
l)
Car
bon
diox
ide
(per
cent
)
Max
imum
pot
en-
tial a
cidi
ty
(MPA
)1
1 MP
A is
det
erm
ined
by
mul
tipl
ying
the
perc
ent t
otal
sul
fur
by 3
1.25
Neu
tral
izin
g po
tent
ial
(NP)
2
2 NP
is th
e ca
paci
ty to
neu
tral
ize
acid
ity
to p
H 6
.0
Net
neu
tral
izin
g po
tent
ial
(N
NP
)3
3 NN
P e
qual
s N
P -
MP
A
Rat
io (
NP/
MPA
)
R10
7B
Lav
a<
0.01
<0.
01<
0.01
0.8
144
4344
R11
2A
Lav
a fl
ow<
0.01
<0.
01<
0.01
0.2
14
34
R11
3A
Tuf
f<
0.01
<0.
01<
0.01
1.6
194
9394
R11
7A
Dac
ite
plug
<0.
01<
0.01
<0.
010.
61
1312
13
R10
7C
Gra
nodi
orite
<0.
01<
0.01
0.01
16.2
135
535
435
5
R11
0A
Tuf
f<
0.01
<0.
01<
0.01
3.8
121
821
721
8
3PC
Lav
a fl
ow<
0.01
0.50
0.50
0.8
1627
111.
7
4PC
AG
rano
dior
ite<
0.01
0.07
0.07
0.4
27
53.
5
5PC
Dac
ite
plug
<0.
01<
0.01
<0.
01<
0.2
19
89.
0
9PC
BL
ava
flow
0.04
0.04
0.58
21.4
1852
550
729
12P
CA
Tuf
f<
0.01
<0.
01<
0.01
24.6
159
159
01 59
1
SUMMARY AND CONCLUSIONS
The Johnson River Basin, located on the west side of Cook Inlet in south-central Alaska, drains an area of about 96 mi2. In the upper part of the basin, a mineral deposit is located on a private inholding. Due to the possibility of developing the mineral prospect, the upper part of the Johnson River Basin was studied from 1999 through 2001 as part of a cooperative study with the National Park Service. The purpose of this study was to characterize the geochem-istry of the Johnson River Prospect, to identify potential environmental hazards, and to determine baseline levels for selected water-quality constituents. Major findings are:
The two main rock units that occur in the study area are the Early Jurassic Talkeetna Formation and the Middle and Late Jurassic plutonic rocks of the Alaska-Aleutian Ranges batholith. Both show extensive areas of oxidation of previ-ously mineralized, sulfide-rich rocks (gossans). The main structural feature of the study area is the Bruin Bay fault.
The widespread gossans in the volcanic Talkeetna For-mation have a similar metal signature to the Johnson River Prospect (lead, zinc, cadmium, arsenic, copper, mercury, gold, and sulfur).
The average monthly discharge for the Johnson River during the open water period (May through October) ranges from 183 ft3/s in May to 719 ft3/s in July. Most of the flow originates from Johnson Glacier and Double Glacier. Phys-ical and chemical parameters (specific conductance, pH, water temperature, and dissolved oxygen) and concentra-tions of basic water-quality constituents indicate good water quality. Water type of the Johnson River is classified as cal-cium bicarbonate.
Water quality samples from various sites in the study area indicate that most trace metals occur at low concentra-tions in the dissolved phase. The low dissolved metal con-tents are most likely the result of a combination of natural buffering by available carbonate and current level of weath-ering of previously sulfur-bearing rocks. Concentrations of total aluminum, total iron, and total manganese collected at the Johnson River gage correlate with suspended-sediment concentration.
The highest concentrations of several trace elements from streambed sediments (arsenic, barium, cadmium, cop-per, lead, selenium, and zinc) were found at East Fork Ore Creek, which drains the Johnson River Prospect, and Ore Creek. Concentrations of these elements substantially decrease downstream, indicating the introduction of addi-
tional fine sediment from streams draining Johnson Glacier and Double Glacier.
Concentrations of several trace elements from streambed sediments of East Fork Ore Creek and Ore Creek exceed the Interim Freshwater Sediment Quality Guidelines, probable effect levels, threshold effect concentrations, and probable effect concentrations. Most sites sampled in the study area have low amounts of organic carbon and mean PEC quo-tients greater than 0.5, which indicates the presence of tox-icity.
Acid-Base Accounting (ABA) tests on 11 rock samples indicated low acid-generating potential and high acidity-neutralizing potential of most samples. ABA maximizes the reported neutralizing potential by crushing the sample so that the entire volume is exposed to the test acid. Con-versely, field tests show that stream cobbles have lost most of the calcite originally in the outer shell and unless broken open, have little further reaction to acid. Thus, in the case of a natural or manmade exposure of unweathered sulfide-bearing rock, the effect on downstream acidity will depend on how much calcite is newly exposed along with unweath-ered sulfide. If sulfide significantly outweighs calcite, then bed sediments in the adjacent drainage may be ineffective in buffering the resulting surge of acidity because they are now armored by a calcite-depleted shell.
REFERENCES
Aiken, G., and Cotsaris, E., 1995, Soil and hydrology-Their effect on NOM: American Water Works Association, Jan-uary, p. 36-45.
Alaska Native Claims Settlement Act (ANCSA), 1971: 43 United States Congress.
Arbogast, B.F., ed., 1990, Quality assurance manual for the Branch of Geochemistry, U.S. Geological Survey: U.S. Geological Survey Open-File Report 90-668, 184 p.
Baedecker, P.A., ed., 1987, Methods for geochemical analysis: U.S. Geological Survey Bulletin 1770, 11 chapters, inde-pendently paginated.
Canadian Council of Ministers of the Environment, 1995, Interim sediment guidelines: Soil and Sediment Quality Section Guidelines Division, Evaluation and Interpretation Branch Ecosystem Conservation Directorate, 65 p.
Canadian Council of Minister for the Environment, 1999, Canadian sediment quality guidelines for the protection of aquatic life-Summary tables, in Canadian Environmental Quality Guidelines, 1999: Winnipeg, Canadian Council of Ministers of the Environment.
Deacon, J.R., and Stephens, V.C., 1998, Trace elements in streambed sediment and fish liver at selected sites in the Upper Colorado River Basin, Colorado, 1995-96: U.S. Geological Survey Water-Resources Investigations Report 98-4124, 19 p.
26
Detterman, R.L., and Hartsock, J.K., 1966, Geology of the Ini-skin-Tuxedni region, Alaska: U.S. Geological Survey Pro-fessional Paper 512, 78 p. 6 plates, scale 1:63,360.
Detterman, R.L., and Reed, B.L., 1980, Stratigraphy, struc-ture, and economic geology of the Iliamna quadrangle, Alaska: U.S. Geological Survey Bulletin 1368-B, 86 p., 1 plate, scale 1:250,000
Edwards, T.K., and Glysson, G.D., 1988, Field methods for measurement of fluvial sediment: U.S. Geological Survey Open-File Report 86-531, 118 p.
Fishman, M.J., ed., 1993, Methods of analysis by the U.S. Geological Survey National Water Quality Laboratory - Determination of inorganic and organic constituents in water and fluvial sediments: U.S. Geological Survey Open-File Report 93-125, 217 p.
Fishman, M.J., and Friedman, L.C., eds., 1989, Methods for determination of inorganic substances in water and fluvial sediments: U.S. Geological Survey Techniques of Water-Resources Investigations, book 5, chap. A1, 545 p.
Gilliom, R.J., Mueller, D.K., and Nowell, L.H., 1998, Meth-ods for comparing water-quality conditions among National Water-Quality Assessment Study Units, 1992-1995: U.S. Geological Survey Open-File Report 97-589, 54 p.
Gray, T.E., 1988, Origin and evolution of sub-seafloor Au-Zn-Cu-Pb mineralization and related alteration at the Johnson River Prospect, south-central Alaska: Master of Science Thesis, University of Oregon, Eugene, 219 p.
Hem, J.D., 1985, Study and interpretation of the chemical characteristics of natural water: U.S. Geological Survey Water-Supply Paper 2254, 263 p.
Hillhouse, J.W., and Coe, R.S., 1994, Paleomagnetic data from Alaska, in Plafker, George, and Berg, H.C., eds., The Geology of Alaska: v. G-1 of The Decade of North Ameri-can Geology: Geological Society of America, Boulder CO, p 797-812.
Jackson, L.L., Brown, F.W., and Neil, S.T., 1987, Major and minor elements requiring individual determination, classi-cal whole rock analysis, and rapid rock analysis, in Bae-decker, P.A., ed., Methods for Geochemical Analysis: U.S. Geological Survey Bulletin 1770, Chapter G.
Levinson, A.A., 1974, Introduction to Exploration Geochem-istry: 2nd ed., Wilmette, IL, Applied Publishing Ltd., 924 p.
MacDonald, D.D., Ingersoll, C.G., and Berger, T.A., 2000, Development and evaluation of consensus-based sediment quality guidelines for freshwater ecosystems: Archives of Environmental Contamination and Toxicology, v. 39, p. 20-31.
Morin, K.A., and Hutt, N.M., 1997, Environmental geochem-istry of minesite drainage: Practical theory and case stud-ies: Vancouver, British Columbia, MDAG Publishing, 333 p.
Nokleberg, W.J., and others, 1994, Metallogeny and major mineral deposits of Alaska, in Plafker, George, and Berg, H.C., eds., The Geology of Alaska: v. G-1 of The Decade of North American Geology: Geological Society of Amer-ica, Boulder CO, p. 855-904.
Patton, C.J., and Truitt, E.P., 1992, Methods of analysis by the
U.S. Geological Survey National Water-Quality Labora-tory - Determination of total phosphorus by a Kjeldahl digestion method and an automated colorimetric finish that includes dialysis: U.S. Geological Survey Open-File Report 92-146, 39 p.
Reed, B.L., and Lanphere, M.A., 1969, Age and chemistry of Mesozoic and Tertiary plutonic rocks in south-central Alaska: Geological Society of America Bulletin, v. 80, p. 23-44.
Reed, B.L., and Lanphere, M.A., 1973, Alaska-Aleutian Range batholith—Geochronology, chemistry, and relations to circum-Pacific plutonism: Geological Society of Amer-ica Bulletin, v. 84, p. 2583-2610.
Rose, A.W., Hawkes, H.E., and Webb, J.S., 1979, Geochemis-try in Mineral Explorationv(2nd edition): New York, Aca-demic Press, 657 p.
Sawyer, C.N., 1947, Fertilization of lakes by agricultural-urban drainage: Journal of New England Water Works Association, v. 61, p. 109-127.
Shelton, L.R., 1994, Field guide for collecting and processing stream water samples for the National Water-Quality Assessment Program: U.S. Geological Survey Open-File Report 94-455, 42 p.
Shelton, L.R., and Capel, P.D., 1994, Guidelines for collecting and processing samples of streambed sediment for analysis of trace elements and organic contaminants for the National Water-Quality Assessment Program: U.S. Geo-logical Survey Open-File Report 94-458, 20 p.
Smith, K.S., and Huyck, L.O., 1999, An overview of the abun-dance, relative mobility, bioavailability, and human toxic-ity of metals: Reviews in Economic Geology, 6a, p. 29-70.
Sobek, A.A., Schuller, W.A., Freeman J.R., and Smith, R.M., 1978, Field and laboratory methods applicable to overbur-dens and minesoils: U.S. National Technical Information Report PB-280495, EPA-600/2-78-054, 403 p.
Steefel, C. I., 1987, The Johnson River Prospect, Alaska: Gold-rich sea-floor mineralization from the Jurassic: Eco-nomic Geology, vol. 82, p. 894-914.
Taggart, J.E., Jr., Lindsay, J.R., Scott, B.A., Vivit, D.V., Bar-tel, A.J., and Stewart, K.C., 1987, Analysis of geologic materials by wavelength-dispersive X-ray fluorescence, in Baedecker, P.A., ed., Methods for Geochemical Analysis: U.S. Geological Survey Bulletin 1770, ch. E.
U.S. Environmental Protection Agency, 1976, Quality criteria for water: U.S. Environmental Protection Agency, Wash-ington, D.C., 256 p.
Van Derveer, W.D., and Canton, S., 1997, Selenium sediment toxicity thresholds and derivation of water quality criteria for freshwater biota of western streams: Environmental Toxicology and Chemistry, v. 16, p. 1260-1268.


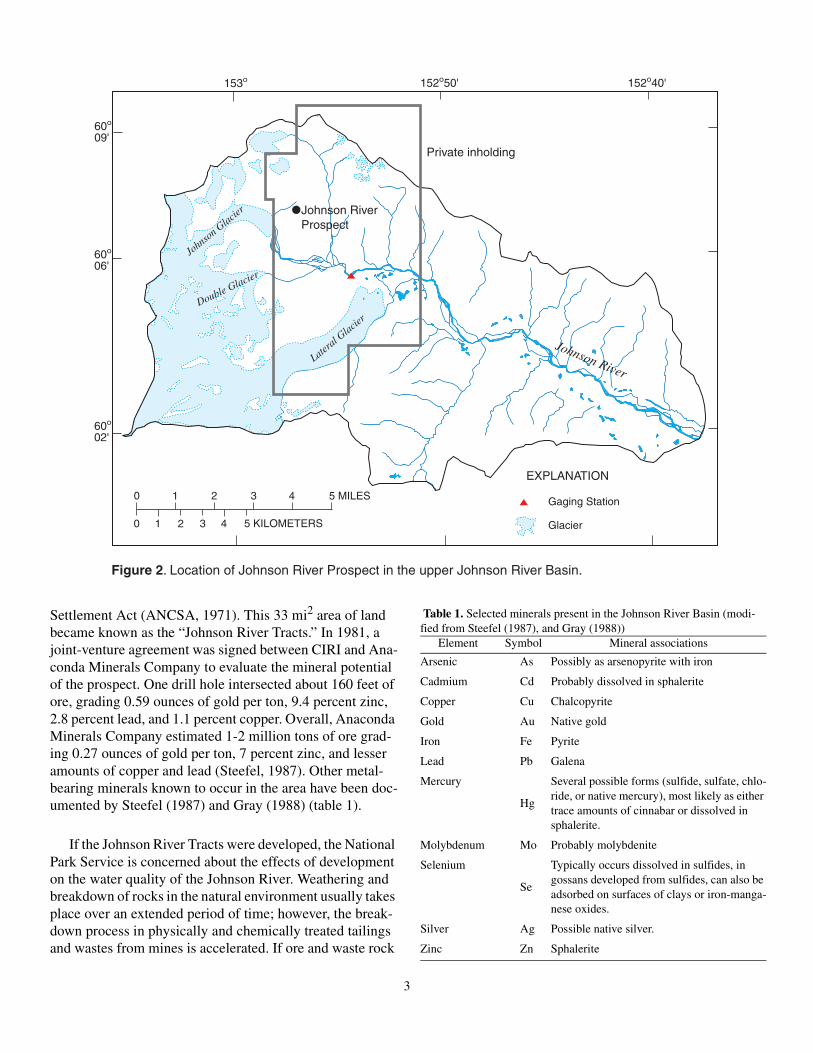
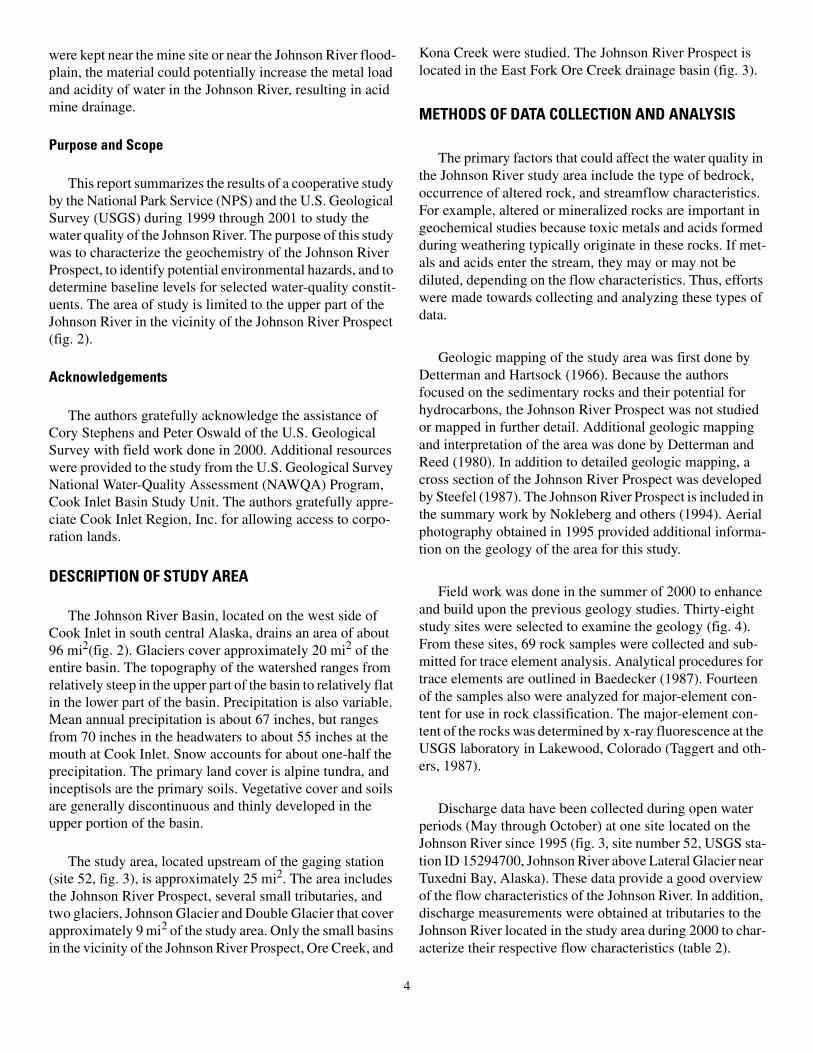
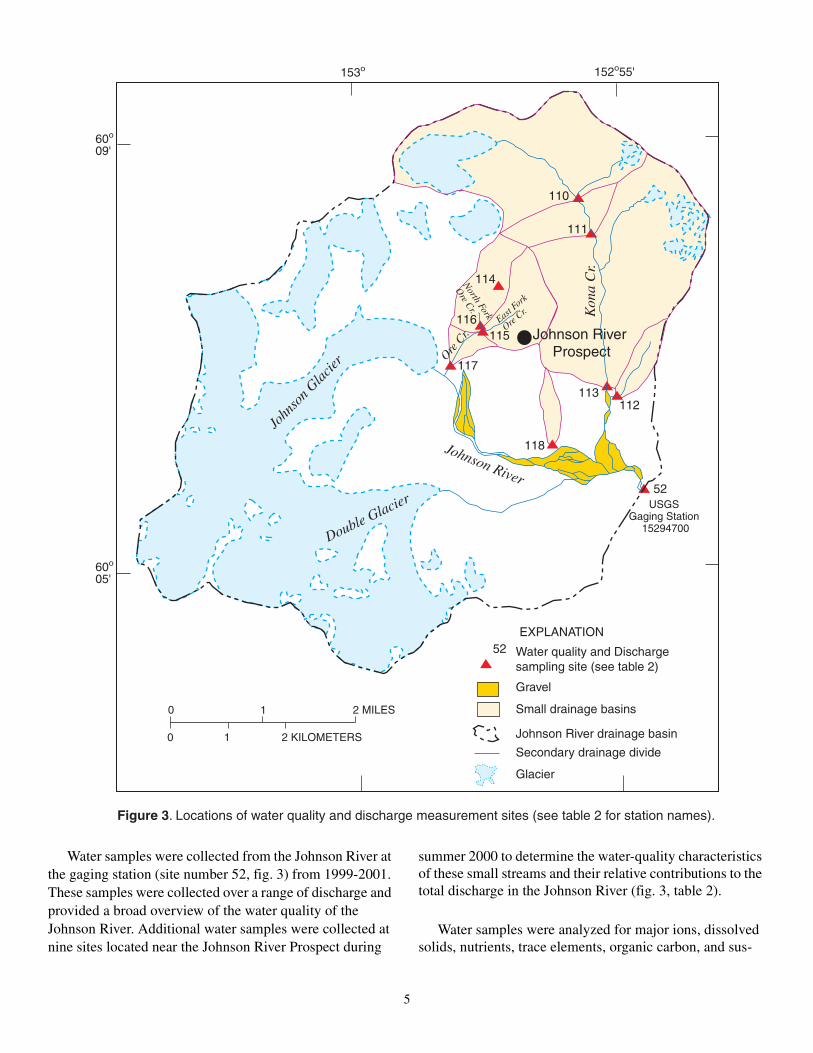

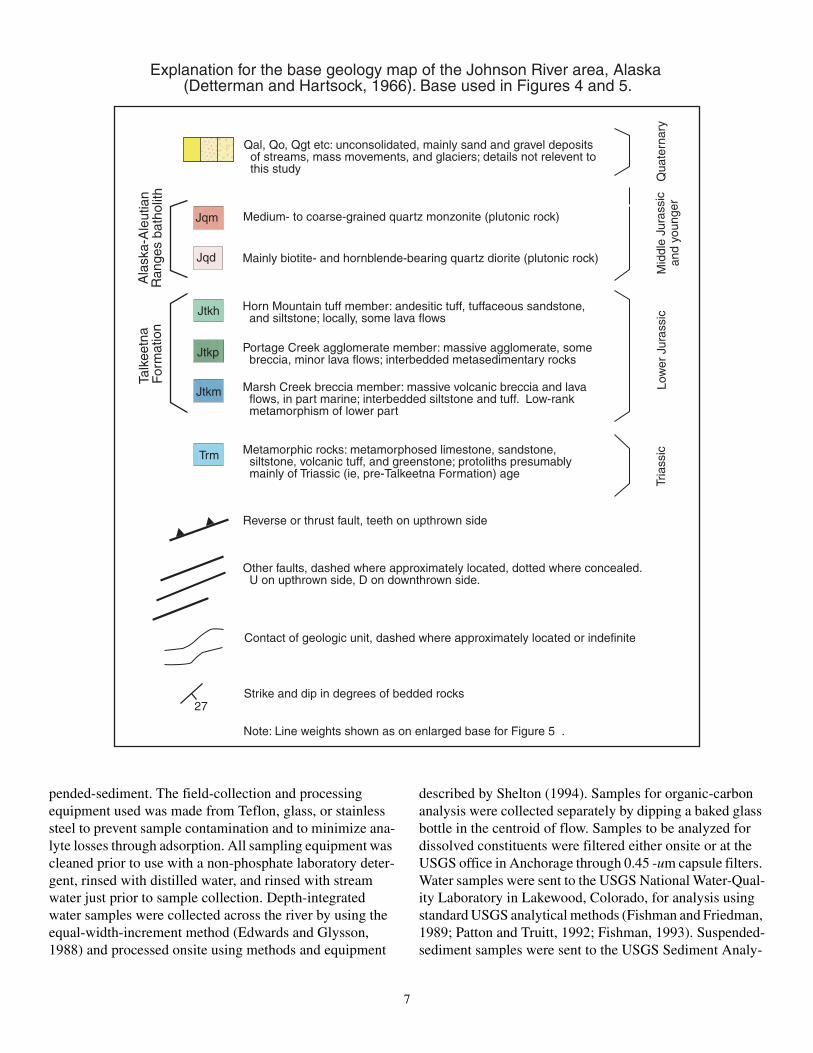

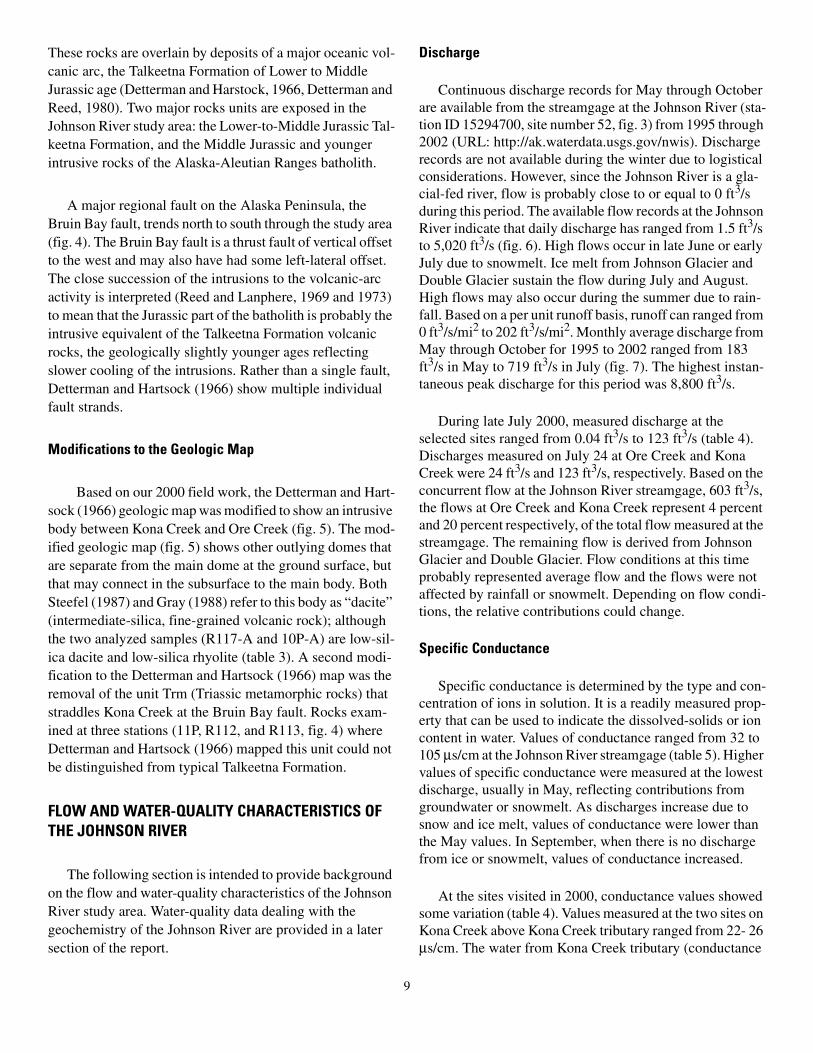

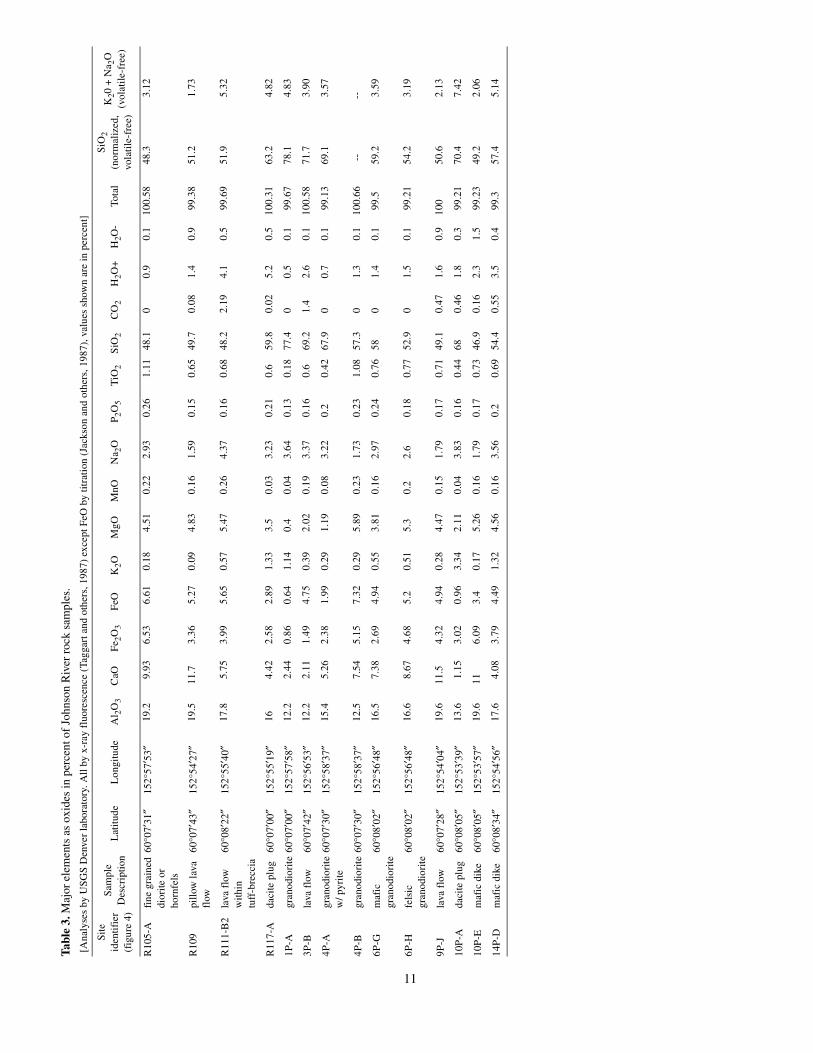


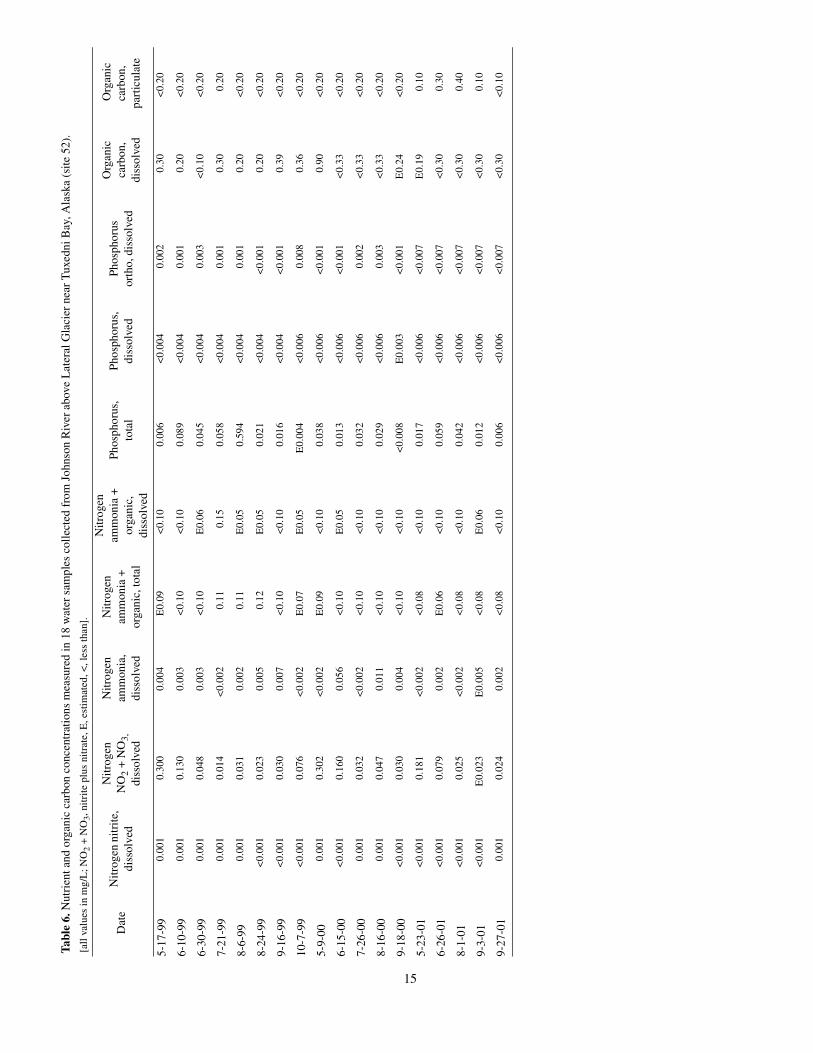
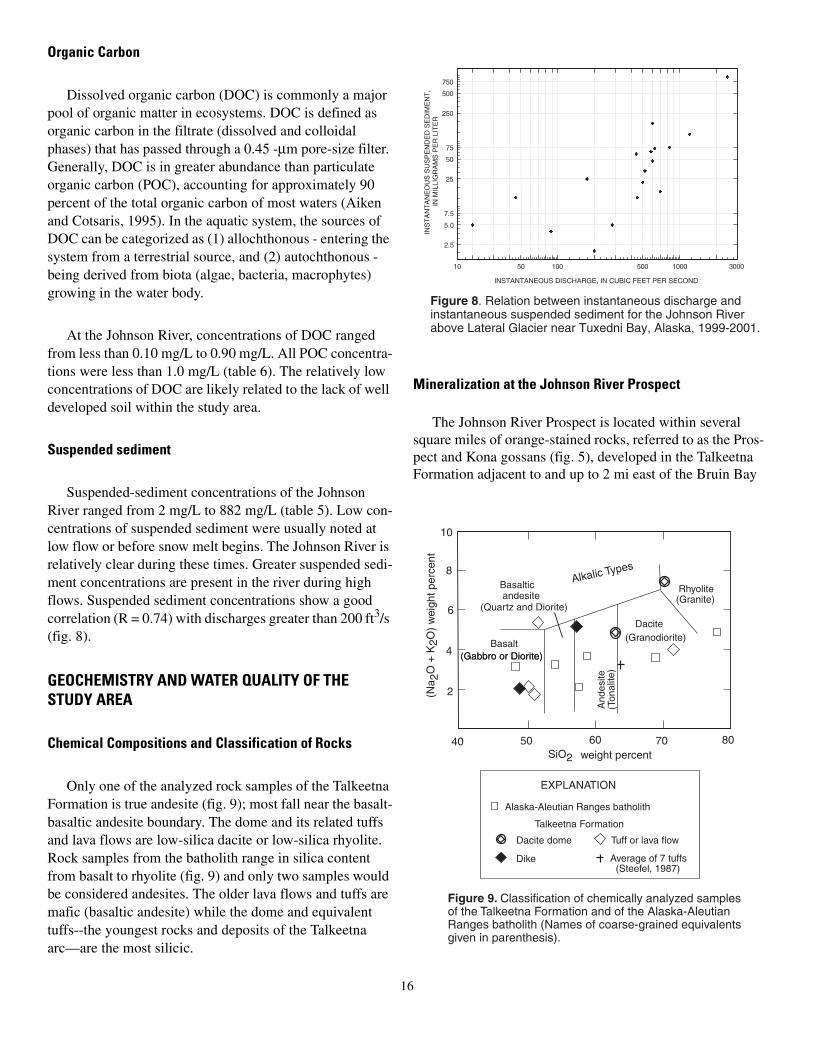
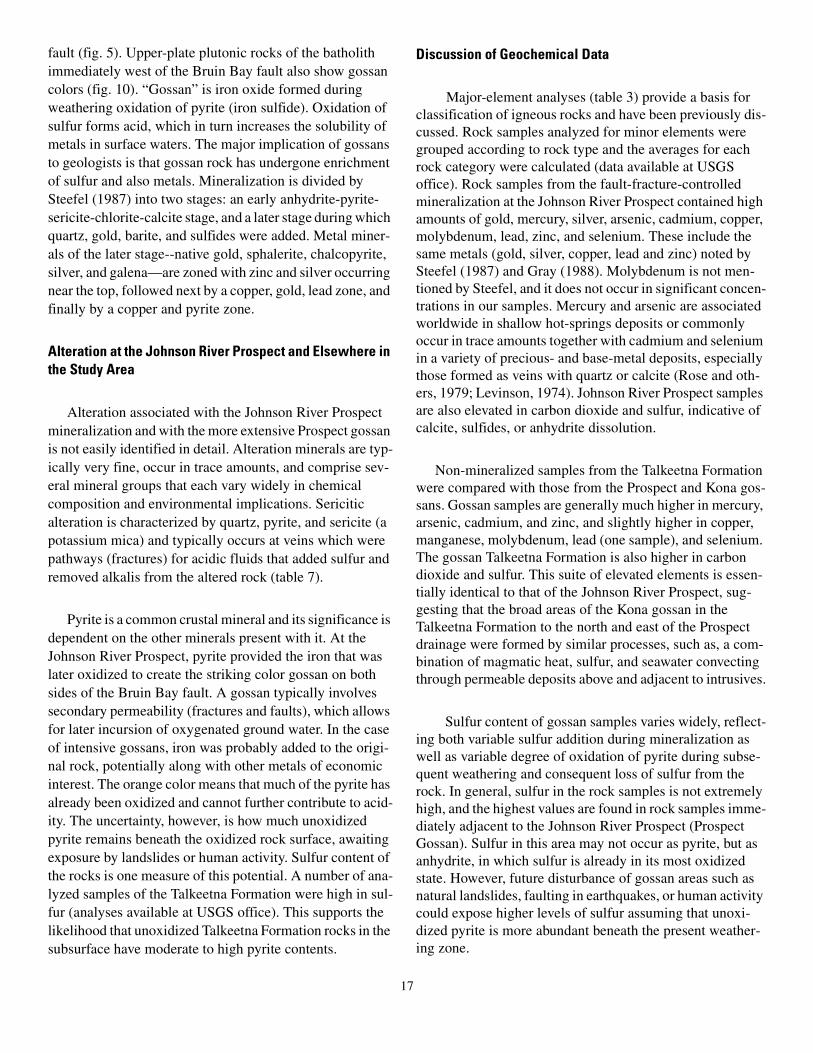
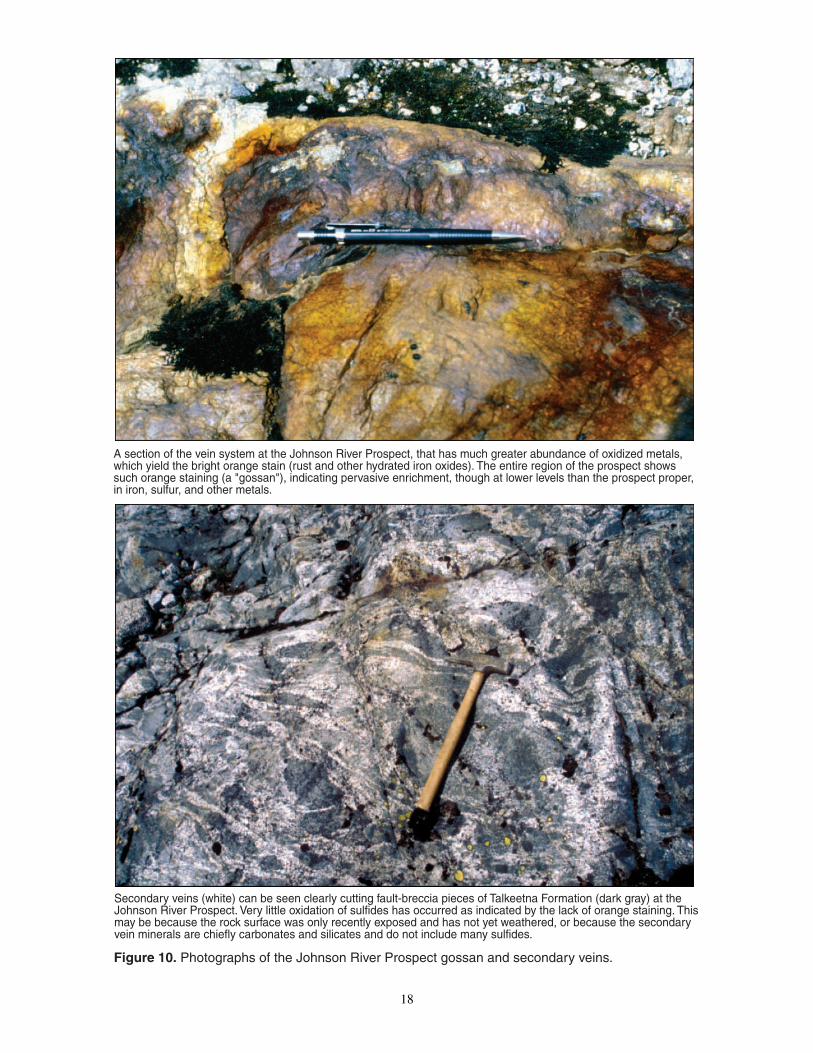
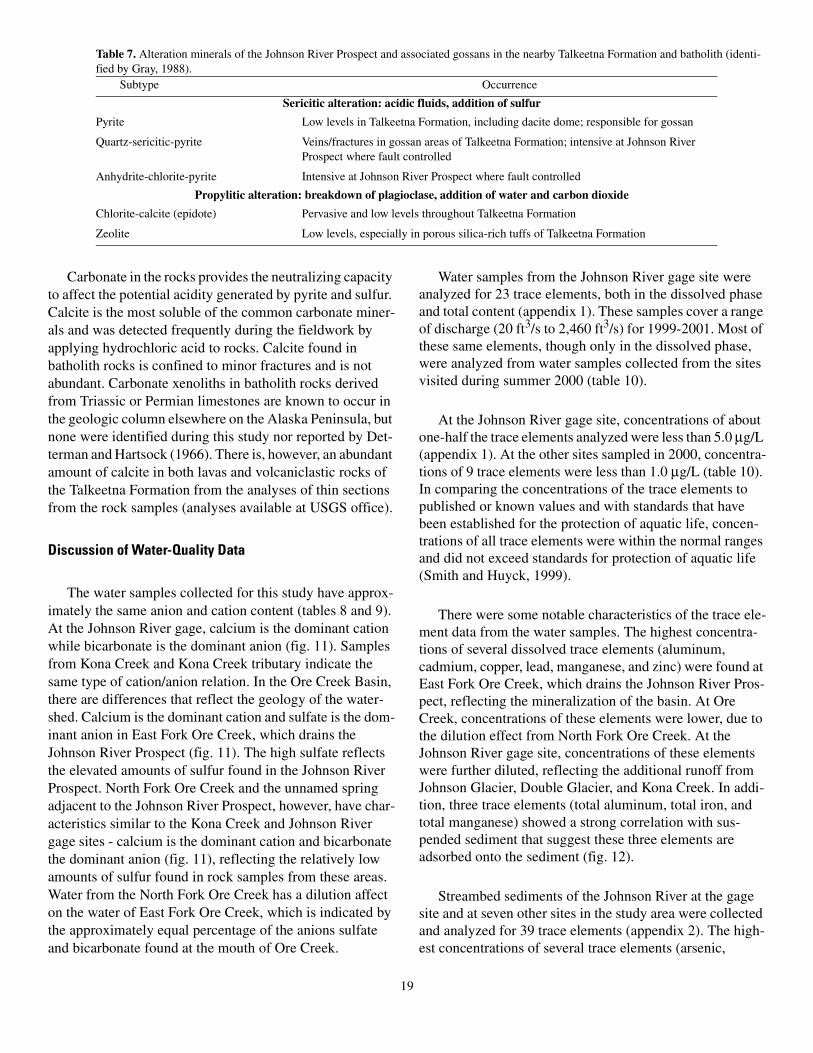
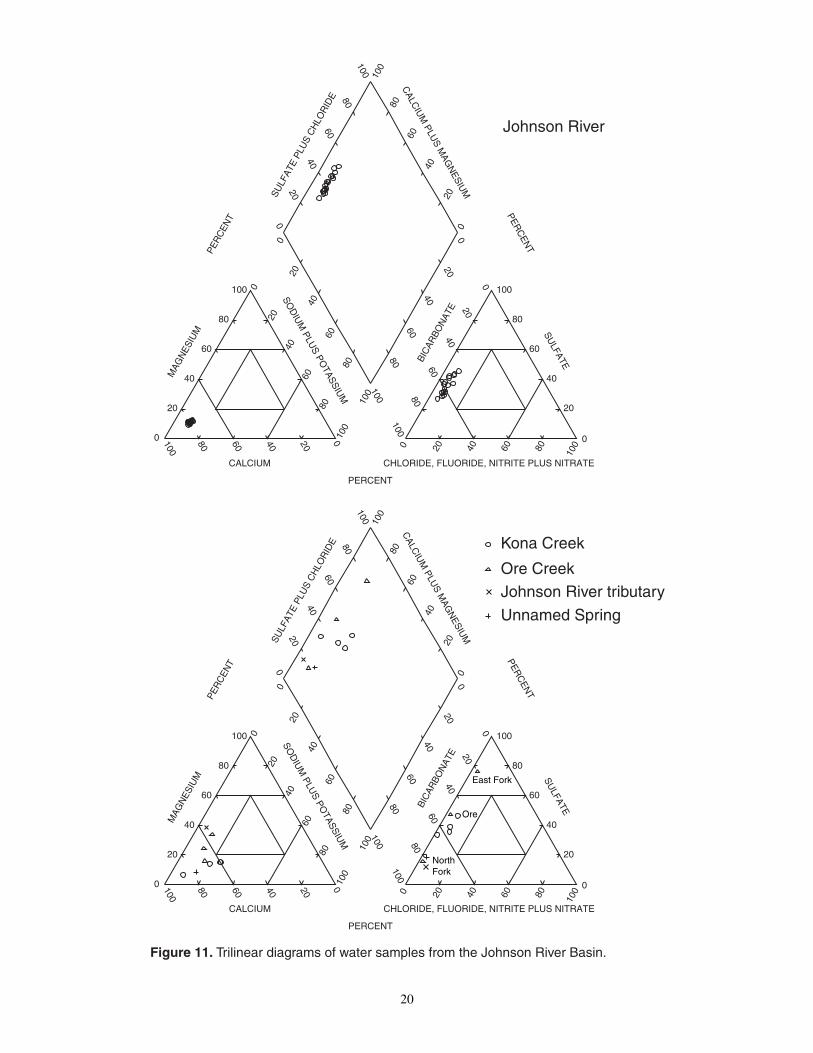
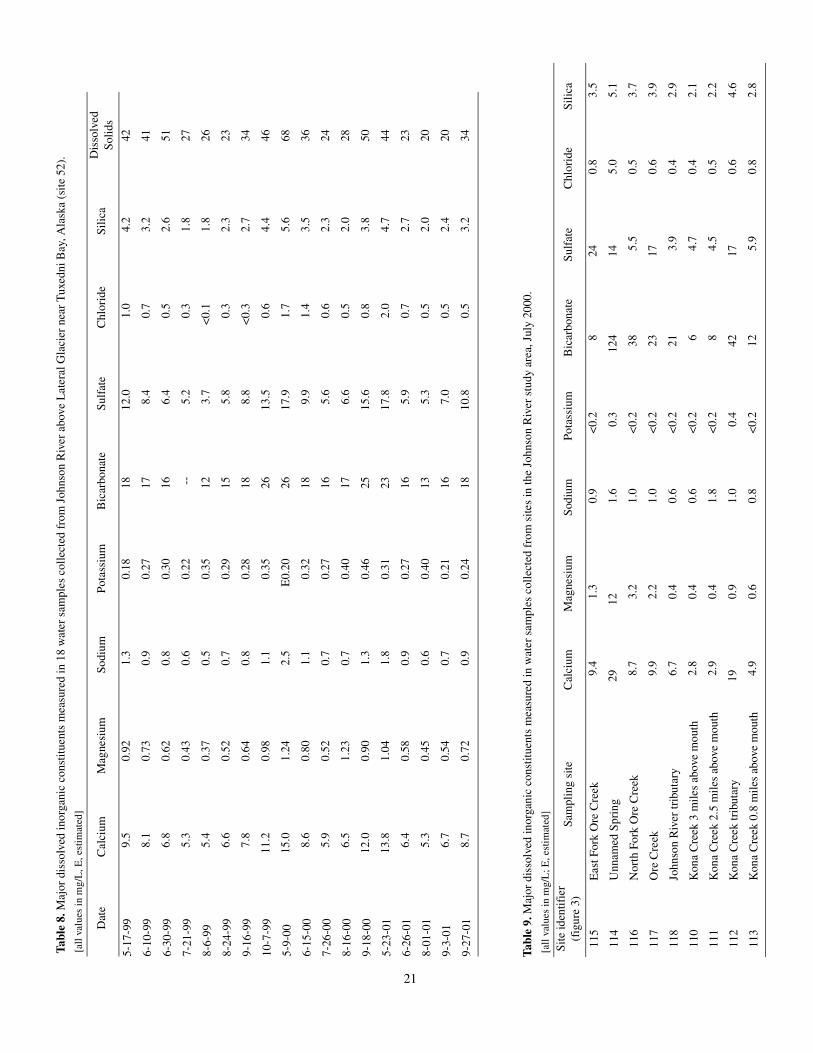


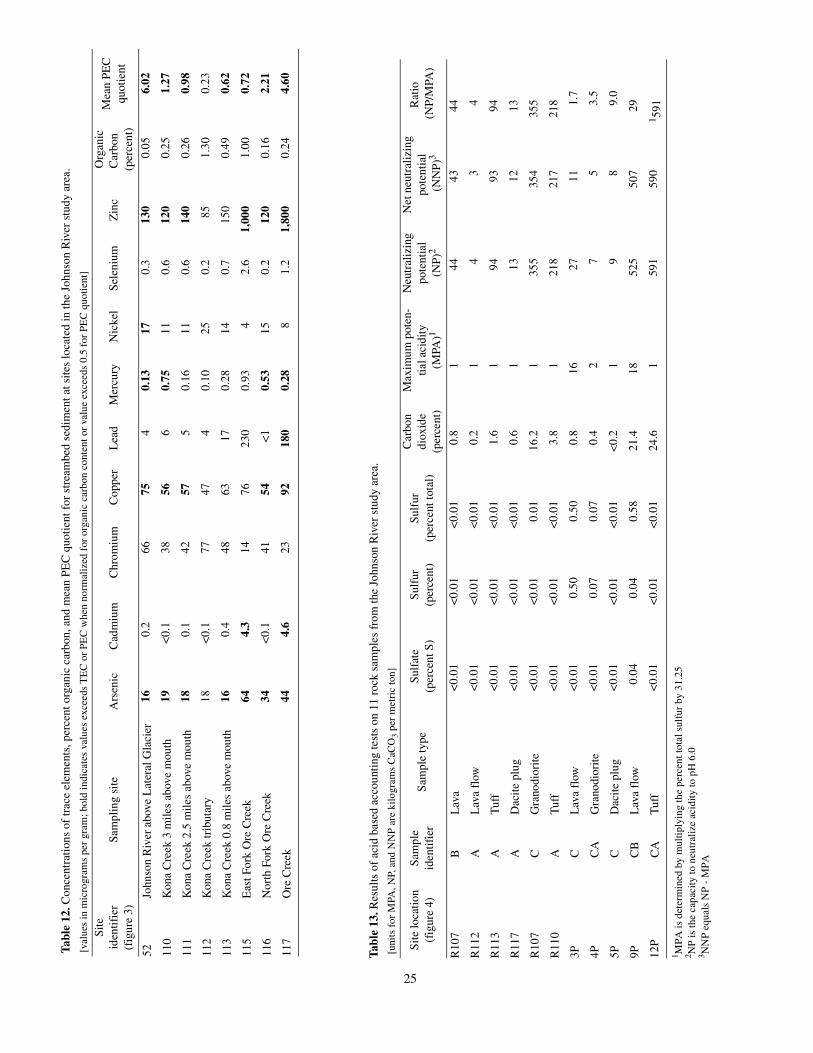


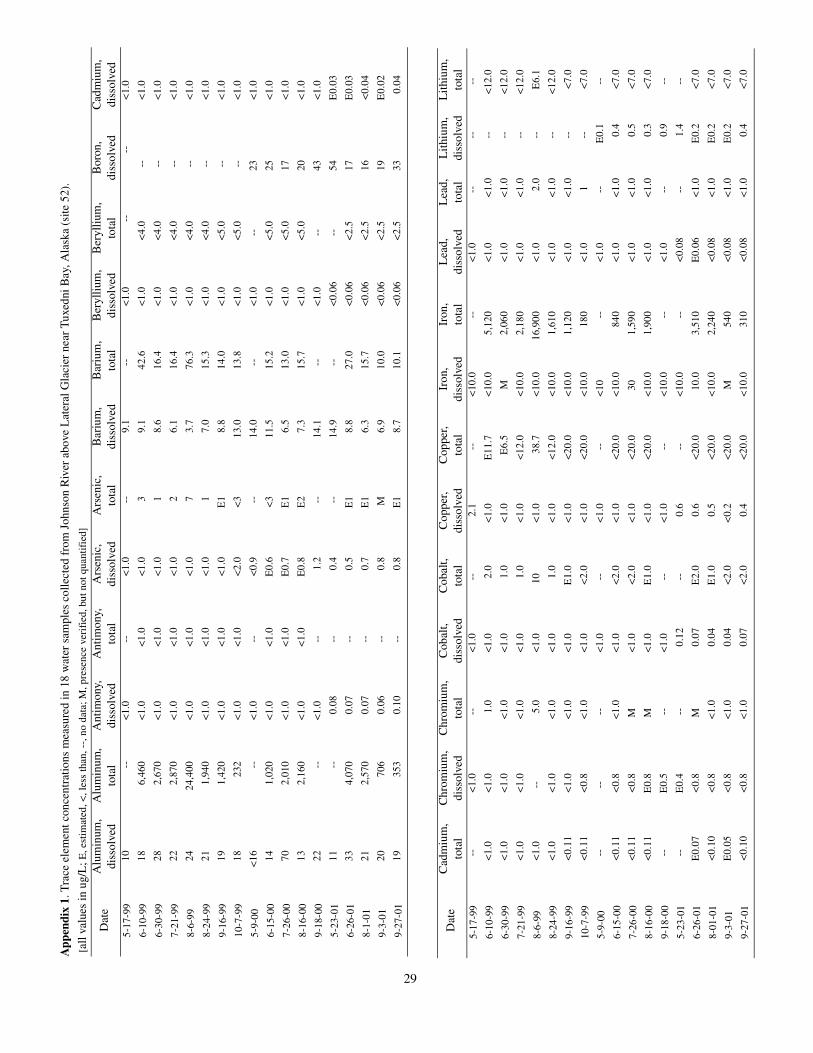
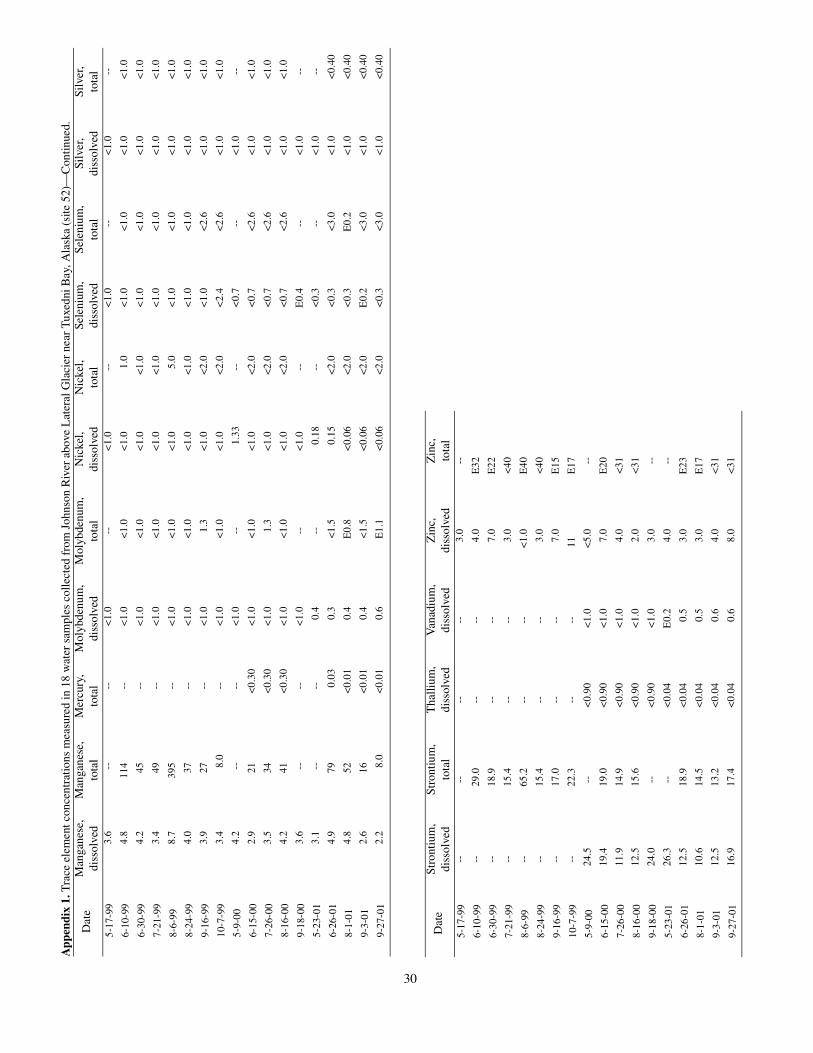
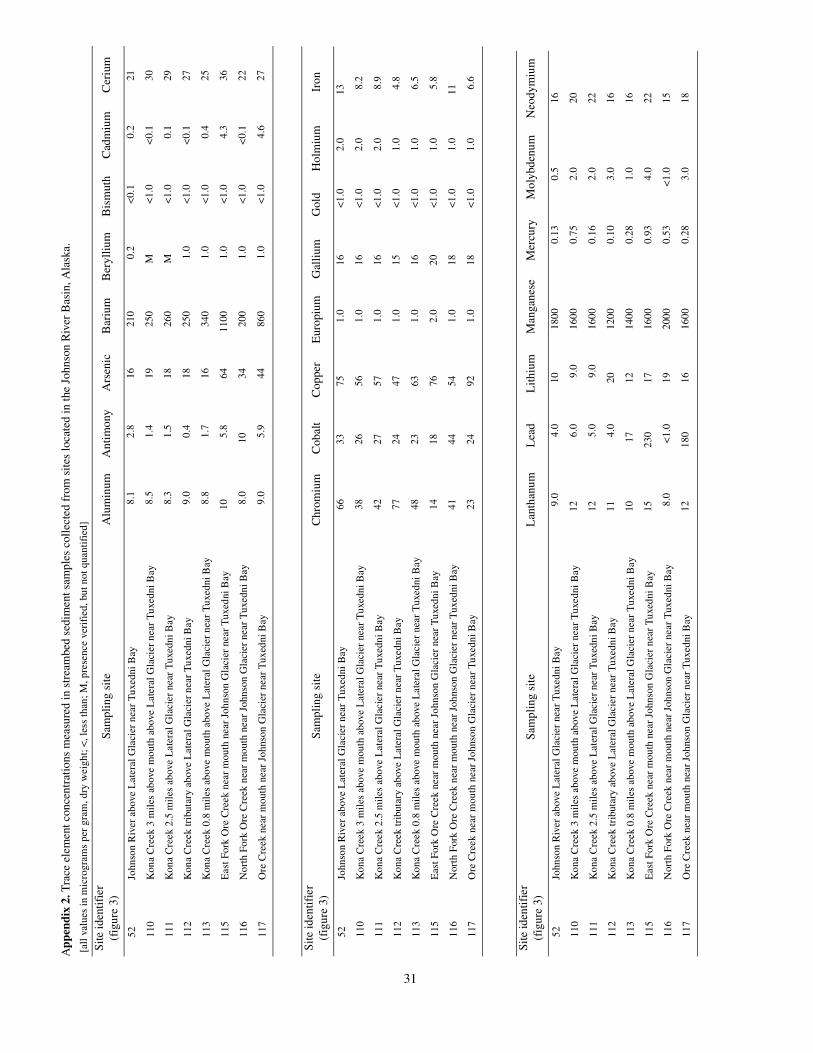


![Gordon Matta-Clark CV 2016 - d6jcg90g7mpvu.cloudfront.net · 2016] Cuts: Video Works by Gordon Matta-Clark, The Herbert F. Johnson Museum of Art, Cornell University, Ithaca, New York](https://static.documents.pub/doc/80x56/5ed025c3137588523c69a1fb/gordon-matta-clark-cv-2016-2016-cuts-video-works-by-gordon-matta-clark-the.jpg)
