51
GEODETIC DEFORMATION ANALYSIS Short Lecture Notes for Graduate Students Cüneyt Aydın (YTUGeodesy Division)

GEODETIC DEFORMATION ANALYSIS Short Lecture Notes for Graduate Students
Cüneyt Aydın (YTUGeodesy Division)

ii
CONTENTS
PREFACE..................................................................................................................................... iii
1. INTRODUCTION........................................................................................................ 1
2. GLOBAL TEST............................................................................................................ 4
2.1 Testing Whole Network‐Method I........................................................................... 4 2.2 Testing Whole Network‐Method II.......................................................................... 8 2.3 Testing Whole Network for Non‐Identical Case.................................................... 10 2.4 Testing a Part of a Network ................................................................................... 11
3. TESTING OBJECT POINTS ....................................................................................... 14
3.1 Testing Object Points in Absolute Deformation Networks ................................... 14 3.2 Localization ............................................................................................................ 17 3.2.1 Localization with Gauss‐elimination method........................................................ 17 3.2.2 Localization with implicit hypothesis method....................................................... 20 3.2.3 Localization in absolute deformation networks.................................................... 22
4. SENSITIVITY ANALYSIS ........................................................................................... 23
4.1 Global Sensitivity Analysis ..................................................................................... 23 4.1.1 Optimization Criteria ............................................................................................. 23 4.1.2 Minimum detectable displacement ...................................................................... 25 4.2 Sensitivity Analysis in Absolute Deformation Networks ....................................... 26
5. INTERPRETATION MODELS .................................................................................... 30
5.1 Kinematic Model.................................................................................................... 30 5.1.1 Single point model for an object point’s movement............................................. 31 5.1.1.1 Model I................................................................................................................... 31 5.1.1.2 Model II.................................................................................................................. 32 5.1.1.3 Model III................................................................................................................. 32 5.1.2 Single model for whole object points’ movement ................................................ 34 5.1.3 Testing model parameters..................................................................................... 35 5.1.4 Model test.............................................................................................................. 36 5.2 Strain Analysis........................................................................................................ 37 5.2.1 Definition ............................................................................................................... 37 5.2.2 Strain modelling in geodetic deformation analysis ............................................... 41
APPENDIX A: GLOSSARY ........................................................................................................... 45
APPENDIX B: THRESHOLD VALUES (F and t‐distributions) ....................................................... 47

iii
PREFACE
This short lecture notes aims to give some fundamental subjects in geodetic conventional deformation analysis. It has been written for graduate students who take Error Theory and Parameter Estimation and Adjustment Computation courses in their Geodesy departments. For reading the notes, it is highly recommended to have knowledge on geodetic network adjustment solutions, especially trace‐min, partial trace‐min and S‐transformation.
The updated version with numerical examples and literature review will appear soon. Your comments on the lecture notes will be appreciated.
C. Aydın
İstanbul, July‐2014


1
1. INTRODUCTION
Because of acting forces, a physical body may displace from x1 initial position to x2
present position in time in 3D space. The displacement vector
d=x2−x1 (1.1)
consists of two parts
• relative part,
• non‐relative part.
The relative part, the so‐called rigid body displacement, represents translation and
rotation. They are relative because they change depending on where we are observing
the body from. For instance, a body may not move or rotate for an observer moving
and rotating along the same direction simultaneously with the body. The non‐relative
part, on the other hand, does not depend on the observer position. This part
represents shape change, i.e. deformation.
Engineering buildings, such as dams, bridges, tunnels etc., or the Earth’s crust are
such bodies affected by some physical forces all the time. Monitoring their responses
to the forces is an essential task not only for understanding the body mechanism but
also for taking some precautions before any possible damage. The responses, which
are monitored as afore‐mentioned displacements, are very small compared to the
body size. Geodetic methods and instruments may overcome this problem sufficiently
having provided milimeter accuracy in positioning of the stations distributed in even
large areas, and therefore, today they are indispensable in crustal and constructional

2
deformation studies. Although geodetic deformation analysis is now around 30 years
old and there are plenty of approaches, techniques, methods etc., the surveying
principle is the same. For monitoring the bodies (the “objects” as commonly
pronounced in geodesy), we establish a deformation network. There are two types of
deformation network,
• absolute deformation networks,
• relative deformation networks.
An absolute deformation network consists of two parts; 1) reference points and 2)
object points. The reference points are established in a stable region, the so‐called
reference block, whereas the object points are located at some specific places of the
object such that they are able to characterize the investigated dynamical property of
the object itself. Both point groups are predefined in absolute networks. Or, if the
reference points and object points are defined after deformation analysis or
depending on a prior information beforehand, we call such deformation networks
absolute ones. On the other hand, if a deformation network may not be partitioned
into two parts beforehand, this type of network is called relative deformation network.
Before realization of a deformation network, a practitioner knows naturally
(intuitively or depending on pre‐analysis of the studied area) which part is reference
block and which part is object. However, after realization we should test whether the
reference block has undergone any deformation or not. In other words, the reference
points are not exact in a deformation network. Therefore, in theory, all deformation
networks are (should be!) described as relative ones unless verifying the reference
points by some statistical tests based on the corresponding deformation
measurements.

3
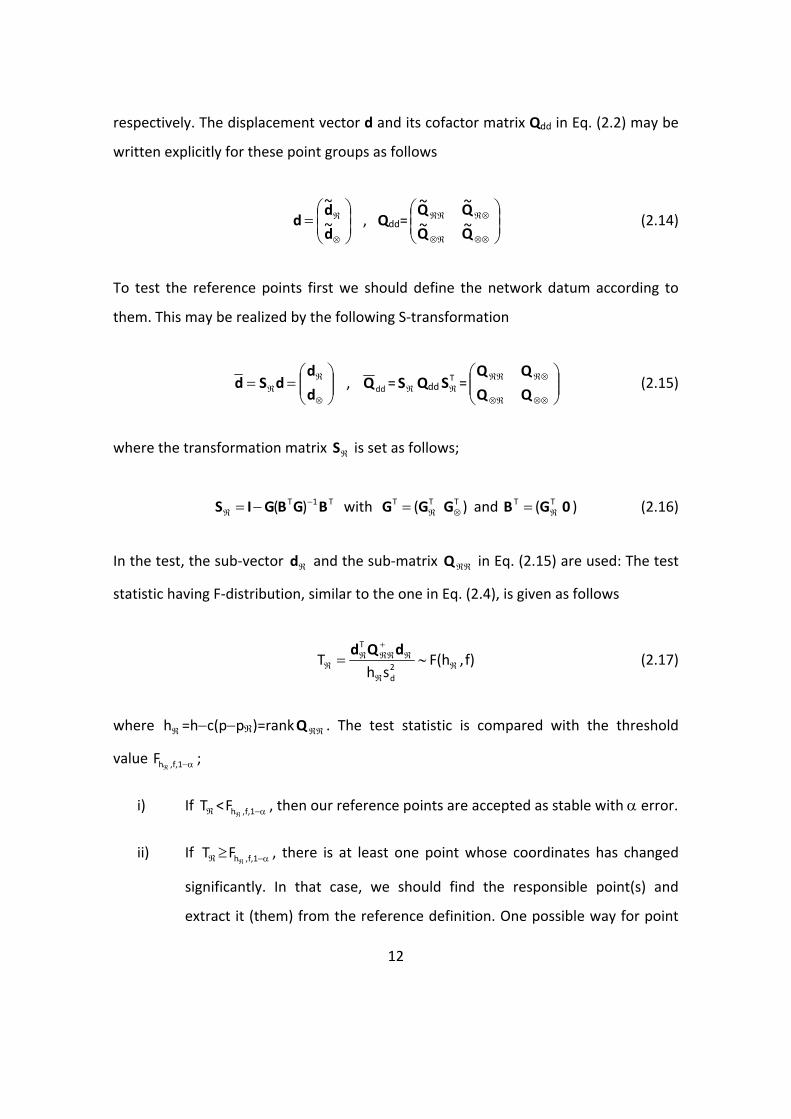
Fig. 1.1. Configuration of an absolute deformation network
In that course we mainly concentrate on conventional (geometrical) deformation
analysis for absolute and reference deformation networks, i.e., global test and
localization procedures; sensitivity analysis to derive the capacity of our deformation
networks; kinematic models to derive velocity and/or acceleration of the bodies which
move in time as well as strain analysis to interprete the deformation of an object.
Object
Reference points Reference points

4
2. GLOBAL TEST
Global test is realized for two aims; to learn (or verify)
• whether whole network has undergone any deformation or not,
• whether a part of the network (for instance, reference points) has any
deformation or not.
By global test it is not possible to answer if the corresponding points have
translated or rotated as a block (remember these kind of displacements are relative
changes), therefore the aim is sometimes expressed as follows;
• To learn whether the corresponding part has some points whose coordinates
have significant changes.
2.1 Testing Whole Network-Method I
We here desire to test if a whole network has any deformation or not. Let our c‐
dimensional deformation network with u=cp coordinate unknowns of p points be
measured in two periods. Applying trace‐minimum solution to each period
observations, suppose that we get
iiTixxi ii
yPAQx = , iixx
Q = T1Tii
Tiii
Ti )()( GGGGAPAAPA −+= −+ (i=1,2) (2.1a)
as well as
iiii yxAv −= , iiiTi
2i,0 /f)(s vPv= (i=1,2) (2.1b)

5
where
Ai : ni×u design matrix with rankAi=u−r,
iixx
Q : u×u cofactor matrix of the unknowns,
Pi : ni×ni weight matrix of the observations
iy : ni×1 (diminished) observation vector,
(…)+ : denotes pseudo‐inverse,
iv : ni×1 residual vector,
2i,0s : a‐posteriori variance of unit weight,
ni : number of observations,
r : number of datum parameters,
fi : degrees of freedom (fi=ni−u+r) and
GT : r×u coefficient matrix of constraint equations (datum matrix) to define the datum of the network.
Using the solutions given in Eq. (2.1a), the displacement vector d and its
cofactor matrix ddQ are obtained as
d=x2−x1 , 2211 xxxxdd QQQ += (2.2)
The test procedure depends on discriminating the following null hypothesis
(H0) against its alternative (H1);
H0: E(d)=0 vs. H1: E(d)≠0 (2.3)
For this, we have two possible ways;
• F‐(Fisher) test
• χ2‐(Chi‐square) test.
6
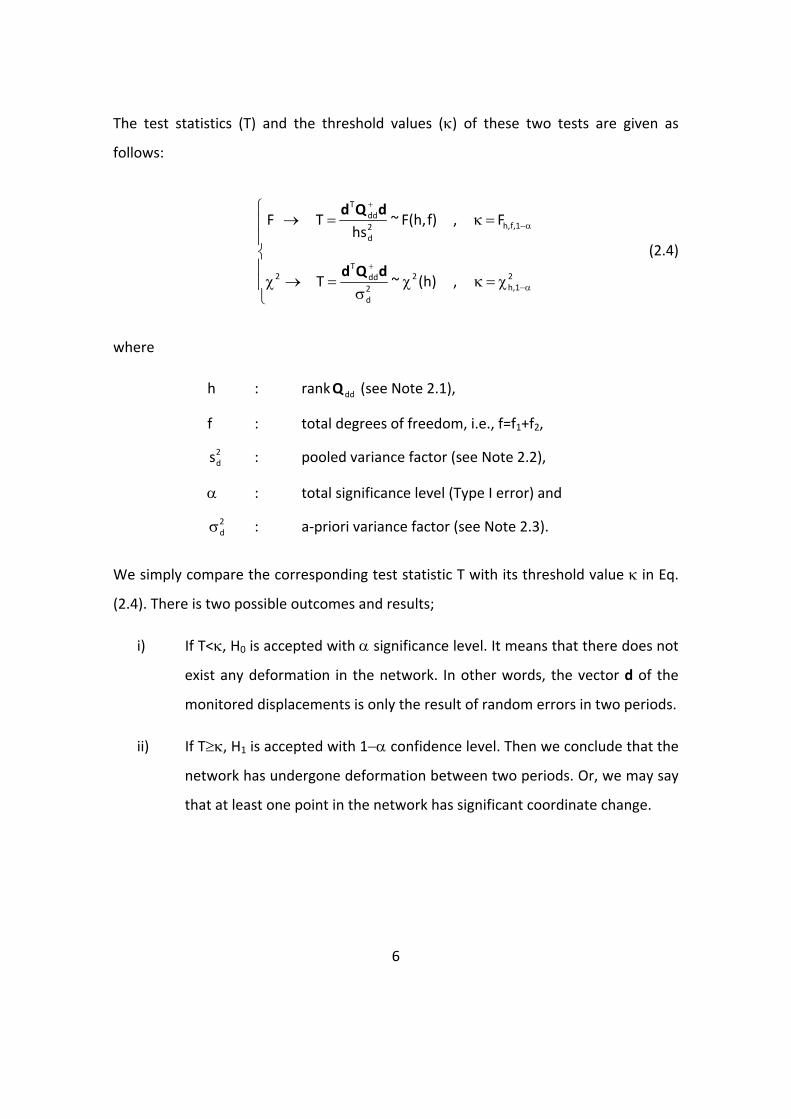
The test statistics (T) and the threshold values (κ) of these two tests are given as
follows:
⎪⎪
⎩
⎪⎪
⎨
⎧
χ=κχσ
=→χ
=κ=→
α−
+
α−
+
21h,
22d
ddT
2
1f,h,2d
ddT
,(h)~T
F,f)F(h,~hs
TF
dQd
dQd
(2.4)
where
h : rank ddQ (see Note 2.1),
f : total degrees of freedom, i.e., f=f1+f2,
2ds : pooled variance factor (see Note 2.2),
α : total significance level (Type I error) and
2dσ : a‐priori variance factor (see Note 2.3).
We simply compare the corresponding test statistic T with its threshold value κ in Eq.
(2.4). There is two possible outcomes and results;
i) If T<κ, H0 is accepted with α significance level. It means that there does not
exist any deformation in the network. In other words, the vector d of the
monitored displacements is only the result of random errors in two periods.
ii) If T≥κ, H1 is accepted with 1−α confidence level. Then we conclude that the
network has undergone deformation between two periods. Or, we may say
that at least one point in the network has significant coordinate change.

7
Note 2.2: Pooled variance factor is obtained as follows
2ds =
21
22,02
21,01
ff
sfsf
++
=f
22T211
T1 vPvvPv +
=fΩ
However, to consider the pooled variance factor in Eq. (2.4), the ratio “ 21,0s / 2
2,0s ”
should be smaller than α−1,f,f 21F threshold value (Variance test)*. Otherwise, we may
not put the pooled variance into Eq. (2.4); in other words, it means that the periods
are not proper for any comparison.
*) This is valid if 21,0s is numerically bigger than 2
2,0s . Otherwise, the ratio “ 22,0s / 2
1,0s ”
is compared with α−1,f,f 12F .
Note 2.3: In statistical point of view, χ2‐test is more powerful than F‐test. In other
words, the probability of correctly accepting the alternative hypothesis (the power
of the test) in χ2‐test is bigger. However, it requires a precise knowledge on the a‐
priori variance 2dσ . Since it can be derived from long time experience on the data of
the surveying methods applied in the studied area, this requirement may not be
ensured always or in a short time. Therefore, commonly F‐test is chosen because it
needs only the variances from the current measurements of the periods. Herafter,
in the test procedures we will consider only F‐distributed test statistics.
Note 2.1: If both periods are identical, then h=rank ddQ =u−r holds.
8
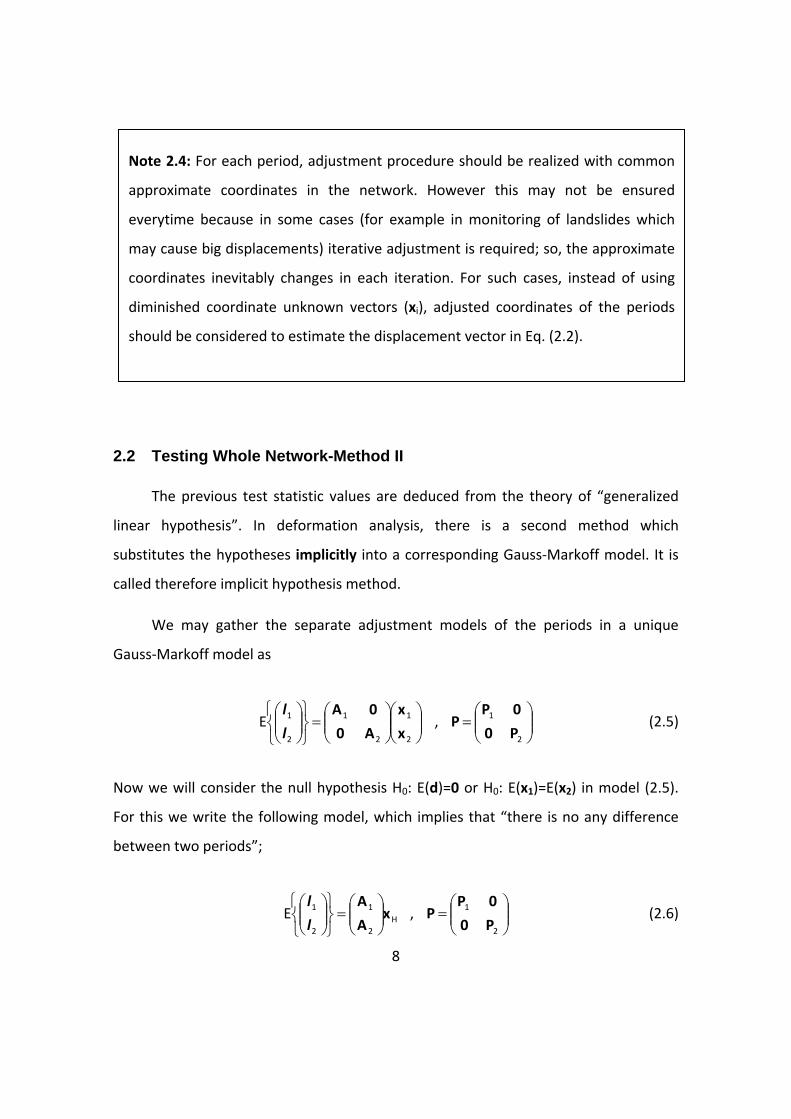
2.2 Testing Whole Network-Method II
The previous test statistic values are deduced from the theory of “generalized
linear hypothesis”. In deformation analysis, there is a second method which
substitutes the hypotheses implicitly into a corresponding Gauss‐Markoff model. It is
called therefore implicit hypothesis method.
We may gather the separate adjustment models of the periods in a unique
Gauss‐Markoff model as
⎟⎟⎠
⎞⎜⎜⎝
⎛⎟⎟⎠
⎞⎜⎜⎝
⎛=
⎭⎬⎫
⎩⎨⎧
⎟⎟⎠
⎞⎜⎜⎝
⎛
2
1
2
1
2
1Ex
x
A0
0A
l
l , ⎟⎟
⎠
⎞⎜⎜⎝
⎛=
2
1
P0
0PP (2.5)
Now we will consider the null hypothesis H0: E(d)=0 or H0: E(x1)=E(x2) in model (2.5).
For this we write the following model, which implies that “there is no any difference
between two periods”;
H2
1
2
1E xA
A⎟⎟⎠
⎞⎜⎜⎝
⎛=
⎭⎬⎫
⎩⎨⎧
⎟⎟⎠
⎞⎜⎜⎝
⎛l
l , ⎟⎟
⎠
⎞⎜⎜⎝
⎛=
2
1
P0
0PP (2.6)
Note 2.4: For each period, adjustment procedure should be realized with common
approximate coordinates in the network. However this may not be ensured
everytime because in some cases (for example in monitoring of landslides which
may cause big displacements) iterative adjustment is required; so, the approximate
coordinates inevitably changes in each iteration. For such cases, instead of using
diminished coordinate unknown vectors (xi), adjusted coordinates of the periods
should be considered to estimate the displacement vector in Eq. (2.2).
9
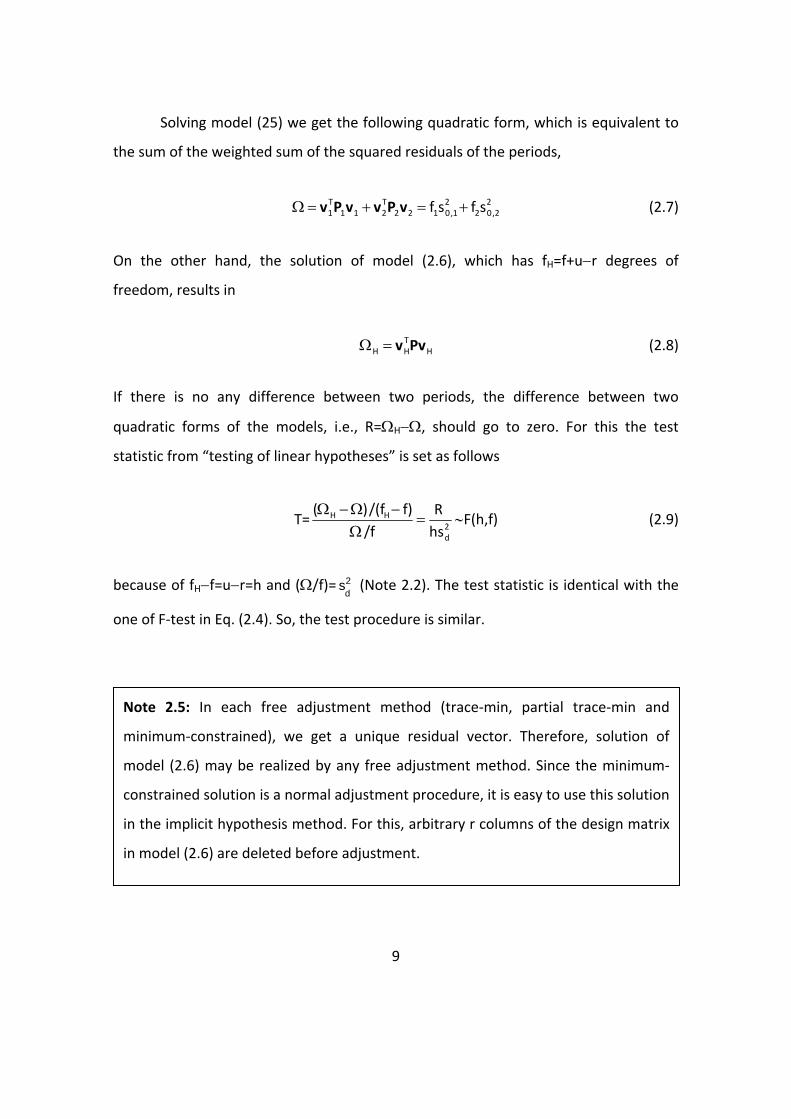
Solving model (25) we get the following quadratic form, which is equivalent to
the sum of the weighted sum of the squared residuals of the periods,
22,02
21,0122
T211
T1 sfsf +=+=Ω vPvvPv (2.7)
On the other hand, the solution of model (2.6), which has fH=f+u−r degrees of
freedom, results in
HTHH Pvv=Ω (2.8)
If there is no any difference between two periods, the difference between two
quadratic forms of the models, i.e., R=ΩH−Ω, should go to zero. For this the test
statistic from “testing of linear hypotheses” is set as follows
T= 2d
HH
hsR
/ff)/(f)( =
Ω−Ω−Ω
∼F(h,f) (2.9)
because of fH−f=u−r=h and (Ω/f)= 2d
s (Note 2.2). The test statistic is identical with the
one of F‐test in Eq. (2.4). So, the test procedure is similar.
Note 2.5: In each free adjustment method (trace‐min, partial trace‐min and
minimum‐constrained), we get a unique residual vector. Therefore, solution of
model (2.6) may be realized by any free adjustment method. Since the minimum‐
constrained solution is a normal adjustment procedure, it is easy to use this solution
in the implicit hypothesis method. For this, arbitrary r columns of the design matrix
in model (2.6) are deleted before adjustment.

10
2.3 Testing Whole Network for Non-Identical Case
A deformation network may be augmented or renovated with newer points in
different periods. In that case we should handle with different configurations in the
periods to be compared. To make them identical there are two possible ways;
i) The corresponding periods are separately adjusted using the observations
connecting the identical points in both periods.
ii) The periods are re‐adjusted such that only identical points in the periods
define the datum of the network.
The latter is more advantageous because we do not modify the network design. Let us
consider that our c‐dimensional deformation network with p points is augmented with
k newer points in the second period and we have already their trace‐minimum
solutions;
Coordinates Cofactors
1st Period 2nd Period 1st Period 2nd Period
Identical points 1x (cp×1) 2x′ (cp×1)
11xxQ 22xx ′′Q
n2xx ′′Q
New points − nx′ (ck×1)
2nxx ′′Q nnxx ′′Q
In the second period, new points should be extracted from the datum definition. We
may use S‐transformation for doing this. Let c(k+p)×r coefficient matrix of the
constrained equations for the second period be had the following form
2~x
22x~x~Q
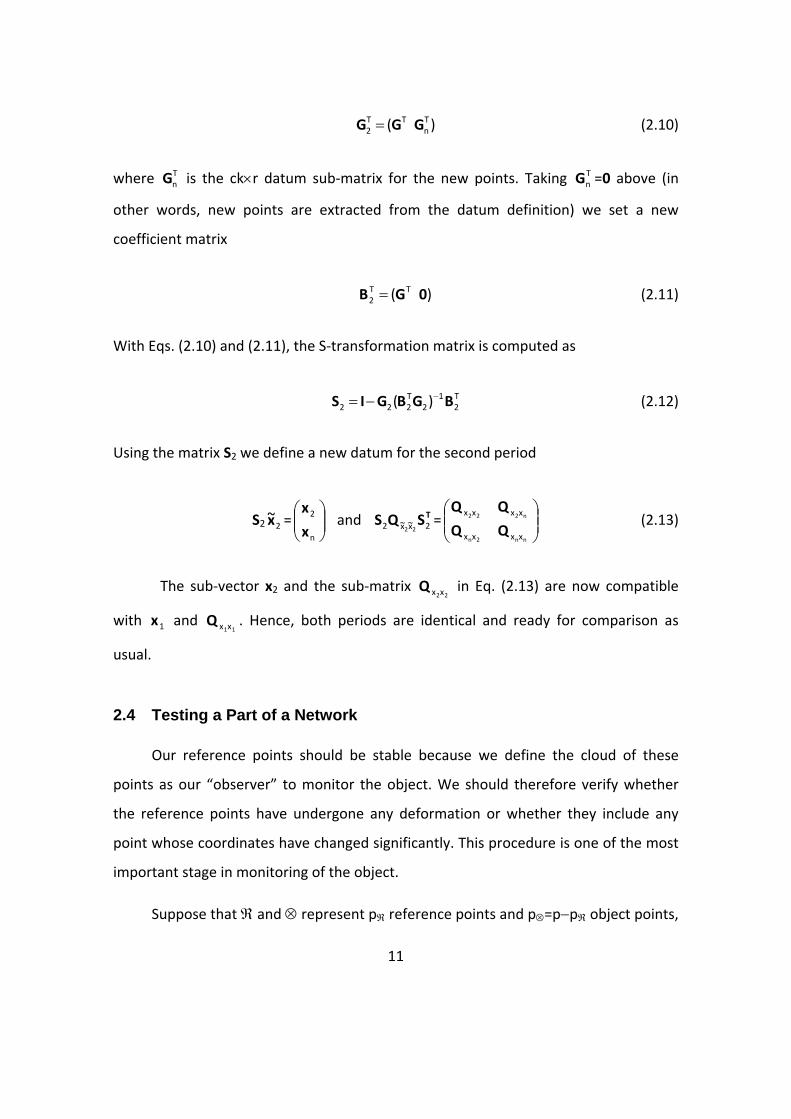
11
)( Tn
TT2 GGG = (2.10)
where TnG is the ck×r datum sub‐matrix for the new points. Taking T
nG =0 above (in
other words, new points are extracted from the datum definition) we set a new
coefficient matrix
)( TT2 0GB = (2.11)
With Eqs. (2.10) and (2.11), the S‐transformation matrix is computed as
T2
12
T222 )( BGBGIS −−= (2.12)
Using the matrix S2 we define a new datum for the second period
S2 2~x = ⎟⎟
⎠
⎞⎜⎜⎝
⎛
n
2
x
x and TSQS 2x~x~2 22
= ⎟⎟⎠
⎞⎜⎜⎝
⎛
nn2n
n222
xxxx
xxxx
QQ (2.13)
The sub‐vector x2 and the sub‐matrix 22xxQ in Eq. (2.13) are now compatible
with 1x and 11xxQ . Hence, both periods are identical and ready for comparison as
usual.
2.4 Testing a Part of a Network
Our reference points should be stable because we define the cloud of these
points as our “observer” to monitor the object. We should therefore verify whether
the reference points have undergone any deformation or whether they include any
point whose coordinates have changed significantly. This procedure is one of the most
important stage in monitoring of the object.
Suppose that ℜ and ⊗ represent pℜ reference points and p⊗=p−pℜ object points,
12
respectively. The displacement vector d and its cofactor matrix Qdd in Eq. (2.2) may be
written explicitly for these point groups as follows
⎟⎟⎠
⎞⎜⎜⎝
⎛=
⊗
ℜ
d
dd ~
~ , Qdd= ⎟⎟
⎠
⎞⎜⎜⎝
⎛
⊗⊗ℜ⊗
⊗ℜℜℜ
QQ~~
~~ (2.14)
To test the reference points first we should define the network datum according to
them. This may be realized by the following S‐transformation
⎟⎟⎠
⎞⎜⎜⎝
⎛==
⊗
ℜℜ d
ddSd , ddQ = ℜS Qdd
TℜS = ⎟⎟
⎠
⎞⎜⎜⎝
⎛
⊗⊗ℜ⊗
⊗ℜℜℜ
QQ (2.15)
where the transformation matrix ℜS is set as follows;
T1T )( BGBGIS −ℜ −= with )( TTT
⊗ℜ= GGG and )( TT 0GB ℜ= (2.16)
In the test, the sub‐vector ℜd and the sub‐matrix ℜℜQ in Eq. (2.15) are used: The test
statistic having F‐distribution, similar to the one in Eq. (2.4), is given as follows
f),F(hsh
T 2d
T
ℜℜ
ℜ+ℜℜℜ
ℜ ∼=dQd
(2.17)
where ℜh =h−c(p−pℜ)=rank ℜℜQ . The test statistic is compared with the threshold
value α−ℜ 1f,,hF ;
i) If ℜT < α−ℜ 1f,,hF , then our reference points are accepted as stable with α error.
ii) If ℜT ≥ α−ℜ 1f,,hF , there is at least one point whose coordinates has changed
significantly. In that case, we should find the responsible point(s) and
extract it (them) from the reference definition. One possible way for point

13
detection is adding each reference point one by one to the point cloud ⊗ in
Eq. (2.14) in each time and repeat the above test procedure for the
remaining reference points until the test statistic becomes smaller than the
corresponding threshold value. Other possible way is applying localization
procedure, which is given in Section 3.2.3.
Note 2.6: The degrees of freedom ℜh must be bigger than 0, i.e., ℜh ≥1. Since there
may be a significantly changed point among them, we should take into account
ℜh ≥2. This natural limitation gives information about the minimum number of
reference points (pℜ) for a network: From the inequality, we get
ℜh =h−c(p−pℜ)=cp−r−cp+cpℜ=cpℜ−r≥2.
Then we see that pℜ should be equal to (2+r)/c in a worst case. This means that our
absolute deformation networks (1, 2 or 3D) should be designed so that it consists of
approximately at least 3 reference points.

14
3. TESTING OBJECT POINTS
3.1 Testing Object Points in Absolute Deformation Networks
As we mentioned previously, an absolute deformation network has two parts;
reference points and object points. The reference points should be verified by the
global test given in Section 2.2 such that they can be defined as “observer” to monitor
the object.
Let our reference points ℜ be already verified as stable. Then, each object point
may be tested to learn whether its observed displacement relative to the reference
points is significant or not by using the following test statistic
i
T⊗ = 2d
1T
csiiii ⊗
−⊗⊗⊗ dQd
∼F(c,f) ∀i=1,…,p⊗ (3.1)
where
i⊗
d : c×1 ith object point’s displacement vector, which is the
corresponding sub‐vector of the object displacement vector ⊗d in Eq. (2.15),
ii⊗⊗Q : c×c cofactor matrix of the ith object point displacements,
which is the corresponding sub‐matrix of the object cofactor matrix ⊗⊗Q in Eq. (2.15) and
c : dimension of the corresponding network.
Each test statistic in Eq. (3.1) is compared with the threshold value α−1f,c,F ;

15
i) If i
T⊗ < α−1f,c,F , the corresponding displacement is not significant.
ii) If i
T⊗ ≥ α−1f,c,F , it is accepted that the corresponding displacement is
significant with 1−α confidence level.
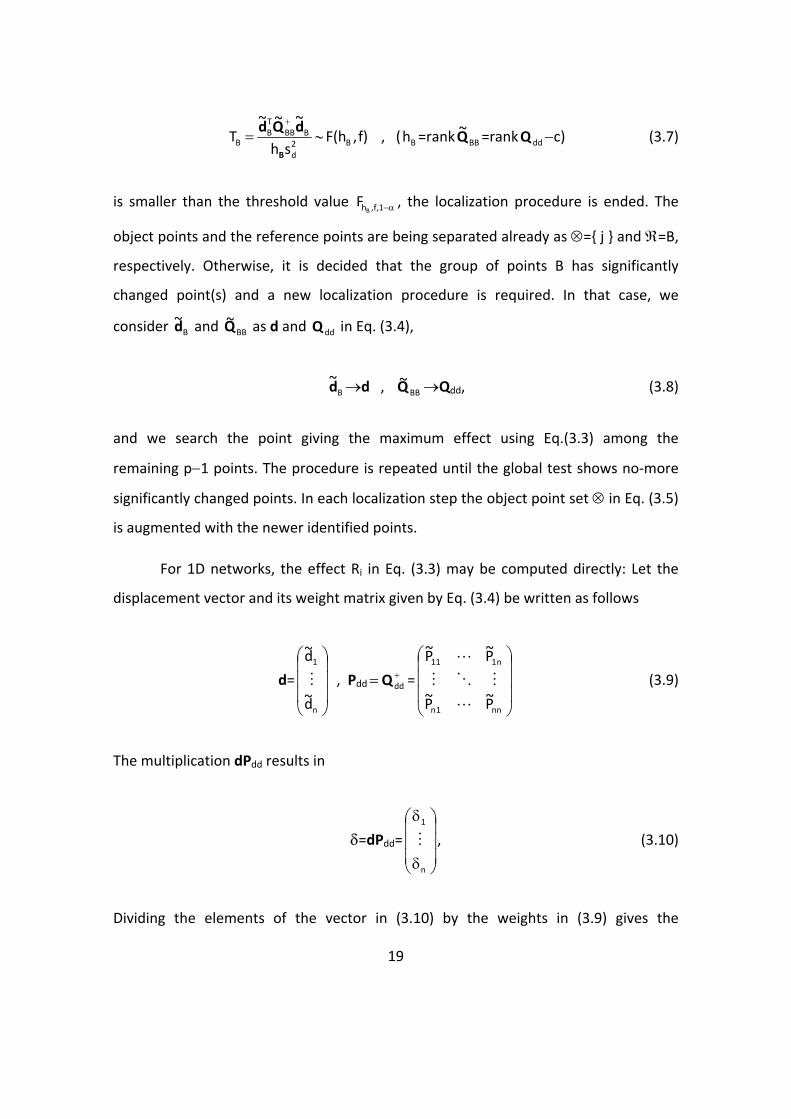
Note 3.1: The above given test procedure is equivalent to “relative confidence
interval/ellipse/ellipsoid” method applied in deformation analysis studies. For
example, let us consider 2D cases: First, the displacement vector (i⊗
d ) of a
corresponding point is plotted on a map and, then, the confidence ellipse obtained
from ii⊗⊗Q (this ellipse is called “relative” in deformation analysis) is centered on
the end point of the displacement vector (see Fig 3.1). If the displacement vector on
the plot remains outside of the ellipse, than this displacement of the corresponding
point is said to be significant with the preassumed probability of confidence level.
Fig 3.1. Displacement vector and relative confidence ellipse
Displacementvector
Relative confidence ellipse
Object point

16
For 1D networks, i.e., levelling and gravity monitoring networks, square root of
the test statistic i
T⊗ in Eq. (3.1) becomes t (Student)‐distributed, because of the
probability distribution function properties,
ii
iiii
i Qs
|d|
s
QdT
d2d
12
⊗⊗
⊗−⊗⊗⊗
⊗ == ∼t(f) (3.2)
where
i
d⊗ and ii
Q ⊗⊗ : the ith point’s displacement and its
cofactor, respectively
Note 3.2: If our reference points are verified as undeformed (stable) by the global
test in Section 2.4, this does not mean that we also verified that they has not moved
in time as a block. It means that the observed displacements of the object points
with the above testing procedure carry the relative effect of the reference points if
they has undergone a rigid body displacement. This fact may not be so important
for some studies, for instance in tectonic/velocity studies, which are mostly based
on some relative functions. However, for some cases, for example in damage
monitoring of engineering buildings, it may be a problematic issue because an
analysist may interprete mistakenly that the object is under a damaging force
system. To be clear and not to cause a wrong or over interpretation, two
different/independent relative blocks may be chosen in the studied area, if it is
possible. Depending on these two relative‐tested blocks two different results are
obtained for the object points. Then we may check our object’s displacements by
comparing two results. Of course, there will be some statistical unbalancies
between two results, but it may be ignorable effect compared to early or wrong
emergency alarm for a possible damage.

17
The threshold value is then taken as 2/1f,1f,,1c tF α−α−= = which denotes α‐percentage
point of the t‐distribution.
3.2 Localization
Localization is a procedure to identify the points having significant coordinate
changes. Mostly it is adapted in relative deformation networks to separate reference
points and object points, however it may be used also in absolute deformation
networks to detect the disturbing point(s) in the reference point set.
There are three localization methods commonly applied in deformation analysis;
i) Gauss‐elimination method
ii) Implicit hypothesis method
iii) S‐transformation method
We discuss only first two of them for relative deformation networks. Afterwards, the
localization procedure in absolute deformation networks by Gauss‐elimination method
is explained.
3.2.1 Localization with Gauss-elimination method
If the global test shows significantly changed points in our relative deformation
network, the next step is identifying or localizing these points. For each point in our c‐
dimensional network we compute the following effect values
Ri= i1
iiTi~ δδ −P with =iδ AiA
1iii
~~~~ dPPd −+ , (i=1,2,…,p) (3.3)
where
iδ : c×1 reduced displacement vector of the ith point,

18
i~d : c×1 displacement vector of the ith point
ii~P : c×c weight matrix belonging to the ith point (ith block
diagonal of += ddQP ),
A~d : (cp−c)×1 vector of displacements of the remaining points
denoted A not including the point i and,
iA~P : c×(cp−c) weight matrix between point i and the
remaining points (see Note 3.3).
The point resulting in maximum effect value by Eq. (3.3) is accepted as
significantly changed point. Let this point be the jth point. Then first object point is
being defined;
⊗= j (3.5)
Now we should define the datum of our network depending on the remaining
p−1 points. Let us denote these remaining points with B. Using the transformation
matrix SB defining the datum according to the points B, we obtain
⎟⎟⎠
⎞⎜⎜⎝
⎛=
⊗d
ddS ~
~B
B , BS QddTBS = ⎟⎟
⎠
⎞⎜⎜⎝
⎛
⊗⊗⊗
⊗
QQ~~
~~
B
BBB , (3.6)
Our next aim is to investigate the remaining points B. If the test statistic
Note 3.3: Displacement vectors and their weight matrices used in Eq.(3.3) may be
represented as
⎟⎟⎠
⎞⎜⎜⎝
⎛=
i~
~
d
dd A , Pdd += ddQ ⎟⎟
⎠
⎞⎜⎜⎝
⎛=
iiiA
iAAA
~~
~~
PP
PP (3.4)
19
f),F(hsh
~~~T B2
d
BBBTB
B ∼=+
B
dQd , ( Bh =rank BB
~Q =rank ddQ −c) (3.7)
is smaller than the threshold value α−1f,,hBF , the localization procedure is ended. The
object points and the reference points are being separated already as ⊗= j and ℜ=B,
respectively. Otherwise, it is decided that the group of points B has significantly
changed point(s) and a new localization procedure is required. In that case, we
consider B~d and BB
~Q as d and ddQ in Eq. (3.4),
B~d →d , BB
~Q →Qdd, (3.8)
and we search the point giving the maximum effect using Eq.(3.3) among the
remaining p−1 points. The procedure is repeated until the global test shows no‐more
significantly changed points. In each localization step the object point set ⊗ in Eq. (3.5)
is augmented with the newer identified points.
For 1D networks, the effect Ri in Eq. (3.3) may be computed directly: Let the
displacement vector and its weight matrix given by Eq. (3.4) be written as follows
d=⎟⎟⎟
⎠
⎞
⎜⎜⎜
⎝
⎛
n
1
d~
d~
M , Pdd += ddQ =⎟⎟⎟
⎠
⎞
⎜⎜⎜
⎝
⎛
nn1n
n111
P~P~
P~P~
L
MOM
L
(3.9)
The multiplication dPdd results in
δ=dPdd=⎟⎟⎟
⎠
⎞
⎜⎜⎜
⎝
⎛
δ
δ
n
1
M , (3.10)
Dividing the elements of the vector in (3.10) by the weights in (3.9) gives the
20
corresponding effect
Ri=δi/ iiP~ , (i=1,2,….,p) (3.11)
Hence, for 1D networks, the computation burden of Eq. (3.6) is drastically being
reduced.
3.2.2 Localization with implicit hypothesis method
Two periods’ Gauss‐Markov models are gained into a single Gauss‐Markov
model by Eq. (2.5) as
⎟⎟⎠
⎞⎜⎜⎝
⎛⎟⎟⎠
⎞⎜⎜⎝
⎛=
⎭⎬⎫
⎩⎨⎧
⎟⎟⎠
⎞⎜⎜⎝
⎛
2
1
2
1
2
1Ex
x
A0
0A
l
l , ⎟⎟
⎠
⎞⎜⎜⎝
⎛=
2
1
P0
0PP
Our hypothesis now assumes that the group of points A, which does not contain the
suspected point i, has not deformed. This hypothesis may be implicity incorporated
into the above Gauss‐Markov model as follows
⎟⎟⎟
⎠
⎞
⎜⎜⎜
⎝
⎛
⎟⎟⎠
⎞⎜⎜⎝
⎛=
⎭⎬⎫
⎩⎨⎧
⎟⎟⎠
⎞⎜⎜⎝
⎛
2i
1i
A
2i2A
1i1A
2
1E
x
x
x
A0A
0AA
l
l , ⎟⎟
⎠
⎞⎜⎜⎝
⎛=
2
1
P0
0PP (3.12)
Suppose that the solution of model (3.12) yields the weighted sum of the squared
residuals iH)(Ω iHTH )( Pvv= . Each point in the network is attained as i in model (3.12) in
turn, and we get p effects for the points in the network as follows
Ri=( HΩ )i−Ω , (i=1,2,…,p) (3.13)
If Rj belonging to the jth point is the minimum effect value among the others, this point
is accepted as the point with significant coordinate change. It is our first object point:

21
Then we may define the object point group ⊗ as
⊗= j (3.14)
Now we should learn whether the remaining p−1 points, denoted B, still consist
of any significantly changed points. For this we use the minimum deficiency Rj to set
the following test statistic
f),F(hsh
R
/f)(
)/h(RT B2
dB
jBjB ∼=
Ω= (3.15)
where hB=fH−f−c=h−c. If the test statistic in Eq. (3.15) is bigger than the corresponding
threshold value, i.e.
TB≥ α−1f,,hBF , (3.16)
we should identify the responsible point(s) among the group of points B. For the ith
point of B, we set our Gauss‐Markov model as follows;
⎟⎟⎟⎟⎟⎟
⎠
⎞
⎜⎜⎜⎜⎜⎜
⎝
⎛
⎟⎟⎠
⎞⎜⎜⎝
⎛=
⎭⎬⎫
⎩⎨⎧
⎟⎟⎠
⎞⎜⎜⎝
⎛
⊗
⊗⊗
⊗
2
1
2i
1i
D
222D
11i1D
2
1E
x
x
x
x
x
A0A0A
0A0AA
il
l , ⎟⎟
⎠
⎞⎜⎜⎝
⎛=
2
1
P0
0PP (3.17)
where
D : denotes the points except the ith point in B (D∪i=B)
⊗ : shows the object point identified in the previous localization step (we do not change of the place of ⊗ in Eq. (3.17) during the all localization steps anymore).
Now in the second localization step, each point in B is attained as i in Eq. (3.17)
B
22
by turn and the effects of all p−1 points are computed as realized by Eq. (3.13). The
point giving minimum effect is taken as the new object point and we update our object
point definition ⊗ in Eq. (3.14). If the global test, which is set according to the effect of
the point identified in that second localization step (hB becomes h−2c), shows more
suspected points among the remaining points, similarly we continue localizing these
points. The procedure is repeated until the corresponding global test shows no‐more
significantly changed point in the network.
3.2.3 Localization in absolute deformation networks
If the global test in Section 2.4 results in that our reference points ℜ is not
stable, we should identify the changed point(s) among them. One way for doing this is
applying localization procedure to the reference points: For this we consider ℜd and
ℜℜQ belonging to the pℜ reference points in Eq. (2.15) as d and Qdd in (3.4),
ℜd →d , ℜℜQ →Qdd (3.18)
and we start localization procedure with Eq. (3.3) to identify the responsible point(s)
among pℜ reference points. The localization procedure is similarly realized until the
corresponding global test shows that remaining reference points have no any points
disturbing the stability of our reference. The identified points are removed from the
reference point set and added to the object points.

23
4. SENSITIVITY ANALYSIS
Sensitivity analysis is used to optimize a deformation network such that it
becomes sensitive to the expected displacement, movement or deformation or to
derive the minimum detectable displacement, movement or deformation parameter
for measuring the quality of our design.
In theory it can be adapted to all kind of changes to be monitored in a studied
area, however we express it just for displacements here.
4.1 Global Sensitivity Analysis
4.1.1 Optimization Criteria
The hypotheses given by Eq. (2.3) is originally set as
H0: E(d)=0 vs. H1: E(d)≠0=∆ (4.1)
where
∆ : u×1 vector of expected displacements.
Because we are now at the design stage, we know that the alternative
hypothesis H1 in Eq. (4.1) is true. In that case, second test statistic in Eq. (2.4) follows a
non‐central χ2‐distribution;
)(h,'~T 22d
ddT
λχσ
=+ dQd
(4.2)
24
where λ is the non‐centrality parameter computed from the vector of expected
displacements ∆ as follows;
2d
ddT
σ=λ
+ ∆∆ Q (4.3)
Once we obtain the non‐centrality parameter in Eq. (4.3), the power of the
global test, i.e., the probability of correcty accepting the true alternative hypothesis,
may be computable from the distribution function of the non‐central χ2‐distribution,
F(χ’2= 21h, α−χ ;h, λ), as
γ=1−F(χ’2= 21h, α−χ ;h, λ) (4.4)
The power of the test γ mathematically increases with increasing non‐centrality
parameter λ and with decreasing degrees of freedom h. It means that the power of
our test will be better for more precise network and less points (remember that h is
related with number of points in an identical network, i.e. h=u−r=cp−r).
Instead of computing the power of the test by Eq. (4.4), the non‐centrality
parameter is compared with a non‐centrality parameter giving a desired power of the
test γ0 and significance level α0. This parameter is called lower bound of the non‐
centrality parameter λ0 (see Table 4.1). If the following inequality is fulfilled,
λ≥λ0,h (4.5)
the network is defined as “sensitive to the expected displacements”. Otherwise, the
network is re‐designed such that it becomes sensitive.
25
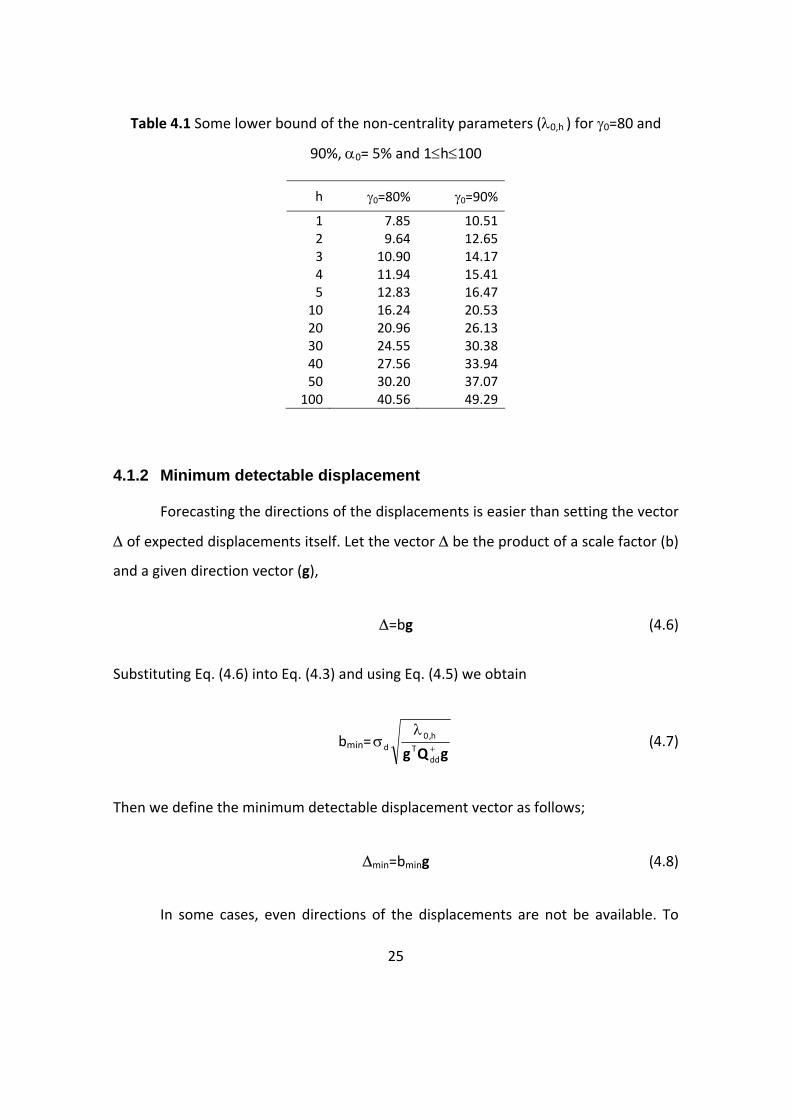
Table 4.1 Some lower bound of the non‐centrality parameters (λ0,h ) for γ0=80 and
90%, α0= 5% and 1≤h≤100
h γ0=80% γ0=90%
1 7.85 10.512 9.64 12.653 10.90 14.174 11.94 15.415 12.83 16.47
10 16.24 20.5320 20.96 26.1330 24.55 30.3840 27.56 33.9450 30.20 37.07
100 40.56 49.29
4.1.2 Minimum detectable displacement
Forecasting the directions of the displacements is easier than setting the vector
∆ of expected displacements itself. Let the vector ∆ be the product of a scale factor (b)
and a given direction vector (g),
∆=bg (4.6)
Substituting Eq. (4.6) into Eq. (4.3) and using Eq. (4.5) we obtain
bmin=gQg +
λσ
ddT
h,0d (4.7)
Then we define the minimum detectable displacement vector as follows;
∆min=bming (4.8)
In some cases, even directions of the displacements are not be available. To
26
obtain the minimum displacement vector in such a case, we use the eigen‐vector Λmax
belonging to the maximum eigen value λmax of Qdd. This results in the minimum value
of the scale factor
bmin=maxdd
Tmax
h,0d ΛΛ
λσ +Q
= maxh,0d λλσ (4.9)
Then, if we consider Eq. (4.9) in Eq. (4.8), we obtain the displacement vector which is
just detectable on the directions of the eigen‐vector with a specified power of the test
γ0 and significance level α0.
4.2 Sensitivity Analysis in Absolute Deformation Networks
Let our object points ⊗ be defined related to the reference points ℜ. The
hypotheses to test each object point are set follows;
H0: E(i⊗
d )=0 , H1: E(i⊗
d )≠0=i⊗∆ (4.10)
where i⊗∆ is the expected displacement vector of the ith object point.
Let us assume that our test statistic set for discriminating the hypotheses in Eq.
(4.10) is χ2‐distributed. Since we know that the alternative hypothesis is true now, the
Note 4.1: The direction vector g for leveling monitoring networks consists of “1” for
the uplifted points, “‐1” for the subsided points and “0” for stable points. In 2D
networks (or in a horizontal plane) it includes “cosθ” and “sinθ” where θ is the
forecasted azimuth of the displacement vector of the corresponding point.
27
test statistic has a non‐central χ2‐distribution;
i
T⊗ = 2d
1T
iiii
σ⊗
−⊗⊗⊗ dQd
∼χ’2(c, λi) (4.11)
where λi is the non‐centrality parameter,
λi= 2d
1T
iiii
σ⊗
−⊗⊗⊗ ∆∆ Q
. (4.12)
To learn whether our expected displacements for the ith point is detectable or
not, the non‐centrality parameter λi is compared with its boundary value λ0,c; If
λi≥λ0,c (4.13)
holds, the corresponding displacement is said to be detectable with the corresponding
power of the test.
To derive the minimum detectable displacement, we may follow the same
methodology given in the previous section. Instead of giving the formula for a specific
direction, we consider the eigenvector of the maximum eigen‐value imax,λ of ii⊗⊗Q .
Similar to Eq. (4.9), we obtain
(bmin)i= imax,c,0d λλσ =( dσ imax,λ ) c,0λ (4.14)
With this scale factor, the minimum detectable displacement vector of the ith point
becomes
min)(i⊗
∆ =(bmin)i imax,Λ (4.15)
28
where imax,Λ is the eigen‐vector belonging to the maximum eigenvalue imax,λ .
With the above‐mentioned simple statistics in two previous notes, one is able
to speak about the capacity of the designed network. The cofactor matrices of
displacements with respect to the reference points may easily be derived and the
pooled variance may be guessed depending on the experiences before any realization.
Then the minimum detectable displacement of an object point is about “3 times” of
the semi‐major axis of its relative confidence ellipse and displacement’s standard
deviation in 2D and 1D networks, respectively. If our expectation does not match with
Note 4.2: For 2D networks, first term of the right hand of Eq. (4.14), i.e., dσ imax,λ ,
is in fact the semi‐major axis of the relative error ellipse of the ith point. Then,
(bmin)i may be considered as the semi‐major axis of the relative error ellipse for the
power of the test (we may call this ellipse relative power ellipse!). Furthermore,
(4.15) shows that minimum detectable displacement is on the direction overlapped
with the direction of the relative error ellipse of the ith point. Then in 2D examples,
(bmin)i denotes the minimum detectable displacement magnitude of the
corresponding point. The boundary value is obtained as λ0,c=2=9.64 for 80% power
of the test from Table 4.1. It means that a displacement whose magnitude is 3.1
times of the semi‐major axis of the relative confidence ellipse may be just
detectable with 80% power of the test in an object point of an absolute
deformation network.
For 1D networks, imax,λ becomes equal to the displacement’s cofactor value of the
corresponding point. From Table 4.1 we read λ0,c=1=7.85 for 80% power of the test.
Then it is clear that a displacement (uplift or subsidence) may be just detectable
with 80% power, if its magnitude is 2.8 times of the displacement’s standard
deviation.

29
this magnitude, then we may re‐design our network such that its object points have
smaller ellipses or smaller standard deviations depending on the network type. For
example, let us assume that we expect 5 mm vertical movement in a region, and our
leveling network’s object points relative to a reference point set have around 2 mm
standard deviation in a period. Then the displacement’s standard deviation is expected
as 22 =2,8 mm. With 80% power (or more), the minimum detectable displacement is
around 3×2,8=8.4 mm. It means that we may not able to detect 5 mm movement with
80% power of the test using the corresponding design. For that reason, we should plan
additional observations or should measure the network with more precise levels to
improve the precision of our points. Such an optimization is called “trial and error”
method; but we may also set some analytical target functions to obtain a global
solution to this optimization problem. This is called “analytical optimization of
deformation networks”; however, nowadays, because of our improved computing
capabilities by normal PCs, trial and error methods may be more preferable. They are
more realistic because we may produce the problem depending on some experiments
which we may face with in reality. In analytical tools, sometimes, if we do not consider
the constraints realistically (it is a little bit hard to consider all conditions
mathematically!), the solution may go far away from the global solution and stop at a
local one, which may mislead the practitioner, or, which may cause an another
problem waiting for a different solution.
30
5. INTERPRETATION MODELS
After defining the reference points in our network, we may investigate the object
points’ movements and strain elements of some object blocks to interprete the motion
and the deformation of the object, respectively. For this we use kinematic model and
strain model. In this section we briefly explain these models used in deformation
analysis.
5.1 Kinematic Model
An object may change its position in time continuously related to a reference
frame. This motion is expressed by the following well‐known equation
x)t(t21
x)t(t)(t(t) 2000 &&& −+−+β=β (5.1)
where
t : current time,
t0 : initial time,
(t)β : current (present) position,
)(t0β : initial position,
x& : velocity and
x&& : acceleration.
If the parameters )(t0β , x& and x&& are available, one may predict the object’s
position in any period from Eq. (5.1). Reversely, if we have coordinates of the point in
31
different periods, we may estimate the parameters to create a model for the object’s
movement. This is called kinematic model in deformation analysis. To satisfy
redundancy in kinematic modelling, there should be at least 4 periods. Hereafter we
assume therefore that we have m≥4 periods.
5.1.1 Single point model for an object point’s movement
5.1.1.1 Model I
Now suppose that we work with a 1D network, or we would like to model only
one component of a point among its other components (as realized mostly for North,
East and Up components of a GNSS station). For this we set the following Gauss‐
Markov model from Eq. (5.1) having taken the initial period as t1 and partitioning the
initial (unknown) position )(t0β into two parts as )(t0β = δβ+β )(t1 ,
⎟⎟⎟
⎠
⎞
⎜⎜⎜
⎝
⎛δβ
⎟⎟⎟⎟⎟
⎠
⎞
⎜⎜⎜⎜⎜
⎝
⎛
−−
−−−−
=
⎪⎪⎭
⎪⎪⎬
⎫
⎪⎪⎩
⎪⎪⎨
⎧
⎥⎥⎥⎥
⎦
⎤
⎢⎢⎢⎢
⎣
⎡
x
x
)t(t5.0)t(t1
)t(t5.0)t(t1
)t(t5.0)t(t1
y
y
y
E
21m1m
21212
21111
m
2
1
&&
&MMMM
,
⎟⎟⎟⎟⎟
⎠
⎞
⎜⎜⎜⎜⎜
⎝
⎛
σ=
−
−
−
1mm
122
111
20
Q00
0Q0
00Q
L
MOMM
L
L
P (5.2)
where
iy : c×1 (diminished) coordinate component (observation), ( =iy )(t)(t 0i β−β ),
)(tiβ : coordinate component in the ith period,
δβ : unknown shift parameter,
x& : unknown velocity,
x&& : unknown acceleration,
20σ : a‐priori variance of unit weight and
Qii : cofactor value of the corresponding coordinate component.
32
5.1.1.2 Model II
For c‐dimensional networks, considering model (5.2) may cause over‐optimistic
results because in that case we neglect the correlations between the coordinate
components of a point. They are in fact highly correlated therefore they may be
considered in a single Gauss‐Markov model
⎟⎟⎟
⎠
⎞
⎜⎜⎜
⎝
⎛δ
⎟⎟⎟⎟⎟
⎠
⎞
⎜⎜⎜⎜⎜
⎝
⎛
−−
−−−−
=
⎪⎪⎭
⎪⎪⎬
⎫
⎪⎪⎩
⎪⎪⎨
⎧
⎥⎥⎥⎥
⎦
⎤
⎢⎢⎢⎢
⎣
⎡
x
x
III
III
III
y
y
y
&&
&MMMM
β
21m1m
21212
21111
m
2
1
)t(t5.0)t(t
)t(t5.0)t(t
)t(t5.0)t(t
E ,
⎟⎟⎟⎟⎟
⎠
⎞
⎜⎜⎜⎜⎜
⎝
⎛
σ=
−
−
−
1mm
122
111
20
Q00
0Q0
00Q
P
L
MOMM
L
L
(5.3)
where
iy : c×1 (diminished) coordinate (observation) vector ( =iy )(t)(t 1i ββ − ),
)(tiβ : c×1 coordinate vector,
I : c×c identity matrix,
βδ : c×1 unknown shift parameter vector,
x& : c×1 vector of unknown velocities,
x&& : c×1 vector of unknown accelerations along the corresponding axes,
20σ : a‐priori variance of unit weight and
iiQ : c×c cofactor matrix belonging to the corresponding point in the ith period.
5.1.1.3 Model III
In some cases previous two models may not yield satisfactory estimates
because of some unmodelled physical effects on the coordinates. They are mostly
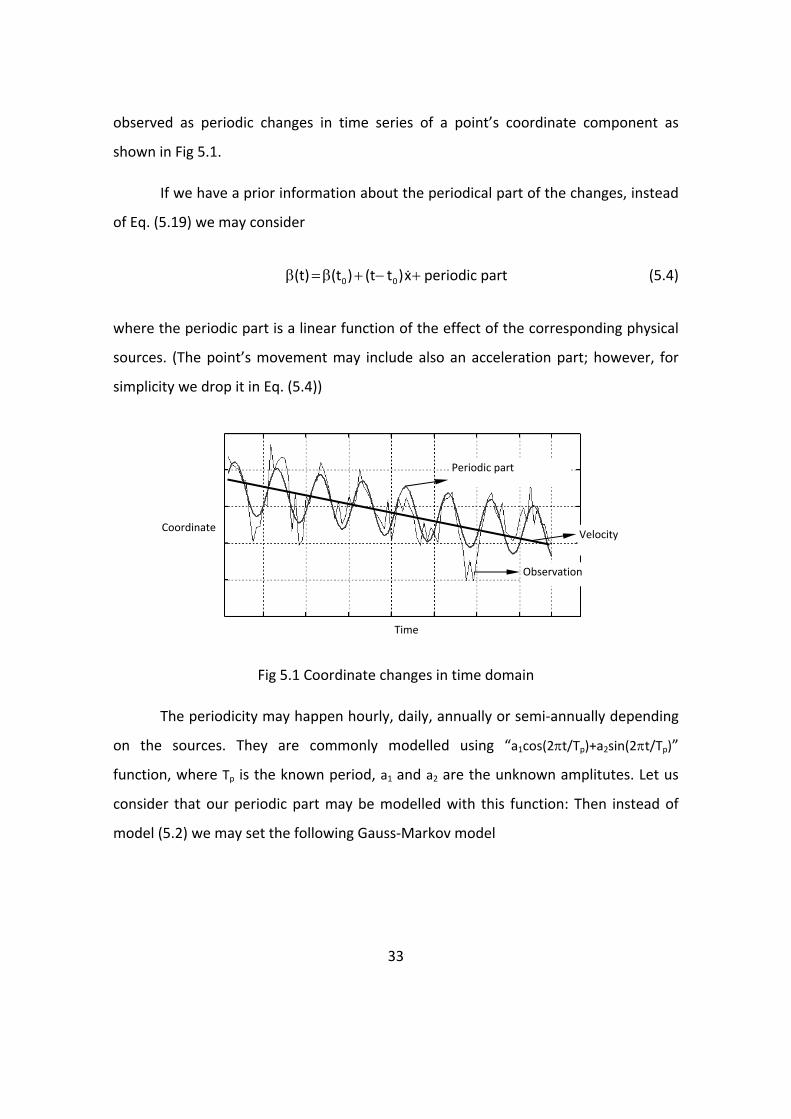
33
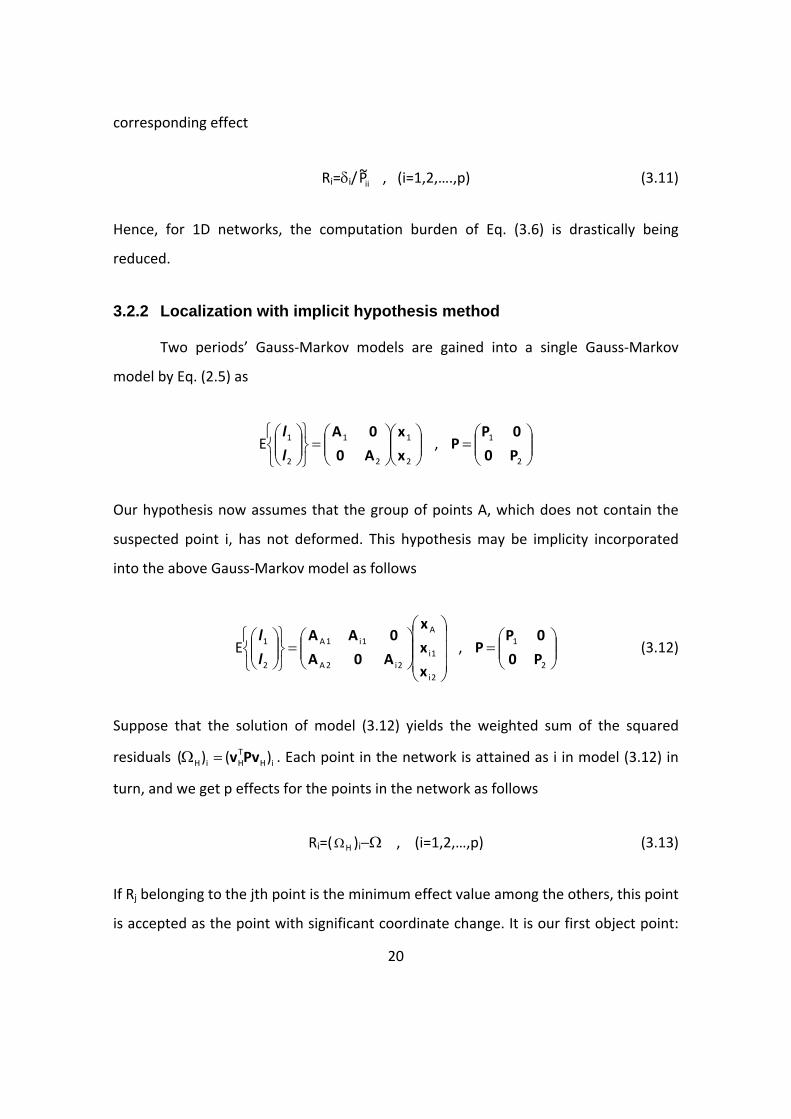
observed as periodic changes in time series of a point’s coordinate component as
shown in Fig 5.1.
If we have a prior information about the periodical part of the changes, instead
of Eq. (5.19) we may consider
+−+β=β x)t(t)(t(t) 00 & periodic part (5.4)
where the periodic part is a linear function of the effect of the corresponding physical
sources. (The point’s movement may include also an acceleration part; however, for
simplicity we drop it in Eq. (5.4))
Fig 5.1 Coordinate changes in time domain
The periodicity may happen hourly, daily, annually or semi‐annually depending
on the sources. They are commonly modelled using “a1cos(2πt/Tp)+a2sin(2πt/Tp)”
function, where Tp is the known period, a1 and a2 are the unknown amplitutes. Let us
consider that our periodic part may be modelled with this function: Then instead of
model (5.2) we may set the following Gauss‐Markov model
Periodic part
Observation
Velocity
Time
Coordinate
34
⎟⎟⎟⎟⎟
⎠
⎞
⎜⎜⎜⎜⎜
⎝
⎛δβ
⎟⎟⎟⎟⎟
⎠
⎞
⎜⎜⎜⎜⎜
⎝
⎛
∆π∆π∆
∆π∆π∆∆π∆π∆
=
⎪⎪⎭
⎪⎪⎬
⎫
⎪⎪⎩
⎪⎪⎨
⎧
⎥⎥⎥⎥
⎦
⎤
⎢⎢⎢⎢
⎣
⎡
2
1
pmpmm
p2p22
p1p11
m
2
1
a
a
x
)/Tt2sin()/Tt2cos(t1
)/Tt2sin()/Tt2cos(t1
)/Tt2sin()/Tt2cos(t1
y
y
y
E&
MMMMM,…
…
⎟⎟⎟⎟⎟
⎠
⎞
⎜⎜⎜⎜⎜
⎝
⎛
σ=
−
−
−
1mm
122
111
20
Q00
0Q0
00Q
L
MOMM
L
L
P (5.5)
where =iy )(t)(t 0i β−β and it∆ =ti−t1.
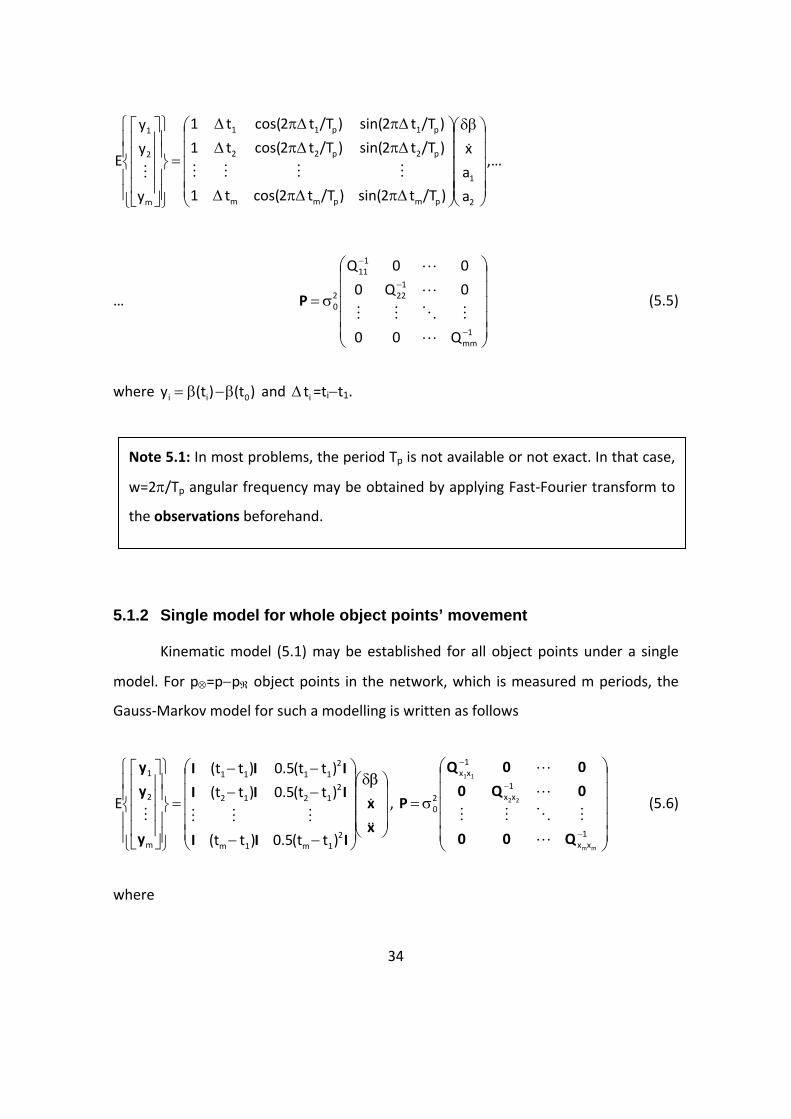
5.1.2 Single model for whole object points’ movement
Kinematic model (5.1) may be established for all object points under a single
model. For p⊗=p−pℜ object points in the network, which is measured m periods, the
Gauss‐Markov model for such a modelling is written as follows
⎟⎟⎟
⎠
⎞
⎜⎜⎜
⎝
⎛δ
⎟⎟⎟⎟⎟
⎠
⎞
⎜⎜⎜⎜⎜
⎝
⎛
−−
−−−−
=
⎪⎪⎭
⎪⎪⎬
⎫
⎪⎪⎩
⎪⎪⎨
⎧
⎥⎥⎥⎥
⎦
⎤
⎢⎢⎢⎢
⎣
⎡
x
x
III
III
III
y
y
y
&&
&MMMM
β
21m1m
21212
21111
m
2
1
)t(t5.0)t(t
)t(t5.0)t(t
)t(t5.0)t(t
E ,
⎟⎟⎟⎟⎟
⎠
⎞
⎜⎜⎜⎜⎜
⎝
⎛
σ=
−
−
−
1xx
1xx
1xx
20
mm
22
11
Q00
0Q0
00Q
P
L
MOMM
L
L
(5.6)
where
Note 5.1: In most problems, the period Tp is not available or not exact. In that case,
w=2π/Tp angular frequency may be obtained by applying Fast‐Fourier transform to
the observations beforehand.

35
iy : cp⊗×1 (diminished) coordinate (observation) vector for the ith period ( iy = 1i ββ − ),
iβ : cp⊗×1 coordinate vector of the ith period;
I : cp⊗×cp⊗ identity matrix,
βδ : cp⊗×1 unknown shift parameter vector,
x& : cp⊗×1 vector of unknown velocities,
x&& : cp⊗×1 vector of unknown accelerations,
20σ : a‐priori variance of unit weight and
iixx
Q : cp⊗×cp⊗ cofactor matrix belonging to the object points in
the ith period.
5.1.3 Testing model parameters
Before publishing the kinematic model of an object point, we should test its
parameters (mostly velocity and acceleration) to learn whether they are significant or
not. Testing procedure is therefore called significancy test.
Let us consider that the velocity estimate x& with standard deviation xs & is
desired to be tested; for this we set the following hypotheses
H0: E( x& )=0 , H1: E( x& )≠0 (5.7)
Then the test statistic follows t‐distribution
x
x s|x|
T&
&
&= ∼t(f) (5.8)
where f is the degrees of freedom of the corresponding model. If xT& < 2/1f,t α− , the
estimated value x& is not significant. Otherwise, it is accepted that it has a significant‐
physical meaning.
36
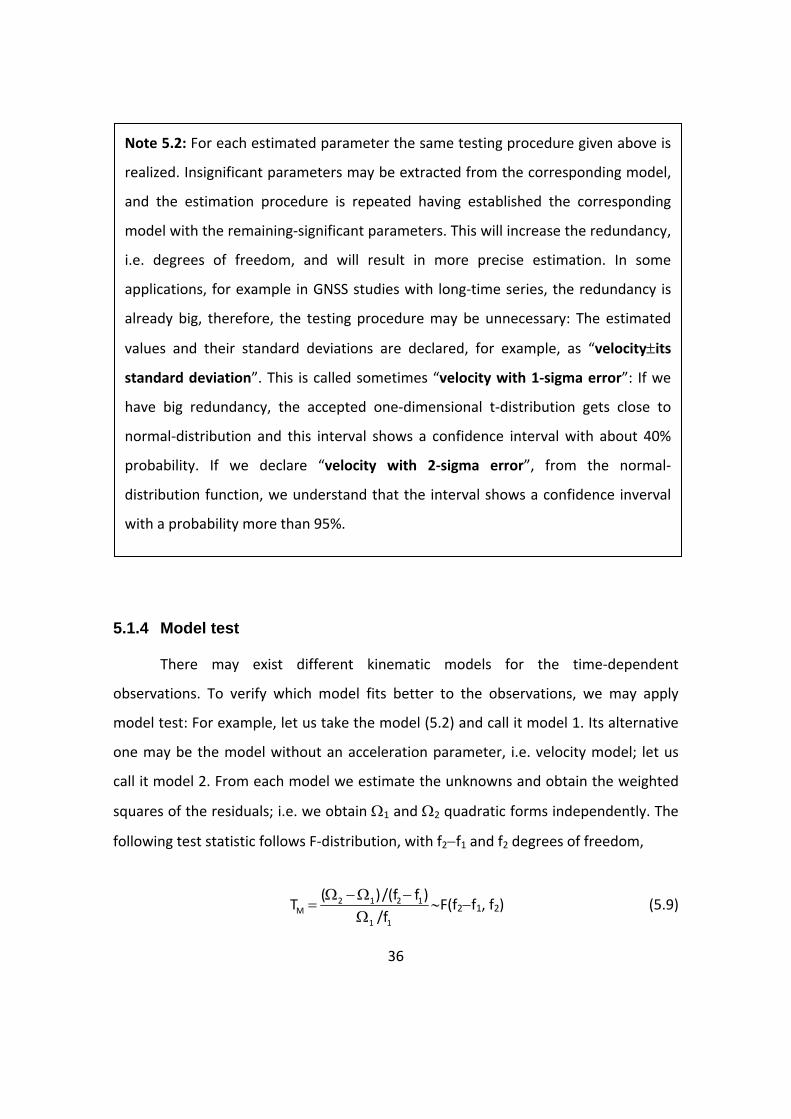
5.1.4 Model test
There may exist different kinematic models for the time‐dependent
observations. To verify which model fits better to the observations, we may apply
model test: For example, let us take the model (5.2) and call it model 1. Its alternative
one may be the model without an acceleration parameter, i.e. velocity model; let us
call it model 2. From each model we estimate the unknowns and obtain the weighted
squares of the residuals; i.e. we obtain Ω1 and Ω2 quadratic forms independently. The
following test statistic follows F‐distribution, with f2−f1 and f2 degrees of freedom,
11
1212M /f
)f/(f)(T
Ω−Ω−Ω
= ∼F(f2−f1, f2) (5.9)
Note 5.2: For each estimated parameter the same testing procedure given above is
realized. Insignificant parameters may be extracted from the corresponding model,
and the estimation procedure is repeated having established the corresponding
model with the remaining‐significant parameters. This will increase the redundancy,
i.e. degrees of freedom, and will result in more precise estimation. In some
applications, for example in GNSS studies with long‐time series, the redundancy is
already big, therefore, the testing procedure may be unnecessary: The estimated
values and their standard deviations are declared, for example, as “velocity±its
standard deviation”. This is called sometimes “velocity with 1‐sigma error”: If we
have big redundancy, the accepted one‐dimensional t‐distribution gets close to
normal‐distribution and this interval shows a confidence interval with about 40%
probability. If we declare “velocity with 2‐sigma error”, from the normal‐
distribution function, we understand that the interval shows a confidence inverval
with a probability more than 95%.
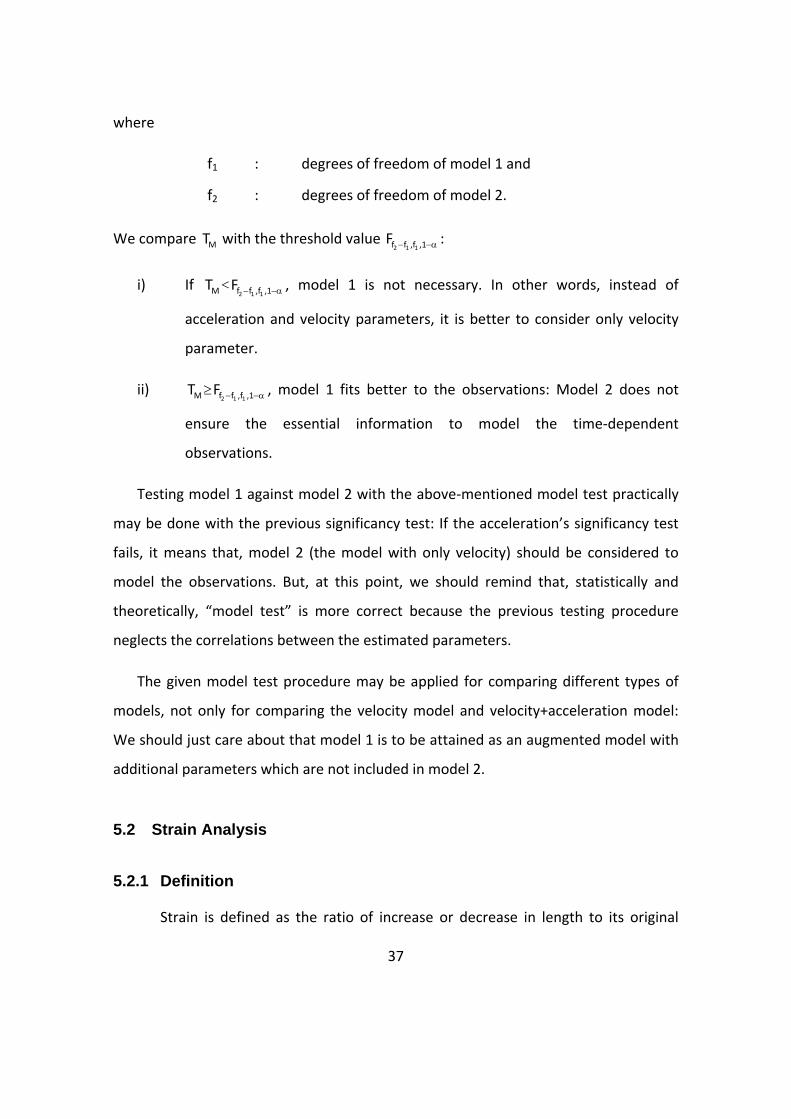
37
where
f1 : degrees of freedom of model 1 and
f2 : degrees of freedom of model 2.
We compare MT with the threshold value α−− 1,,fff 112F :
i) If MT < α−− 1,,fff 112F , model 1 is not necessary. In other words, instead of
acceleration and velocity parameters, it is better to consider only velocity
parameter.
ii) MT ≥ α−− 1,,fff 112F , model 1 fits better to the observations: Model 2 does not
ensure the essential information to model the time‐dependent
observations.
Testing model 1 against model 2 with the above‐mentioned model test practically
may be done with the previous significancy test: If the acceleration’s significancy test
fails, it means that, model 2 (the model with only velocity) should be considered to
model the observations. But, at this point, we should remind that, statistically and
theoretically, “model test” is more correct because the previous testing procedure
neglects the correlations between the estimated parameters.
The given model test procedure may be applied for comparing different types of
models, not only for comparing the velocity model and velocity+acceleration model:
We should just care about that model 1 is to be attained as an augmented model with
additional parameters which are not included in model 2.
5.2 Strain Analysis
5.2.1 Definition
Strain is defined as the ratio of increase or decrease in length to its original
38
length. It is a normalized measure for deformation. For instance, let us consider a wire
with L1=100 m length has extended to L2=100.02 m; then the engineering strain, the
so‐called nominal strain, is computed as follows
ε= 5
1
12 102100
10002.100LLL −×=
−=
− strain=20 µstrain=20 ppm.
This strain may be denoted as
ε1LdL
LengthOriginalntDisplaceme
==
(5.10)
On the other hand, scale factor λ, the so‐called stretch ratio, is related with the
engineering strain ε by
λ=1+ε (5.11)
which is the one commonly used in geodesy to explain the deformations of the
coordinate axes, for example in similarity and Affine transformations.
In two dimensional, instead of a single strain measure, there exists a strain
tensor,
⎟⎟⎠
⎞⎜⎜⎝
⎛∂∂∂∂∂∂∂∂
=⎟⎟⎠
⎞⎜⎜⎝
⎛εεεε
=ydy/ydy/
ydx/xdx/
yyyx
xyxxE (5.11)
where
dx and dy : displacements of a particle in the object in x and y directions.
Since we assume the object is continuum, i.e. the object is full of homogeneous
particles, the tensor elements in Eq. (5.11) represent the deformation of the whole
39
object. There are some other quantities obtained from the elements of this strain
tensor, such as,
Dilation (mean strain): εmean=21(εxx+εyy) (5.12a)
Pure shear: εpure=21(εxx−εyy) (5.12b)
Simple shear: εsimple=21(εxy+εyx) (5.12c)
Total shear: εshear = 2simple
2pure ε+ε = ( )2
yxxy2
yyxx )()(21
ε+ε+ε−ε (5.12d)
Differential rotation: ψ=21(εyx−εxy) (5.12e)
In earth sciences, instead of the strain tensor E, symmetrical strain tensor sE ,
which is derived from Eq. (5.11), is used;
⎟⎟⎠
⎞⎜⎜⎝
⎛εεεε
=⎟⎟⎠
⎞⎜⎜⎝
⎛εε+εε+εε
=yy
xx
yyyxxy
yxxyxxs 2/)(
2/)(
simple
simpleE (5.13)
To show the object deformation in 2D, principal strain components, i.e., the
eigenvalues of sE are derived from (5.13)
)4)((21 2
simple2
yyxxyyxxmax ε+ε−ε+ε+ε=ε =εmean+εshear (5.14a)
40
)4)((21 2
simple2
yyxxyyxxmin ε+ε−ε−ε+ε=ε =εmean−εshear (5.14b)
with the direction of the maximum principal axis, clockwise from x‐axis (see Note 5.3),
ϑ= =⎟⎟⎠
⎞⎜⎜⎝
⎛
ε−εε
yyxx
simple2atan
21
⎟⎟⎠
⎞⎜⎜⎝
⎛
εε
pure
simpleatan21
(5.14c)
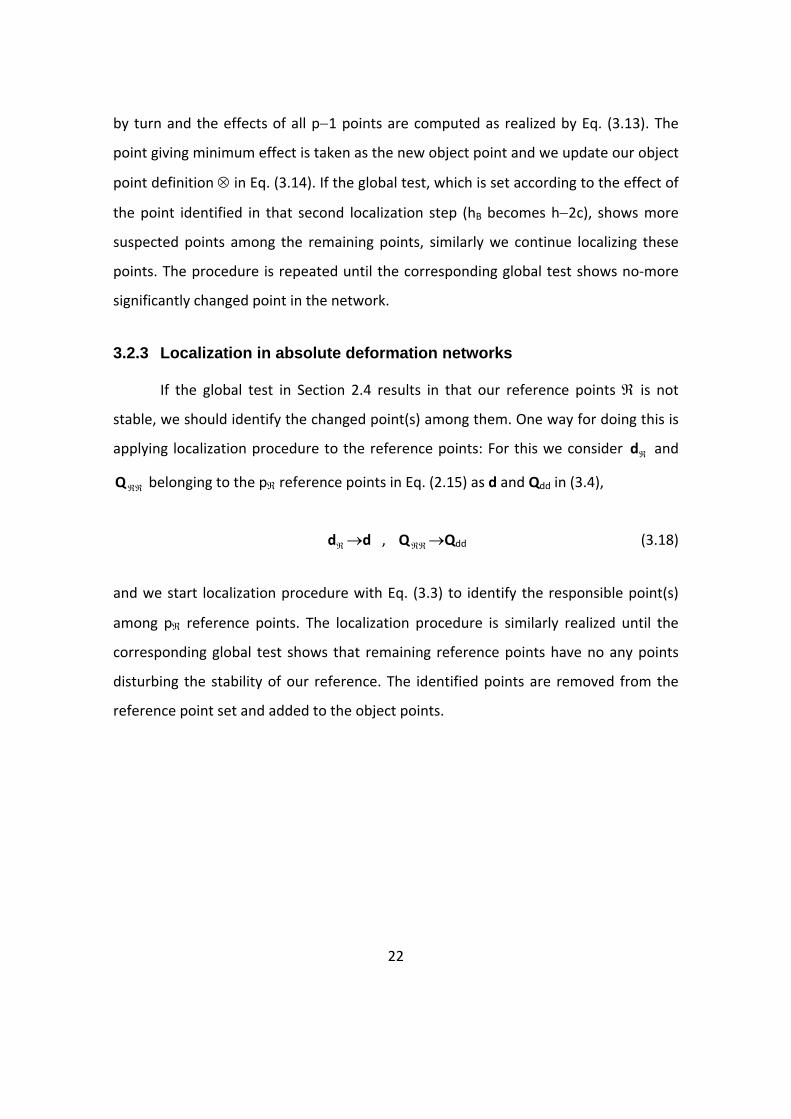
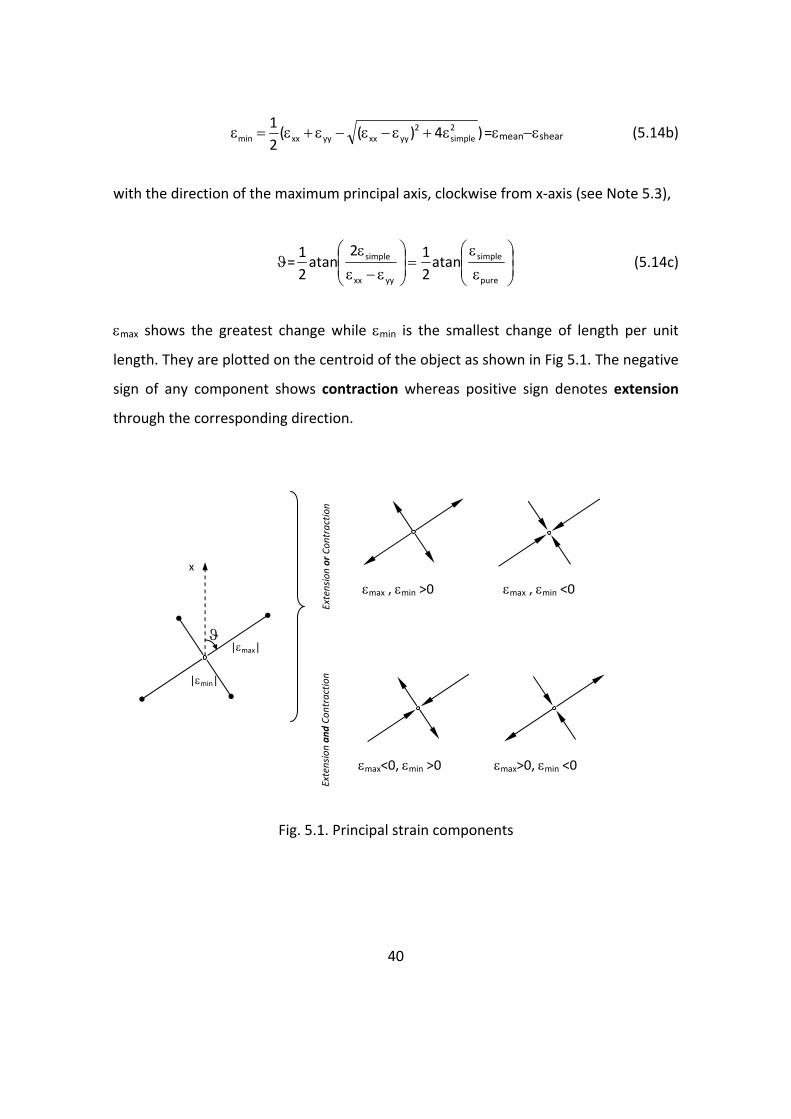
εmax shows the greatest change while εmin is the smallest change of length per unit
length. They are plotted on the centroid of the object as shown in Fig 5.1. The negative
sign of any component shows contraction whereas positive sign denotes extension
through the corresponding direction.
Fig. 5.1. Principal strain components
ϑ
x
|εmax|
|εmin|
εmax<0, εmin >0 εmax>0, εmin <0
Extension an
d Co
ntraction
Extension or Con
tractio
n
εmax , εmin >0 εmax , εmin <0
41
5.2.2 Strain modelling in geodetic deformation analysis
For the ith object point having dxi and dyi displacements, we may write
dxi=tx+εxxxi+εxyyi and dyi=ty+εyxxi+εyyyi (5.15)
which are the fundamental equations for modelling strain of the corresponding object.
In addition to 4 strain parameters (εxx, εxy, εyx, εyy) we have two translation parameters
tx and ty in Eq. (5.15), therefore, to obtain these 6 parameters, mathematically we
need at least 3 points.
For modelling strain of the studied object, the structural properties of the
object should be known priorily. From such a prior information the object is divided
into the different blocks as demonstrated in Fig 5.2. For each block we consider
different strain model (see Note 5.4).
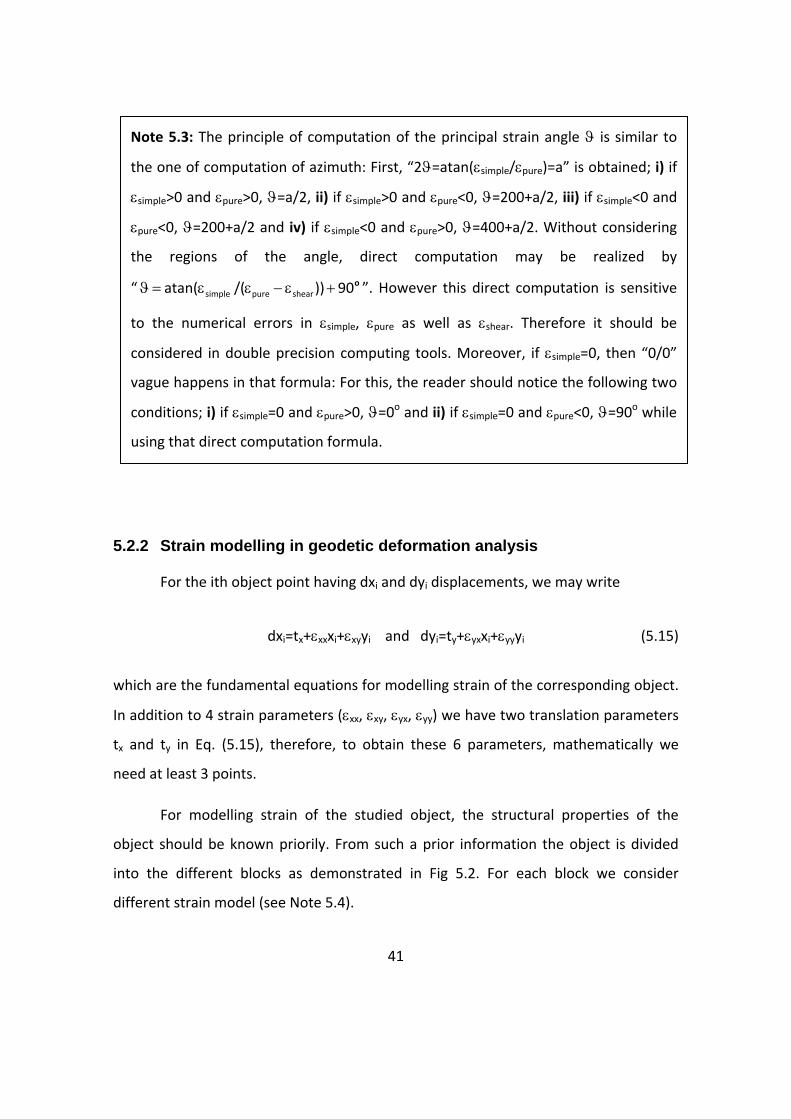
Note 5.3: The principle of computation of the principal strain angle ϑ is similar to
the one of computation of azimuth: First, “2ϑ=atan(εsimple/εpure)=a” is obtained; i) if
εsimple>0 and εpure>0, ϑ=a/2, ii) if εsimple>0 and εpure<0, ϑ=200+a/2, iii) if εsimple<0 and
εpure<0, ϑ=200+a/2 and iv) if εsimple<0 and εpure>0, ϑ=400+a/2. Without considering
the regions of the angle, direct computation may be realized by
“ o90))/(atan( shearpuresimple +ε−εε=ϑ ”. However this direct computation is sensitive
to the numerical errors in εsimple, εpure as well as εshear. Therefore it should be
considered in double precision computing tools. Moreover, if εsimple=0, then “0/0”
vague happens in that formula: For this, the reader should notice the following two
conditions; i) if εsimple=0 and εpure>0, ϑ=0o and ii) if εsimple=0 and εpure<0, ϑ=90o while
using that direct computation formula.

42
Fig 5.2. Object blocks and their principal strain components
Now suppose that our object consists of one block; then all object points are
included in a single strain model. For this, our Gauss‐Markov model is set as follows
⎟⎟⎟⎟⎟⎟⎟⎟
⎠
⎞
⎜⎜⎜⎜⎜⎜⎜⎜
⎝
⎛
εεεε
⎟⎟⎟⎟⎟⎟
⎠
⎞
⎜⎜⎜⎜⎜⎜
⎝
⎛
=
⎪⎪⎪
⎭
⎪⎪⎪
⎬
⎫
⎪⎪⎪
⎩
⎪⎪⎪
⎨
⎧
⎟⎟⎟⎟⎟⎟
⎠
⎞
⎜⎜⎜⎜⎜⎜
⎝
⎛
⊗⊗
⊗⊗
⊗
⊗
yy
yx
xy
xx
y
x
pp
pp
11
11
p
p
1
1 t
t
yx0010
00yx01
yx0010
00yx01
dy
dx
dy
dx
E MMMMMMM →Ed⊗=Mx (5.16a)
with the 2p⊗×2p⊗ matrix of weights of displacements,
Note 5.4: Object blocks should be considered at the design stage so that each block
has its own object points characterizing the deformation to be monitored. An
attempt for deciding object blocks considering only the observed displacements
may yield wrong interpretations.
After strain modelling
Object
Before realization
Block I
Block II
Object
43
P=
1
dydy
dydxdxdx
dydydxdydydy
dydxdxdxdydxdxdx
20
pp
pppp
m1p111
p1p11111
Q
QQQ
QQQQ−
⎟⎟⎟⎟⎟⎟⎟
⎠
⎞
⎜⎜⎜⎜⎜⎜⎜
⎝
⎛
σ
⊗⊗
⊗⊗⊗⊗
⊗
⊗⊗
MMO
L
L
→P= 20σ Q⊗⊗ (5.16b)
where
d⊗ and Q⊗⊗ : vector of displacements and its cofactor matrix belonging to the object points ⊗, respectively, from Eq. (2.15),
M : 2p⊗×6 coefficient matrix and
x : 6×1 unknown parameter vector.
Solving model (5.16) by least‐squares method, the parameter vector x is
estimated and so we get strain parameters εxx, εxy, εyx and εyy for the object. By using
them the principal strain parameters in Eq. (5.14) are obtained and they are plotted on
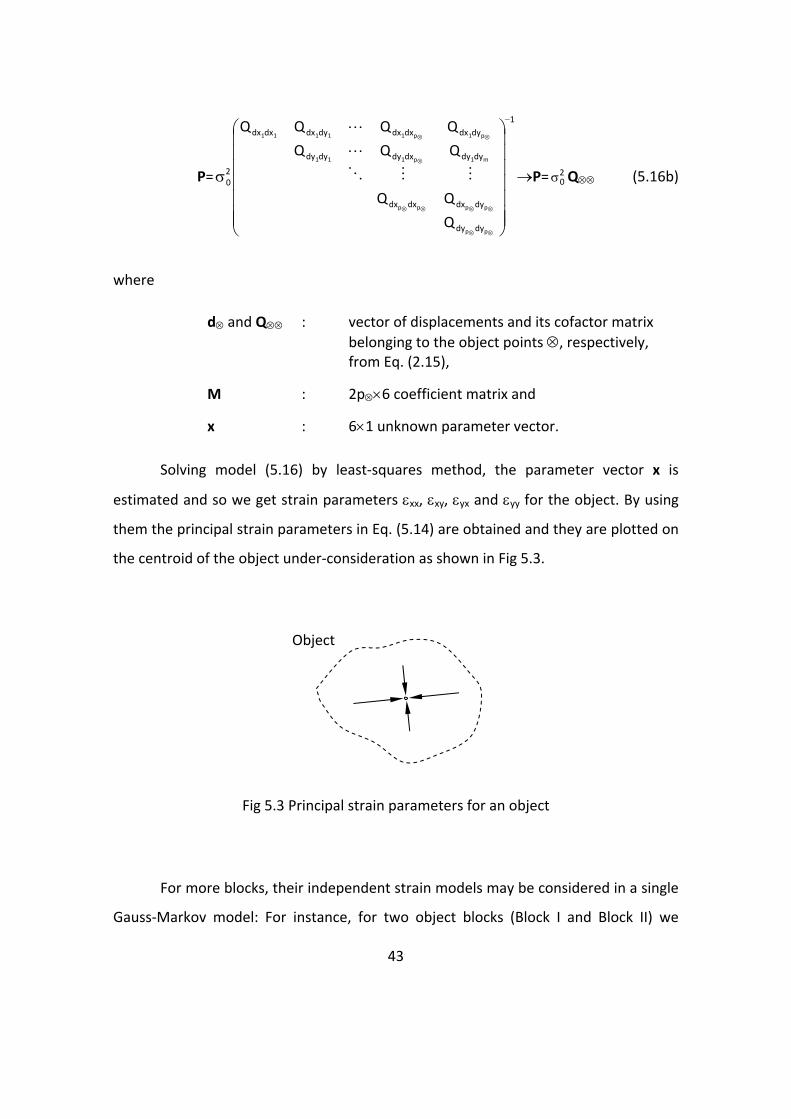
the centroid of the object under‐consideration as shown in Fig 5.3.
Fig 5.3 Principal strain parameters for an object
For more blocks, their independent strain models may be considered in a single
Gauss‐Markov model: For instance, for two object blocks (Block I and Block II) we
Object

44
establish the following Gauss‐Markov model;
⎟⎟⎠
⎞⎜⎜⎝
⎛⎟⎟⎠
⎞⎜⎜⎝
⎛=
⎪⎭
⎪⎬⎫
⎪⎩
⎪⎨⎧
⎟⎟⎠
⎞⎜⎜⎝
⎛
⊗
⊗
II
I
II
I
II
IEx
x
M
M
d
d
00
, 1
20
II
II
−
⊗⊗⊗⊗
⊗⊗⊗⊗
⎟⎟⎠
⎞⎜⎜⎝
⎛σ=
IIIII
III
QQP (5.17)
From the solution of model (5.17), we obtain xI and xII parameter vectors including the
blocks’ strain parameters.

45
APPENDIX A: GLOSSARY
Absolute deformation network: Mutlak deformasyon ağı
Acceleration: İvme
Block: Blok
Confidence level: Güven düzeyi
Contraction: Küçülme
Constraint equations: Koşul denklemleri
Current period: Mevcut periyot
Current time: Mevcut zaman
Deformation: Deformasyon
Degrees of freedom: Serbestlik derecesi
Diminished observation: Küçültülmüş ölçü
Direction vector: Yön vektörü
Displacement: Yerdeğişim
Extension: Genişleme
Gauss‐elimination method: Gauss‐eliminasyon yöntemi
Global test: Global test
Identical: Eşdeğer
Identity matrix: Birim matris
Implicit hypothesis method: Kapalı hipotez yöntemi
Initial period: Başlangıç periyodu
Initial time: Başlangıç zamanı
Kinematic model: Kinematik model
Localization: Yerelleştirme
Lower bound of the non‐centrality parameter: Dış merkezlik parametresinin sınır değeri
Minimum detectable displacement: Belirlenebilir en küçük yerdeğişim
Minimum constrained: Zorlamasız
Monitoring: İzleme
Model test: Model testi
Non‐central: Merkezsel olmayan
Non‐centrality parameter: Dış merkezlik parametresi
Non‐identical: Eşdeğer olmayan
Object: Nesne

46
Object block: Obje bloğu
Object point: Obje noktası
Partial trace minimum: Kısmi iz minimum
Period: Periyot
Pooled variance factor: Birleştirilmiş varyans çarpanı
Power of the test: Test gücü
Principal strain parameters: Asal gerinim parametreleri
Reference block: Referans bloğu
Reference point: Dayanak noktası
Relative confidence ellipse: Bağıl güven elipsi
Relative deformation network: Bağıl deformasyon ağı
Rotation: Dönüklük
Quadratic form: Karesel biçim
Sensitivity: Duyarlılık
Shift parameter: Sıfır eki
Significance level: Yanılma olasılığı
Significancy test: Anlamlılık testi
Significant: Anlamlı
Stable: Durağan
Strain: Gerinim
Strain tensor: Gerinim tensörü
Subsidence: Çökme
Test statistic: Test büyüklüğü
Threshold value: Karşılaştırma değeri
Trace minimum: Tüm iz minimum
Translation: Öteleme
Undeformed: Deforme olmamış
Uplift: Yükselme
Velocity: Hız

47
APPENDIX B: THRESHOLD VALUES (F and t‐distributions)
Table B1. Threshold values for F‐distribution (*) for α=5% (Fa,b,1‐α)
*) Square root of F value for a=1 and b in the first row yields tb,1‐α/2
1 2 3 4 5 6 7 8 9 10 20 30 40 50 60 70 80 90 100
1
2
3
4
5
6
7
8
9
10
20
30
40
50
60
70
80
90
100
161.45 18.51 10.13 7.71 6.61 5.99 5.59 5.32 5.12 4.96 4.35 4.17 4.08 4.03 4.00 3.98 3.96 3.95 3.94
199.50 19.00 9.55 6.94 5.79 5.14 4.74 4.46 4.26 4.10 3.49 3.32 3.23 3.18 3.15 3.13 3.11 3.10 3.09
215.71 19.16 9.28 6.59 5.41 4.76 4.35 4.07 3.86 3.71 3.10 2.92 2.84 2.79 2.76 2.74 2.72 2.71 2.70
224.58 19.25 9.12 6.39 5.19 4.53 4.12 3.84 3.63 3.48 2.87 2.69 2.61 2.56 2.53 2.50 2.49 2.47 2.46
230.16 19.30 9.01 6.26 5.05 4.39 3.97 3.69 3.48 3.33 2.71 2.53 2.45 2.40 2.37 2.35 2.33 2.32 2.31
233.99 19.33 8.94 6.16 4.95 4.28 3.87 3.58 3.37 3.22 2.60 2.42 2.34 2.29 2.25 2.23 2.21 2.20 2.19
236.77 19.35 8.89 6.09 4.88 4.21 3.79 3.50 3.29 3.14 2.51 2.33 2.25 2.20 2.17 2.14 2.13 2.11 2.10
238.88 19.37 8.85 6.04 4.82 4.15 3.73 3.44 3.23 3.07 2.45 2.27 2.18 2.13 2.10 2.07 2.06 2.04 2.03
240.54 19.38 8.81 6.00 4.77 4.10 3.68 3.39 3.18 3.02 2.39 2.21 2.12 2.07 2.04 2.02 2.00 1.99 1.97
241.88 19.40 8.79 5.96 4.74 4.06 3.64 3.35 3.14 2.98 2.35 2.16 2.08 2.03 1.99 1.97 1.95 1.94 1.93
248.01 19.45 8.66 5.80 4.56 3.87 3.44 3.15 2.94 2.77 2.12 1.93 1.84 1.78 1.75 1.72 1.70 1.69 1.68
250.10 19.46 8.62 5.75 4.50 3.81 3.38 3.08 2.86 2.70 2.04 1.84 1.74 1.69 1.65 1.62 1.60 1.59 1.57
251.14 19.47 8.59 5.72 4.46 3.77 3.34 3.04 2.83 2.66 1.99 1.79 1.69 1.63 1.59 1.57 1.54 1.53 1.52
251.77 19.48 8.58 5.70 4.44 3.75 3.32 3.02 2.80 2.64 1.97 1.76 1.66 1.60 1.56 1.53 1.51 1.49 1.48
252.20 19.48 8.57 5.69 4.43 3.74 3.30 3.01 2.79 2.62 1.95 1.74 1.64 1.58 1.53 1.50 1.48 1.46 1.45
252.50 19.48 8.57 5.68 4.42 3.73 3.29 2.99 2.78 2.61 1.93 1.72 1.62 1.56 1.52 1.49 1.46 1.44 1.43
252.72 19.48 8.56 5.67 4.41 3.72 3.29 2.99 2.77 2.60 1.92 1.71 1.61 1.54 1.50 1.47 1.45 1.43 1.41
252.90 19.48 8.56 5.67 4.41 3.72 3.28 2.98 2.76 2.59 1.91 1.70 1.60 1.53 1.49 1.46 1.44 1.42 1.40
253.04 19.49 8.55 5.66 4.41 3.71 3.27 2.97 2.76 2.59 1.91 1.70 1.59 1.52 1.48 1.45 1.43 1.41 1.39
b
a


