18
GEOG 458/558 Hazards and Risk Management Hurricanes Dr. Christine M. Rodrigue Department of Geography Environmental Science and Policy Program Emergency Services Administration
| Date post: | 16-Dec-2015 |
| Category: |
Documents |
| Upload: | gunner-corbridge |
| View: | 218 times |
| Download: | 2 times |
GEOG 458/558
Hazards and Risk Management
Hurricanes
Dr. Christine M. RodrigueDepartment of Geography
Environmental Science and Policy ProgramEmergency Services Administration

What Are Hurricanes? Tropical Cyclones, Typhoons, Chubascos
• They are extreme low pressure centers in the tropics, forming somewhere between about 5ºN/S and 30ºN/S
• They need Coriolis Effect to produce spiraling winds, so they are not found right on the equator
• They form out of the more common tropical weather feature called an “Easterly wave,” a low pressure trough in the Tropics that moves slowly westward and creates a day or two of rain
• If an Easterly wave passes over unusually warm ocean water, the trough deepens and deepens until it forms a circular pattern, becoming a tropical depression and then a tropical storm and then … a hurricane

Easterly Waves and Hurricanes:

What Is a Hurricane? Features
• They are circular centers of very low pressure, some falling below 920 hPa (as did Katrina). Sandy was ~ 945 hPa
• This low acts like a vacuum, drawing in winds at very high speeds (118-200+ km/h or 74-155+ mph)
• The uplift of these winds creates heavy rain through convergence and convection
• The storm is (usually) rather small, maybe 100-1,000 km in diameter (60-650 miles)
• They move rather slowly, around 25-30 km/h or 15-20 mph• Their greatest peculiarity is the eye: a small area of clear
or almost clear, quiet weather in the center (~30-60 km), which can last as much as an hour
• Wind reversal after the eye passes

Structure of a Hurricane: Winds spiral toward the center and are uplifted, creating rainbands and the eyewall. High altitude air in the center spirals out, but some
sinks in the center, creating the calm eye of the storm

Eyewall of a Hurricane: This is the massive band of cumulo-nimbus clouds surrounding the eye.
Winds race into them and are shot upwards, creating cooling, condensation, and massive amounts of precipitation … and the release
of latent heat, which only accelerates the uplift of this hot, extremely humid air. Katrina’s is the one on the right.

Dangerous Side of a Hurricane:on northeast side, hurricane travel speed adds to the storm’s speed

Power Source of a Hurricane:Hot ocean water evaporation + heating of air. Hot, humid air rises, sucking
winds into the storm. The colliding, rising air expands and cools below dew point, so all that water vapor condenses and precipitates. This liberates all the
latent heat of evaporation, which accelerates the original uplift. Hot ocean water = power source. Gulf of Mexico was hotter than 85oF (~30oC) as Katrina
crossed into it!

Hurricane Season:Since hurricanes depend on hot ocean water, there is a definite
hurricane season, running from June 1st to November 30th. There is a lag to allow the ocean waters to heat up enough after the spring
equinox and to cool down after the fall equinox, and to allow summer-heated waters to move away and cool along the Gulf Stream

Gloal Geography of Hurricanes: This is a hurricane mashup map of hurricane tracks from 1851 to 2005, showing the narrow band of origin, the westward tracking, the poleward
bend out at sea or ashore, and their absence along the equator
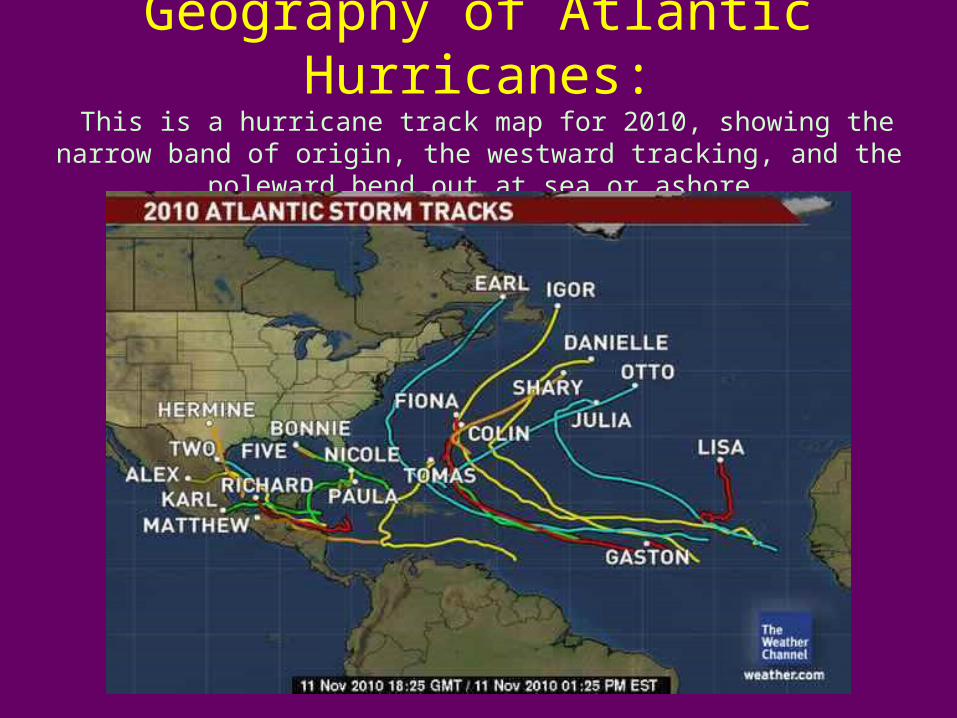
Geography of Atlantic Hurricanes: This is a hurricane track map for 2010, showing the narrow band of origin,
the westward tracking, and the poleward bend out at sea or ashore

Geography of Hurricane Hits in US: These are the continental states with “Hurricane Coast” exposure.

Multiple Hazards of a Hurricane
• Extreme winds, even worse on the “dangerous” side• Tornadoes are often spawned on the dangerous side• Lightning strikes• Water contamination (toxins, mosquito-borne diseases)• Freshwater flooding
– Torrential rains (which is what kills most people in hurricanes, e.g., the 10,000 who died in Hurricane Mitch back in 1998)
– Lake waves, as in Lac Pontchartrain, coming back at New Orleans from the northwest
• Saltwater flooding– High waves driven by high winds going over a long “fetch” for a
long time as the storm approaches– The storm surge
• A dome of water pulled up under the low pressure of the storm!• A wad of water bunched up by the dangerous side winds to the right
and front of the storm

Hurricane Storm Surge: The surge is a dome of water formed by hurricane low pressure and
sculpture by the spiraling winds. It can be 25 feet high and 1,000 miles in diameter. With high or low tides factored in, the storm surge creates a
storm tide. A 2 foot high tide + a 15 foot surge = 17 foot storm tide.
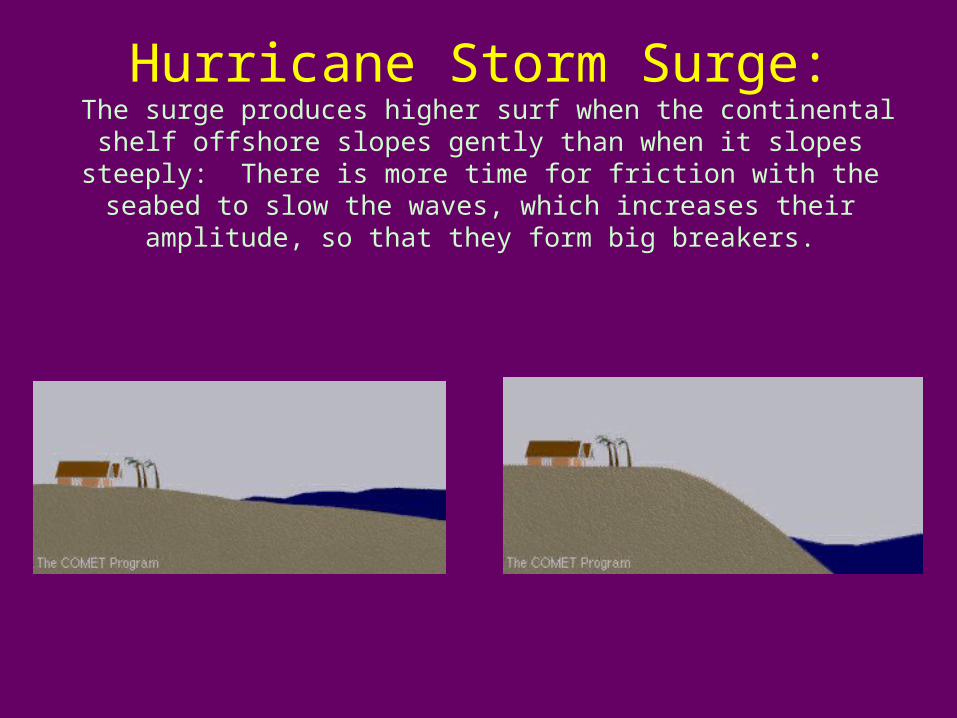
Hurricane Storm Surge: The surge produces higher surf when the continental shelf offshore
slopes gently than when it slopes steeply: There is more time for friction with the seabed to slow the waves, which increases their
amplitude, so that they form big breakers.
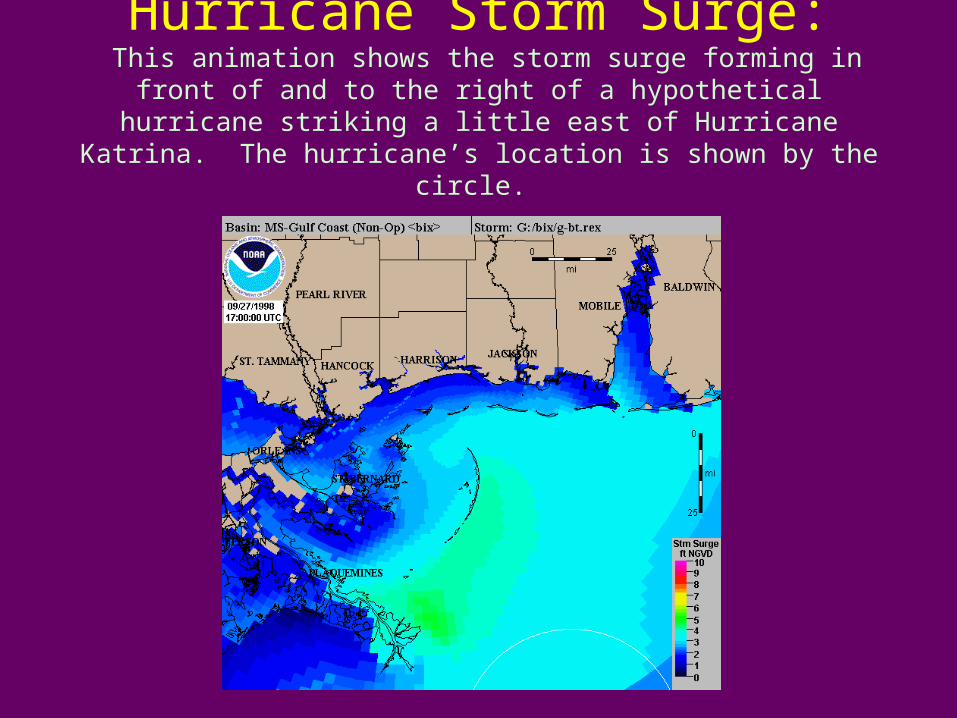
Hurricane Storm Surge: This animation shows the storm surge forming in front of and to the
right of a hypothetical hurricane striking a little east of Hurricane Katrina. The hurricane’s location is shown by the circle.

Hurricane Classification
• Classifying the size of an extreme natural event is a common goal of the various disaster sciences
• Classification can be done by magnitude, which measures the actual energy released in the event– Earthquake moment magnitude scale and the older Richter
scale measure energy release– Floods can be classified by discharge and expected recurrence
interval
• Classification can also be done by intensity, which groups events in terms of observed effects on humans and their assets– Modified Mercalli Intensity Scale for earthquakes– Saffir-Simpson Intensive Scale for hurricanes
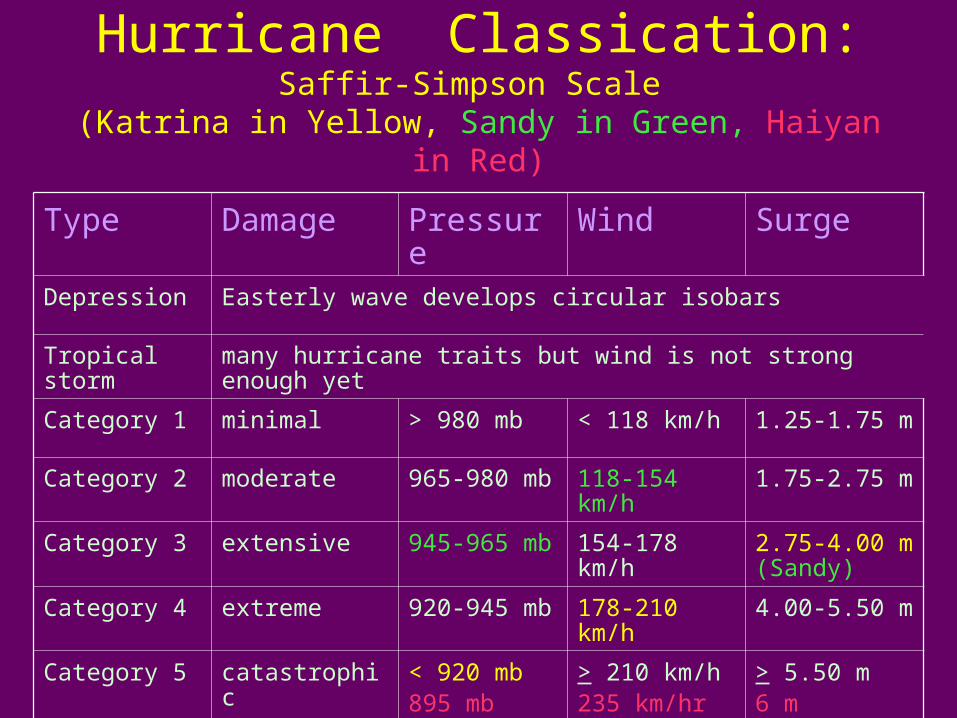
Hurricane Classication:Saffir-Simpson Scale
(Katrina in Yellow, Sandy in Green, Haiyan in Red)
Type Damage Pressure Wind Surge
Depression Easterly wave develops circular isobars
Tropical storm many hurricane traits but wind is not strong enough yet
Category 1 minimal > 980 mb < 118 km/h 1.25-1.75 m
Category 2 moderate 965-980 mb 118-154 km/h 1.75-2.75 m
Category 3 extensive 945-965 mb 154-178 km/h 2.75-4.00 m (Sandy)
Category 4 extreme 920-945 mb 178-210 km/h 4.00-5.50 m
Category 5 catastrophic < 920 mb895 mb
> 210 km/h235 km/hr
> 5.50 m6 m


