37
© Project Maths Development Team 2013 www.projectmaths.ie Page 1 of 37 GeoGebra Functions
© Project Maths Development Team 2013 www.projectmaths.ie Page 1 of 37
GeoGebra Functions
© Project Maths Development Team 2013 www.projectmaths.ie Page 2 of 37
Index
Activity Topic Page 1 Introduction GeoGebra Functions 3
2 To draw the function f(x)=x2 4
3 To change the colour, etc. of a graph of a function 5
4 To draw the graph of the quadratic function ( ) 5
5 To animate the above graph of the function using the slider a 7
6 To export an animated slide to PowerPoint 7
7 To investigate a quadratic of the form f(x)=a*(x+b)^2+c 8
8 To draw a section of a function 9
9 To show a function appearing bit by bit 9
10 Find where the graph of a function and a line meet 10
11 To draw the graph of a cubic function using sliders 11
12 Highlighting where one function is above another 11
13 Turning Points, Roots, Derivatives, Second Derivatives and Integrals
13
14 To demonstrate derivative and slope 14
15 Function Inspector Tool 16
16 Using the Function Inspector to demonstrate the derivative of a quadratic is linear
21
17 To transfer points from the Function Inspector to the Spreadsheet View
23
18 To demonstrate integration and area 24
19 Integration and the Trapezoidal rule 25
20 To find the area between the graph of a function and the x axis, where there is a section below and a section above the x axis
26
21 To demonstrate the average value of a function between 2 points
26
22 To draw the absolute value function 29
23 To draw ex, ln(x) and look at the (inverse) relationship between them
30
24 To change the x axis to radian measure and draw a trigonometric function
31
25 To change the x axis to degree measure and draw a trigonometric function
32
26 To plot data in the Spreadsheet View in the Graphics View 33
27 To fit a graph to a list of points that are shown on the Graphics View
33
Appendix A A1: How to save a file as a GeoGebra file A2: How to save a file as an interactive web page
34
Appendix B How to use the virtual Keyboard in GeoGebra
37

© Project Maths Development Team 2013 www.projectmaths.ie Page 3 of 37
Activity 1: Introduction GeoGebra Functions
To download GeoGebra go to www.geogebra.org and the following window will appear.
Click Free Software and the following window will appear.
Click the platform suitable for your computer and follow the indicated steps to download
GeoGebra.
Note: In order to run GeoGebra it is essential that an up to date version of Java is available
on your machine. This package is available at free at http://www.java.com/en/ .
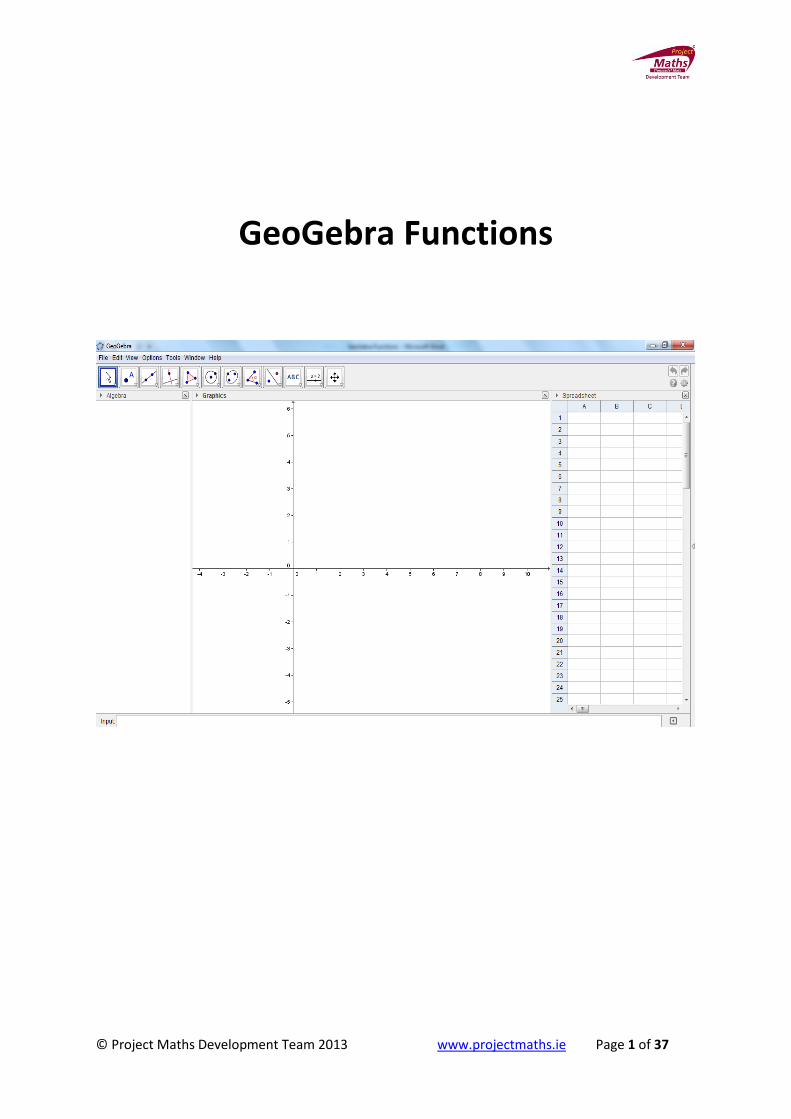
In GeoGebra there are three Views, Algebra, Graphics and Spreadsheet. The bar containing
File, Edit etc. is known as the Menu bar.

© Project Maths Development Team 2013 www.projectmaths.ie Page 4 of 37
Note: When you click on the Graphics View the following toolbar appears:
and when you click on the Spreadsheet View the following toolbar appears:
Note: If the Spreadsheet View is not visible go to View and click Spreadsheet and if the
Graphics View is not visible go to View and choose Graphics.
Note: When drawing a function use ( ) rather than because when is used
some of the commands from the Input Bar do not work for the function.
Activity 2: To draw the function f(x)=x2
1. Open GeoGebra.
2. In the Input Bar type ( ) and press Enter on the keyboard. Pressing the Shift
key and the 6 key simultaneously on the keyboard gets ^.
Graphics
Spreadsheet Algebra
Input Bar
© Project Maths Development Team 2013 www.projectmaths.ie Page 5 of 37
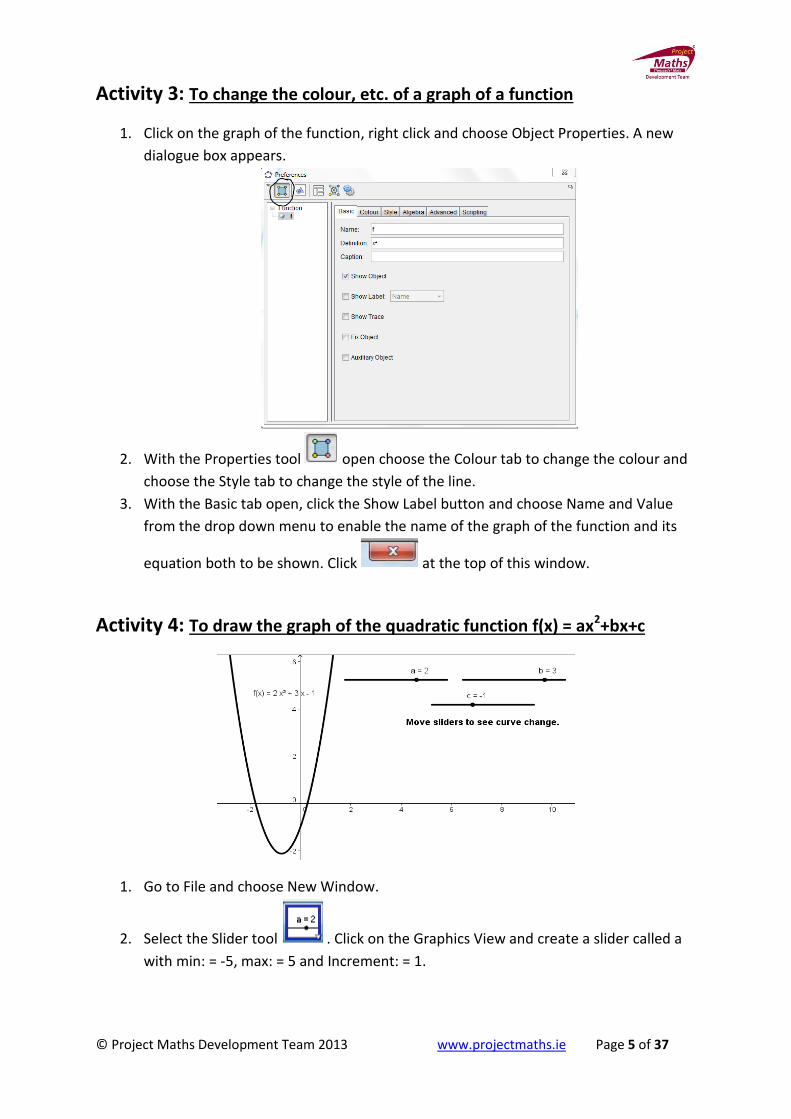
Activity 3: To change the colour, etc. of a graph of a function
1. Click on the graph of the function, right click and choose Object Properties. A new
dialogue box appears.
2. With the Properties tool open choose the Colour tab to change the colour and
choose the Style tab to change the style of the line.
3. With the Basic tab open, click the Show Label button and choose Name and Value
from the drop down menu to enable the name of the graph of the function and its
equation both to be shown. Click at the top of this window.
Activity 4: To draw the graph of the quadratic function f(x) = ax2+bx+c
1. Go to File and choose New Window.
2. Select the Slider tool . Click on the Graphics View and create a slider called a
with min: = -5, max: = 5 and Increment: = 1.
© Project Maths Development Team 2013 www.projectmaths.ie Page 6 of 37
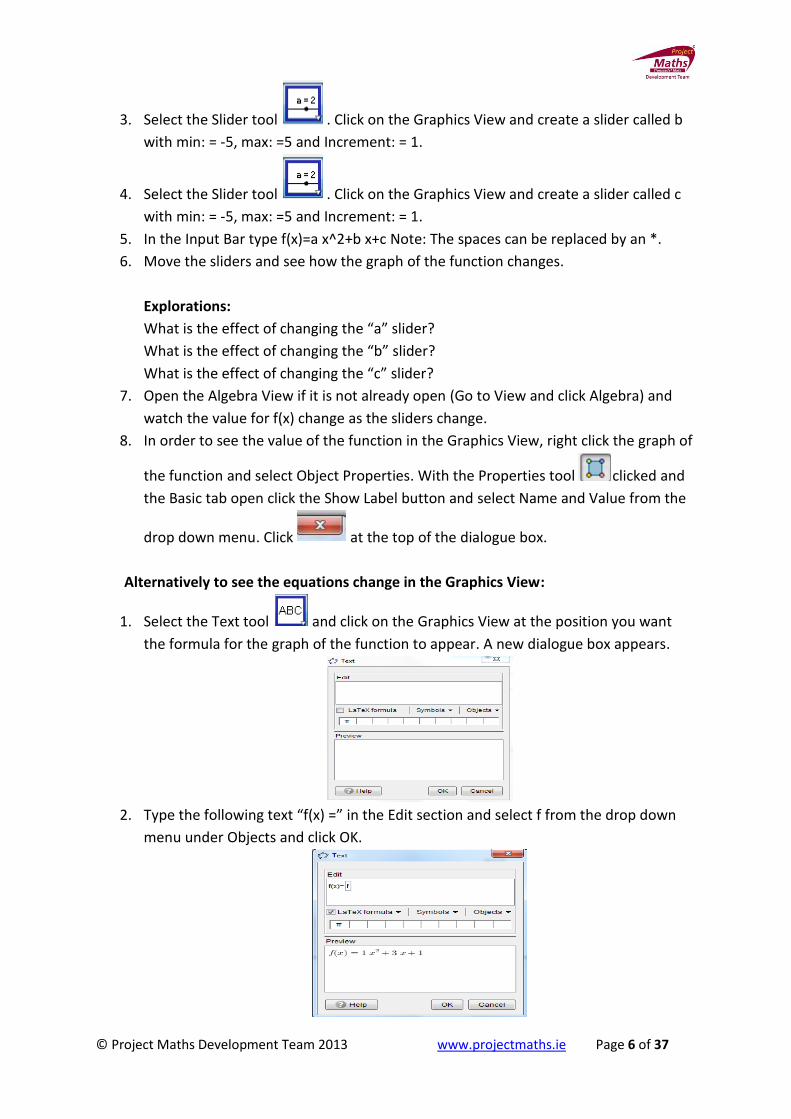
3. Select the Slider tool . Click on the Graphics View and create a slider called b
with min: = -5, max: =5 and Increment: = 1.
4. Select the Slider tool . Click on the Graphics View and create a slider called c
with min: = -5, max: =5 and Increment: = 1.
5. In the Input Bar type f(x)=a x^2+b x+c Note: The spaces can be replaced by an *.
6. Move the sliders and see how the graph of the function changes.
Explorations:
What is the effect of changing the “a” slider?
What is the effect of changing the “b” slider?
What is the effect of changing the “c” slider?
7. Open the Algebra View if it is not already open (Go to View and click Algebra) and
watch the value for f(x) change as the sliders change.
8. In order to see the value of the function in the Graphics View, right click the graph of
the function and select Object Properties. With the Properties tool clicked and
the Basic tab open click the Show Label button and select Name and Value from the
drop down menu. Click at the top of the dialogue box.
Alternatively to see the equations change in the Graphics View:
1. Select the Text tool and click on the Graphics View at the position you want
the formula for the graph of the function to appear. A new dialogue box appears.
2. Type the following text “f(x) =” in the Edit section and select f from the drop down
menu under Objects and click OK.

© Project Maths Development Team 2013 www.projectmaths.ie Page 7 of 37
Activity 5: To animate the above graph of the function using the slider a
1. Right click on slider a and choose Animation On.
2. A new icon will appear at the bottom left hand corner of the Graphics View. Click
on this icon to stop and start the animation.
Activity 6: To export an animated slide to PowerPoint
1. Make the GeoGebra file using a slider as normal. For example the slider a and the
function f(x) = a x+1.
2. Save the file, by going to File and Save As.
3. Go to File, Export and Graphics View as an Animated GIF. A new window appears.
4. Choose the slider you require to be animated by following the drop down menu
beside Slider. To enable the animation to continue infinitely click the As Loop box.
Choose the Time between Frames and click Export.
Note: The exporting of this gif can be slow.
5. Open PowerPoint and insert your picture in the usual way depending on the version
of PowerPoint you have.
6. View the slide show.

© Project Maths Development Team 2013 www.projectmaths.ie Page 8 of 37
Activity 7: To investigate a quadratic of the form f(x) = a*(x+b)^2+c
1. Go to File and choose New Window.
2. Select the Slider tool . Click on the Graphics View and create a slider called a
with min: = -5, max: = 5 and Increment: = 1.
3. Select the Slider tool . Click on the Graphics View and create a slider called b
with min: = -5, max: =5 and Increment: = 1.
4. Select the Slider tool . Click on the Graphics View and create a slider called c
with min: = -5, max: =5 and Increment: = 1.
5. In the Input Bar type f(x)=a(x+b)^2+c Press Enter on the keyboard.
6. Move the sliders and see how the graph of the function changes.
Explorations:
What is the effect of changing the “a” slider?
What is the effect of changing the “b” slider?
What is the effect of changing the “c” slider?
© Project Maths Development Team 2013 www.projectmaths.ie Page 9 of 37
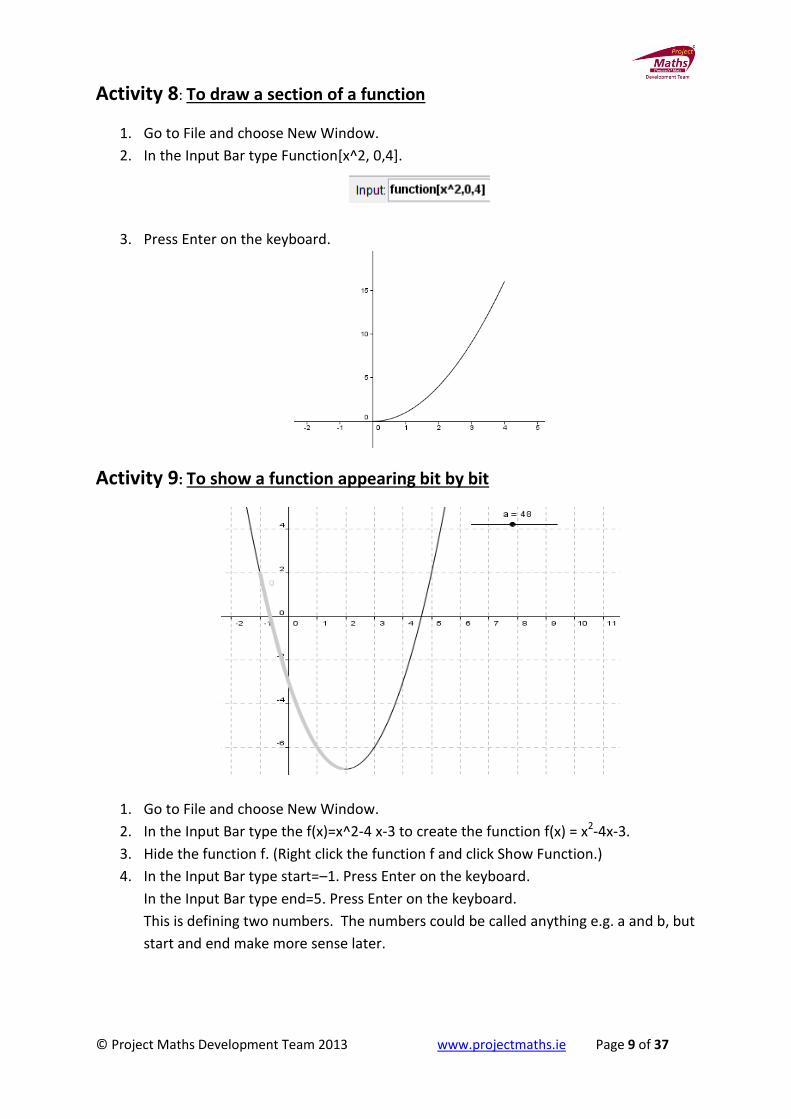
Activity 8: To draw a section of a function
1. Go to File and choose New Window.
2. In the Input Bar type Function[x^2, 0,4].
3. Press Enter on the keyboard.
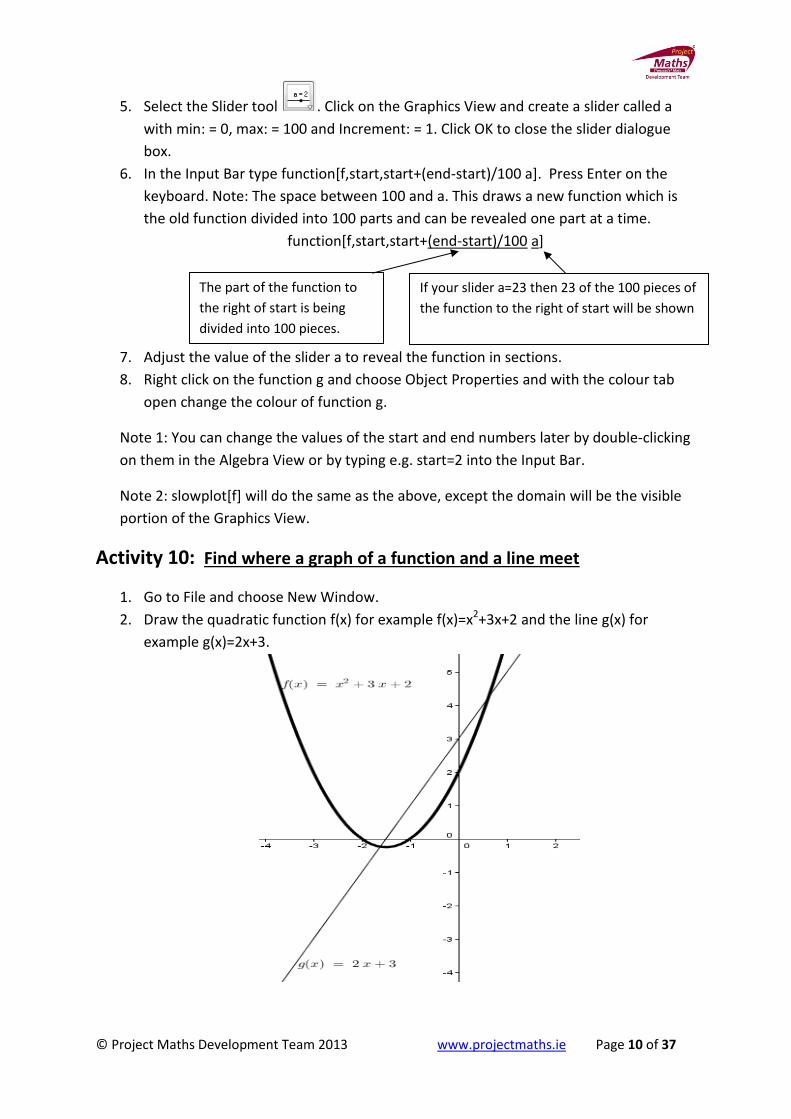
Activity 9: To show a function appearing bit by bit
1. Go to File and choose New Window.
2. In the Input Bar type the f(x)=x^2-4 x-3 to create the function f(x) = x2-4x-3.
3. Hide the function f. (Right click the function f and click Show Function.)
4. In the Input Bar type start=–1. Press Enter on the keyboard.
In the Input Bar type end=5. Press Enter on the keyboard.
This is defining two numbers. The numbers could be called anything e.g. a and b, but
start and end make more sense later.
© Project Maths Development Team 2013 www.projectmaths.ie Page 10 of 37
5. Select the Slider tool . Click on the Graphics View and create a slider called a
with min: = 0, max: = 100 and Increment: = 1. Click OK to close the slider dialogue
box.
6. In the Input Bar type function[f,start,start+(end-start)/100 a]. Press Enter on the
keyboard. Note: The space between 100 and a. This draws a new function which is
the old function divided into 100 parts and can be revealed one part at a time.
function[f,start,start+(end-start)/100 a]
7. Adjust the value of the slider a to reveal the function in sections.
8. Right click on the function g and choose Object Properties and with the colour tab
open change the colour of function g.
Note 1: You can change the values of the start and end numbers later by double-clicking
on them in the Algebra View or by typing e.g. start=2 into the Input Bar.
Note 2: slowplot[f] will do the same as the above, except the domain will be the visible
portion of the Graphics View.
Activity 10: Find where a graph of a function and a line meet
1. Go to File and choose New Window.
2. Draw the quadratic function f(x) for example f(x)=x2+3x+2 and the line g(x) for
example g(x)=2x+3.
The part of the function to
the right of start is being
divided into 100 pieces.
If your slider a=23 then 23 of the 100 pieces of
the function to the right of start will be shown

© Project Maths Development Team 2013 www.projectmaths.ie Page 11 of 37
3. Select the Intersect Two Objects tool . Click on the graph of the function and
the graph of the line to find their points of intersection.
Point(s) will appear at the intersection of the line and the graph of the function.
Another method is in the Input Bar type Intersect[f,g] and press Enter.
Activity 11: To draw the graph a cubic function using sliders
1. Go to File and choose New Window.
2. Select the Slider tool . Click on the Graphics View and create sliders a, b, c and
d.
3. In the Input Bar type f(x)=ax^3+bx^2+cx+d. Press Enter on the keyboard.
Note: If you already know the equation of the cubic for example f(x)=2x3+3x2+1x+1,
just type f(x)= 2x3+3x2+1x+1 into the Input Bar and press Enter on the keyboard. You
can also enter equations like f(x)=(x-2)(x+2)(x-1) in the Input Bar.
Activity 12: Highlighting where one function is above another function
1. Go to File and choose New Window.

© Project Maths Development Team 2013 www.projectmaths.ie Page 12 of 37
2. In the Input Bar type f(x)= x^3+2x^2–3x–1 to create the function
f(x) = x³+ 2x²–3x–1.
3. In the Input Bar type g(x)=x+4 to create the function g(x)=x+4.
4. Type Intersect[f,g] in the Input Bar and press Enter on the keyboard which creates
three points A, B and C. Alternatively use the Intersect Two Objects tool .
5. Type Function[f,x(A),x(B)] in the Input Bar.
A function called h(x) = x3+2x2-3x-1 now appears in the Dependant Objects list in the
Algebra View. Right click on h(x) in the Algebra View and change the colour of this to
blue and its line style to be thicker.
6. Input Function[f,x(C), ∞]
To type the symbol click the on the right hand side of the Input Bar and choose
.
A function called p(x) = x3+2x2-3x-1 now appears in the Dependant Objects list in the
Algebra View. Right click on h(x) in the Algebra View and change its colour and line
thickness to that of h(x).
7. Create a checkbox to show/hide h(x) and p(x). To do this select the Check Box to
Show /Hide Object tool . Click on the Graphics View and when the dialogue
box appears type in some suitable text and then from the drop down menu under
Select objects in construction or choose from list select h(x). Repeat this procedure
for a Tick box to show/hide p(x).
© Project Maths Development Team 2013 www.projectmaths.ie Page 13 of 37
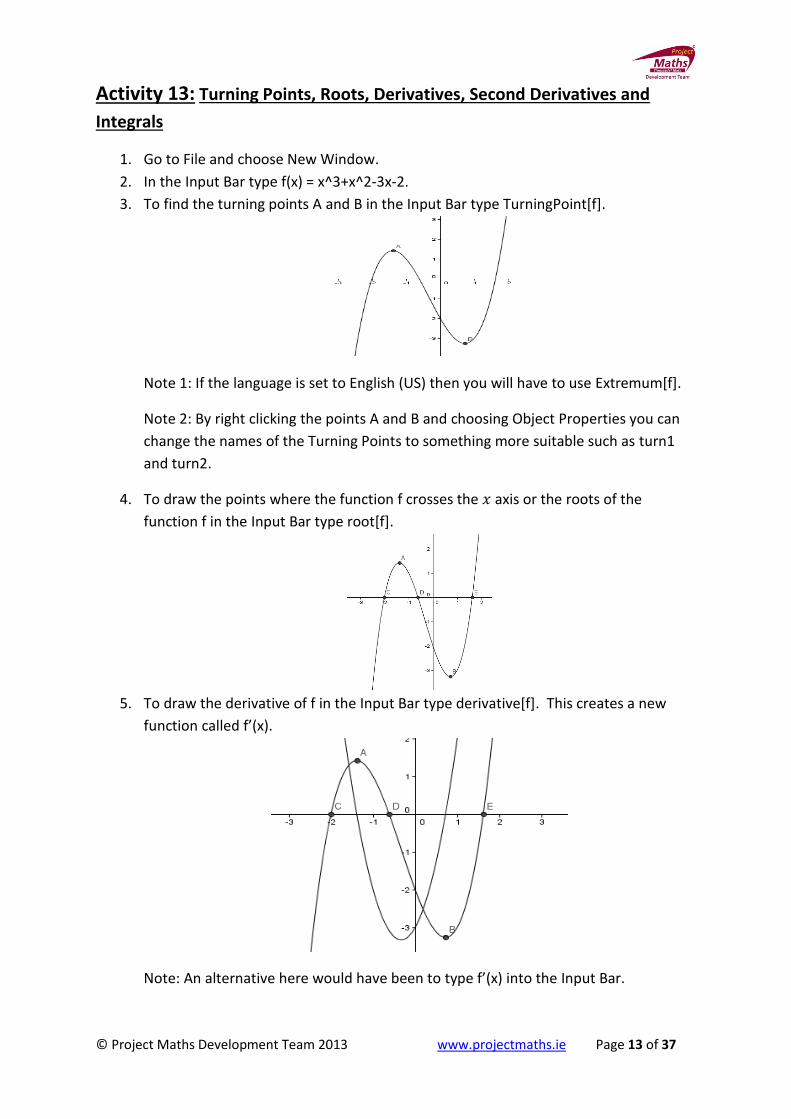
Activity 13: Turning Points, Roots, Derivatives, Second Derivatives and
Integrals
1. Go to File and choose New Window.
2. In the Input Bar type f(x) = x^3+x^2-3x-2.
3. To find the turning points A and B in the Input Bar type TurningPoint[f].
Note 1: If the language is set to English (US) then you will have to use Extremum[f].
Note 2: By right clicking the points A and B and choosing Object Properties you can
change the names of the Turning Points to something more suitable such as turn1
and turn2.
4. To draw the points where the function f crosses the axis or the roots of the
function f in the Input Bar type root[f].
5. To draw the derivative of f in the Input Bar type derivative[f]. This creates a new
function called f’(x).
Note: An alternative here would have been to type f’(x) into the Input Bar.
© Project Maths Development Team 2013 www.projectmaths.ie Page 14 of 37
6. If you wanted to compare f’(x) with f(x) then type root[f’]in the Input Bar and look at
the x values of the roots of f’(x) and the turning points of f(x).
7. To graph the second derivative of f in the Input Bar type derivative[f’]. This creates a
new function called f’’(x).
Note: An alternative here would have been to type f’’(x) into the Input Bar.
8. In the Input Bar type Integral[f’’]. This draws the integral of f’’(x) and names it g(x).
It is very similar to the graph of f’(x). f’(x)=3x2+2x-3 and g(x)= 3x2+2x.
Note 1: The integral[] command doesn’t add in the “c” bit of the integration.
Note 2: Use of colour and show/hide checkboxes can make things a little clearer
here.
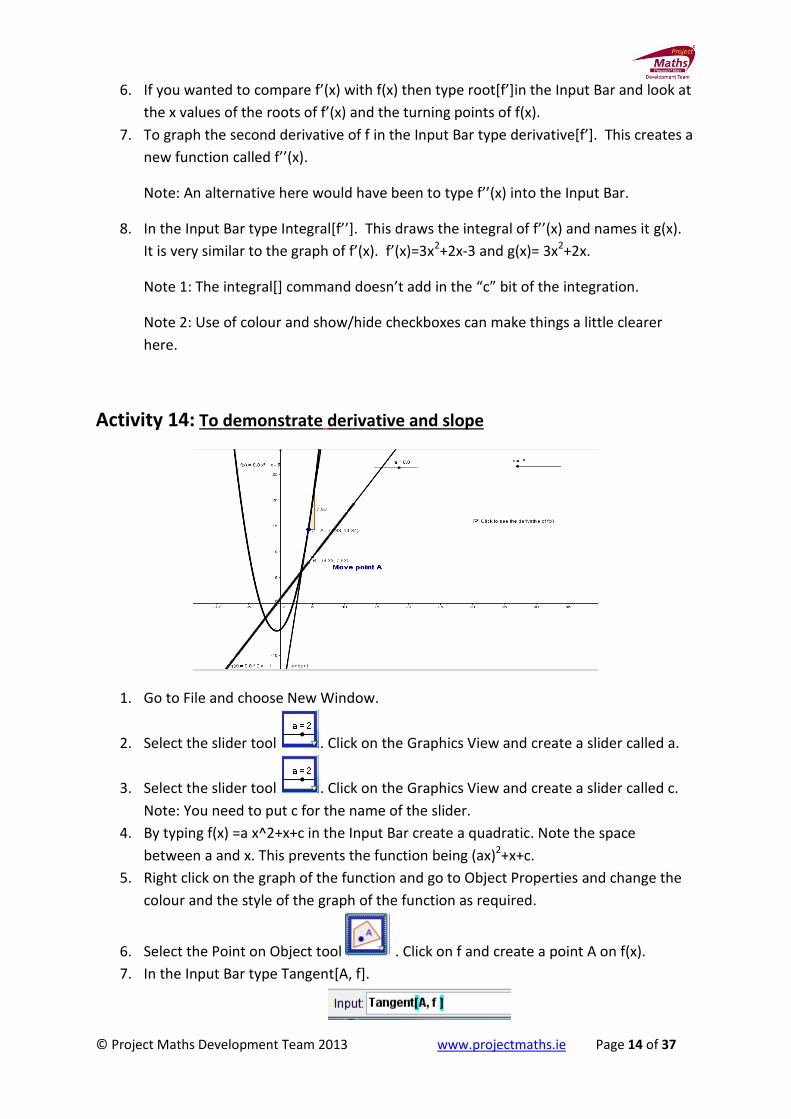
Activity 14: To demonstrate derivative and slope
1. Go to File and choose New Window.
2. Select the slider tool . Click on the Graphics View and create a slider called a.
3. Select the slider tool . Click on the Graphics View and create a slider called c.
Note: You need to put c for the name of the slider.
4. By typing f(x) =a x^2+x+c in the Input Bar create a quadratic. Note the space
between a and x. This prevents the function being (ax)2+x+c.
5. Right click on the graph of the function and go to Object Properties and change the
colour and the style of the graph of the function as required.
6. Select the Point on Object tool . Click on f and create a point A on f(x).
7. In the Input Bar type Tangent[A, f].

© Project Maths Development Team 2013 www.projectmaths.ie Page 15 of 37
8. To find the slope of the tangent at the point A. Select the Slope Tool . Click on
the Tangent.
9. To create a point B, type B=(x(A), m) in the Input Bar and press Enter on the
Keyboard.
10. Right click on the point B and click the Trace on. Move the point A.
11. In the Input Bar type f’(x). Note the relationship between the trace as you drag point
A and the graph of the function of f’(x).
© Project Maths Development Team 2013 www.projectmaths.ie Page 16 of 37
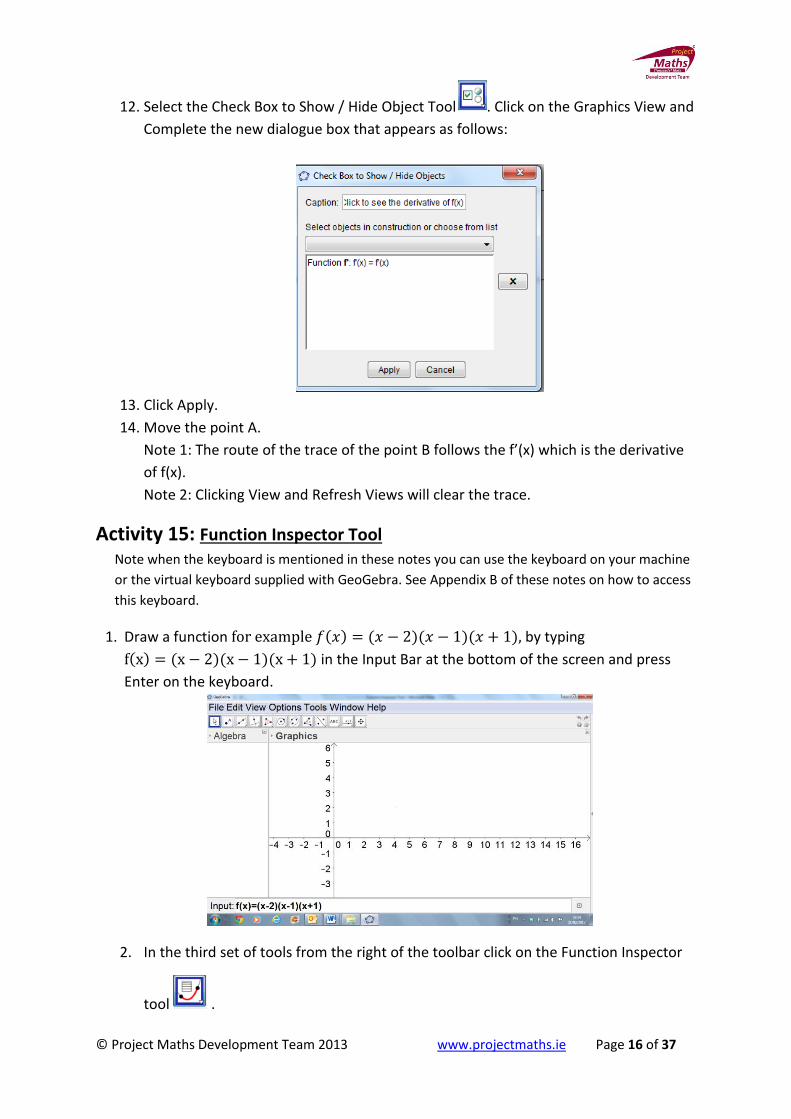
12. Select the Check Box to Show / Hide Object Tool . Click on the Graphics View and
Complete the new dialogue box that appears as follows:
13. Click Apply.
14. Move the point A.
Note 1: The route of the trace of the point B follows the f’(x) which is the derivative
of f(x).
Note 2: Clicking View and Refresh Views will clear the trace.
Activity 15: Function Inspector Tool Note when the keyboard is mentioned in these notes you can use the keyboard on your machine
or the virtual keyboard supplied with GeoGebra. See Appendix B of these notes on how to access
this keyboard.
1. Draw a function ( ) ( )( )( ) by typing
( ) ( )( )( ) in the Input Bar at the bottom of the screen and press
Enter on the keyboard.
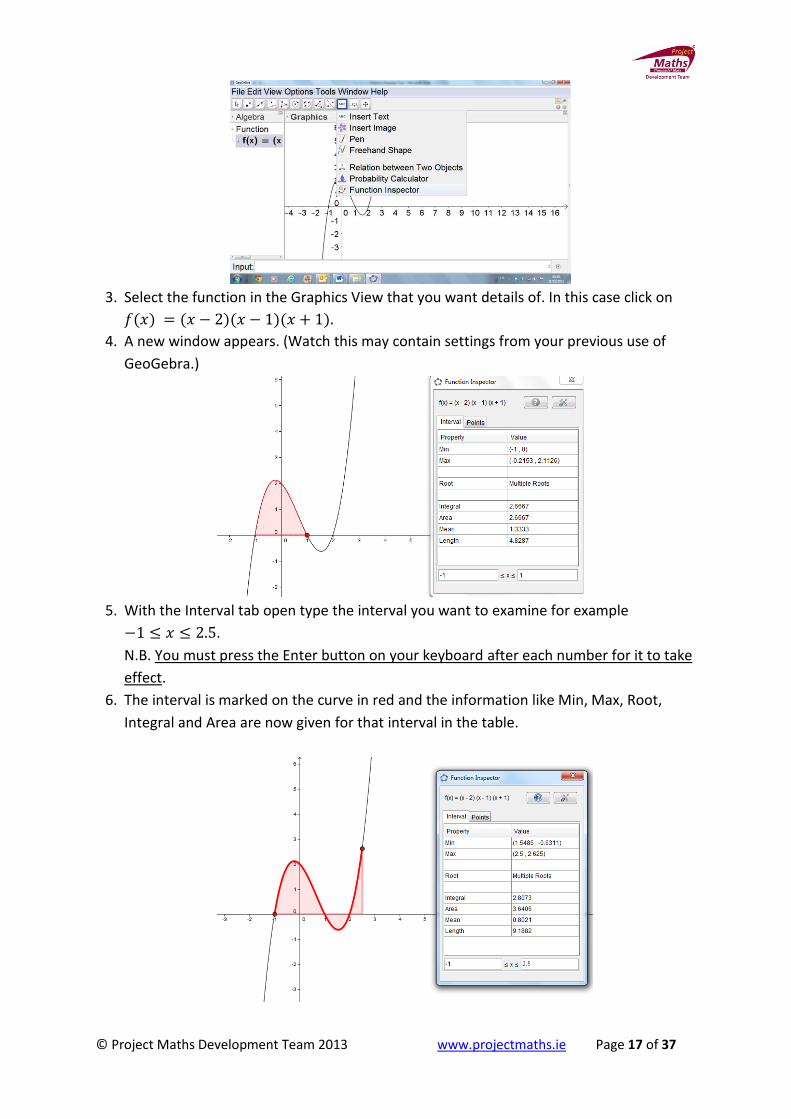
2. In the third set of tools from the right of the toolbar click on the Function Inspector
tool .
© Project Maths Development Team 2013 www.projectmaths.ie Page 17 of 37
3. Select the function in the Graphics View that you want details of. In this case click on
( ) ( )( )( )
4. A new window appears. (Watch this may contain settings from your previous use of
GeoGebra.)
5. With the Interval tab open type the interval you want to examine for example
.
N.B. You must press the Enter button on your keyboard after each number for it to take
effect.
6. The interval is marked on the curve in red and the information like Min, Max, Root,
Integral and Area are now given for that interval in the table.
© Project Maths Development Team 2013 www.projectmaths.ie Page 18 of 37
Note: The Max and the Min that is given in this table is the maximum value and
minimum value of the function in the interval that the Function Inspector is
investigating.
7. The Mean is the “Average value” of the function. It is the area underneath the curve
divided by the length of the interval.
8. If you do not wish the interval to be shown on the Graphics View, you can right click on
this section of the function and deselect Show Object.
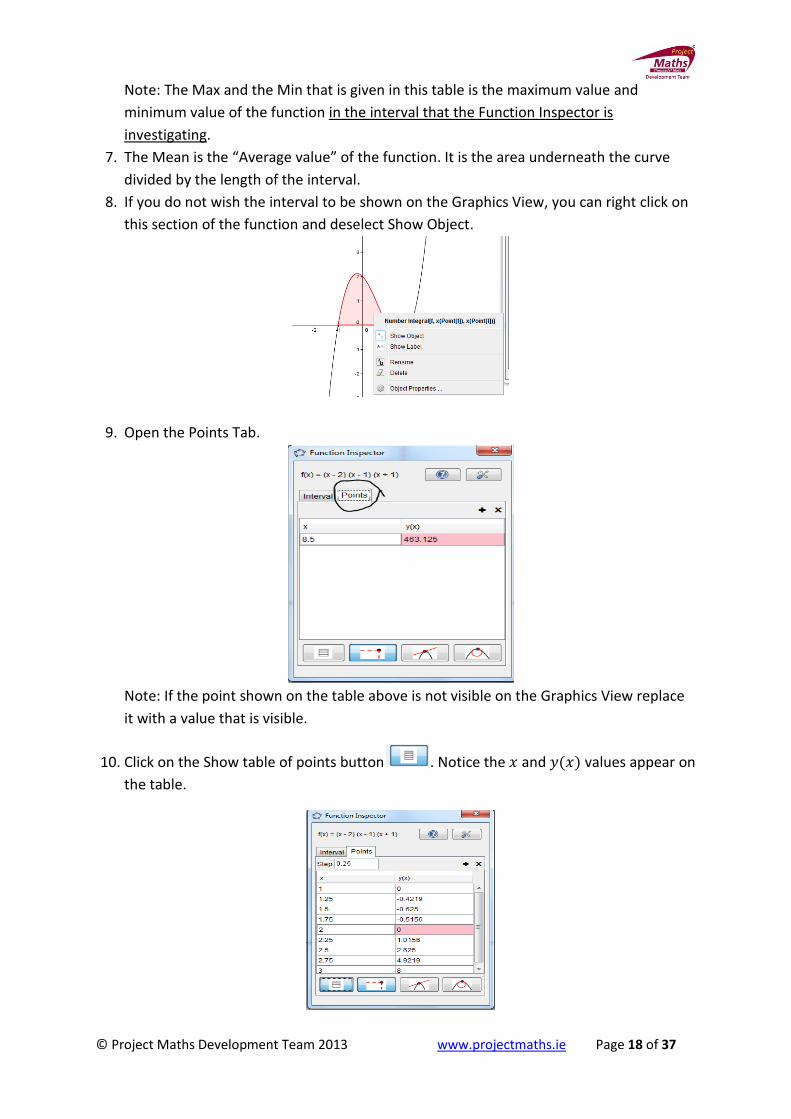
9. Open the Points Tab.
Note: If the point shown on the table above is not visible on the Graphics View replace
it with a value that is visible.
10. Click on the Show table of points button . Notice the and ( ) values appear on
the table.

© Project Maths Development Team 2013 www.projectmaths.ie Page 19 of 37
11. Note the point that is highlighted in the table will have a red dot on the graph.
12. To change the Step to 1. Delete the current value using the Backspace button on
your keyboard, press 1 and Enter on the keyboard.
13. To change the values in the table, move the red point on the Graphics View that now
appears on the curve until the required points appear in the table. Four points to the
right and four to the left of the red point will appear on the table.
14. If you just require integer values for the co-ordinate go to Options, Point Capturing
and choose Fixed to Grid. Move the red dot on the Graphics View. You can also
double click on the coordinate of the point highlighted in the table and type in the
number you want.
15. By clicking on Show tangent line button tool you can show the tangent at
the point highlighted in the table.
16. By clicking on the Show x, y position lines button tool you can show the
position of the point highlighted in the table.
© Project Maths Development Team 2013 www.projectmaths.ie Page 20 of 37
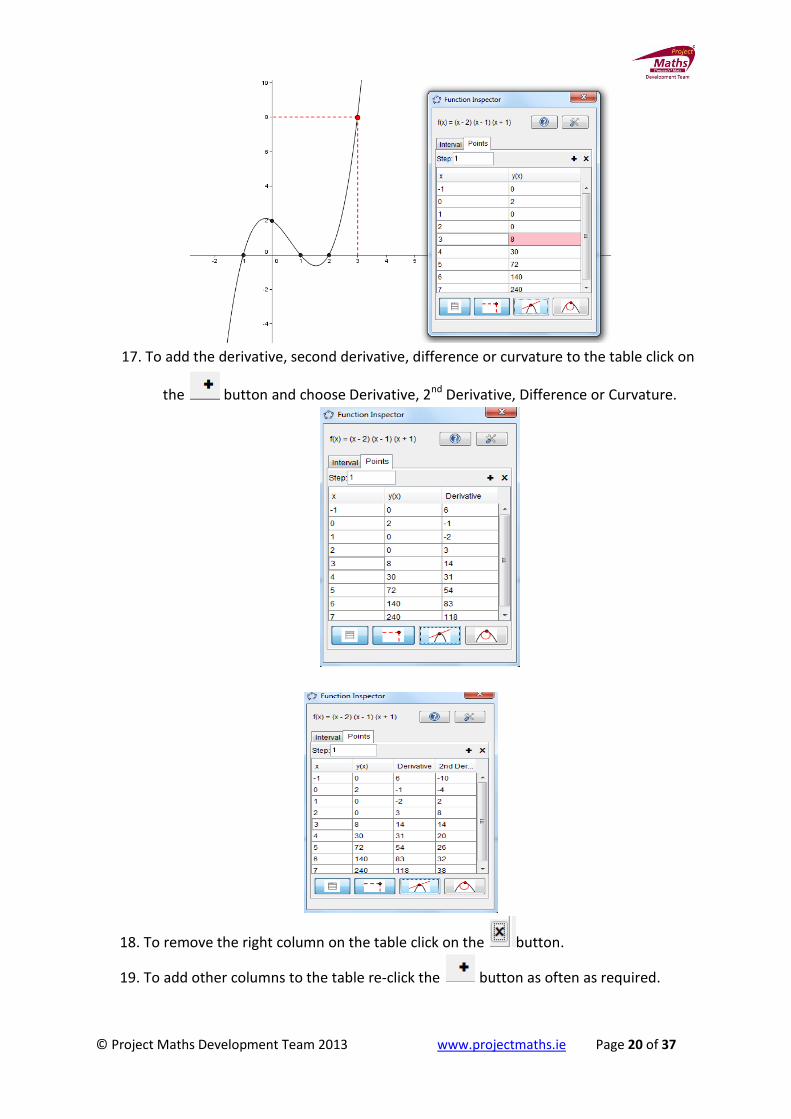
17. To add the derivative, second derivative, difference or curvature to the table click on
the button and choose Derivative, 2nd Derivative, Difference or Curvature.
18. To remove the right column on the table click on the button.
19. To add other columns to the table re-click the button as often as required.
© Project Maths Development Team 2013 www.projectmaths.ie Page 21 of 37
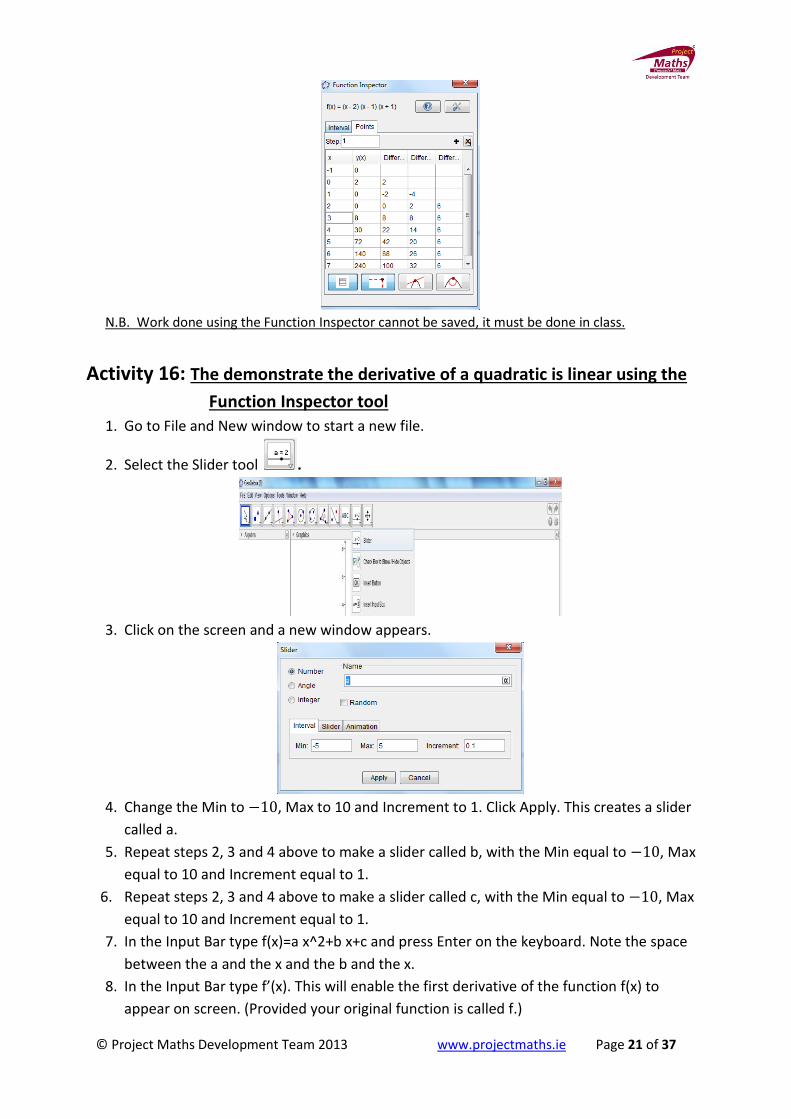
N.B. Work done using the Function Inspector cannot be saved, it must be done in class.
Activity 16: The demonstrate the derivative of a quadratic is linear using the
Function Inspector tool
1. Go to File and New window to start a new file.
2. Select the Slider tool .
3. Click on the screen and a new window appears.
4. Change the Min to , Max to 10 and Increment to 1. Click Apply. This creates a slider
called a.
5. Repeat steps 2, 3 and 4 above to make a slider called b, with the Min equal to , Max
equal to 10 and Increment equal to 1.
6. Repeat steps 2, 3 and 4 above to make a slider called c, with the Min equal to , Max
equal to 10 and Increment equal to 1.
7. In the Input Bar type f(x)=a x^2+b x+c and press Enter on the keyboard. Note the space
between the a and the x and the b and the x.
8. In the Input Bar type f’(x). This will enable the first derivative of the function f(x) to
appear on screen. (Provided your original function is called f.)
© Project Maths Development Team 2013 www.projectmaths.ie Page 22 of 37
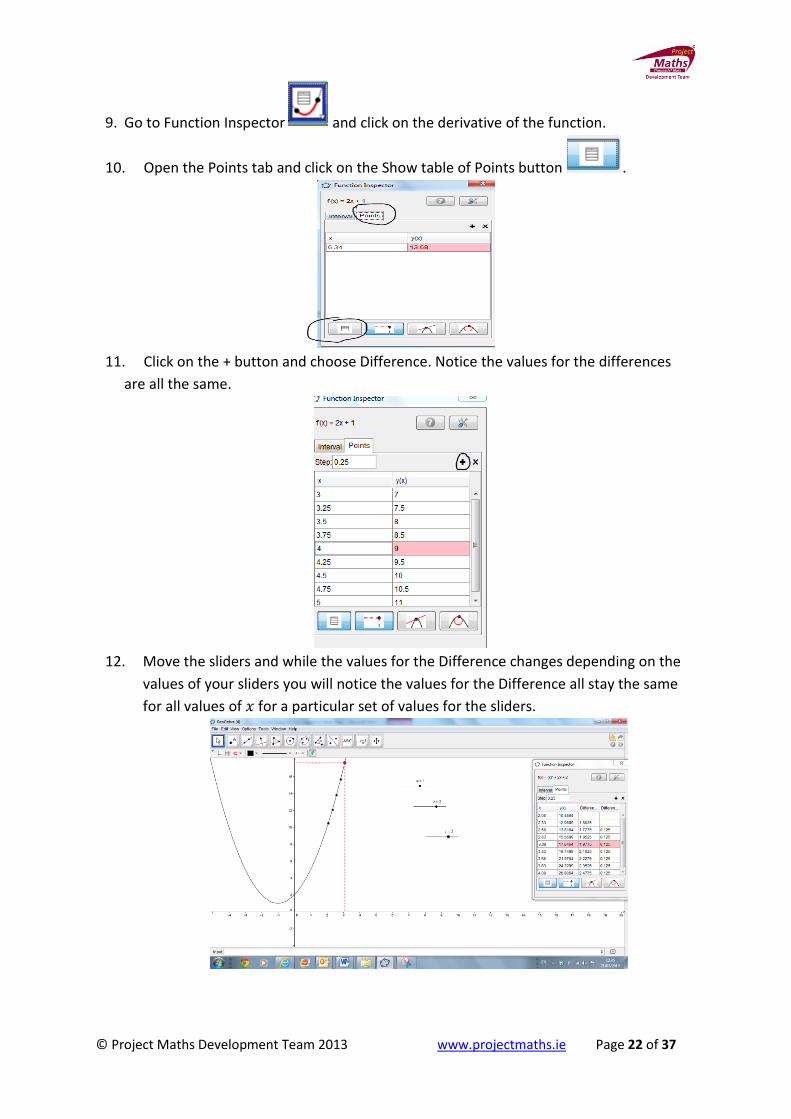
9. Go to Function Inspector and click on the derivative of the function.
10. Open the Points tab and click on the Show table of Points button .
11. Click on the + button and choose Difference. Notice the values for the differences
are all the same.
12. Move the sliders and while the values for the Difference changes depending on the
values of your sliders you will notice the values for the Difference all stay the same
for all values of for a particular set of values for the sliders.
© Project Maths Development Team 2013 www.projectmaths.ie Page 23 of 37
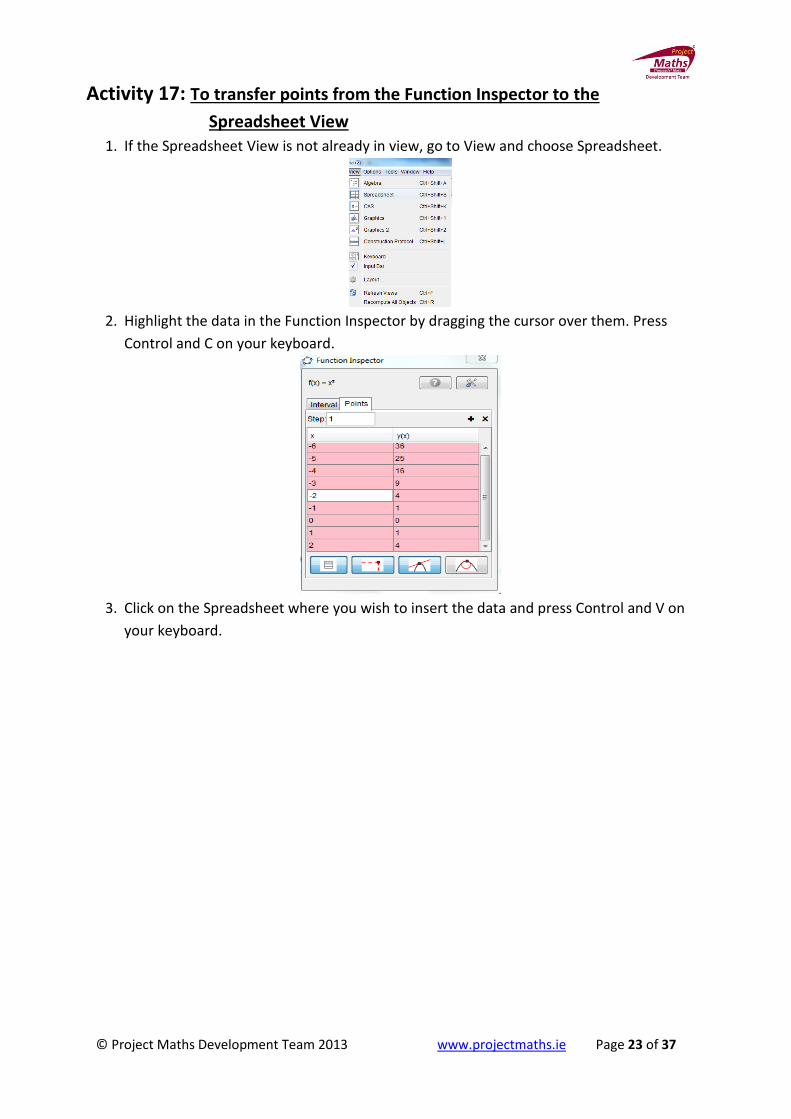
Activity 17: To transfer points from the Function Inspector to the
Spreadsheet View 1. If the Spreadsheet View is not already in view, go to View and choose Spreadsheet.
2. Highlight the data in the Function Inspector by dragging the cursor over them. Press
Control and C on your keyboard.
3. Click on the Spreadsheet where you wish to insert the data and press Control and V on
your keyboard.
© Project Maths Development Team 2013 www.projectmaths.ie Page 24 of 37
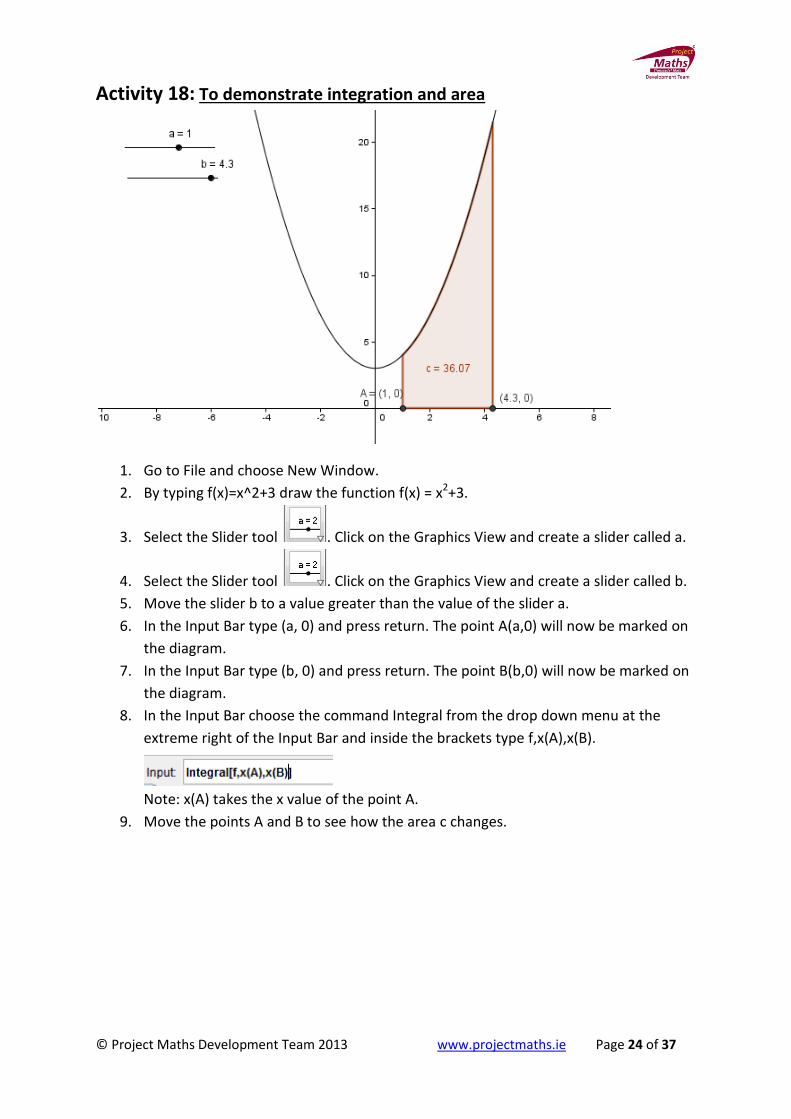
Activity 18: To demonstrate integration and area
1. Go to File and choose New Window.
2. By typing f(x)=x^2+3 draw the function f(x) = x2+3.
3. Select the Slider tool . Click on the Graphics View and create a slider called a.
4. Select the Slider tool . Click on the Graphics View and create a slider called b.
5. Move the slider b to a value greater than the value of the slider a.
6. In the Input Bar type (a, 0) and press return. The point A(a,0) will now be marked on
the diagram.
7. In the Input Bar type (b, 0) and press return. The point B(b,0) will now be marked on
the diagram.
8. In the Input Bar choose the command Integral from the drop down menu at the
extreme right of the Input Bar and inside the brackets type f,x(A),x(B).
Note: x(A) takes the x value of the point A.
9. Move the points A and B to see how the area c changes.
© Project Maths Development Team 2013 www.projectmaths.ie Page 25 of 37
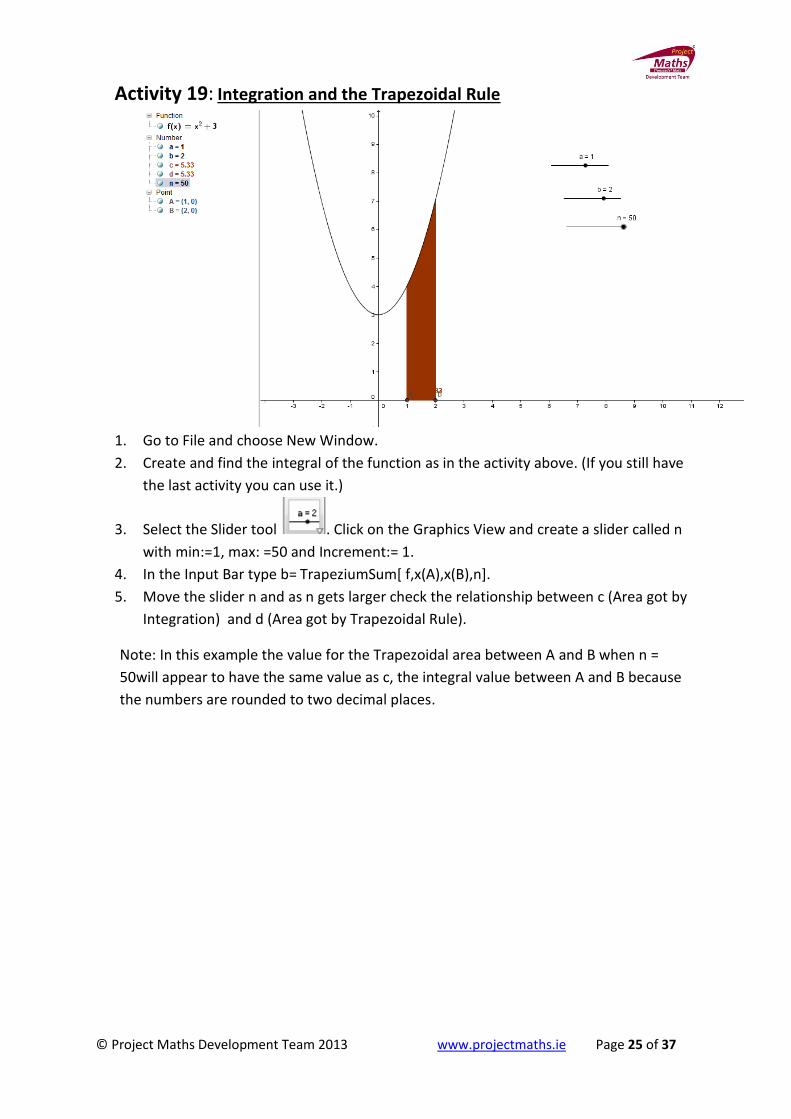
Activity 19: Integration and the Trapezoidal Rule
1. Go to File and choose New Window.
2. Create and find the integral of the function as in the activity above. (If you still have
the last activity you can use it.)
3. Select the Slider tool . Click on the Graphics View and create a slider called n
with min:=1, max: =50 and Increment:= 1.
4. In the Input Bar type b= TrapeziumSum[ f,x(A),x(B),n].
5. Move the slider n and as n gets larger check the relationship between c (Area got by
Integration) and d (Area got by Trapezoidal Rule).
Note: In this example the value for the Trapezoidal area between A and B when n =
50will appear to have the same value as c, the integral value between A and B because
the numbers are rounded to two decimal places.

© Project Maths Development Team 2013 www.projectmaths.ie Page 26 of 37
Activity 20: To find the area between the graph of a function and the x axis,
where there is a section below and a section above the x axis
1. Go to File and choose New Window.
2. Draw a graph of a function for example f(x) = x3-x by typing f(x)=x^3-x in the Input
Bar.
3. Select the Intersect Two Objects tool . Click on the graph of the function and
the x axis to find the points of intersection A, B and C of the graph of the function
and the x axis.
4. In the Input Bar type a=Integral[f,x(A),x(B)].
5. In the Input Bar type b=Integral[f,x(C),x(B)]. Note. The order of A, B and C.
6. In the Input Bar type t=a+b to get the total area between the graph of the function
and the x axis.
Activity 21: To demonstrate the average value of a function between 2
points
© Project Maths Development Team 2013 www.projectmaths.ie Page 27 of 37
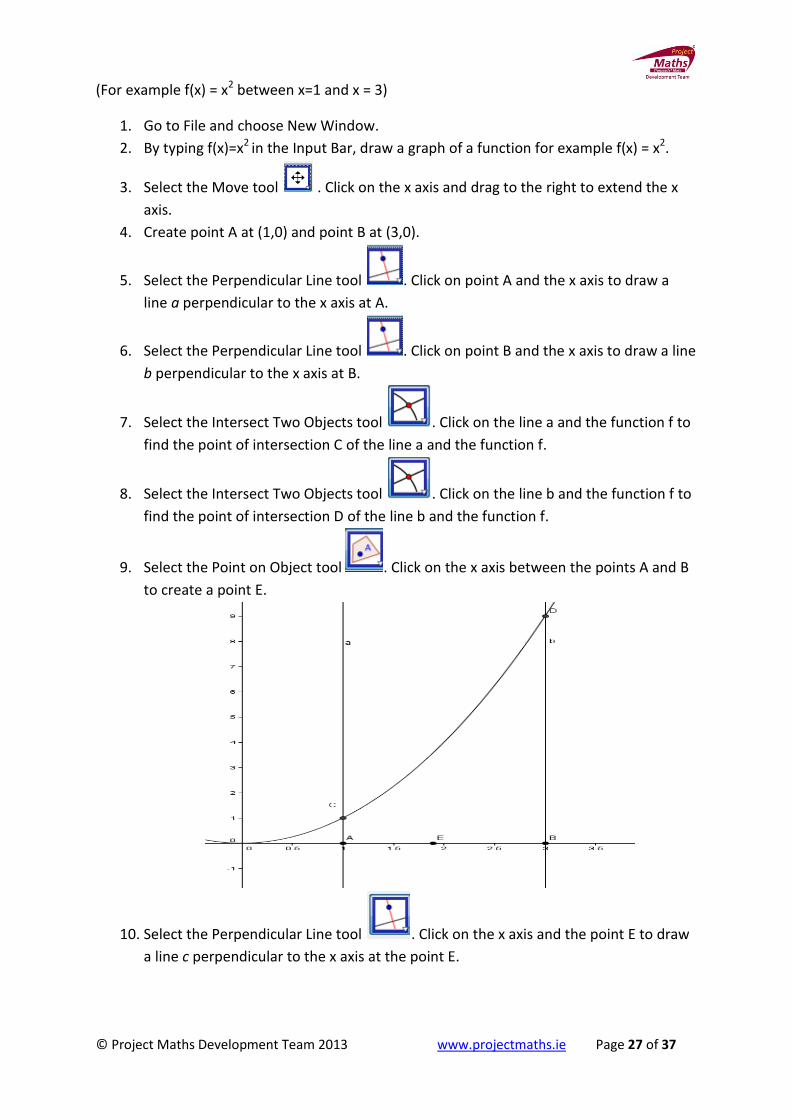
(For example f(x) = x2 between x=1 and x = 3)
1. Go to File and choose New Window.
2. By typing f(x)=x2 in the Input Bar, draw a graph of a function for example f(x) = x2.
3. Select the Move tool . Click on the x axis and drag to the right to extend the x
axis.
4. Create point A at (1,0) and point B at (3,0).
5. Select the Perpendicular Line tool . Click on point A and the x axis to draw a
line a perpendicular to the x axis at A.
6. Select the Perpendicular Line tool . Click on point B and the x axis to draw a line
b perpendicular to the x axis at B.
7. Select the Intersect Two Objects tool . Click on the line a and the function f to
find the point of intersection C of the line a and the function f.
8. Select the Intersect Two Objects tool . Click on the line b and the function f to
find the point of intersection D of the line b and the function f.
9. Select the Point on Object tool . Click on the x axis between the points A and B
to create a point E.
10. Select the Perpendicular Line tool . Click on the x axis and the point E to draw
a line c perpendicular to the x axis at the point E.
© Project Maths Development Team 2013 www.projectmaths.ie Page 28 of 37
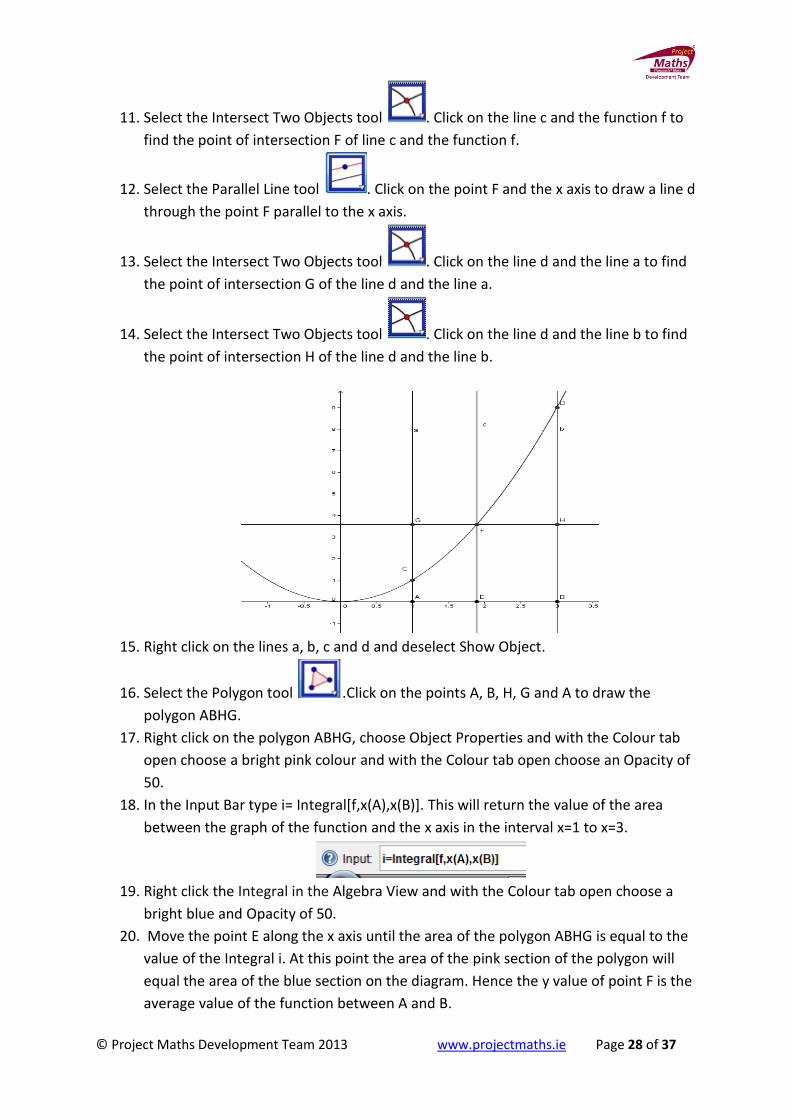
11. Select the Intersect Two Objects tool . Click on the line c and the function f to
find the point of intersection F of line c and the function f.
12. Select the Parallel Line tool . Click on the point F and the x axis to draw a line d
through the point F parallel to the x axis.
13. Select the Intersect Two Objects tool . Click on the line d and the line a to find
the point of intersection G of the line d and the line a.
14. Select the Intersect Two Objects tool . Click on the line d and the line b to find
the point of intersection H of the line d and the line b.
15. Right click on the lines a, b, c and d and deselect Show Object.
16. Select the Polygon tool .Click on the points A, B, H, G and A to draw the
polygon ABHG.
17. Right click on the polygon ABHG, choose Object Properties and with the Colour tab
open choose a bright pink colour and with the Colour tab open choose an Opacity of
50.
18. In the Input Bar type i= Integral[f,x(A),x(B)]. This will return the value of the area
between the graph of the function and the x axis in the interval x=1 to x=3.
19. Right click the Integral in the Algebra View and with the Colour tab open choose a
bright blue and Opacity of 50.
20. Move the point E along the x axis until the area of the polygon ABHG is equal to the
value of the Integral i. At this point the area of the pink section of the polygon will
equal the area of the blue section on the diagram. Hence the y value of point F is the
average value of the function between A and B.
© Project Maths Development Team 2013 www.projectmaths.ie Page 29 of 37
21. Checkboxes to Show / Hide Objects and Text boxes may be added.
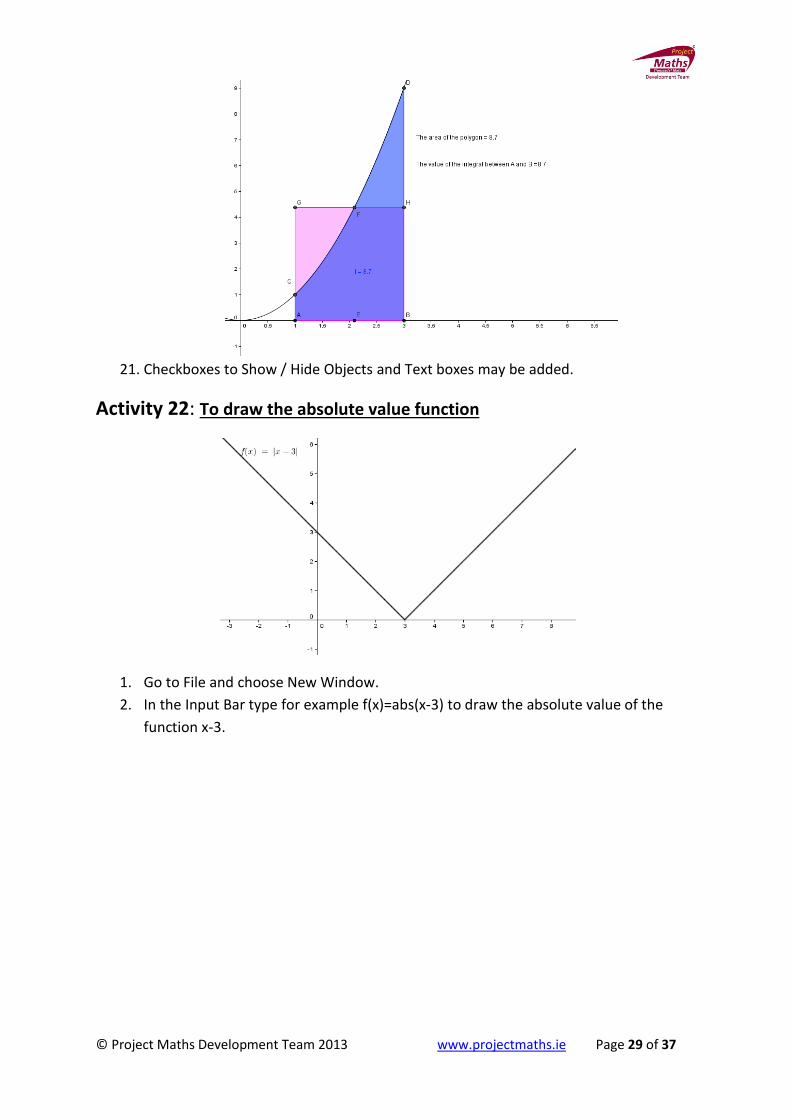
Activity 22: To draw the absolute value function
1. Go to File and choose New Window.
2. In the Input Bar type for example f(x)=abs(x-3) to draw the absolute value of the
function x-3.
© Project Maths Development Team 2013 www.projectmaths.ie Page 30 of 37
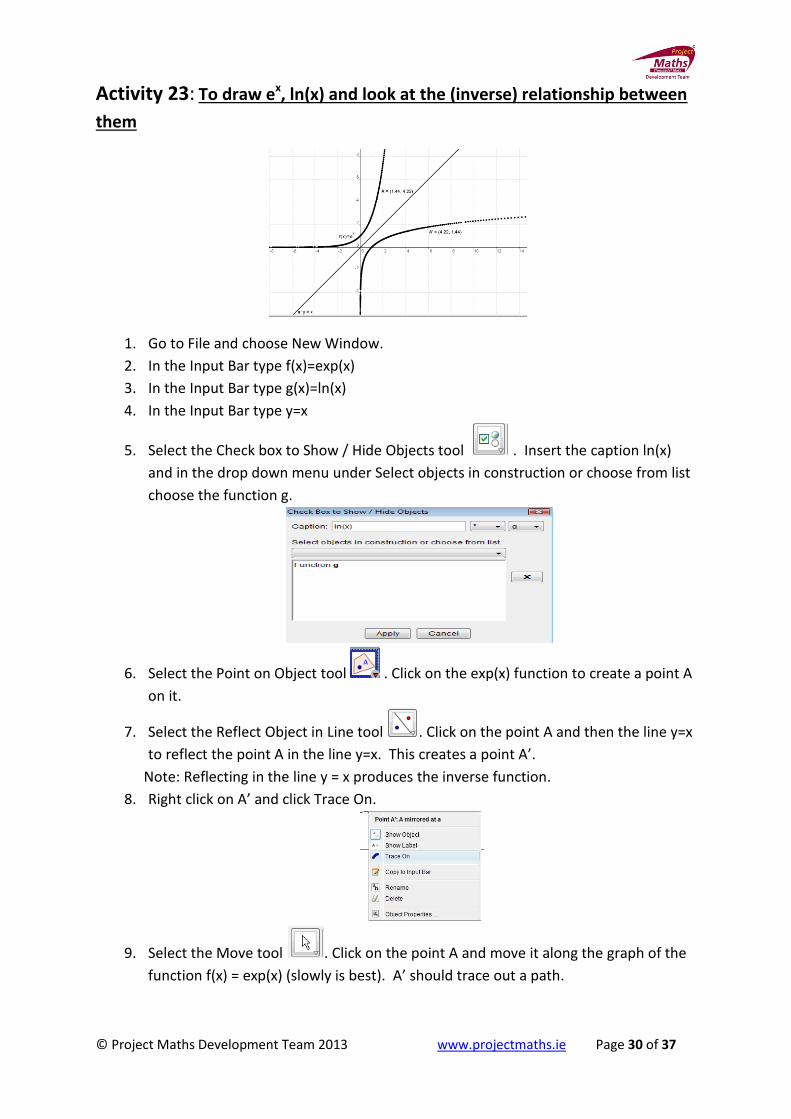
Activity 23: To draw ex, ln(x) and look at the (inverse) relationship between
them
1. Go to File and choose New Window.
2. In the Input Bar type f(x)=exp(x)
3. In the Input Bar type g(x)=ln(x)
4. In the Input Bar type y=x
5. Select the Check box to Show / Hide Objects tool . Insert the caption ln(x)
and in the drop down menu under Select objects in construction or choose from list
choose the function g.
6. Select the Point on Object tool . Click on the exp(x) function to create a point A
on it.
7. Select the Reflect Object in Line tool . Click on the point A and then the line y=x
to reflect the point A in the line y=x. This creates a point A’.
Note: Reflecting in the line y = x produces the inverse function.
8. Right click on A’ and click Trace On.
9. Select the Move tool . Click on the point A and move it along the graph of the
function f(x) = exp(x) (slowly is best). A’ should trace out a path.
© Project Maths Development Team 2013 www.projectmaths.ie Page 31 of 37
10. Click the checkbox you created earlier and compare the path of A’ to the ln(x)
function.
Note: Clicking View in the Menu and Refresh Views from the drop down menu will
clear the trace. Ctrl+F also works to clear the trace.
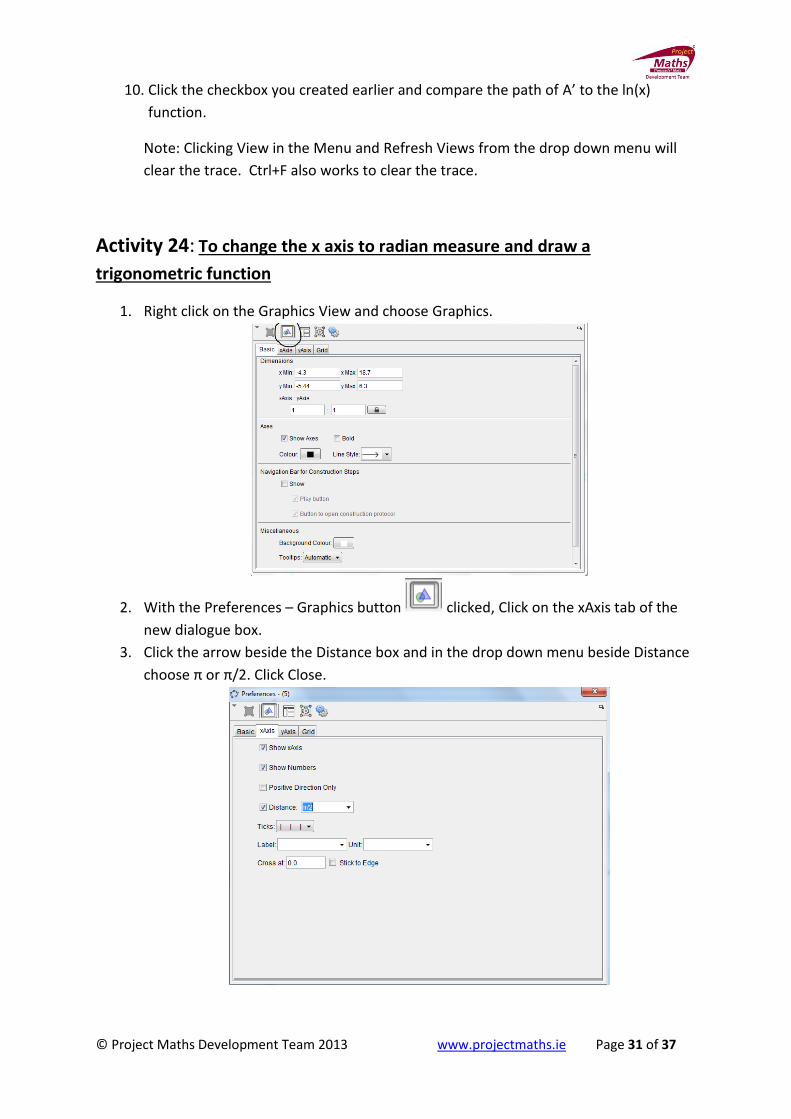
Activity 24: To change the x axis to radian measure and draw a
trigonometric function
1. Right click on the Graphics View and choose Graphics.
2. With the Preferences – Graphics button clicked, Click on the xAxis tab of the
new dialogue box.
3. Click the arrow beside the Distance box and in the drop down menu beside Distance
choose π or π/2. Click Close.

© Project Maths Development Team 2013 www.projectmaths.ie Page 32 of 37
4. In the Input bar type for example and press Enter on the
keyboard.
Activity 25: To change the x axis to degree measure and draw a trigonometric
function
1. Right click on the Graphics View and choose Graphics.
2. With the Preferences – Graphics button clicked, click on the x Axis tab of the new
dialogue box.
3. Click the Distance box if not already clicked and type for example 10 if you want it to go
up in tens. Using the drop down menu beside Unit choose the degree symbol. Click the
X at the top of the dialogue box.
4. In the Input Bar type . Click on the α at the right hand side of the
Input Bar to get the degree sign.
5. If necessary use the Move Graphics tool to decrease the scale of the x axis.
© Project Maths Development Team 2013 www.projectmaths.ie Page 33 of 37
Activity 26: To plot data in the Spreadsheet View in the Graphics View
1. Highlight two columns of data in the Spreadsheet, right click, chose Create and List of
points.
Activity 27: To fit a graph to a list of points that are shown on the Graphics
View
1. In the Input Bar type Fitpoly[list1,2], if the list is list1 and you require a curve of
degree 2 for example.

© Project Maths Development Team 2013 www.projectmaths.ie Page 34 of 37
Appendix A
A1: How to save a file as a GeoGebra file
1. Go to the Menu and choose Save as from the drop down menu. A new dialogue box
appears.
2. For Save in, navigate to the folder that you wish the file to be saved in.
3. For File name type the name you wish to give your file.
4. Click Save. A file with the .ggb extension is created. This extension identifies the file
as a GeoGebra file and it can be opened again and adjustments made using the
GeoGebra application.
A2: How to save a file as an interactive web page
1. First save your file as a GeoGebra file.
2. Go to File, from the drop down menu select Export and from the further menu select
the option Export Dynamic Worksheet as Webpage (html). A new dialogue box
appears.

© Project Maths Development Team 2013 www.projectmaths.ie Page 35 of 37
3. Click on the Export as Webpage tab.
4. Add Title, Author, etc. Then click on the Advanced tab and a new dialogue box
appears.

© Project Maths Development Team 2013 www.projectmaths.ie Page 36 of 37
It is recommended that one clicks the Show Icon to reset construction button.
5. Click Export.
6. Navigate to the folder you want to save your file in. Give it the name of your choice.
Note: This file will have a .html extension and will be viewed using an Internet
browser such as Internet Explorer 8.
7. Click Save and your default Internet browser will open.
8. When the webpage comes up you the following message will normally appear at the
top of the screen.
9. Click Allow Blocked Content.

© Project Maths Development Team 2013 www.projectmaths.ie Page 37 of 37
Appendix B: How to use the Virtual Keyboard in GeoGebra
1. Go to View and choose Keyboard.
2. A virtual keyboard appears.
3. If the keyboard below does not appear click on the key on the virtual keyboard
that appeared.
4. Then click on the key on the virtual keyboard to get the Maths keyboard.


