An Acad Bras Cienc (2018) Anais da Academia Brasileira de Ciências (2018) (Annals of the Brazilian Academy of Sciences) Printed version ISSN 0001-3765 / Online version ISSN 1678-2690 http://dx.doi.org/10.1590/0001-3765201820170107 www.scielo.br/aabc | www.fb.com/aabcjournal Geographic and Gender Diversity in the Brazilian Academy of Sciences NATHÁLIA C. FERRARI 1 , RAQUEL MARTELL 1 , DANIELA H. OKIDO 2 , GRASIELE ROMANZINI 2 , VIVIANE MAGNAN 2 , MARCIA C. BARBOSA 2 and CAROLINA BRITO 2 1 Escola de Engenharia, Universidade Federal do Rio Grande do Sul, Praça Argentina, 9, 90040-020 Porto Alegre, RS, Brazil 2 Instituto de Física, Universidade Federal do Rio Grande do Sul, Av. Bento Gonçalves, 9500, 91501-970 Porto Alegre, RS, Brazil Manuscript received on March 2, 2017; accepted for publication on July 24, 2017 ABSTRACT Recent studies have shown that diversity in race and gender is important to improve competitiveness, creativity and innovation. However, many studies have shown that the universe of science is not diverse in none of these criteria. In this work, we quantify the gender and geographic diversity in the Brazilian science. We study in detail the profile of the titular members of the most prestigious academic institution of Brazil, the Brazilian Academy of Sciences (ABC). Our analysis shows that the members of the ABC concentrates 80% in the Southeast region and that the overwhelming majority is composed by men. We show that female and male researchers have roughly the same amount of publication per year but women produce more human resources. Using the Brazilian Researchers’ Fellowship databank we show that the gender and diversity both in gender and in geography decreases along the researchers’ career. Key words: diversity, gender balance, women in science, excellence in science. Correspondence to: Carolina Brito E-mail: [email protected]* Contribution to the centenary of the Brazilian Academy of Sciences. INTRODUCTION Women are greatly underrepresented in the senior and leadership levels of the career path both in the private and in the government sectors (Hunt et al. 2015, Joy et al. 2007, Dezso and Ross 2012, NSFoundation 2015, Slavin 2008, Philips 2014, Wallon et al. 2015). But, why should we care? Women who have a passion for any subject have the right to make a living from it and have a career with the same opportunities as the men in any field. Equal opportunities, however, are not the only reason for the need of women at all career levels. The presence of women and minorities in leadership positions results in more diversity in ideas and strategies to solve different types of problems. By excluding female researchers, we are limiting the available pool of talented people to half of humanity. Science needs women to survive. When a group of people has to solve problems, the individuals bring to the discussion their different information and perspectives. A group of people different in race, gender and other dimensions brings unique information, experiences and perspectives to solve problems. In the particular case of companies, diversity correlates with the increase of the firm value and of the annual profit
Transcript
An Acad Bras Cienc (2018)
Anais da Academia Brasileira de Ciências (2018) (Annals of the Brazilian Academy of Sciences)Printed version ISSN 0001-3765 / Online version ISSN 1678-2690http://dx.doi.org/10.1590/0001-3765201820170107www.scielo.br/aabc | www.fb.com/aabcjournal
Geographic and Gender Diversity in the Brazilian Academy of Sciences
NATHÁLIA C. FERRARI1, RAQUEL MARTELL1, DANIELA H. OKIDO2, GRASIELE ROMANZINI2, VIVIANE MAGNAN2, MARCIA C. BARBOSA2 and CAROLINA BRITO2
1Escola de Engenharia, Universidade Federal do Rio Grande do Sul, Praça Argentina, 9, 90040-020 Porto Alegre, RS, Brazil2Instituto de Física, Universidade Federal do Rio Grande do Sul, Av. Bento Gonçalves, 9500, 91501-970 Porto Alegre, RS, Brazil
Manuscript received on March 2, 2017; accepted for publication on July 24, 2017
ABSTRACTRecent studies have shown that diversity in race and gender is important to improve competitiveness, creativity and innovation. However, many studies have shown that the universe of science is not diverse in none of these criteria. In this work, we quantify the gender and geographic diversity in the Brazilian science. We study in detail the profile of the titular members of the most prestigious academic institution of Brazil, the Brazilian Academy of Sciences (ABC). Our analysis shows that the members of the ABC concentrates 80% in the Southeast region and that the overwhelming majority is composed by men. We show that female and male researchers have roughly the same amount of publication per year but women produce more human resources. Using the Brazilian Researchers’ Fellowship databank we show that the gender and diversity both in gender and in geography decreases along the researchers’ career. Key words: diversity, gender balance, women in science, excellence in science.
* Contribution to the centenary of the Brazilian Academy of Sciences.
INTRODUCTION
Women are greatly underrepresented in the senior and leadership levels of the career path both in the private and in the government sectors (Hunt et al. 2015, Joy et al. 2007, Dezso and Ross 2012, NSFoundation 2015, Slavin 2008, Philips 2014, Wallon et al. 2015). But, why should we care? Women who have a passion for any subject have the right to make a living from it and have a career with the same opportunities as the men in any field. Equal opportunities, however, are not the
only reason for the need of women at all career levels. The presence of women and minorities in leadership positions results in more diversity in ideas and strategies to solve different types of problems. By excluding female researchers, we are limiting the available pool of talented people to half of humanity. Science needs women to survive. When a group of people has to solve problems, the individuals bring to the discussion their different information and perspectives. A group of people different in race, gender and other dimensions brings unique information, experiences and perspectives to solve problems. In the particular case of companies, diversity correlates with the increase of the firm value and of the annual profit
An Acad Bras Cienc (2018)
2 NATHÁLIA C. FERRARI et al.
(Hunt et al. 2015, Dezso and Ross 2012, Dezso et al. 2017).
The mechanism behind this effect goes as follows. When a group of people is exposed to a challenge that needs cooperation to be solved, the best performance is obtained when the group has race and gender diversity. Being with similar others leads us to think we all hold the same information and share the same perspective, which makes us less competitive. This perspective, which stopped the all-white groups from effectively processing the information, is what hinders creativity and innovation (Guterl 2014, Philips 2014, Phillips et al. 2006).
In the particular case of gender, the affirmative action movement has been working since the 60’s to increase the participation of women in all fields. Unfortunately, the increase of this participation in science is slow. Statistic evidences demonstrate that the high rank position in science belongs to males (NSFoundation 2015, Slavin 2008). Male predominance, however, does not occur at all stages of the career. In Brazil for example, about 54% of the people who complete high school are women, and more than 50% of graduated students are women.1
Women are the majority of graduated persons in most of the countries of the world (Osborn 2000). Unfortunately, they do not keep this proportion along the career. Instead, the proportion of women decays gradually along the career, defining what is called “Scissors effect”. This effect means that the percentage of men increases while the percentage of women decreases when the career progresses (Moss-Racusina et al. 2012, Raymond 2013, Slavin 2008).
Even though the lack of diversity in high positions is a universal phenomenon, the acknowledgment of the problem and taking action toward solving the issue is rather new. In some
1see “Censo da Educação Superior” at http://portal.inep.gov.br/web/guest/censo-da-educacao-superior
places, no clear policy exists. In Brazil, affirmative action for women in science is considered unnecessary, because there is a common belief that no procedures for promotion suffer from gender, race or geographic background biases.
In order to understand if equity is present in the selection process, in this paper we analyze in detail the profile of the titular members of the most prestigious academic institution of Brazil, the Brazilian Academy of Sciences (ABC). Our main goal is to measure the level of diversity existent in the Brazilian Academy of Sciences in terms of geographic region and gender. We first look at the distribution of the titular members of ABC in the regions of Brazil and identify that about 80% of them are in the Southeast region. We compare it with the universe of researchers with a special type of scholarship (it will be explained below), which allows us to infer how this concentration in the Southeast region is created along the career.
We then concentrate in the gender distribution among different areas of knowledge and identify that the proportion of women is very small in all areas, being at most 25% in the areas where they are more frequent and only 1% in Engineering.
We explore some indexes of scientific productivity and identify that, in most fields, women supervise more students than men but in some fields, men on average publish more than women. We discuss the possible causes for the fact that more supervised students do not convert in more publications. We end the paper with comparison of the CNPq research level of the members of the Brazilian Academy of Sciences. We find that there is no woman in the ABC without a CNPq research level but 15% of the men do not have any level. Comments at this result end the paper.
MATERIALS AND METHODS
We selected from the webpage of the ABC the names of the titular members alive of each field of
An Acad Bras Cienc (2018)
GEOGRAPHIC AND GENDER DIVERSITY IN THE ABC 3
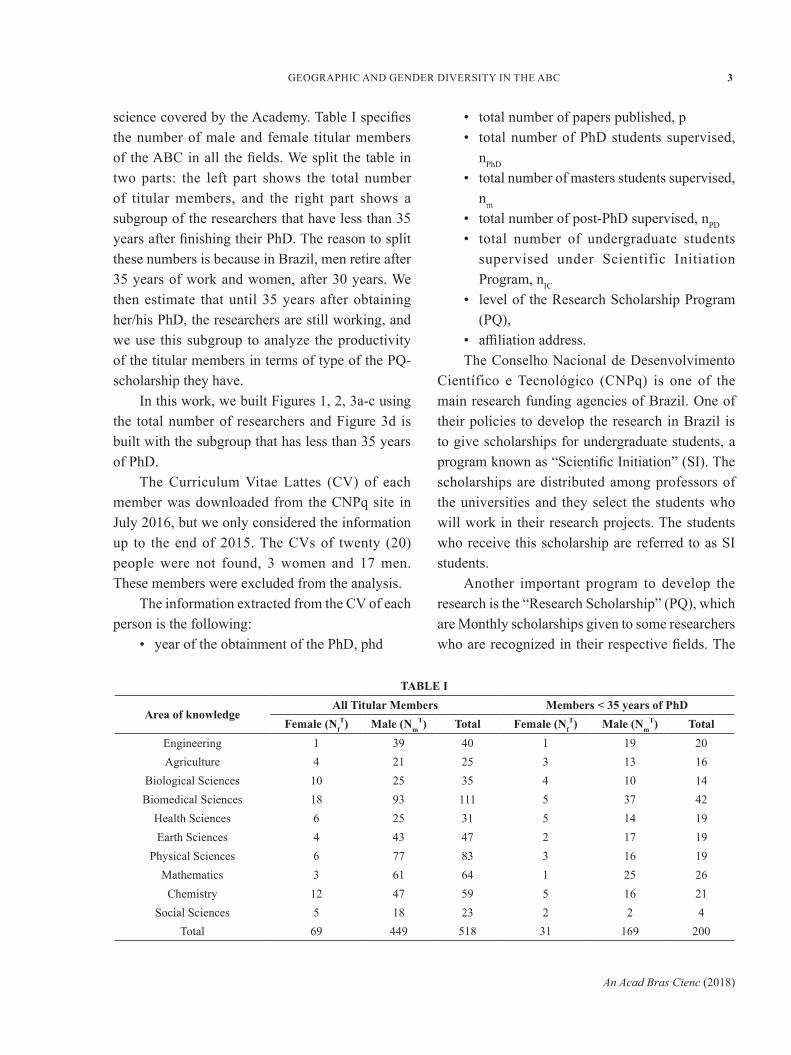
science covered by the Academy. Table I specifies the number of male and female titular members of the ABC in all the fields. We split the table in two parts: the left part shows the total number of titular members, and the right part shows a subgroup of the researchers that have less than 35 years after finishing their PhD. The reason to split these numbers is because in Brazil, men retire after 35 years of work and women, after 30 years. We then estimate that until 35 years after obtaining her/his PhD, the researchers are still working, and we use this subgroup to analyze the productivity of the titular members in terms of type of the PQ-scholarship they have.
In this work, we built Figures 1, 2, 3a-c using the total number of researchers and Figure 3d is built with the subgroup that has less than 35 years of PhD.
The Curriculum Vitae Lattes (CV) of each member was downloaded from the CNPq site in July 2016, but we only considered the information up to the end of 2015. The CVs of twenty (20) people were not found, 3 women and 17 men. These members were excluded from the analysis.
The information extracted from the CV of each person is the following:
• year of the obtainment of the PhD, phd
• total number of papers published, p• total number of PhD students supervised,
nPhD
• total number of masters students supervised, nm
• total number of post-PhD supervised, nPD
• total number of undergraduate students supervised under Scientific Initiation Program, nIC
• level of the Research Scholarship Program (PQ),
• affiliation address.The Conselho Nacional de Desenvolvimento
Científico e Tecnológico (CNPq) is one of the main research funding agencies of Brazil. One of their policies to develop the research in Brazil is to give scholarships for undergraduate students, a program known as “Scientific Initiation” (SI). The scholarships are distributed among professors of the universities and they select the students who will work in their research projects. The students who receive this scholarship are referred to as SI students.
Another important program to develop the research is the “Research Scholarship” (PQ), which are Monthly scholarships given to some researchers who are recognized in their respective fields. The
TABLE I
Area of knowledgeAll Titular Members Members < 35 years of PhD
Research Scholarship is divided in five levels named as 2, 1D, 1C, 1B and 1A, from lower to upper levels. In addition, the Senior (SR) level was created for retired researchers who have been 1A or 1B levels for more than 15 years. Each researcher is evaluated every three or four years to renew or obtain the Research Scholarship. In this work, we use the fact that the Research Scholarship PQ is an indicator of the quality of her/his work. Then we compare the universe of the titular members of the ABC with the universe of the PQ-researchers. This comparison allows us to follow the evolution of the researchers along the career.
RESULTS
In this section, we show the distribution of the members of the ABC in the Brazilian regions and discriminated by gender. We also compare gender and region distribution in the ABC with the universe of PQ-researchers.
DISTRIBUTION OF THE PERCENTAGE OF THE ABC MEMBERS AND CNPq PQ-RESEARCHERS BY GEOGRAPHIC REGION
Brazil is divided in five geographic regions, which are composed by at least three states each. The regions and their respective percentage of the population are: Southeast (42.3%), Northeast (28%), South (14.3%), North (8.3%), and Central-West (7.1%). Figure 1a shows that the population distribution is not reproduced in the distribution of CNPq PQ-researchers, 1A and 1B CNPq PQ-researchers or the titular members of the ABC. Instead, this figure shows an impressive concentration of the members of ABC in the Southeast region. In the other extreme, there is the North region with a representation so small that the bars cannot be visualized: there are only 180 researchers with PQ scholarships, being 14 at the level B or A. The total number of ABC titular members is 12 in the region. With such small
numbers, the fluctuations in any statistical analysis are huge.
In order to gain insight in which stage of the career starts the concentration of recognized researchers in the Southeast region, we compare the percentage of ABC members with the percentage of PQ-researchers in each region. The group of “all PQ-researchers” indicates a select group of researchers, who are distributed in different ages and, in principle, in different localities in Brazil. To capture the most prestigious researchers of CNPq, we look at a subgroup of researchers at the levels 1A and 1B of CNPq. Then, representing the most prestigious researchers of Brazil, we show the titular members of ABC.
Figure 1a also shows that the concentration of the recognized researchers increases in the Southeast from about 62% of CNPq researchers to 80% of ABC titular members, while it decreases in all other regions of Brazil in a plot that resembles the scissors gender plot (Slavin 2008).
How can we understand this concentration in the Southeast region of Brazil? One possible reason is the fact that the Southeast is the richest region of Brazil, producing about 60% of the Brazilian GDP.2
This implies for example that the budget for research only in São Paulo state is roughly the same as for the rest of the country, which is an attractive for good researchers to move to the Southeast region. It is important to note, however, that Brazil does not have a high academic mobility; when a researcher has a position in one university or center of research the tradition is to stay in that location. Therefore, the “bottleneck” that happens in Southeast region along the career cannot be only due to the fact that good researchers migrate to this region during his/her career.
Another possible and complementary explanation for this concentration is the process of selection to the top levels both in the CNPq and in
2see IBGE: Instituto Brasileiro de Geografia e Estatística at www.ibge.gov.br
An Acad Bras Cienc (2018)
GEOGRAPHIC AND GENDER DIVERSITY IN THE ABC 5
the ABC. The process to become a titular member of ABC goes as follows: one titular member of the Academy indicates a candidate and the acceptance of this indication is made by the votes of all the other members of ABC. This implies that the researchers proposed and accepted are most likely close colleagues of the current members. Consequently, the states or regions with more members are the ones with higher probability to have other members of that state. A third reason is that the Southeast region has a more professional structure for science communication and publicity through the media. Therefore, the scientists from that region are more known by the members of ABC.
In the case of the CNPq, the committee that selects the PQ-researchers is smaller and selected to guarantee a representation from all states and research areas. Since most of them do not know the candidates for the PQ fellowship, the selection is based on numeric achievements. At the top level, 1A and 1B, where the numbers are small, regional bias is also observed.
GENDER DISTRIBUTION
The map in Figure 1b shows the gender distribution of the titular members of the ABC per state in
Brazil. The quantity shown is the ratio of the number of female titular members over the total titular members in a given state. The stronger is the orange color, the higher is the percentage of female members in the state. The color code is such that the interval of the gender proportion varies between zero and 0.5, meaning that at best the number of men and women is the same. One can observe that in most states there is no female titular member. Alagoas and Pará are two states with the largest percentages of women, but this is due to the small number of members in these states: in Alagoas, there is only one woman and one man and in Pará there are 4 men and 2 women as titular members of the ABC.
Figure 2a shows the percentage of female and male members in ABC for different areas of knowledge. The figure evidences the underrepresentation of women in all fields of the Academia. The Engineering is the worst case, in which only 1% of the members are women while the Biological sciences is the best case in which about 25% of the members are women.
As we have done to understand the origin of the concentration of the members in the Southeast
Figure 1 - a) Distribution of the total number of CNPq PQ-researchers, 1A and 1B CNPq PQ-researchers and ABC titular members per Brazilian geographic region. Distribution of the percentage of CNPq PQ-researchers, 1A and 1B CNPq PQ-researchers and ABC titular members per Brazilian geographic region. The total number of individuals in each category is 10311 as PQ researchers, where 1818 are in the levels 1A and 1B. The total number of titular members of ABC who have a Brazilian address is 490. b) Map of the quotient of the number of titular female researchers divided by the total number of titular members by state. The color code is shown in the legend.
An Acad Bras Cienc (2018)
6 NATHÁLIA C. FERRARI et al.
region, we compare the percentage of female ABC titular members with the percentage of women that have a PQ-scholarship and the women who are at 1A and 1B levels of this scholarship. There are technical points to comment about this comparison. The ABC splits the “Biological Sciences” and “Biomedical” in two areas, while CNPq makes a slightly different division. To be able to compare both, we unified both and as shown in Figure 2 and in Figure 3 indicated as “Biological”. Another point is that in ABC “Social Science” actually means “Applied Social Science”. Since this division is not quite clear in the CNPq, we adopt the Economy in the CNPq analysis. Figure 2b shows that the percentage of female researchers decreases as the career progresses. The only exception is Social
Sciences, in which the comparison is difficult because at the CNPq we select only Economy while we are not quite sure if the ABC includes other fields of social science in its definition.
A natural question is why the concentration of men increases when the career advances. To shed light in this point, we analyze the scientific production of the members of the ABC in the next section.
QUALITY OF SCIENTIFIC PRODUCTION OF THE ABC MEMBERS
In this section, we compare the scientific production of male and female ABC titular members using two variables: the average number of articles and the average number of students supervised per
Figure 2 - a) Percentage of male and female members of the ABC in each area; b) percentage of female members of the ABC, of the CNPq PQ-research and of the CNPq 1A and 1B PQ-research members in different areas.
An Acad Bras Cienc (2018)
GEOGRAPHIC AND GENDER DIVERSITY IN THE ABC 7
researcher per year, also referred to as human resources. It is quantified as the average number of people that the researcher supervised during his/her academic life, including all types of students. The precise definition of this quantity is shown in the Appendix.
Figure 3a is a scatter plot of the Students supervised per year for female (in x-axis) and male (in y-axis) titular members for different knowledge area, as specified in the legend of the figure. If the average production of human resources of men and women members were the same, the data points would lie on the line y=x illustrated as a thin line in the figure. Further up or down is the point from this line, larger is the difference between the human resource production of the female and male
researchers. In most areas of knowledge, women produce more human resources than men.
Figure 3b is a scatter plot of the publications per year for female (in x-axis) and male (in y-axis) titular members discriminated by knowledge area. In this scatter plot we observe that in most areas the average number of papers published by men and women lies close to the line y=x, which suggests that they have a similar production. These findings are in agreement with an analysis of the PQ-researchers in physics (Arenzon et al. 2013). There are two areas where the male production is clearly higher than the women production: biomedical and chemistry. In this last case, the difference is of about 6 papers published by male researchers in average against only 4 by female researchers.
Figure 3 - a) Average number of human resources production and b) average number of articles production in the different areas by the male (x axis) and female (y axis) members of the ABC. c) Average number of students supervised by female and male titular members separated by different types of students: scientific initiation (SI), Master, PhD and post-doc (PD). d) Distribution of researchers in terms of the type of PQ-scholarship. For this figure, we only use the members with less than 35 years of PhD.
An Acad Bras Cienc (2018)
8 NATHÁLIA C. FERRARI et al.
As a whole, Figure 3 indicates that, in addition to the fact that women produce more human resources than men, at best they publish as many papers as their counterparts. In order to understand why more supervisions do not convert in more publications, we look at the type of supervised students for all the members of ABC, shown in Figure 3c. We observe that the total number of master and PhD students supervised by female researchers is roughly the same as the ones supervised by male titular members, but women have almost two times more SI and post-doc students than men. Since SI students are undergraduate, they are not supposed to perform a competitive research and write papers. Researchers invest time in them because having a mentor correlates with good performance as undergraduate and, therefore, implies forming better future master and PhD students. Since the number of graduate fellowships for each advisor is limited, many of these SI students that were formed and supervised by female researchers end up doing their master and PhD with male scientists. We note that both genders supervise relatively few post-doc, probably because many Brazilians go abroad after their PhD and few people come to Brazil at this stage of the career. Then we believe that the difference in the number of post-doc does not impact in the papers production.
We also looked at the academic performance of the titular members in terms of the type of CNPq PQ-scholarship they have. The result discriminated by gender is shown in Figure 3d. We observe that the absolute majority of women has 1A and 1B scholarships. A striking observation is that there are about 15% of men without PQ-scholarship, while only 1% of the women do not have it. It is important to emphasize that we are only considering those members who have less than 35 years after finishing their PhD. If we would include everybody, the percentage of men without PQ-scholarship increases to 40% and to 16% for women. It is very likely that these members used to
have the PQ scholarship when they were selected to become a titular member, but it is possible that they are working in administrative positions for which women are rarely selected. In any case, some women who are titular members of ABC also have administrative jobs, but they manage to keep their PQ-scholarship. We hypothesize that the criteria to be accepted at ABC is more restrictive for women than for men, suggesting a kind of mechanism to explain the “ceiling glass” that is measured through some statistics but is not explicitly written in any official rule.
CONCLUSIONS
In this paper, we quantify the diversity in the Brazilian Academy of Sciences in terms of gender and geographic location. We show that 80% of the members are concentrated in the Southeast region and that about 86% of the alive titular members are men. We then compare the quality of the research of the female and male members using two indexes, the average number of publications and the average number of students supervised per year. These analyses show that men and women produce roughly the same amount of papers in all areas of knowledge covered by ABC, but women in general are more engaged in supervising students.
We also evaluate members’ productivity by measuring the percentage of them with each type of PQ-scholarship and show that men have higher proportion of members without any type of PQ-scholarship. All this together allows us to conclude that the Brazilian Academy of Sciences is neither diverse in terms of geographic region nor in terms of gender, even if the male members to do not have higher indexes of scientific productivity compared to female members.
One could argue that the lack of diversity observed in ABC is just a photography of the science situation in Brazil and a more relevant measure is how this situation evolves. To take into account
An Acad Bras Cienc (2018)
GEOGRAPHIC AND GENDER DIVERSITY IN THE ABC 9
the evolution effect in the researchers’ career, we compare the ABC data with the universe of PQ-researchers and observe that diversity decreases along the researchers’ career: the ABC contains more male members and more people from the Southeast region than the universe of prestigious people who have the PQ-scholarship. It shows that not only the ABC has very small diversity but also that this problem only increases when the level of the career gets higher. It is worth noting that among the 15 new titular members announced for 2017, 12 work in the Southeast region, suggesting that the 80% proportion of researchers from the Southeast region will be kept for longer.
This gradual concentration of male researchers in the richest region of Brazil when the career evolves has some negative consequences. One is the waste of financial resources, because many people are educated and then excluded from the workforce. The second is that, by excluding women and individuals from least developed regions of the country, the pool of talents is decreased, rendering less likely to promote the most competent people of the society (Chamorro-Premuzic 2017).
Another very important dimension of the social world that we have not investigated here is the race-ethnic identity. It is clear from our daily life in Academia that the percentage of black/indigenous people is very small, even though Brazil has, for example, more than 50% of self-declared black people. Quantify the race and ethnic diversity in academia is still a problem because our main data basis of CV (CNPq Lattes) included recently a possibility to declare the color of the researcher. We hope that in a near future some statistics about the diversity of races in the Brazilian science will be possible.
Having in mind that diversity is important to solve different kinds of problems and improve efficiency, it is time for Brazilians to think more seriously about policies to include more women
and more people from other regions of Brazil other than the Southeast region into research.
REFERENCES
ARENZON JJ, DUARTE P, CAVALCANTI S AND BARBOSA MC. 2013. Women and physics in Brazil: Publications, citations and H index. AIP Conf Proc 1517: 78-80.
CHAMORRO-PREMUZIC T. 2017. The Talent Delusion: Why Data, Not Intuition, Is the Key to Unlocking Human Potential. Piatkus Publishing, UK, 304 p.
DEZSO CL AND ROSS DG. 2012. Does female representation in top management improve firm performance? A panel data investigation. Strategic Manage J 33: 1072-1089.
DEZSO CL, ROSS DG AND URIBE J. 2017. Is there an implicit quota on women in top management? A large-sample statistical analysis. Strategic Manage J 37: 98-115.
GUTERL F. 2014. Diversity in science: Why it is essential for excellence. Sci Am 311: 38-41.
HUNT V, LAYTON D AND PRINCE S. 2015. Diversity Matters: McKinsey and Company Report. http://www.mckinsey.com/business-functions/organization/our-insights/why-diversity-matters. (Accessed on Jan 18, 2017).
JOY L, NANCY MC, WAGNER HM AND NARAYANAN S. 2007. The Bottom Line: Corporate Performance and Women’s Representation on Boards. http://www.catalyst.org/system/files/The_Bottom_Line_Corporate_Performance_and_Womens_Representation_on_Boards.pdf. (Accessed on Jan 18, 2017).
MOSS-RACUSINA CA, DOVIDIO FJ, BRESCOLL VL, GRAHAM MJ AND HANDELSMAN J. 2012. Science faculty’s subtle gender biases favor male students. PNAS 109: 16474-16479.
NSFOUNDATION. 2015. Women, minorities, persons with Disabilities in Science and Engineering. https://www.nsf.gov/statistics/2015/nsf15311/digest/. (Accessed on January 18, 2017).
OSBORN M. 2000. Science policies in the European Union: Promoting excellence through mainstreaming gender equality. http://ufm.dk/en/publications/2000/files-2000/promoting-excellence-through-mainstreaming-gender-equality.pdf (Accessed on Jan 2, 2017).
PHILIPS KW. 2014. How diversity makes us smarter. Sci Am 311: 42-47.
PHILLIPS KW, NORTHCRAFT GB AND NEALE MA. 2006. Surface-level diversity and decision-making in groups: When does deep-level similarity help? Group Process Intergr Relat 9: 467-482.
RAYMOND J. 2013. Sexist attitudes: Most of us are biased. Nature 495: 33.
An Acad Bras Cienc (2018)
10 NATHÁLIA C. FERRARI et al.
SLAVIN K. 2008. Gender equality report Sixth Framework Programme. https://ec.europa.eu/research/swafs/pdf/pub_gender_equality/gender-equality-report-fp6-final_en.pdf (Accessed on Jan 18, 2017).
WALLON G, BENDISCIOLI S AND GARNKEL MS. 2015. Exploring Quotas in the Academy. http://www.embo.org/documents/science_policy/exploring_quotas.pdf. (Accessed on Jan 18, 2017).
APPENDIX: MATHEMATICAL DEFINITION OF
QUANTITIES SHOWN IN FIGURES 3a AND 3b
In this section, we show the precise definition of the quantities shown in the scatter plot of the Figures 2a and 2b.
The production of human resources is quantified as the average number of people that the titular members supervised during their academic life. This number includes all the students supervised by the researcher divided by the number of years that the person has been working since the obtainment of his/her PhD:
Studentsi=(nPhD
i +nmi +nSI
i +nPDi )
(2015−PhDi )
where nPhDi is the total number of PhD students, nm
i is the number of master students, nSI
i is the number of scientific initiation students, ni
PD is the number post-doc supervised by the research i and PhDi is the year that the person i obtained her/his PhD.
Then Studentsi is averaged over all the titular female members Nf
T and male members NmT of a
given area of knowledge,
female−Studentsper year=∑
i
NfT
Studentsi
NfT
male−Studentsper year=∑
i
NmT
Studentsi
NmT
We also analyze the average number of scientific articles published by each researcher, defined as:
Publicationsi= pi
(2015−PhDi)
where pi is the total number of papers published by the researcher i.
To obtain this index by knowledge area and different gender, we average the publications of the members by area:


![[XLS] · Web viewAT JUNIOR ABC AT JUNIOR DEF AT PRIMARY DEF HM JUNIOR ABC HM JUNIOR DEF HM PRIMARY ABC HM PRIMARY DEF Sr No Emp ID District Block School Name Gender Emp Name Post](https://static.documents.pub/doc/80x56/5b04e7247f8b9a6c0b8e714b/xls-viewat-junior-abc-at-junior-def-at-primary-def-hm-junior-abc-hm-junior-def.jpg)


![a c:] 5 ooÐ L B 10.5 1 - Microsoft Word Abc Abc Abc Abc Abc Abc Abc Abc Abc Abc Abc Abc 1 - Microsoft Word Abc Abc Abc 505 7ï—L Mic SmartArt 1 - Microsoft Word Aa MS B 10.5 (Ctrl+L)](https://static.documents.pub/doc/80x56/5b180d777f8b9a19258b6a1e/a-c-5-ood-l-b-105-1-microsoft-word-abc-abc-abc-abc-abc-abc-abc-abc-abc-abc.jpg)


