Geographic Information Systems: use cases for tourism analysis in local areas
Requested comment
Citlalin Durán1 Summary: The Geographic Information Systems (GIS) have been fully-developed in recent years as information tools with a distinct capacity to capture, recover, model and present geographically referenced data. They can also provide various different solutions to compilation, organisation, systemisation and exploitation problems or large important quantities of data. These facts have improved the usability of the GIS in activities designed to increase the knowledge and analysis of the region as well as the planning and promotion of development. They have also been in favour of greater links between geography and statistics and through it the assimilation of the GIS technology by National Statistics Offices. In Mexico’s case, the Tourism Secretary (TourSec) and the National Institute of Geography, Statistics and Information Technology (NISGIT) have developed co-operative efforts through which a GIS application has been given to the tourism offices of the 32 local governments in the country. This system has all the tourism statistics generated from the 2004 Economic Censuses, population and home statistics, basic and census cartography, physical data, natural resources and infrastructure; at the same time and on account of its design this GIS offers the user the possibility of incorporating its cartographic and statistical data; defining and changing it cartographic projections and data, carrying out a spatial analysis and editing geographic objects, amongst others. The results generated from these co-ordination efforts confirm (at least in the case of Mexico) the benefits of the GIS to undertake tourism statistics and analysis from a regional perspective. It is also worth mentioning as a result of this tool, there are new possibilities on offer for these local tourism offices to carry out a study and analysis of the dynamics and structure of the tourist offer; execute valid comparisons; have a sample framework on offer to carry out surveys and define the localities with a tourist vocation, to mention but a few. In any case, this colaborative effort also acts in favour of a strengthening of the local capabilities in the subject of statistics, assuming of course, that through the provision of this GIS tool, the local toursim offices are taking on efficient instruments for statistical and spatial analysis, as well as the conceptual designs and frameworks and methodological developments supported by the relevant international recommendations, metadata etc., all of which are of fundamental importance to the development of statistical systems. However, it seems clear that in order to advance in the creation and development of a subnational perspective, it is necessary to attend to different tasks, as well as achieve the different aims involved in the adaptation of the conceptual framework of tourism statistics for the economic analysis at a subnational level. At the same time, it is important to broaden the scope of operations undertaken so that, as is the case with Mexico, the statistical systems of local tourism will be strengthened with an aim to comply with the ever frequent (and no doubt justified) data requirements from the local governments in order to measure and assess the contribution that tourism makes to the economy and its corresponding landscapes.
1 Director of Information Tourism Secretariat of Mexico, [email protected]
Enzo Paci Papers on Measuring the Economic Significance of Tourism (Volume 6)
Index
Introduction GIS, conceptual rules Tourism and GIS statistics: Uses cases in Mexico ‐ Geospatial reference, consultation and updating of basic data from the directory
compiled by the 280,515 economic units under census of similar and linked connected features.
‐ Statistical integration to allow for consultation at different levels of regional desegregation
‐ An analysis of the statistical data. ‐ Consultation of the geographical objects and spatial analysis Final thoughts References Annex: the RDI’s main features and capabilities
130
Geographic Information Systems: use cases for tourism analysis in local areas
INTRODUCTION When it comes to actual decision making, geographic information has become a fundamental component, not only amongst organisations in charge of planning and development, but also amongst those for whom a knowledge of the region, its behaviour and dynamics is a strategic resource that enables development and maximization of competitive sales as well the production of goods and services.
From this perspective then, these Geographic Information Systems (GIS), are data tools that can be used to significantly increase and extend the knowledge and analysis of tourism as seen from a regional context:
- Through the GIS, certain features can be developed that are aimed towards
gaining an understanding of the factors that make up the geographic ambit. From there, it allows for the establishment of a relationship between the statistical and descriptive information and the geography that brought them about, as well as integration, analysis and interpretation of this data. All of this comes together as a result of the many different solutions that the GIS bring about to capture, manipulate, recover, model and present geographically referenced data.
- On account of these features and their flexibility, the GIS also favour multiple
applications whose use can also have a considerable effect upon the design, development and/or strengthening of the statistical systems of local tourism, whilst also taking care to ensure that they are consistent with the existing conceptual design.
- An example of this is the way that a GIS enables the use of cartographic and
Geostatistical frameworks, both of which are invaluable for setting up boundaries where tourism activity takes place independently from the administrative area or group where it is to be found. The GIS then establishes the systems for an integration of lists of present tourist destinations within the region that have coding schemes compatible with the lists of regional integration that a particular country can have.
- Asides from supporting the most efficient production of tourist statistics, starting
with sample frameworks which are structured around geographical data, these types of applications also create an opportunity to maximize the use of other statistical sources’ databases which have been compiled for different aims for the same region (e.g. population and housing census, economic census, home surveys, land registry, administrative registers, etc.); in the same way, for the development of valid comparisons as well as for presenting data from different land aggregate levels according to statistical subject matter.
- Another example that could be used is the integration of maps on the supply and
demand of tourism (location, composition, features, behaviour, tendencies and projections), of basic infrastructure networks (electric, telephone, water, gas draining distributions etc.), transport (road, railway and sea inventories) and the impact that new infrastructures have on the region, in amongst other applications which are of no less relevance.
There are also numerous experiences from different countries of GIS applications that
can provide extremely useful training with regards to tourism. Amongst them, some of the examples worth mentioning are the ones pertaining to development in cadastral areas (definition and identification of suburbs, urban developments, generation of spatial information such as surfaces, borders, localization; determination of exact use of land, etc.);
131
Enzo Paci Papers on Measuring the Economic Significance of Tourism (Volume 6)
132
to the integration of environmental indices and inventories for natural resources (forest areas, conservation and exploitation of resources, inventories about land use, studies on environmental impact etc.); prevention and generation of risk avoidance maps based on historic models, detecting natural areas or focal points that are at high risk or related to human activity and determining the population that will potentially be affected or is at risk.
In light of all these considerations and without undermining any of the multiple examples that can also be quoted, this document has two main objectives: Firstly, to give a few examples that enable a GIS to be envisaged as a useful instrument in statistical procedure, particularly from a land perspective; at the same time, identify the benefits that have been described in Mexico of implementing the GIS entitled Referenced Data Geospatial Integrated within a System (RDIS) for the integration of tourism statistics from the supply side in the sub-national region. GIS, CONCEPTUAL DATABASES On a general level, a GIS is perceived as the organised integration of hardware, software, geographic data and human resources so as to “input, store, monitor, recover, update, analyse and produce information and the data that it contains is related with the features of the geographic places or regions. In other words, a GIS allows us to answer questions on where certain things are located or about what things are to be found in a determined place.”2
A GIS can supply the most diverse data that is linked with localisation and spatial organisation of activities in a region.
In fact, some of the assessments that a GIS carries out are focused on determining exactly what it is that exists within a determined space; where it takes place or where the conditions that determine its success are met; how much it has changed over time or what tendencies have been observed; which is the best path to follow; how it takes place or which guidelines or patterns of behaviour are observed, or what would happen if (…), all of which are of vital importance to enable the certain phenomena to be simulated.
It can be stated therefore, that one of the uses of the GIS is established in its ability to create models or representations of the real world – taking this to be a conception of geographic space – in terms of its position, special attributes and inter-relations, starting from a monitoring of the databases of heterogeneous sources of information to allow for its visualisation through causal relations.
In a GIS, there are two main formats for storing data: the vector model and the Raster or the net or regular cell matrix. The first one of the two is used as a representative of discreet traces or features from the real world through lines, points or polygons, etc.; whereas the second one is used to represent continual data, like phenomena with constant variation such as weather or altitude, in this way it can concentrate more on spatial properties than on the precision of localisation.
2 United Nations, Handbook on geographic information systems and digital mapping, UN publication, Sales number ST/ESA/STAT/SER.F/79, Series F No. 79, New York, 2000, p.133
Geographic Information Systems: use cases for tourism analysis in local areas
133
At the same time, it is common in a GIS for tools that have a wide capacity for graphic and alphanumeric processing to be used, as well as techniques to capture, store, analyse and visualise georeference data because it is the layer3 2the organisation’s fundamental principle which stops all the spatial features from being stored in one single place and allows for efficient gathering or visualisation of the data.
Figure 1: Layers concept in a GIS
However, the extraordinary and continued development of information and communication technology in the past years has tended to favour two relevant facts that have increased the use of the GIS for statistical functions:
The existence of a broad range of GIS applications, which are developed in line with the specific uses that have been defined by the organisations according to the aims that they are pursuing is how the incorporation of different types of methodologies from particular programmes specialised in a significant number of GIS software can be observed. As is the case with those that are focused on monitoring databases that allow for the administration of large quantities of reference data for digital mapping; treatment of images (e.g. editing, filtering, improving, restoring, etc.); CAD functions to edit graphic objects; to GPS communication protocols (Global Positioning System) and video treatment, to mention but a few.
Tied in with the previous topic, is the more flexible and recurring use of GIS which stands out when looking at the possibilities that its programmes offer when carried out in a broad range of equipment from servers to PCs, whether they are connected to the web or not, have become an important component of GIS technology.
In light of the huge versatility that defines them, the GIS’ field of application has
become ever wider, particularly in areas where the spatial element has a pertinent place.
In fact, in amongst the bodies of national statistics, the use of GIS has become commonplace, which in turn has strengthened the links between geography and technology, as well as increasing the capacity of the GIS to build bridges that are of particular importance between the process of generation and the use of the statistical data, including the one referring to small regions (see United Nations, 2000).
3 In conformity with the definition given by the NISGIT, a layer is the “Group of geographical instruments that have the same features and which are represented through vector (line, point or polygon types) and Raster formats.” For more information on the subject, V, National Institute for Statistics, Geography and Information Technology (NISGIT), 2007, p.14
Enzo Paci Papers on Measuring the Economic Significance of Tourism (Volume 6)
134
In the case of Mexico, the National Institute for Statistics, Geography and Information Technology (NISGIT) developed a system called Referenced Data Geospatial Integrated within a System (RDIS)4 as another means of disclosing the vast archive of data generated by the Institute, which has been endorsed by various public bodies from different levels of government (federal, state and municipal), with the Tourism Secretary (TourSec) standing out amongst them.
The increasing appropriation of RDIS has been due to the fact that it has statistical and geographical data from population and housing censuses, economic censuses, basic and census cartography, physical data, data from natural resources and infrastructure, as well as the fact that its design gives the user the opportunity to incorporate its cartographical and statistical data, define and change its cartographic projections and data, carry out spatial analysis and edit geographic objects amongst others.
From there, what stands out is the way that the TourSec has embraced this technology for statistical ends and to coordinate the efforts aimed at strengthening the statistical systems for tourism at local government level in the country. TOURISM AND GIS STATISTICS: USE CASES IN MEXICO In 2006, the TourSec together with NISGIT created a co-operative framework for the development of a project that would focus on integrating the tourism statistics generated by the 20045 Economic Census into the RDIS system.
Asides from facilitating and optimising the use of this information, one of the main
objectives of this project was providing a database to the tourism offices of the 32 local governments in the country that was sufficiently reliable and able to support the planning, development and promotion processes for regional development of tourism activity that is carried out within their own respective domains.
Depending on what has already been mentioned, and taking into consideration the features and capabilities of the RDIS system, both bodies decided upon developing this project through the integration of a geomatic solutions to allow for the following use cases: Geospatial reference, consultation and updating of the fundamental data from the directory adapted by the 280,515 economic units in the census of typical and related tourism activities. This was brought about based on a specifically established methodology for ensuring the appropriate quality and integration of the basic 21 data figures captured at this level for each economic unit in the census, in the same way as in the National Geostatistical Framework designed by NISGIT to correctly reference the statistical data from the census and surveys with their corresponding geographical locations.
4 A description of the RDIS Geographic Information System is included in Annex I. 5 Through the TourSec’s initiative, they made use of the 2004 Economic Census’ working methods so that from then on and for the very first time, statistics that were specifically based on tourism could be generated. These statistics are focused on a total of 1123 economic activities out of the 956 that were covered in the 2004 Economic Census in line with the classifier in use. They were explicitly defined as being related to and features of tourism, just like a series of criteria that was jointly established by TourSec and NISGIT and dealt with the international recommendations that were applicable. For further information, please refer to TourSec-NISGIT and also WTO, 2006.
Geographic Information Systems: use cases for tourism analysis in local areas
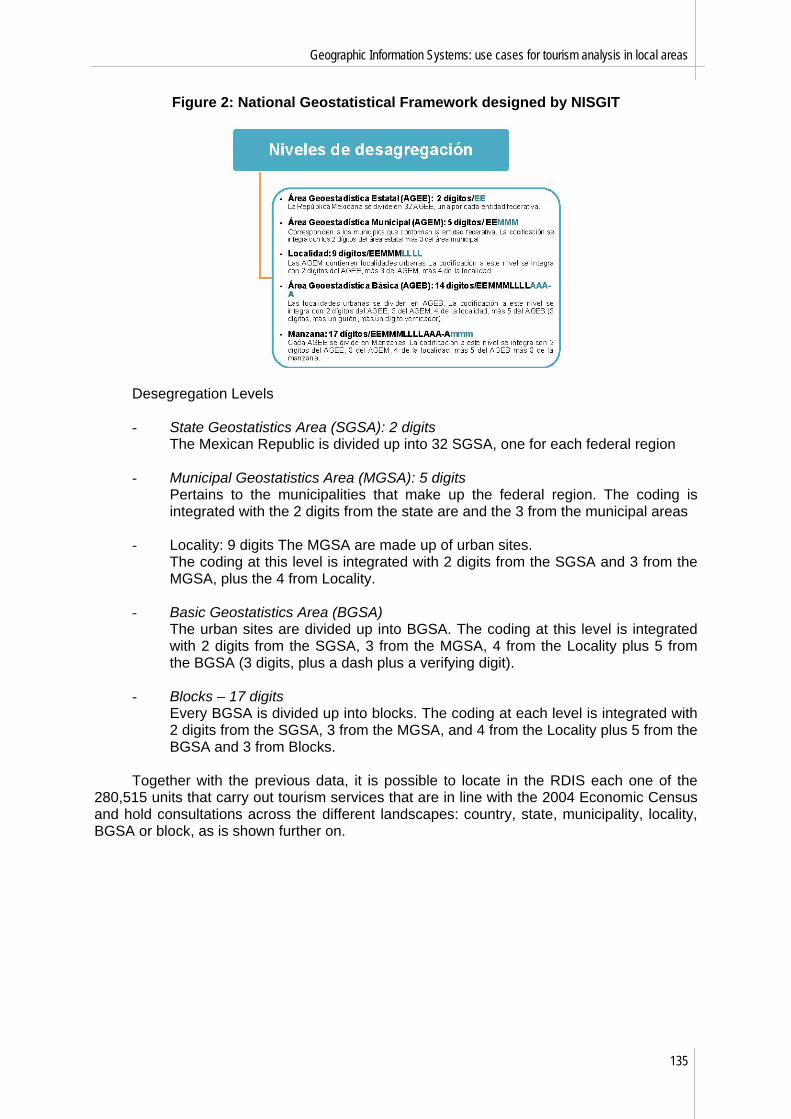
Figure 2: National Geostatistical Framework designed by NISGIT
Desegregation Levels
- State Geostatistics Area (SGSA): 2 digits The Mexican Republic is divided up into 32 SGSA, one for each federal region
- Municipal Geostatistics Area (MGSA): 5 digits Pertains to the municipalities that make up the federal region. The coding is integrated with the 2 digits from the state are and the 3 from the municipal areas
- Locality: 9 digits The MGSA are made up of urban sites. The coding at this level is integrated with 2 digits from the SGSA and 3 from the MGSA, plus the 4 from Locality.
- Basic Geostatistics Area (BGSA) The urban sites are divided up into BGSA. The coding at this level is integrated with 2 digits from the SGSA, 3 from the MGSA, 4 from the Locality plus 5 from the BGSA (3 digits, plus a dash plus a verifying digit).
- Blocks – 17 digits
Every BGSA is divided up into blocks. The coding at each level is integrated with 2 digits from the SGSA, 3 from the MGSA, and 4 from the Locality plus 5 from the BGSA and 3 from Blocks.
Together with the previous data, it is possible to locate in the RDIS each one of the
280,515 units that carry out tourism services that are in line with the 2004 Economic Census and hold consultations across the different landscapes: country, state, municipality, locality, BGSA or block, as is shown further on.
135
Enzo Paci Papers on Measuring the Economic Significance of Tourism (Volume 6)
Figure 3: The Mexican Republic’s State Geostatistics Framework
Figure 4: Distribution of the tourism economic units
Figure 5: An example of the data from a chosen economic unit
136
Geographic Information Systems: use cases for tourism analysis in local areas
Figure 6: An example of the data’s desegregation levels
In order to bring about a systematic updating of the data for each economic unit, a development of this principle is also in place on the Internet (RDIS system-Data Tour) and through it those in charge of the statistics in the tourism offices of the 32 local governments can carry out HLC (high low changes) procedures of the available registers, which are based on procedures designed by the TourSec for this end so as to ensure the integrity and quality of the data. Statistical integration to allow for consultation at different levels of regional desegregation The sociodemograpic and economic statistics from the following three fundamental sources were still incorporated: 2000 Population and Housing Census; 2005 Count Population and Housing and Tourism Statistics from the 2004 Economic Censuses.
The sociodemographic statistics take up to 171 different data variables into
consideration and can be used in the following levels of aggregation: country, state, municipality and locality, be it rural or urban, as is shown in the following tables:
137
Enzo Paci Papers on Measuring the Economic Significance of Tourism (Volume 6)
Figure 8: an example of a consultation of sociodemographic statistics from 2000
Figure 9: An example of a consultation at the highest level of desegregation
In the case of the tourism statistics from the 2004 Economic Censuses (which were
shaped by nearly 200 variables of the basic data) another level of desegregation was added onto it, which meant that the consultations could be realised at even a Basic Geostatistical Area (BGSA) level.
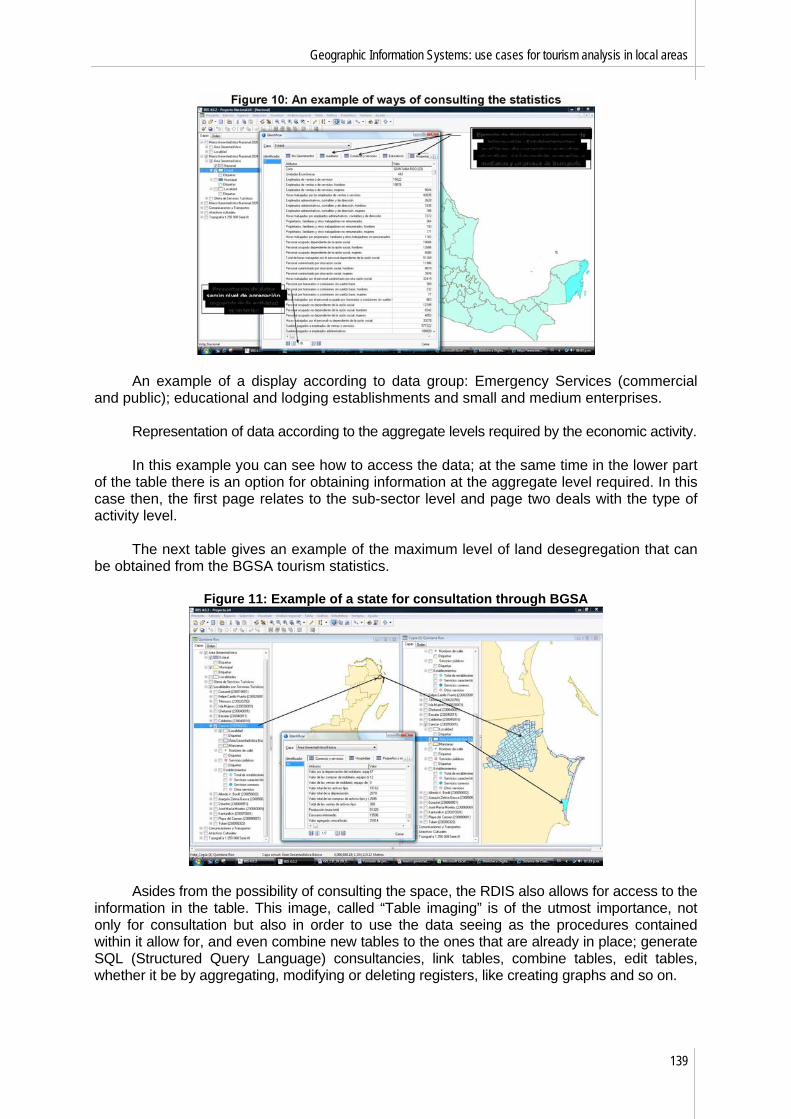
The tourism statistics are represented in a different way for transport companies and for emergency services (commercial and public). Small and medium enterprises receive special treatment as does accommodation, as can be seen in the following table.
138
Geographic Information Systems: use cases for tourism analysis in local areas
An example of a display according to data group: Emergency Services (commercial and public); educational and lodging establishments and small and medium enterprises.
Representation of data according to the aggregate levels required by the economic activity.
In this example you can see how to access the data; at the same time in the lower part of the table there is an option for obtaining information at the aggregate level required. In this case then, the first page relates to the sub-sector level and page two deals with the type of activity level.
The next table gives an example of the maximum level of land desegregation that can be obtained from the BGSA tourism statistics.
Figure 11: Example of a state for consultation through BGSA
Asides from the possibility of consulting the space, the RDIS also allows for access to the information in the table. This image, called “Table imaging” is of the utmost importance, not only for consultation but also in order to use the data seeing as the procedures contained within it allow for, and even combine new tables to the ones that are already in place; generate SQL (Structured Query Language) consultancies, link tables, combine tables, edit tables, whether it be by aggregating, modifying or deleting registers, like creating graphs and so on.
139
Enzo Paci Papers on Measuring the Economic Significance of Tourism (Volume 6)
Figure 12: An example of the functions associated with the data in the table
An analysis of the statistical data The RDIS principle allows for analysis of the statistical data in the tables and in differing layers of information to be carried out through the generation of thematic graphs and maps.
As can be seen in the following table, series of stratifications can be created, which
allow for data to be organised, classified and grouped according to a specific characteristic or criteria as defined by the user.
Figure 13: Examples of analytical functions
One of the uses of the RDIS in this field is for stratification through pre-defined methods like that of Delanius and Hodge, which has been used to organise, classify and consolidate groups of scattered data so as to establish ranks from standardization or to have deviations of projection factors and with them determine the size of sample, statistical projections etc.
Another method that has been used to analyse tourism statistics is the equal intervals method; the one pertaining to the number of equal elements so as to equate layers that have approximately the same number of elements, or the unique value method.
140
Geographic Information Systems: use cases for tourism analysis in local areas
141
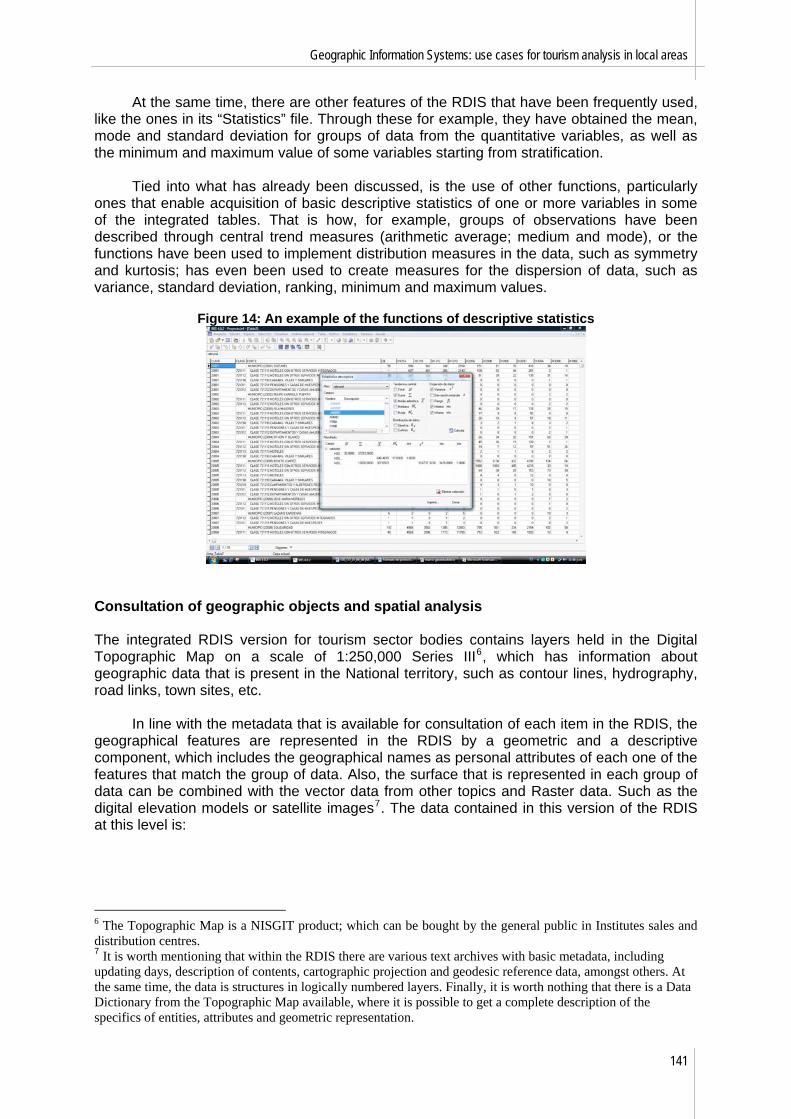
At the same time, there are other features of the RDIS that have been frequently used, like the ones in its “Statistics” file. Through these for example, they have obtained the mean, mode and standard deviation for groups of data from the quantitative variables, as well as the minimum and maximum value of some variables starting from stratification.
Tied into what has already been discussed, is the use of other functions, particularly ones that enable acquisition of basic descriptive statistics of one or more variables in some of the integrated tables. That is how, for example, groups of observations have been described through central trend measures (arithmetic average; medium and mode), or the functions have been used to implement distribution measures in the data, such as symmetry and kurtosis; has even been used to create measures for the dispersion of data, such as variance, standard deviation, ranking, minimum and maximum values.
Figure 14: An example of the functions of descriptive statistics
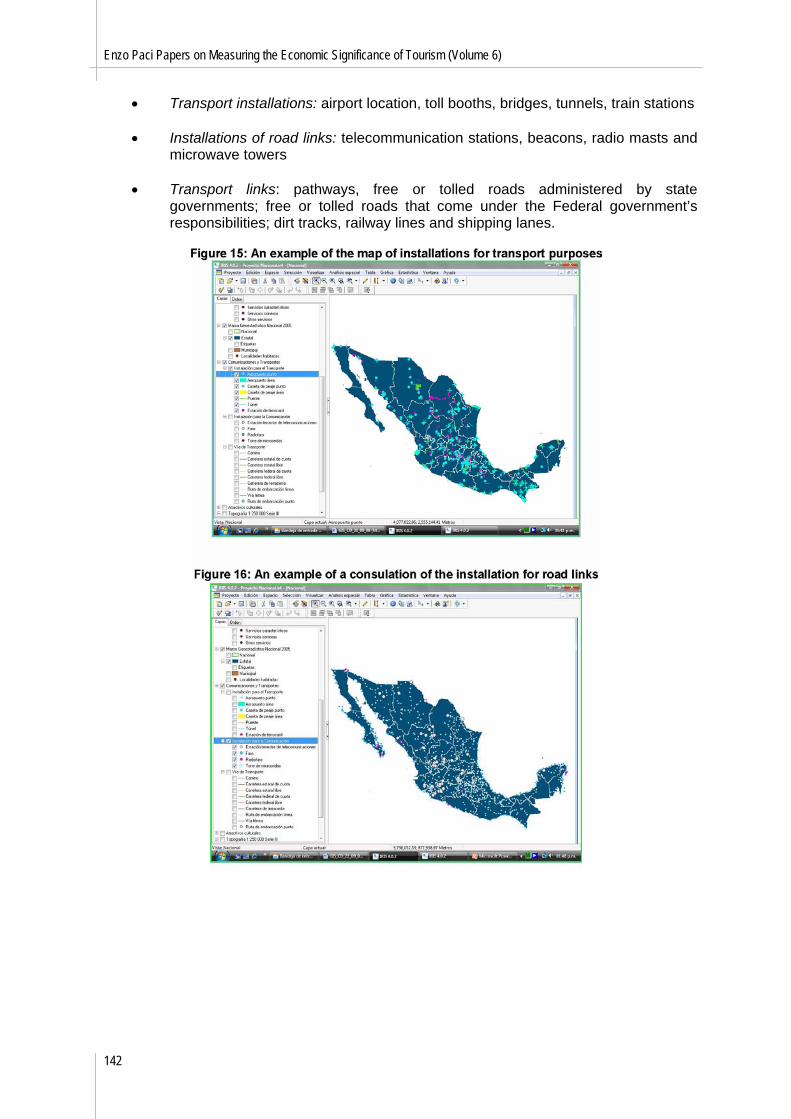
Consultation of geographic objects and spatial analysis The integrated RDIS version for tourism sector bodies contains layers held in the Digital Topographic Map on a scale of 1:250,000 Series III6, which has information about geographic data that is present in the National territory, such as contour lines, hydrography, road links, town sites, etc.
In line with the metadata that is available for consultation of each item in the RDIS, the geographical features are represented in the RDIS by a geometric and a descriptive component, which includes the geographical names as personal attributes of each one of the features that match the group of data. Also, the surface that is represented in each group of data can be combined with the vector data from other topics and Raster data. Such as the digital elevation models or satellite images7. The data contained in this version of the RDIS at this level is:
6 The Topographic Map is a NISGIT product; which can be bought by the general public in Institutes sales and distribution centres. 7 It is worth mentioning that within the RDIS there are various text archives with basic metadata, including updating days, description of contents, cartographic projection and geodesic reference data, amongst others. At the same time, the data is structures in logically numbered layers. Finally, it is worth nothing that there is a Data Dictionary from the Topographic Map available, where it is possible to get a complete description of the specifics of entities, attributes and geometric representation.
Enzo Paci Papers on Measuring the Economic Significance of Tourism (Volume 6)
• Transport installations: airport location, toll booths, bridges, tunnels, train stations • Installations of road links: telecommunication stations, beacons, radio masts and
microwave towers
• Transport links: pathways, free or tolled roads administered by state governments; free or tolled roads that come under the Federal government’s responsibilities; dirt tracks, railway lines and shipping lanes.
142
Geographic Information Systems: use cases for tourism analysis in local areas
Figure 17: An example of the transport links
• Island territory and orography: reefs, islands, low lying (sub-aquatic floors); orographical features (areas of sand or snow etc.), place names of geographical features; hypsographic images
• Hydrography: tides (intermittent or perennial); bodies of water, mud-banks,
swamps, floodplains; hydrographical features (waterfalls, disappearing tides, springs)
• Hydraulic and electric infrastructure: canals, ponds, aqueducts, reservoirs, dams,
electric substations, energy generating plants; transmission lines
Figure 18: An example of the island territory and orography
143
Enzo Paci Papers on Measuring the Economic Significance of Tourism (Volume 6)
Figure 19: An example of a consultatuon of floodplains, springs and mud-banks
Figure 20: An example of electric and hydraulic infrastructure elements
Figure 21: An example of a buffer type analysis from space Floodplains and tourist services offers
144
Geographic Information Systems: use cases for tourism analysis in local areas
145
FINAL THOUGHTS The cases that have been highlighted here are only a few of the many examples that exist. With them, it is clear that a GIS can be a very useful tool when it comes to approaching tourism analysis and its statistics from a regional perspective.
This is at least of the tourism offices belonging to the governments of the 32 states that make up the Mexican Republic have declared of the actual possibilities that that RDIS has brought them. At their disposal they have a highly flexible system with sufficient and reliable geographical and statistical data that is able to support the following, amongst others:
- The study and analysis of the dynamics and structures of the tourist offer by
means of every branch and type of activity for each one of the different landscapes: country, state, municipality, locality and BGSA, taking the fundamental variables related to individual occupation into account, gross production, gross aggregate value from the census, gross fixed capital formations, fixed assets and the revenue and expenses of the economic units, to mention but a few.
- Starting with the aforementioned, carrying out valid comparisons from the tourist
offer perspective, between actual tourist areas inside the country.
- Having a sample framework on offer so as to have access to the sample surveys and from there obtain statistics from the demand perspective. That is how it would be possible to maximise the use of these statistics for home surveys.
- A measurement of the importance of these tourism activities through the structure
and dynamics of the economies of each one of the states of the Republic, starting with indices or establishment of causes (e.g. the capacity to attract private investment according to the economic competition and specialisation; growth of production according to the stability of the economic cycle, employment and working conditions, etc.)
According to the above, it is clear that the collaborative efforts of the TourSec and the
NISGIT also contribute to a strengthening of regional capability on statistical matters. This is of course under the assumption that through systems like RDIS the local tourism offices are given their own efficient tools to carry out statistical and spatial analysis, as well as conceptual designs and frameworks and developments in methodology that are supported by the relevant international recommendations, metadata etc., all of which are of fundamental importance to the development of statistical systems.
In spite of the aforementioned, it is still necessary to put these advancements into perspective, especially in light of the huge tasks that must be accomplished in order to move on in the creation and development of a subnational perspective.
In amongst these, what stands out is the fulfilment of different goals by adapting the conceptual framework of the tourism statistics to make an economic analysis at this level (which is no small feat). Also, the scope of the operations that have been undertaken must be broadened so that, as in Mexico’s case, there is an option to generate continual statistics8 that allow them to meet the ever regular (and of course justified) data requirements of the local governments used to measure and evaluate tourism’s contribution to the economy and its corresponding landscapes.
8 It is important to remember that the tourism statistics that are generated from the Economic censuses are a vast and exhaustive picture but one related to 2003 and up until 2009 when a new census will be carried out.
Enzo Paci Papers on Measuring the Economic Significance of Tourism (Volume 6)
REFERENCES Durán, Citlalin & Leyva, Gerardo, “The economic censuses, an invaluable opportunity to
expand the basic statistics of tourism supply: The case of Mexico”, Tourism satellite account (TSA): implementation project. Enzo Paci papers on measuring the economic significance of tourism (Volume. 5). Madrid, World Tourism Organization, 2006. pp. 27-43
Dollfus, Olivier. El espacio geográfico. Barcelona, Oikos-Tau, 1990, 121 pp. Instituto Nacional de Estadística, Geografía e Informática (INEGI) y Secretaría de Turismo,
Estadísticas de turismo con base en los censos económicos 2004. México, INEGI, 2006, 2193 pp.
Instituto Nacional de Estadística, Geografía e Informática (INEGI), Taller Integral Básico IRIS
versión 4.0, México, 2007, 383 pp. Naciones Unidas, Manual de sistemas de información geográfica y cartografía digital,
publicación de Naciones Unidas, N° de Venta ST/ESA/STAT/SER.F/79, Serie F N° 79, Nueva York, 2000, 228 pp.
146
Geographic Information Systems: use cases for tourism analysis in local areas
147
ANNEX. THE RDIS SYSTEM’S MAIN FEATURES AND CAPABILITIES In accordance with what was established by NISGIT’s98 General Geography Office, the RDIS system was developed by this organisation with the aim of promoting and enabling the use, interpretation and integration of geographical data and National statistics and with this to broaden the knowledge and study of the features of the region. This in turn would be conducive to making decisions based on technically supported factors. Asides from a standard interface, the RDIS has the following capabilities: Administration Create projects, create Space, Tables and Graph imaging; open, copy, rename, insert, delete, close and extract images; obtain sample images, configure printing and print Space and Table imaging; find and display recent projects; display images through waterfall and mosaic; offer help documents organised in menus and toolbars. Space Imaging Add layers of Raster and vector data and groups of data; create, cut, copy, move and attached geographic objects, layers and groups data; find and replace texts in the administrative branch of layers and groups of data; identify and modify general data, display properties,metadata, co-ordinates systems and projection of layers of vector data; identify and modify names, descriptions and metadata from groups of data; copy display features, archives and metadata and coordinate systems, from one layer of vector data to another; change the cartographic projection of the layers of data to more than 20 types of projections and more that 100 types of data; configure background colour, selection colour, maps and autoregeneration units; identify and associate features and documents in various formats to geographical objects; access the features tables and the tables related to the layers of vector data. On top of the above, other possibilites are creating and modifying thematic and multithematic, qualitative and quantitative maps; configure display labels for geographic objects, create new layers of data separate from the exisiting layers; measure distances, obtain the metrics of geographical objects, as well as perimetres and surfaces of virtual polygons; edit the vertices of geographical objects; add symbols and fill patterns to use in the display of objects and layers of data; select and deselect geographical objects from layers of vector data through consultations, intersections, contents and coincidences or using various tools for consideration afterwards in the execution of other operations; carry out different visualisation tools relating to geographical objects and layers of data to carry out dynamic approximations and separations, approximations to layers, objects, shifts, etc.; carry out individual and multiple selections in the administrative branch of layers; and carry out spatial analysis operations, such as generating a buffer, disperse, extract, intersect and combine layers of data. Table imaging Carry out SQL consultations; execute similarities between basic and features tables; combine; edit; carry out and adapt tables; add and delete registers; create and modify structures of tables; couple tables with table descriptors; modify alias tables; find and replace data in tables; modify the order of registers in tables; select fields in tables to be printed; select and deselect table registers through a consultation or by using various tools for 9 For more information, see NISGIT, 2007
Enzo Paci Papers on Measuring the Economic Significance of Tourism (Volume 6)
altering consideration when carrying out other operations; and obtain basic descriptive statistics from one or more variables in the tables, as well as measuring the level of intensity in similarities between the variables. Graphic imaging Create graphics; define values, titles and 3-D effects; modify the background colour, lines and labels and modify and visualise the configuration.


![Rosa Navarro Durán - data.bnf.fr · avec Rosa Navarro Durán comme Éditeur scientifique Los Clasicos al alcance de los ninos. - Rosa Navarro Duran. - [1] (2006) El Quijote contado](https://static.documents.pub/doc/80x56/60d16a2d0db1714feb59d66d/rosa-navarro-durn-databnffr-avec-rosa-navarro-durn-comme-diteur-scientiique.jpg)


