Geographic Geographic Variation Variation in Health Care in Health Care Presentation for: IOM Panel on Geographic Variation in Healthcare Spending and Promotion of High-Value Care Michael Chernew
Transcript
Geographic VariationGeographic Variationin Health Carein Health Care
Presentation for:
IOM Panel on Geographic Variation in Healthcare Spending and Promotion of
High-Value Care
Michael Chernew
Practice patterns vary widely for similar patientsPractice patterns vary widely for similar patients
Source: Wennberg and Gittelsohn, 1973. Science 183(4117): 1102-1108.
Surgical ProcedureSurgical Procedure Lowest Two Lowest Two AreasAreas
Number of Procedures per 10,000 for 13 Vermont hospital service areas, 1969
Voluminous literature Voluminous literature
4x variation in cesarean delivery (Baicker 4x variation in cesarean delivery (Baicker et al 2006)et al 2006)
1.6x variation in antibiotic fills PMPY, 51.6x variation in antibiotic fills PMPY, 5thth--9595thth percentile (Steinman 2009) percentile (Steinman 2009)
13.5x variation in odds ratio for type of 13.5x variation in odds ratio for type of vascular access for dialysis patients (Hirth vascular access for dialysis patients (Hirth et al 1996)et al 1996)
Variation in spending as well as in useVariation in spending as well as in use
Source: Fisher et al, 2009
Why is this important?Why is this important?
Changes beliefs away from notion that Changes beliefs away from notion that physicians are always rightphysicians are always right– Weakens notion that practice of medicine is purely Weakens notion that practice of medicine is purely
sciencescience
Quantifies potential waste in the systemQuantifies potential waste in the system– Not sure how to best get rid of ‘waste’Not sure how to best get rid of ‘waste’
Translating the population based results to the bedside is Translating the population based results to the bedside is hardhard
Helps identify ‘efficient’ marketsHelps identify ‘efficient’ markets– Is Minneapolis more efficient than Miami?Is Minneapolis more efficient than Miami?
Explaining variationExplaining variationExplanations that generate concern
Explanations that we typically accept
Explanations withuncertain implications
• Health Status
• Health behaviors
• Patient Preferences
• Input Prices
• Physician supply
• Infrastructure
• Insurance
• Output prices
• Beliefs
• Greed
• Culture
• Income
• Cost shifting
Empirical implicationsEmpirical implications
SpendingSpendingimim = X = Xii**11 + Z + Zimim * *22 + M + Mmm + + ii
MMmm denotes mean spending at the market denotes mean spending at the market level after adjusting for personal traits (X) level after adjusting for personal traits (X) and market traits (Z)and market traits (Z)
Adding X’s and Z’s will shrink variation in Adding X’s and Z’s will shrink variation in M’s if:M’s if:X or Z affects spending AND varies across X or Z affects spending AND varies across
marketsmarkets
Health statusHealth status
Clearly important at individual levelClearly important at individual level
Varies across markets (implying important Varies across markets (implying important at market level)at market level)
Hard to measureHard to measure
Conceptually circularConceptually circular– If more treatment improves health, areas with If more treatment improves health, areas with
aggressive practice styles will seem healthieraggressive practice styles will seem healthier
Controversy in measuring health Controversy in measuring health statusstatus
More aggressive places code more illness, so More aggressive places code more illness, so populations appear ‘sicker’populations appear ‘sicker’– Are they really sicker or do they just code more?Are they really sicker or do they just code more?– If just coding, the health status adjustments ‘over’ If just coding, the health status adjustments ‘over’
adjust.adjust.
People who move have ‘increases’ in measured People who move have ‘increases’ in measured illnessillness– Moving to area with 1 quartile higher spending Moving to area with 1 quartile higher spending
associated with a 5.9% increase in HCC score (Song associated with a 5.9% increase in HCC score (Song et al, 2010)et al, 2010)
Other approaches to health status Other approaches to health status adjustmentsadjustments
Look at specific diseasesLook at specific diseases
Examine end of lifeExamine end of life
Variation in price adjusted spending by Medicare beneficiaries.
Source, Sutherland et al. 2010, NEJM
SES mattersSES matters
50% of variation in discharges explained 50% of variation in discharges explained by SES, crude health status measures, by SES, crude health status measures, and physician supply measuresand physician supply measures– Robust by area definition (county vs health Robust by area definition (county vs health
care market)care market)– Robust to methodsRobust to methods
Source: McLaughlin et al, 1989McLaughlin et al, 1989
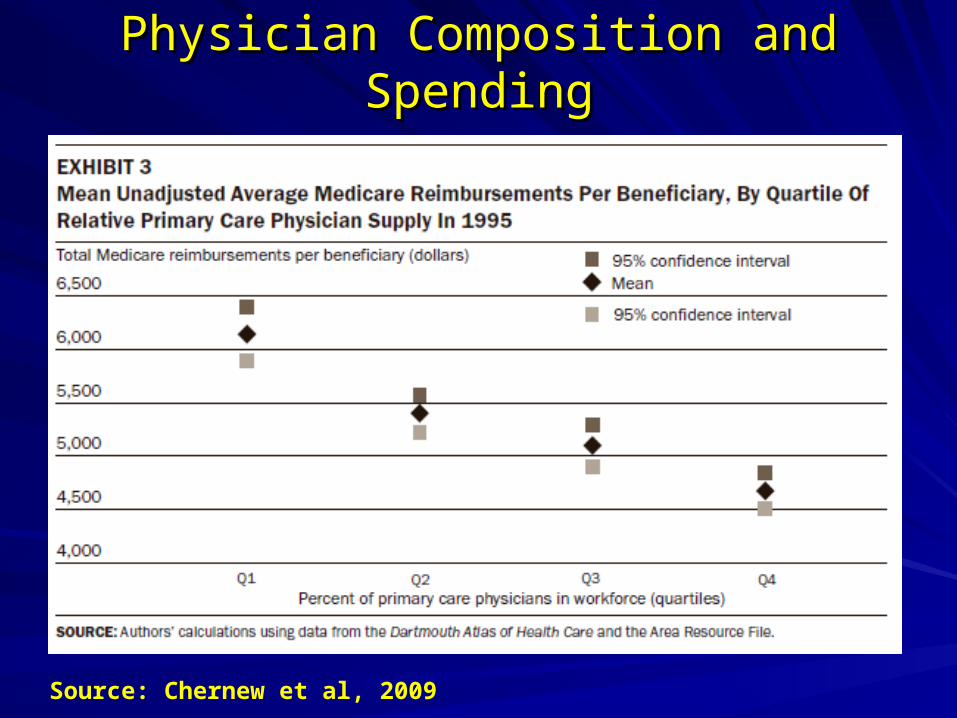
Physician Composition and SpendingPhysician Composition and Spending
Source: Chernew et al, 2009
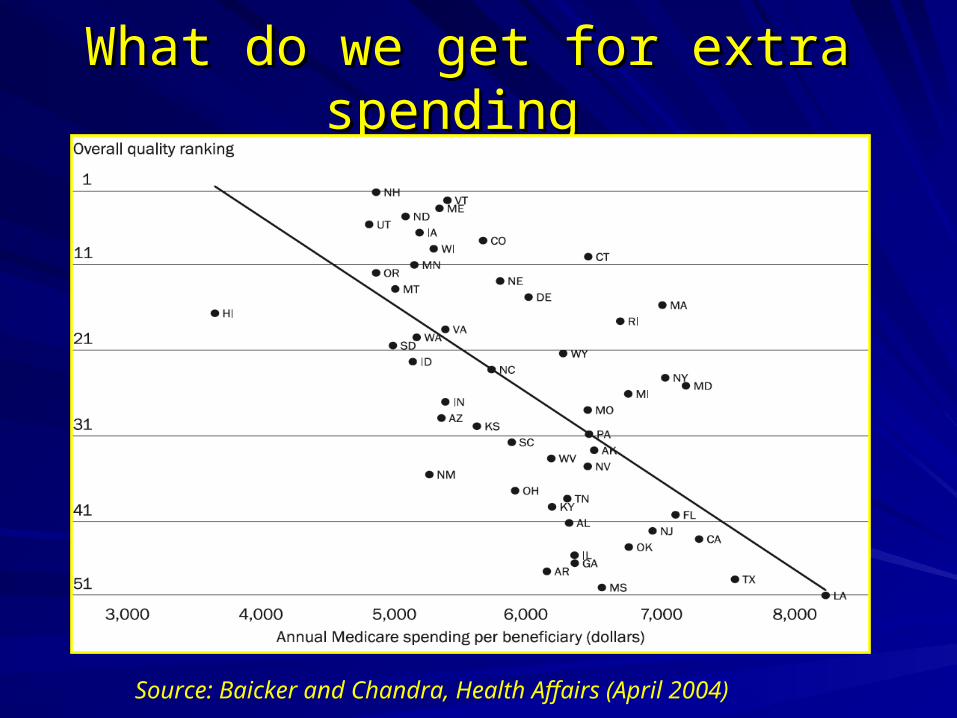
What do we get for extra spending What do we get for extra spending
Source: Baicker and Chandra, Health Affairs (April 2004)
LimitationsLimitations
Tendency for Medicare focusTendency for Medicare focus– Cost shiftingCost shifting– Erroneous inference about areasErroneous inference about areas– Salience of LTC services and maybe fraudSalience of LTC services and maybe fraud
Uncertain policy solutionsUncertain policy solutions– Area focus obscures within area provider Area focus obscures within area provider
heterogeneityheterogeneity
Commercial vs. MedicareCommercial vs. MedicareCorrelation
Level Level
(2006)(2006)
GrowthGrowth
1996 - 20061996 - 2006
Hospital and Hospital and Physician Physician Reimbursements Reimbursements (2006)(2006)
-.17-.17
(p<0.01)(p<0.01)
.20.20
(p<.01)(p<.01)
Per Capita Inpatient Per Capita Inpatient Days (2004)Days (2004)
0.590.59
(p<.01)(p<.01)
.13.13
(P<.01)(P<.01)
Source: Chernew et al, 2010
Concentration and spendingConcentration and spending
Population
Hospital Concentration
Top third Commercial spending markets, 2006
600,145 0.434
Bottom third commercial spending markets, 2006
1,081,223 0.312
Top third Medicare spending markets, 2006
1,365,559 0.240
Bottom third Medicare spending markets, 2006
603,580 0.464
Source: Chernew et al, 2010
Provider variation more complexProvider variation more complex
Selection issues more salientSelection issues more salient– Health status adjustments difficultHealth status adjustments difficult
Attribution issues are complexAttribution issues are complex