American Geographical Society Geographical Record Source: Bulletin of the American Geographical Society, Vol. 36, No. 6 (1904), pp. 352-368 Published by: American Geographical Society Stable URL: http://www.jstor.org/stable/198888 . Accessed: 09/05/2014 00:54 Your use of the JSTOR archive indicates your acceptance of the Terms & Conditions of Use, available at . http://www.jstor.org/page/info/about/policies/terms.jsp . JSTOR is a not-for-profit service that helps scholars, researchers, and students discover, use, and build upon a wide range of content in a trusted digital archive. We use information technology and tools to increase productivity and facilitate new forms of scholarship. For more information about JSTOR, please contact [email protected]. . American Geographical Society is collaborating with JSTOR to digitize, preserve and extend access to Bulletin of the American Geographical Society. http://www.jstor.org This content downloaded from 169.229.32.137 on Fri, 9 May 2014 00:54:21 AM All use subject to JSTOR Terms and Conditions
Transcript
American Geographical Society
Geographical RecordSource: Bulletin of the American Geographical Society, Vol. 36, No. 6 (1904), pp. 352-368Published by: American Geographical SocietyStable URL: http://www.jstor.org/stable/198888 .
Accessed: 09/05/2014 00:54
Your use of the JSTOR archive indicates your acceptance of the Terms & Conditions of Use, available at .http://www.jstor.org/page/info/about/policies/terms.jsp
.JSTOR is a not-for-profit service that helps scholars, researchers, and students discover, use, and build upon a wide range ofcontent in a trusted digital archive. We use information technology and tools to increase productivity and facilitate new formsof scholarship. For more information about JSTOR, please contact [email protected].
.
American Geographical Society is collaborating with JSTOR to digitize, preserve and extend access to Bulletinof the American Geographical Society.
http://www.jstor.org
This content downloaded from 169.229.32.137 on Fri, 9 May 2014 00:54:21 AMAll use subject to JSTOR Terms and Conditions
Chaillz-Long's Work on the Nile. Chaillz-Long's Work on the Nile.
In conclusion, the question of the maintenance of the name of Lake Ibrahim, and the correction of certain errors on sheets 28, 36, and 37 of the map of Africa, were submitted to General Bassot, Director of the Geographical Service of the French Army. Gene- ral Bassot's reply as to Lake Ibrahim is categoric:
There is for a fact identity between Lake Ibrahim and the lake traced by Mac- donald* in I897 and named by him Choga. Besides, all the lakes of this region have retained the European names with which their discoverers have baptized them (Vic- toria, Albert, Rodolphe, etc.). There is not, therefore, any reason not to maintain that of Lake Ibrahim, and this name will be again adopted for subsequent editions of sheet No. 36 of the map of Africa.
CH. CHAILLE-LONG.
GEOGRAPHICAL RECORD.
AMERICA.
THE PASSAIC RIVER FLOODS OF 1902 AND 1903.-The regime of this river, the largest in New Jersey, and its recent floods are described by George B. Hollister and Marshall 0. Leighton in
Water Supply and Irrigation Papers Nos. 88 and 92. The Passaic
drainage basin covers 949 square miles, nearly all in the northeast- ern part of New Jersey. About one-third of the population of the State lives on or near the river, and its water powers have devel-
oped great industries in Paterson, Passaic, and other large towns. Its waters, however, are of largest value for municipal supply.
The main gathering-ground of the system is the Highland area, a granitic and crystalline mountain region extending in a belt
northeasterly through northern New Jersey into New York, with a width in New Jersey of fifteen to twenty miles. It has a general altitude of 1,000 to 1,500 feet above sea-level.
Adjoining the Highlands on the southeast is the Central Basin, a depression eight to twelve miles wide and thirty-two miles long, standing at an elevation of about I80 feet above tide water. Much of the basin is occupied by marsh or wet lands, easily flooded when the stream rises moderately and widely submerged in great floods. This Central Basin is an agricultural region, occupying 17 percent. of the entire area of the basin.
The third topographical section is the Lower Valley, densely
* " Une page d'Histoire de la Geographie Africaine." Comptes Rendus de l'Asso- ciation Fran9aise pour l'avancement des Sciences, Congres de Paris 900o, pp. I004-
1013.
* " Une page d'Histoire de la Geographie Africaine." Comptes Rendus de l'Asso- ciation Fran9aise pour l'avancement des Sciences, Congres de Paris 900o, pp. I004-
1013.
352 352
This content downloaded from 169.229.32.137 on Fri, 9 May 2014 00:54:21 AMAll use subject to JSTOR Terms and Conditions
populated, dotted with manufacturing towns, and so narrow that it does not afford sufficient outlet in times of flood. The result is that the congestion of the waters in excessive freshets does great damage to some of the towns and the surrounding districts.
In the flood of 1902 the losses were naturally greater in the agricultural regions of the Central Basin and the narrow Lower Valley below Little Falls than in the valleys of the tributaries among the Highlands. The area of the flooded land was about 32,000 acres. The damage was greatest in the neighbourhood of Passaic, where the loss was not less than $r,ooo,ooo. The cause of this flood was excessive rainfall upon snow among the mountains late in February and early in March.
The flood of 1903, between October 8 and 19, was the greatest and most destructive ever known along the Passaic. It was the immediate result of an enormous rainfall, and not, as is most fre- quently the case, the combined effect of rainfall and the melting of snow. Between October 8 and ii rain fell to an average depth of 11r.74 inches over the Passaic basin. The damage was not less than $7,000,000, about one-third of it in the city of Paterson.
The writers say that under present conditions floods may be expected at frequent intervals. Immunity from floods can be secured only by the construction of catchment reservoirs in the Highlands or of levees in the Lowlands. Levee construction would impede business and would involve more damage than is now caused by floods; but reservoirs in the Highlands may be con- structed economically and provide storage to compensate for the period of low water, thus maintaining water-power at Paterson, Passaic, and other points, providing for municipal water supply in the future, and preventing floods.
THE MISSISSiPPI FLOODS OF THE SPRING OF 193.--The Weather Bhreau has recently published a valuable report on the disastrous floods along the Mississippi River in the spring of 1903 (The Floods of the Spring of 1903 in the Mississippi Watershed, by H. C. Franken- field, District Forecaster, in Charge of River and Flood Service, Bulletin M, 4to, 1904. Pp. 63, Charts XV). This report is abun- dantly illustrated with half-tone cuts and with fifteen charts, and is altogether a very complete and instructive monograph. The floods of March and April, 1903, which occurred in the lower Ohio and lower Mississippi, were notable because of the unprecedentedly high stages which occurred in the latter river. The stages of the water were, with a few exceptions, greater than any before known
353
This content downloaded from 169.229.32.137 on Fri, 9 May 2014 00:54:21 AMAll use subject to JSTOR Terms and Conditions
from Memphis to the Passes, exceeding the previous highest stages (principally those of 1897) from 0.9 feet at New Orleans to 2.8 feet at Memphis. Where the crest stage was below the maximum stage of 1897 the deficiency was usually due to crevasses in the levees. In this way the flood-plane from Helena to Vicksburg was materially lowered. Above Memphis the crevasses in the St. Francis levee resulted in a considerable loss of water, which re- entered the Mississippi by way of the White River, the mouth of which is 87 miles below Helena. Hence the flood-crest at Helena was naturally depressed.
The flood began in a series of heavy rains during February, which were caused by a succession of cyclonic storms of the south- western type, these cyclones being excellent rain-producers. The excess of precipitation during the month ranged from one inch to seven inches, the maximum fall being south of the Arkansas- Louisiana line. In consequence, the river passed the danger line at all points, beginning at Arkansas City on February 20 and at
Memphis and Helena on February 22. The rains extended over the watershed of the Ohio, especially in Kentucky, and thus the later flood-wave from the Ohio was received by the lower Missis-
sippi after the latter had risen to the danger line. The Ohio River, with its many mountain tributaries bringing down water from the
melting snows, together with the heavy spring rainfalls, was there- fore the principal sustaining power of the flood. The heavy rains continued through the first decade of March, and the rivers con- tinued to rise, slowly and steadily. The first flood warnings were issued at Pittsburg and Memphis on February 28, and the last at New Orleans, fifty-nine days later. The Mississippi rose in a long and practically continuous swell from Cairo to the Gulf, as in the
previous great flood of 1897, but during the latter the rise extended north to the mouth of the Missouri.
A close study of the flood conditions of 1882, 1897, and 9'o3 brings out the following interesting and important facts: At Mem-
phis the river was above the danger line in 1903 for 54 days, as
against 65 and 53 days in 1882 and 1897, respectively, but it re- mained at 38 feet or higher for 13 days and at 40 feet for 2 days in 1903; while in 1882 and 1897 the highest stages were 35.2 and
37. feet respectively. At New Orleans the river was at or above the danger line (i6 feet) in I882 for six days, with a maximum
stage of 16.2 feet; in 1897 it was at or above the danger line for
75 days, and at 19 feet or more for 29 days, with a maximum stage of 19.5 feet; while in 1903 it was at or above the danger line for
354
This content downloaded from 169.229.32.137 on Fri, 9 May 2014 00:54:21 AMAll use subject to JSTOR Terms and Conditions
85 days, and at or above 19 feet for 43 days, with a maximum
stage of 20.4 feet. The conclusion is that the cause of these differences in the three floods in the lower Mississippi River is to be found in the restraining influence of the levees, which have been in course of construction for many years, and especially during the
past ten years. These new levees, except where crevasses oc- curred, served to confine the flood to the immediate channel of the river, and consequently an abnormal increase in the height of the flood-crest was inevitable. The more levees are built, and the more they are improved and strengthened, the higher the
stages become. The overflowed territory comprised 6,820 square miles in I903,
13,580 square miles in 1897, and previously to 1897 the greatest extent was 29,970 square miles. The losses resulting from the flood are impossible to estimate, even approximately, but they were
comparatively insignificant as contrasted with the amount of
property saved. The most expensive features of the flood were connected with the strengthening and repairing of levees and with the repairing of railroads.
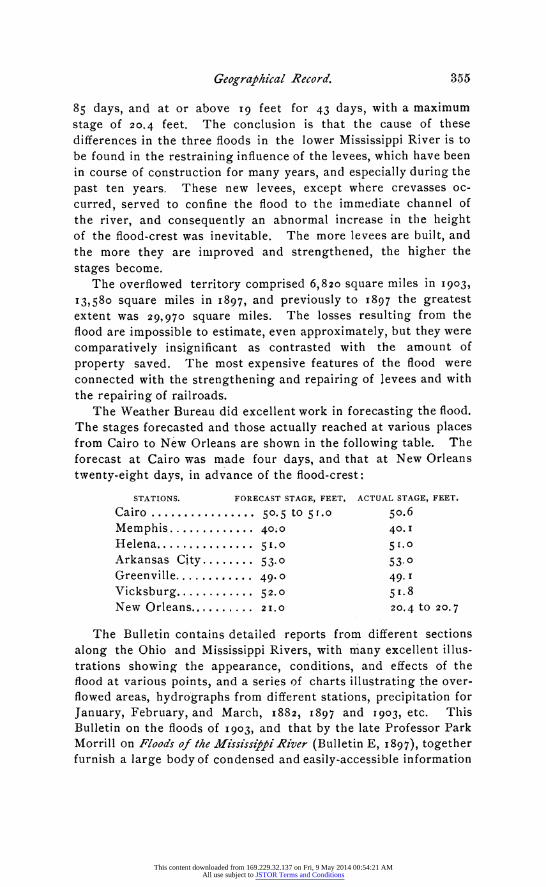
The Weather Bureau did excellent work in forecasting the flood. The stages forecasted and those actually reached at various places from Cairo to New Orleans are shown in the following table. The forecast at Cairo was made four days, and that at New Orleans twenty-eight days, in advance of the flood-crest:
STATIONS. FORECAST STAGE, FEET. ACTUAL STAGE, FEET.
Cairo ............... 50.5 to 5r. 50.6
Memphis ........... 40.o 40. i Helena ...... ....... .. 51.0 Arkansas City........ 53.0 53.0 Greenville ........... 49. o 49. Vicksburg ........... 52.0 51.8 New Orleans ........ ..o 20.4 to 20.7
The Bulletin contains detailed reports from different sections along the Ohio and Mississippi Rivers, with many excellent illus- trations showing the appearance, conditions, and effects of the flood at various points, and a series of charts illustrating the over- flowed areas, hydrographs from different stations, precipitation for January, February, and March, 1882, i897 and 1903, etc. This Bulletin on the floods of 1903, and that by the late Professor Park Morrill on Floods of the Mississippi River (Bulletin E, 1897), together furnish a large body of condensed and easily-accessible information
355
This content downloaded from 169.229.32.137 on Fri, 9 May 2014 00:54:21 AMAll use subject to JSTOR Terms and Conditions
in regard to these floods, which are necessary and characteristic consequences of a series of heavy spring rains over the Mississippi and Ohio watersheds. R. DEC. W.
GLACIAL EROSION IN THE FINGER LAKE VALLEYS.-The fact of
over-deepening of the valleys of Cayuga and Seneca Lakes was brought forward by Lincoln twelve years ago (Amer. Journ. Sci., Vol. XLIV, 1892, 290-30I) and by Tarr two years later (Bull. Geol. Soc. Amer., Vol. V, i894, 339-356). Both authors made use of the discordant tributary valleys (hanging valleys) as evidences of over- deepening by ice action. Cayuga Lake especially is very tortuous, and is known to be 435 feet deep, and Seneca Lake is 640 feet in depth, while a boring on its delta is still in drift at a depth of i,o80 feet. The tributary valleys hang at least 400 feet above lake level in each case, making the amount of over-deepening over 800 feet in the case of Cayuga and more than 1,400 feet in the Seneca valley-a truly prodigious amount for ice to have eroded.
Tarr (American Geologist, Vol. XXXIII, No. 5, 1904, pp. 271-
291) puts forward the evidences which he has observed in ten years' study since writing his first paper. It must be confessed that some of the observations he cites are hard to reconcile with the glacial erosion hypothesis: (i) Not all the tributary streams hang at a uniform level, though the grade of the gorges is not in all cases determinable. (2) The large lake basins have a gorge form. It is hard to conceive of ice concentrating its cutting power along a narrow zone with the winding course of a stream. (3) Angular cliffs, banked with moraine unquestionably not postglacial, and occurring only below the zone of over-deepening, suggest little of the rounding action of eroding ice. (4) Residual decay, on rocks from which postglacial weathering has not yet effaced glacial strire, does not well correlate with vigorous ice-scouring. (5) A cave in limestone seems to indicate that the over-deepening was at least preglacial. (6) An island in Cayuga Lake would hardly stand in the face of a destructive ice-tongue. (7) The troughs of the Finger Lakes are transverse to the main direction of ice advance, limiting the time of ice erosion to the period when a thin lobe filled these valleys. This diminution in depth also limits the effective- ness of ice as an abrasive agent. (8) It is difficult to imagine- though this is the weakest of the arguments-the product of I,ooo feet of glacial erosion carried south of the divide by overwash action. That this must have occurred if the ice eroded these val- leys is indicated by the fact that the morainic deposits, with their
This content downloaded from 169.229.32.137 on Fri, 9 May 2014 00:54:21 AMAll use subject to JSTOR Terms and Conditions
large percentage of materials from still farther north, are totally inadequate to restore the filling of the Finger Lake gashes.
Here surely is an arraignment of glacial erosion. L. M.
INTERGLACIAL GORGE PROBLEM.-The question of the drainage history of the Finger Lake region has long puzzled those working in that field. That the key to the enigma will not be gained by generalized study is evidenced by the fact that so many papers on this locality have been published without definitely settling the problem. Only when detailed work has been done on all the minor questions, such as that of the relative age of the gorges, will the larger problem be settled. One welcomes, therefore, every piece of detailed work, and that of Matson (Journ. Geol.,Vol. XII, No. 2, I904, I33-15I), done as a master's thesis after investigations ex- tending over two years' graduate work at Cornell, is a distinct con- tribution. Mr. Matson shows that a complex series of interglacial gorges exists, that there is possibility of several interglacial periods, and he estimates that the shortest of these was at least as long as postglacial time. One cannot help regretting that he failed to pub- lish the map which he made, and to which he refers continually in the text, for its absence makes the local observations, otherwise of high value, totally unintelligible to any one personally unfamiliar with the field. It will eventually be as the result of such painstak- ing, detailed work as this of Matson's that the life record of the streams in the Central New York plateau will be worked out.
L. M.
HISTORY OF THE UNITED STATES GEOLOGICAL SURVEY.-The Government has just printed (Bulletin No. 227, Geological Survey) an interesting account, written by Chief Clerk Rizer, of the origin, development, and work of this important branch of the public ser- vice. All phases of the service are described without any techni- calities, so that the reader may get a clear idea of what is done, the methods used, and the purpose to be served. Many may find espe- cial interest in the pages devoted to the preparation of the maps, from the original surveys on which they are based to the drawing, editing, engraving, printing, and distribution of the fine sheets turned out by the Survey. The story is told in 205 pages, includ- ing a good index. The Bulletin is illustrated with excellent photo- graphs and maps, including a map showing the areas controlled by triangulation or traverse in the year 1903-04.
357
This content downloaded from 169.229.32.137 on Fri, 9 May 2014 00:54:21 AMAll use subject to JSTOR Terms and Conditions
EXPLORATION IN SOUTH AMERICA.-Erland von Nordenskjold spent last year in the exploration of the Gran Chaco of Argentina. He is now engaged in another great field to the northwest. His first endeavour is to explore the little known region in the north- west of Bolivia, and to make zoological and plankton researches in -Lake Titicaca, with the special view of ascertaining whether this large body of water, which now stands 4,000 metres above the sea, was of maritime origin. He will later undertake archaeological, ethnographical, and zoological explorations in the almost com- pletely-unknown forest region through which the Madre de Dios River flows. His scientific assistants are the zoologist Dr. Holm- gren and Lieutenant Bildt. The expedition is supported by pri- vate subscriptions, and is expected to occupy about a year and a half.
EUROPE.
GEOLOGICAL MAP OF LONDON.-Nature (No. I802) says that the British Geological Survey has issued, in colours, a drift map of the area around London. The scale is one inch to a mile, and the four sheets are sold at is. 6d. each. The map will replace the old hand-coloured geological map of London and its environs, the cost of which was 30s. The reduction in price will be a boon to all interested in the geology of the Metropolitan district. The execu- tion of the map was carried out at the Ordnance Survey Office, and the colour printing is excellent.
THE GERMAN COLONIAL MUSEUM.-It has been proved that there is a necessity for the existence, in those countries having colonial possessions, of museums as aids to a better knowledge of their possessions. Such museums exist in England, France, Holland, and Belgium, and exert a great influence. The German Colonial Mu- seum owes its existence to the Colonial. Exposition held in I896. It
arose from private efforts, and was opened in the presence of the
Kaiser, October, I899. Later the German Colonial Company guar- anteed a certain sum for its maintenance, and with this assistance it has become one of the greatest museums of the world. In the museum are panoramas and dioramas of various parts of the pos- sessions, showing dwellings and manner of dress, articles used by the natives, and the products of the colonies. A botanical section shows the plants used by the inhabitants. There are representa- tions in relief of harbours, atolls, etc. These collections serve to show what will be useful in German colonial possessions. There are also pictures showing the historical development of the colonies,
358
This content downloaded from 169.229.32.137 on Fri, 9 May 2014 00:54:21 AMAll use subject to JSTOR Terms and Conditions
as well as collections made by the Niger-Benue-Chad Expedition. In April, I90o, a lecture hall was completed, in which 571 lectures were given, illustrated with lantern-slide projections. For teachers there is a series of 12 lectures, which, during last winter's semester, was attended by 250 persons; but it was necessary to arrange four series instead of one, as 926 persons had applied for admission to the course.-(Deutsche-Kolonialzeitung, April 7, I904.)
ASIA.
IRRIGATION IN INDIA.-A second edition of "Irrigation in
India," by Mr. Herbert M. Wilson of the Geological Survey, has
just been published as "Water Supply and Irrigation Paper No.
87." The first edition was exhausted in a few years owing to the creation of the Reclamation Service in charge of our Geological Survey and the impetus it has given to irrigation in our western States. The second edition has been brought up to date, and its readers will find it a compact and comprehensive history of irriga- tion in India and account of the more important irrigation works there. The great success of irrigation enterprises in that country is encouraging the development of similar works in other lands. At the close of I90o the total expenditure upon all classes of irri-
gation work by the Government of India had been $337,850,000. In the fiscal year 1900-I90o the total irrigation expenditures were
$Ir,500,000 and the revenues were $I2,075,000, showing a profit of 7.5 per cent. on the capital outlay for construction. About one- tenth of the entire acreage cultivated was irrigated, and the esti- mated value of the irrigated crops was $5,000,000.ooo.
EXPLORATIONS IN SIBERIA.-A new expedition under Mr. Tolnia- choff is being organized by the Russian Geographical Society for the exploration of the region between the mouths of the Yenisei and the Lena Rivers.
THE CLIMATE OF THE RUSSO-JAPANESE WAR FIELD.-Newspaper reports concerning the progress of the war between Russia and
Japan have contained frequent allusions to the effect of weather conditions, such as the cold, heavy rains, etc., upon the movements of the troops, but, on the whole, the average reader of these reports has but a vague idea of the climate of the region where this great conflict is taking place. Indeed, the whole subject of the influence of climate upon military operations is one which has received but little attention, although military commanders, to be thoroughly
359
This content downloaded from 169.229.32.137 on Fri, 9 May 2014 00:54:21 AMAll use subject to JSTOR Terms and Conditions
equipped for their tasks, ought certainly to be cognizant of the conditions of cold and heat, of rain and snow, of ice and flood, of wind and dust, which they are likely to encounter during their campaigns. A short chapter in Maguire's Outlines of Military Geography (1899) deals but superficially with this subject.
Recently two short papers have been published which give a very brief outline of the climate of Siberia, Korea, and Manchuria. One of these is by Dr. Frank Waldo on Climatic Features of the Field of the Russo-Japanese War (Review of Reviews, May, 1904), and the other is by Professor E. W. Garriott on the Climate of Siberia, Korea, and 2Manchuria (Monthly Weather Review, March, 1904). The winter cold of Siberia is certainly the most striking feature of the climate of this whole district. Under the control of the winter anticyclone of northeastern Eurasia the temperatures in Siberia become excessively low, the January means reaching --60 at the centre of the Siberian "cold pole." This is the result of active radiation in the dry, clear, calm air of the continental in- terior during the long, cold winter nights. During the winter months the winds along the eastern coast of Asia are prevailingly from the northwest. Hence the cold from the continental interior is carried to the coast, and even for some distance offshore, thus
giving the districts bordering on the sea winter temperatures much lower than the mean annual temperatures of their latitudes. These conditions are quite similar to those along the northeastern coast of North America. At Lake Baikal, which cuts the line of the Trans- Siberian Railroad, the monthly mean temperature during the winter months is below zero, the lowest mean--6.8?, being in January. Because of this great cold the lake is usually frozen to a great depth by January, and is in this condition for three or four months. The freezing of Lake Baikal has given the Russians much difficulty; temporary rails have been laid on the ice during the winter, and
heavy ice-breakers have also been employed to ferry the trains across when a channel could be kept open. Mercury is frozen for weeks together during December, January, and February in south- ern Siberia. The Siberian coast has a winter climate which may be compared with that of Labrador. It is very cold in winter and
spring, and the harbours are frozen. Hence the difficulty which the Russians have experienced with the freezing of the harbour at
Vladivostok, and their desire to secure an ice-free port farther
south, which has really been one of the underlying causes of the
present war. Woeikof attributes the excessively low winter tem-
peratures of Vladivostok, which has a January mean of 4.60, to the
360
This content downloaded from 169.229.32.137 on Fri, 9 May 2014 00:54:21 AMAll use subject to JSTOR Terms and Conditions
fact that at this point the top of the divide, across which the cold air from the interior has to pass, is only 590 ft. high. Hence the protection afforded by the coast range of mountains is much less than it is at other places on the coast.
During the summer the pressures over the continent are low, the winds along the coast are generally on shore, and the tempera- tures are high. In the interior, where the January mean was -60?, the July mean is + 60?, giving a mean annual range of I20?, the largest to be noted anywhere on the chart of mean annual ranges of temperature. The maximum temperatures during the short summer are frequently above 9go in Siberia, northern Manchuria, and northern Korea, and even as far north as Verkhoyansk, where the January mean is-56.2?, and the absolute minimum tempera- ture has been recorded as below-9go. During the summer the winds are mainly south and southeast along the coast; there is more rain than in winter, and there is much fog along the northern coast.
In Manchuria the many fertile valleys, which will be able to
supply much food for the soldiers, are chiefly watered by the sum- mer monsoon rains. Extremes of cold are less marked than farther north, but the rivers are frozen during the winter. Niuchwang has monthly mean temperatures below freezing during December, January, February, and March. In July and August the mean temperatures are 77.7? and 74.4?, respectively 4.
? and 4.0? higher than the corresponding means at New York.
Over northern Korea the winter temperatures fall to o0? to 15? below zero; consequently the rivers are frozen for several months. The prevailing winter winds are cold, from the northwest. In southern Korea the winter temperatures are near zero. Snow falls during much of the winter, even down to the southern point of the. peninsula. Chemulpho, on the western coast, has temperatures which average several degrees below those of Washington in winter, but agree closely with those of the same latitude on our Atlantic coast during the rest of the year. At Seul the January mean is 24.3?, and the July mean is 81.1?, Washington, D. C., having 31.8? and 77? in the same months. The summer is warm and rainy, and the relative humidity high. Floods are apt to occur during the warmer months, rendering the streams and roads impassable.
In general, the chief factors to be reckoned with in the war are probably the extreme cold of the winter, more severe in the north, less severe in the south of the field of war, but sufficient to cause much suffering and to change conditions of transportation by the
361
This content downloaded from 169.229.32.137 on Fri, 9 May 2014 00:54:21 AMAll use subject to JSTOR Terms and Conditions
freezing of the rivers; the snowstorms (blizzards) of the winter; the summer heat, which is likely to cause suffering, especially if the campaign is then going on in the south; the summer rains, with the possible washouts, floods, and difficulty of marching; and for the navies concerned, if the ships should happen to be at sea, the danger of a typhoon during the late summer or early autumn, which might cause a more serious loss than several naval engage- ments. R. DEC. W.
AFRICA.
THE APPEARANCE AND DISAPPEARANCE OF A MUD ISLAND AT
WALFISH BAY.-An article by Mr. F. W. Waldron in the Trans- actions of the South African Philosophical Society, Cape Town
(Vol. XI, pp. 185-I88), describes an interesting phenomenon in Wal- fish Bay. The bay is largely protected from ocean storms by a
peninsula extending northward from its southern shore and termi-
nating in Pelican Point. On June I, 900o, the residents saw that an island of mud had risen above the sea near Pelican Point. It was 45 metres long, 9 metres wide, and in its highest part rose 5 metres above sea-level. Its sides were quite steep. The existence of the island was very short, for on June 7 it had entirely disap- peared. Its appearance seems to have been due to the existence of a submarine mud volcano near Pelican Point. To this volcano is attributed the exhalation of sulphur gases, which have often been observed there, and which at the time the island was formed were
especially strong. The large mortality, from time to time, among the fish in Walfish Bay, is attributed to these exhalations.
LAKE ASSAL.-In his Report on Abyssinia (No. 1940, Daily Con- sular Reports), Consul Skinner says that Lake Assal, near the Gulf of Tajura, on the French coast of East Africa, has an immense sup- ply of good salt, and offers excellent prospects to those who may undertake its exploitation. A concession has been granted for the
working of these salt beds. Lake Assal is somewhat phenomenal in its conditions. Its surface comprises about i6 square miles. It is surrounded by numerous small, steep mountains, which make it
very difficult to travel along the shores. The water is salt to the
point of saturation, and at the lowest level of the lake a bed of salt over a foot thick is exposed along the margins. It was not known for years whence Lake Assal derived its water. The problem was solved in i885 by the French traveller Henry Audon, who, while
examining the shores, heard the murmur of a waterfall. He found
362
This content downloaded from 169.229.32.137 on Fri, 9 May 2014 00:54:21 AMAll use subject to JSTOR Terms and Conditions
a large brook, which threw itself into the lake. It was as salt as the ocean, from which, in fact, its water is derived. The lake lies about 400 feet below sea-level. It is now known that its waters come from three brooks which flow from the Gubbut el Karab, a little bay to the east of the Gulf of Tajura. Thus the waters of the Indian Ocean are carried inland to fill this depression in the interior. The salt from Lake Assal has occasionally been carried as far as Abyssinia.
VON ERLANGER'S EXPLORATIONS IN NORTHEAST AFRICA. -In the years I899-1901, Carlo Freiherr v. Erlanger made a journey in the southern part of Abyssinia, and southeast along the Jub River to its mouth, which was very rich in geographical results. Starting from Zeila, on the Red Sea, his route was through Harar to Adis- Abeba, Dolo, and Bardera, on the middle Jub, to Gobwen, on the Indian Ocean, at the mouth of the Jub River. His caravan num- bered at the start 80 Somalis with I20 camels, 30 men of the Issa tribe, and 5 Europeans, among whom were the physician Dr. Ellen- beck, the cartographer Holtermiiller, and the biologist Hilgert. The journey was particularly rich in scientific results, and among its most notable products was a map in four sheets, which has been printed in the Zeitschrift of the Berlin Geographical Society (No. 2, 1904).
The surveys were so carefully made that it has been possible to show on the Berlin map a large amount of topographic detail. Every noteworthy feature of the surface was brought into its proper relation with the route survey; for hours at a time the topographer halted from one minute to another to determine a new direction of the route, so that every turn of the road was re- presented on the route map. The cartographic material was worthy of the best processes of reproduction, and it has been most care- fully reduced and generalized on the sheets published by the Ber- lin Society. Material provided by earlier explorers was utilized as far as it was helpful. The map will be very useful for the improve- ment of the atlas sheets of this part of Africa.
POLAR.
THE DANISH LITERARY GREENLAND EXPEDITION.-This expe- dition, for whose safety much anxiety has been felt, is reported from Copenhagen to have returned in good health from Saunders Island, north of Melville Bay, to Danish southwest Greenland. The party, which left Denmark in June, 1902, underwent much
363
This content downloaded from 169.229.32.137 on Fri, 9 May 2014 00:54:21 AMAll use subject to JSTOR Terms and Conditions
hardship. Its purpose was not so much to explore new regions as to collect the best material for a general description of the island and its people and publish a book which should be both interest-
ing and scientifically accurate. It was sent out at the expense of various societies and private individuals. There were only four
specialists in the party. Mr. Ericksen, the leader, was to be the historian. The painter Harald Moltke, known for his paintings of the aurora borealis, was to have charge of the pictorial treat- ment of the volume. Knud Rasmussen, born in Greenland and master of the native language, was to be interpreter and collec- tor of folk-lore and songs, and Dr. Hertelson, the physician, was to have charge of botanical and ornithological collections and make
anthropological measurements and other studies of the natives.
Arriving in Greenland, the party spent the summer with the
hunting expeditions of the Eskimos, and also penetrated the west coast to the inland ice, where they discovered that the South Isortok and Evigheds fiords are separated from the true inland ice by a lower region of lakes and streams, which receive the waters of the ice-cap. They also found, between the Evigheds and Sondre Str6m fiords, two rows of nunataks, forming virtually two consecutive mountain ranges. These details are not found on any of the existing maps.
After wintering at Jakobshavn, the party, in February, 1903,
sledged to the northern Danish colony of Upernivik, whence Erick-
sen, Rasmussen, and Moltke started along the coast for Cape York. They reached Saunders Island, north of Cape York, at the end of April, where they were found in June by two Dundee whalers. Dr. Bertelson had returned to Europe in poor health.
Last fall two Dundee whalers brought news that they found the
party in great destitution and dependent solely upon the kindness of the Eskimos for food. Count Moltke was seriously ill. In spite of the perilous situation of the men, the whalers declined to take them on board, but left them some supplies and material with which to build a boat. It appears that, later, Captain Amundsen reached Dalrymple Rock, a little south of Saunders Island, on his
way to the west,to begin his work of re-locating the position of the North Magnetic Pole. He further relieved the necessities of the three explorers.
It is reasonable to suppose that their sledge journey along the
coast of Melville Bay may take that shore-line out of the category of the uncharted coasts of Greenland. This coast is known in its northern half through the sledge journeys of Peary, but its south-
364
This content downloaded from 169.229.32.137 on Fri, 9 May 2014 00:54:21 AMAll use subject to JSTOR Terms and Conditions
ern half has been only vaguely outlined. This is the first time that a sledge expedition has skirted the entire coast of Melville Bay.
MAPS.
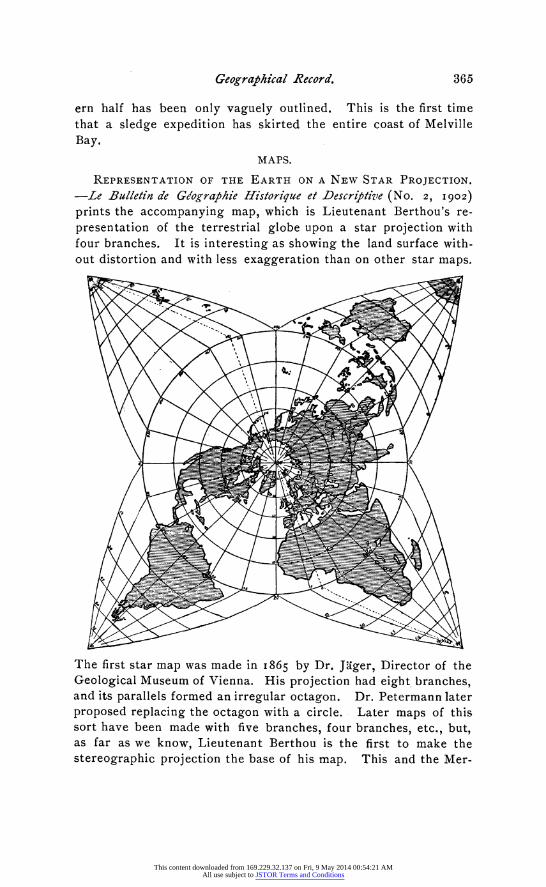
REPRESENTATION OF THE EARTH ON A NEW STAR PROJECTION.
--e Bulletin de Ge'ographie Historique et Descriptive (No. 2, I902) prints the accompanying map, which is Lieutenant Berthou's re- presentation of the terrestrial globe upon a star projection with four branches. It is interesting as showing the land surface with- out distortion and with less exaggeration than on other star maps.
The first star map was made in 1865 by Dr. Jiger, Director of the Geological Museum of Vienna. His projection had eight branches, and its parallels formed an irregular octagon. Dr. Petermann later proposed replacing the octagon with a circle. Later maps of this sort have been made with five branches, four branches, etc., but, as far as we know, Lieutenant Berthou is the first to make the stereographic projection the base of his map. This and the Mer-
365
This content downloaded from 169.229.32.137 on Fri, 9 May 2014 00:54:21 AMAll use subject to JSTOR Terms and Conditions
cator projection alone represent areas without distortion, though there is exaggeration. On Lieutenant Berthou's map the conti- nental forms are well represented in the graphic delineation. By using the stereographic projection, Africa, for example, appears correctly to extend farther north and south than east and west. The contrary impression is given to any one not accustomed to map- reading by the equidistant projection now very commonly employed. This map, perhaps better than any other star map, gives a striking and accurate picture of the world and of the relations of the con- tinents with one another and with the oceans.
AN ECONOMIC MAP OF GERMAN EAST AFRICA.-The Zeitschrift, of the Berlin Geographical Society (No. 3, I904), gives an interest:
ing account of this map, which has been prepared by Dr. Karl
Uhlig. The map shows important advance in our knowledge of the
largest and most valuable of the German colonies. It is in two
sheets, on a scale of I: 2,000,000, or 31.56 statute miles to an inch. The first sheet shows the distribution of minerals, of useful animals and plants, of cattle culture and various industries; the second is
given to general conditions of vegetation, native agriculture, and the development of plantations. The accompanying text fully explains the variety of information presented. Four classes of roads are shown-the important caravan routes, routes that can be used only in the dry season, native paths from village to village, and native paths that may be used by caravans. The extent and
importance of these classes of roads are shown with the greatest clearness, and also the time and cost of land journeys between the chief stations of the Protectorate. Navigation along the coast, on the great central lakes, and along the rivers is shown, the river facilities being very limited. Areas of importance for mineral
products, such as gold and other metals, precious stones, graphite, coal, and salt, are indicated in red. The distribution of the ele-.
phant, ostrich, zebra, hippopotamus, and rhinoceros is laid down, and also the areas of copal, rubber, and wax production. A series of symbols shows the importance of cattle-raising in various parts of the territory. The distribution of the native forms of vegeta- tion is distinguished from the regions where Europeans have intro- duced new cultural plants, as coffee, potatoes, vegetables, wheat, and other European grains, vanilla, Spanish pepper, the teak tree, the agave, and cotton. The native agricultural products shown include millet (from which the natives prepare their beer or pombe), maize, rice, manioc, sweet potatoes, beans, peas, bananas, the
366
This content downloaded from 169.229.32.137 on Fri, 9 May 2014 00:54:21 AMAll use subject to JSTOR Terms and Conditions
mango, sugar cane, peanuts, sesame, and other oil plants, the cocoa palm, and tobacco. Only a cursory examination is required to give an idea of the extraordinary variety of information clearly expressed on the map.
GENERAL.
At its meeting, on April 22, the Paris Geographical Society con- ferred gold medals on Dr. Sven Hedin and Captain Lenfant.
The Government of Iceland, which, for years, has been endea- vouring to secure sufficient funds to lay a cable between the island and Europe., has now appropriated about $io,ooo a year for twenty years, to establish wireless telegraphy with Europe and between the principal towns of Iceland.
Dr. Karl Alfred Von Zittel, the well-known Professor of Geology in the University of Munich, and President of the Bavarian Academy of Sciences, died on January 5. He was born in I839. For many years he has been one of the leading representatives of geological and paleontological science. His great Handbook of Paleontology is a standard authority. As a member of the Rohlfs Expedition to the Sahara in 1873-74 he proved that the Sahara was not an ancient sea-floor, as many had supposed. One of the features that gave especial prominence to his History of Geology was his development of the topic of Physical Geography.
THE SUDAN ALMANAC, I904.-This interesting publication appears in less than six years after the fall of Omdurman and the end of the Mahdist regime. It is for the use of the European and Mohammedan residents of the Anglo-Egyptian Sudan, and is crowded with helpful information. Along with the calendar is a list of events important in the history of that large region. The Mohammedan and Gregorian calendars are printed in parallel col- umns.
Among other items are the periods of high and low Nile and of the rainy and dry seasons, the latitude and longitude of twenty- two important towns in Egypt and the Sudan, the Coptic and Abys- sinian calendars, a list of the Sudanese officials in the eleven provinces, and the chief town in each province, the distances by the Nile from Damietta and Khartum of all important towns on. the river, the distances from one town to another on the Sudan railroad, and the caravan routes, postal and telegraph information, Sudan weights and measures, with equivalents in British and
367
This content downloaded from 169.229.32.137 on Fri, 9 May 2014 00:54:21 AMAll use subject to JSTOR Terms and Conditions
metric measures, money conversion scales, meteorological notes, the times of sowing and reaping Sudanese crops, and the average quantity per feddan, and many matters of special interest to the
army. Omdurman still has a population of 48,000, while the rebuilt
Khartum, the capital of the Sudan, has only 8,ooo. The total
population of Sudan is given at about 1,500,000 to 2,000,000. The
estimate of 12,000,000 for the population, before the rise of the
Mahdi, may have been greatly exaggerated, though it was decreased to a frightful extent under the rule of the Khalifa. The contents of this pocket manual will be of value to all who are interested in
the progress of the Sudan.
NEW MAPS.
AMERICA.
UNITED STATES.--Map of flooded lands in the Passaic Valley. Natural scale, i :63,360, or one statute mile to an inch. Annual Report of the State Geologist of
New Jersey for I903. Trenton, I904. A section of the State map, showing the lands submerged by the great floods of
October, I903; also the site of the proposed controlling dam near Little Falls.
UNITED STATES.-Map of the flooded area in the Central Basin, New Jersey. Natural scale, 1:126,720, or two statute miles to an inch. In "Water Supply and
Irrigation Paper" No. 88. U. S. Geological Survey, Washington, D. C., I903.
A section of the map of New Jersey, showing the basin of the Passaic River, and indicating the areas in the so-called Central Basin of the Passaic that were
covered with water in the spring floods of 1902.
UNITED STATES.--Map of the United States, showing localities which produce
gypsum. Scale about 275 miles to an inch. U. S. Geological Survey, Washing-
ton, I904. The map illustrates Bulletin No. 223 of the Survey, entitled " Gypsum Deposits
in the United States." The centres of gypsum production, shown in red, are
widely scattered from near the Atlantic to the Pacific coast.
UNITED STATES.-Map of the State of New York, showing surface configura- tion and watersheds. Natural scale, I:760,320, or I2 statute miles to an inch.
Supplied by the New York State Museum to illustrate the Report of the State Water
Storage Commission, New York, I903.
Green lines show the boundaries of the drainage basins in the State. Topography is indicated by contours emphasized by shades of brown. The contour interval is
200 feet, except on the coast, where it is 50 feet. The map gives, on a comparatively small scale, a very good idea of the topography of the State and of the extent of the
various drainage basins within its borders.
ALAsKA.-Southeastern Alaska and part of British Columbia, showing the
award of the Alaska Boundary Tribunal, Oct. 20, I903. Scale, I:960,ooo, or I5.I statute miles to an inch. Department of the Interior, Ottawa, Canada.
368 368
This content downloaded from 169.229.32.137 on Fri, 9 May 2014 00:54:21 AMAll use subject to JSTOR Terms and Conditions