Chapter-II
- 32 -
Chapter-II
GEOGRAPHICAL SETUP
2.1 Introduction
2.2 Location of Study Area
2.3 Administrative Divisions
2.4 Physiography
2.5 Climatic Condition
2.6 Geology
2.7 Soil
2.8 Natural Vegetation
2.9 Drainage System
2.10 Digital Elevation Model
2.11 Road Network
2.12 Demographic Dimensions
2.13 Socio-Economic Setup
2.14 Conclusion
2.15 Suggestions
References
Web-References
Chapter-II
- 33 -
CHAPTER – II
GEOGRAPHICAL SET-UP
2.1 Introduction
Relief, drainage, slope, soil, climate, vegetation all are important
physical features. Human resources such as population growth, male-
female ratio, population distribution, etc. are equally important
component of geographical studies. In general, both physical and socio-
economic aspects are directly or indirectly impacting on the growth of a
region. Ultimately, physical and human resources are controlling Land
use and Land cover of the region.
Miraj tahsil is the most urbanized tahsil of Sangli district. Sangli-
Miraj-Kupwad Municipal Corporation is the biggest urban area of Sangli
district, is located in Miraj tahsil. The proportion of urban population in
the tahsil is increasing very fast, as a result the pressure on natural
resources is increasing day by day. The agriculture in the western part of
the tahsil is quite developed than eastern part. The irrigated and well
fertile land of western part is converting into saline land whereas dry
land of eastern part is being brought under cultivation through canal
irrigation. The changing land use and land cover is compelling to
comprehend the resources in Miraj tahsil. On the whole, Miraj tahsil is
experiencing several changes, which require systematic study in this
concern the understanding of geographical set-up of tahsil is very much
essential.
The assessment of physical and socio-economic condition helps to
understand the present geographical setting and its potentialities for
futuristic development. Therefore, with this view an attempt is made in
this chapter to know the geographical setting of Miraj tahsil.
2.2 Location
Miraj Tahsil is situated in the river basins of Krishna River. It is
bounded by Jath tahsil to the east, Kavathe-Mahnkal, Tasgaon to the
Chapter-II
- 34 -
north-east and north, Palus and Walwa tahsils to the north-west and
west. Miraj tahsil is sharing its boundary with Kolhapur district (Shirol
and Hatkanangle tahsil) and Belgaon district (Athani tahsil) of Karnataka
state.
2.3 Administrative Divisions
Upto 1948 Miraj (senior) and Miraj (Junior) were functioning as
erstwhile Princely States. The present Sangli district was named as
South Satara in 1949, which included four talukas viz. Tasgaon,
Khanapur, Walwa and Shirala (transferred from old Satara district) and
two new talukas namely Miraj and Jath formed out of the former Princely
States. In 1960, the name of South Satara district was changed to Sangli
district with its headquarters at Sangli in Miraj taluka. On 1st August
1964, Miraj taluka was reconstituted. The administration of Miraj tahsil
is functioning through tahsildar office located at Miraj and urban
governance by Municipal Corporation office located at Sangli.
!
!
!
!
!
!
!
!
!
!!
!
!
!
!! !
! !
!
!
!
!
!!
!
!!
!!!
!!
!!
!
!
!
!!
!!
!
!
!
!
!
!! !
!
!
!
!
!!
!
!
! !
!
!!
!
!
!
!
!
!6
5
43
21
9
87
65
64
63
62
61
576960
68 59
56
55541667 53
58
52
2551
24 5023
4049
15
66
48
1447
3946
13 12 454438
22 2120
37
43
36
42
1110
353433
41
19
18
3217
31
30
29
28
27
26
Arag
Malgaon
Miraj
Kavalapur
Sangli
Budhgaon
Kasbe Digraj
1 Arag 2 Lingnur
3 Bedag 4 Khatav 5 Shindewadi
6 Laxmiwadi 7 Kavaji Khotwadi 8 Nandra
9 Bisur10 Karnal
11 Bhudhgaon (U)12 Madhavnagar (U)
13 Padmale14 Kupwad (U)15 Bamnoli
16 Wanleswadi (U)17 Tung18 Kasabe Digraj
19 Mouje Digraj20 Kavathe Piran
21 Sheri Kavathe22 Dudhgaon
23 Samdoli24 Savalwadi25 Malwadi
26 Karoli27 Soni28 Bhose
29 Kavalapur30 Kakadwadi
31 Patgaon32 Sambarwadi
33 Siddhewadi34 Rasulwadi35 Kharkatwadi
36 Kalambi37 Manmodi38 Kanadwadi
39 Tanang40 Savali
41 Khanderajuri42 Malgaon
43 Gundewadi44 Chabukswarwadi45 Dongarwadi
46 Salgare47 Belanki48 Kadamwadi
49 Payappachiwadi50 Shipur
51 Erandoli52 Malewadi
53 Janaraowadi54 Vyankuchiwadi55 Santoshwadi
56 Takali57 Bolwad58 Miraj (U)
59 Bamani60 Nilaji
61 Vaddi62 Vijay Nagar
63 Mhaisal64 Dhavali65 Narwad
66 Sangli (U)67 Haripur68 Inam Dhamani
69 Ankali
0 10 205km
Scale
µMiraj Tehsil
Administrative Divisions
Legend
&3 Villages
Circles
Arag
Budhgaon
Kasbe Digraj
Kavalapur
Malgaon
Miraj
Sangli
Circles
Fig.2.1 Administrative Divisions of Miraj Tahsil
Miraj Tahsil
Administrative Divisions
Chapter-II
- 35 -
As per 2001 census, Miraj tahsil encompasses one Municipal
Corporation, two census towns and 64 villages. For the administration
purposes these villages are grouped into seven revenue circles (Fig2.1).
Malgaon is the biggest revenue circle containing 17 villages and Sangli is
the smallest circle taking care of 3 villages along with Sangli city.
The urban governance is operating through Municipal Corporation.
Sangli-Miraj-Kupwad (SMK) Municipal Corporation is the local self-
government body serving 4.36 lakh people. The urban area contains part
of Sangli, Miraj, Kupwad, Wanlesswadi and Sangliwadi. SMK Municipal
Corporation comprises four Prabhag (Prabhag is an urban unit, which is
formed by clubbing many wards) of 69 wards (Fig2.2). Among all,
Bhudhagaon
Madhavnagar
Prabhag-3
Prabhag-4
Prabhag-1
Prabhag-2 Wanleswadi
8
5
1
4
3
9
7
18
26
16
14
6
12
38
69
2
10
22 25
53
11
36
24
39
37
13
61
23
63
27
40
43
21
51
28
4115
52
33
66
42
19
29
32
17 4948
50
20
46
54
62
31
6445
47
44
30
58
3435
55
5956
57
6568
60
74°40'0"E
74°40'0"E
74°37'30"E
74°37'30"E
74°35'0"E
74°35'0"E
74°32'30"E
74°32'30"E
16°55'0"N 16°55'0"N
16°52'30"N 16°52'30"N
16°50'0"N 16°50'0"N
16°47'30"N 16°47'30"N
Miraj TehsilUrban Centres
0 4 82km
µ
Scale
Legend
Budhgaon
Madhavnagar
River
Prabhag
SMK Wards
Fig.2.2 Administrative Set-up of Urban Centres
Source: Based on Ward Map of Sangli-Miraj-Kupwad Municipal Corporation
8
5
1
4
3
9
7
18
26
16
14
6
12
38
69
2
10
2225
53
11
36
24
39
37
13
61
23
63
27
40
43
21
51
28
41
15
52
33
66
42
1917
29
49
32
4850
20
46
54
62
31
64
45
47
44
30
58
3435
55
59
57
65
68
60
67
56
74°40'0"E
74°40'0"E
74°37'30"E
74°37'30"E
74°35'0"E
74°35'0"E
74°32'30"E
74°32'30"E
16°52'30"N 16°52'30"N
16°50'0"N 16°50'0"N
16°47'30"N 16°47'30"N
Sangli-Miraj-Kupwad Municipal Corporation
Municipal Wards
0 4 82km
.
Scale
Legend
River
SMK Wards
Bhudhagaon
Madhavnagar
Prabhag-3
Prabhag-4
Prabhag-1
Prabhag-2 Wanleswadi
8
5
1
4
3
9
7
18
26
16
14
6
12
38
69
2
10
22 25
53
11
36
24
39
37
13
61
23
63
27
40
43
21
51
28
4115
52
33
66
42
19
29
32
17 4948
50
20
46
54
62
31
6445
47
44
30
58
3435
55
5956
57
6568
60
74°40'0"E
74°40'0"E
74°37'30"E
74°37'30"E
74°35'0"E
74°35'0"E
74°32'30"E
74°32'30"E
16°55'0"N 16°55'0"N
16°52'30"N 16°52'30"N
16°50'0"N 16°50'0"N
16°47'30"N 16°47'30"N
Miraj TehsilUrban Centres
0 4 82km
µ
Scale
Legend
Budhgaon
Madhavnagar
River
Prabhag
SMK Wards
Miraj Tahsil
Urban Centres
Chapter-II
- 36 -
Prabhag-3 is the largest in size. There are two census towns located in
Miraj tahsil i.e. Madhavnagar (formed in 1971) having one ward and
Budhgaon (in 2001) contains six wards.
2.4 Physiography
Physiography plays an important role in the land use pattern.
Barring Konkan entire Maharashtra is a plateau and Miraj tahsil as a
whole is a part of the Deccan plateau. On the basis of altitude Miraj
tahsil is categorized into six classes (Fig 2.3).
2.4.1 River Plain Vicinity
This is the first category adjacent to river Krishna and Warana,
within 500 to 550m altitude. This area is occupied about 153 sq km land
on both sides of the Krishna River and north of the Warana River. The
soil of this part is well fertile and irrigation systems developed on the
river boosted the agricultural production in this area.
2.4.2 Plain Land
The area located adjacent to river plain vicinity is quite same as first
category, but having some extra height. This part is of 550 to 600m
Krishna River
Warana River500-550
550-600
600-650
650-700
700-815
820
Legend
River
Table Land
Hill
Foot Hills
High Land
Plain Land
River Plain Vicinity
Miraj TahsilPhysiography
5 0 5 10 152.5
km
Scale
Fig.2.3
Source: Based on contours of Survey of India toposheet
Chapter-II
- 37 -
elevation and expanded in about 475 sq km area. This region is also good
potentiality in agricultural production.
2.4.3 High Land
The area of 600 to 650m height is named as high land and covers
about 225 sq km land. The area of eastern part of Miraj tahsil comes
under this category. This area is considered as starting edge of drought
prone region of Sangli district. Starting from this area towards east and
north-east direction of Sangli districts is known as drought prone area
(Gaikwad, 2003).
2.4.4 Foot Hills
The north-eastern part of Miraj tahsil having 650 to 700m elevation
is expressed as foot hills area. This is about 50 sq km area having
various up-and-downs in the relief. The water scarcity is the main
problem for the agriculture in this area.
2.4.5 Hill
About 22 sq km hilly portion of Miraj tahsil of 700 to 815m altitude
is categorized into Hill category. This part is containing steep slope and
possesses scanty natural vegetation. The only available and officially
recorded natural vegetation patches of Miraj tahsil are located here.
2.4.6 Table Land
The tableland expanded in 1.2 sq km area on 820m height is the
last physiographic division of Miraj tahsil. Giriling temple (Giri means
mountain and ling is name of lord Shiva) is situated in this area. This
area is having spiritual and historical background. Also the agriculture is
practiced in this area.
2.5 Climatic Condition
The climate of the study area is characterized by general dryness
throughout the year except during the south-west monsoon season.
From December to about the middle of February is a cold season and in
hot season, May is the hottest month. The south monsoon season is
Chapter-II
- 38 -
June to September and post monsoon season is October to November
(District Census Handbook, 1991). In general, the Miraj tahsil is having
pleasant climate. In the south-west monsoon months the air is highly
humid. In the post-monsoon, summer and cold seasons the air is dry
particularly in the afternoons (Sangli District Gazetteer, 2006).
Table 2.1 Distribution of Rainfall in Miraj Tahsil ( in mm )
Sr. No. Year June July August September October Total Percentage
1 1971 123.10 48.10 91.40 111.10 116.80 490.50 99.70
2 1981 167.00 79.00 46.00 228.00 12.00 532.00 128.46
3 1991 156.00 158.00 57.00 93.00 113.00 577.00 198.58
4 1995 23.46 76.50 20.60 142.60 221.20 484.36 98.45
5 1996 45.50 124.00 198.10 23.30 172.50 563.40 114.51
6 1997 178.80 81.30 105.30 56.80 136.40 558.60 113.54
7 1998 71.70 125.50 57.40 68.40 216.10 539.10 109.57
8 1999 49.00 46.20 28.80 90.70 165.50 380.20 77.28
9 2000 41.50 65.50 119.60 278.40 61.50 566.50 115.14
10 2001 70.00 57.60 45.90 187.70 110.20 471.40 95.81
11 2002 124.10 23.90 167.50 30.20 130.20 475.90 96.73
12 2003 15.00 32.00 15.60 44.80 145.60 253.00 51.42
13 2004 179.20 51.00 93.40 194.30 48.50 566.40 115.12
14 2005 173.30 162.50 200.90 136.60 61.80 735.10 149.41
15 2006 161.70 165.20 165.70 145.30 21.00 658.90 133.92
16 2007 70.00 110.00 110.00 105.00 96.00 491.00 99.80
17 2008 54.10 32.70 98.60 98.80 70.10 354.30 72.01
18 2009 30.80 181.20 58.00 237.00 112.00 619.00 125.81
Source: Socio-Economic Review and District Statistical Abstract of Sangli district and Agricultural Department, Panchyat Samiti Miraj.
Climatic Condition
0
50
100
150
200
250
Jan Feb M arch April M ay June July Aug Sept Oct Nov Dec
Months
Ra
infa
ll (in
mm
)
0
10
20
30
40
50T
em
pe
ratu
re (
in °
C)
Rainfall-71 Rainfall-81 Rainfall-91 Rainfall-2001 Rainfall-06
Temp.Max-71 Temp.Min-71 Temp.Max-2001 Temp.Min-2001
Fig.2.4
Miraj Tahsil
Climatic Conditions, 1971-2001
Chapter-II
- 39 -
The average annual rainfall in the region is 692.4 mm (27.26"). The
statistical figures of rainfall show the variation such as, in 1971 total
annual rainfall was 490mm and in 1991 it was 577mm. The rainfall
statistics produced by Agriculture Department depicts that, during the
last 15 years from1995 to 2009, for 8 years there was excess rainfall
(above average) and for 7 years it was below average (Table 2.1). In 2006,
Miraj Tahsil had recorded total 702.7mm rainfall in 56 days and average
rainfall of the year was 541.7mm (Socio-Economic Abstract of Sangli
District, 2006-07).
Table 2.2 Temperature recorded in Miraj Tahsil ( in °C )
Year ► 1971 1981 1991 2000
Month ▼ Maximum in °C Minimum in °C Max Min Max Min Max Min
January 32.1 9.8 - - 33.4 15.6 32.2 15.4
February 34.7 12.5 - - 34.4 14.9 31.4 15.7
March 38.9 11.1 - - 37.5 18.4 36.7 18.7
April 39.7 19.3 38.7 20.9 37.5 22.0 39.2 22.5
May 39.7 19.6 38.8 22.7 37.2 22.6 34.8 22.9
June 31.5 20.2 31.5 22.6 31.3 22.6 30.7 22.8
July 31.9 19.6 - - 27.5 21.8 30.2 22.3
August 31.5 19.6 27.4 21.2 27.5 21.3 28.8 21.5
September 34.6 19.6 30.0 21.5 31.2 21.0 31.1 21.2
October 32.5 18.2 32.3 19.9 33.6 19.8 31.7 20.7
November 32.0 17.6 31.4 15.3 30.9 17.8 32.0 17.7
December 31.3 10.2 30.6 14.7 31.8 13.9 31.2 14.1
Source: Socio-Economic Review and District Statistical Abstract of Sangli district.
The mean daily maximum temperature is 37.5°C (99.5°F) and the
mean daily minimum 22.7°C (72.9°F), recorded at meteorological
observatory in Miraj. The temperature of the Miraj tahsil varies from
23°C to 40°C. In 1971 the maximum recorded temperature was 39.7°C in
April and minimum temperature was 9.8°C in January. In 2000, the
maximum temperature was 39.2°C in April and minimum 14.1°C in
December. Winds are light to moderate except in the south-west
monsoon season.
Chapter-II
- 40 -
2.6 Geology
The only geological formation of the study area is the Deccan traps
(Cretaceous-Eocene). This trap belongs to the type called 'plateau basalt'
and it is more or less uniform in composition corresponding to dolerite or
basalt (District Census Handbook, 1991). The minerals are not found in
the study area. The black (Basalt) rock is used in building material, road
metal and railway ballasts. Hence, fair amount of stone quarries’ can be
seen on the eastern part of Miraj tahsil, especially along the Pandharpur
road.
The Deccan traps are unreliable sources of ground-water because
of the irregular distribution of inter-trappean beds. The main aquifers are
either the inter-trepan beds or the decomposed zones in the traps
therefore the depth of the water-table is varying (Sangli District
Gazetteer, (1969), 2006). The level of water-table in western part of tahsil
is quite high because of developed irrigation facility on the River Krishna
and the Warana. Whereas the eastern part of tahsil is very low, the level
of water-table is decreasing very fast as the number of tube wells are
increasing. Till 2008, there were total 1262 tube wells successfully
functioning in the Miraj tahsil. The quality of ground-water was good,
but now days in urban areas, the picture is changing because of high
pollution.
2.7 Soil
Relief influences soil formation, primarily through its effect upon
drainage, runoff and erosion and secondarily through variations in
exposure to the sun, wind and air drainage (Jagtap, 1985). The soils in
the study area are essentially derived from the underlying basalt and
under different climatic conditions show variations in the texture and
structure. It varies from deep black soil in the river valleys to shallow
murum (rock-strewn) in eastern part particularly with black, grey, light
brown in the colour (District Census Handbook, 1991).
Chapter-II
- 41 -
2.7.1 Very Deep Black Soil
The adjacent parts of the river course are occupied by the very
deep black soil, which is derived from the Deccan traps. This soil is
characterized by clayey texture and granular to crumb structure. It is
porous and swells by the addition of water and dries up with cracks on
losing moisture. This soil is very fertile in nature and having capacity to
produce high yield.
2.7.2 Deep Black Soil
The deep black soil found in the Krishna and Warana River valley.
It is fertile and does not require manure for long periods. The major part
of the Miraj tahsil is covered by rich soil. This soil is blackish brown in
colour and has clayey texture and granular to blocky structure. Most of
the area of Sangli and Kasabe Digraj Circle, and some north-eastern part
of Budhgaon Circle, eastern part of Miraj and Kavalapur Circle are
occupied by deep black soil.
2.7.3 Medium Deep soil
The medium deep soil encompasses same characteristics like deep
black soil. Its tone is light reddish brown to grey and the layer is quite
74°50'0"E
74°50'0"E
74°40'0"E
74°40'0"E
74°30'0"E
74°30'0"E
17°0'0"N 17°0'0"N
16°50'0"N 16°50'0"N
Miraj TahsilDistribution of SoilË
5 0 5 10 152.5
km
Scale
LegendSoil
Deep Black
Very Deep Black
Medium Deep
Shallow
River
Tehsil Boundary
Saline
Very Shallow
Fig.2.5
Source: District Soil Survey Department and Soil Map of Regional Planning Report
Chapter-II
- 42 -
shallow as compare with deep soil. The villages namely Kupwad, Vaddi,
Dhavali, Mhaisal, Takali, Malgaon, Bhose, Soni, Karoli, Arag, Shindewadi
etc. are having patches of this soil.
2.7.4 Shallow Soil
A shallow soil is light brown to reddish brown in colour and loamy
sands to sandy clay in texture. The shallow soil is normally known as
structure-less soil. This soil is found in various patches in the part of
Kupwad, Mhaisal, Narwad, Vijaynagar, Bedag, Erandoli and Lingnur.
Some small patches of the shallow soil are found in Salagar,
Santoshwadi, Shipur, Khanderajuri, etc.
2.7.5 Very Shallow Soil
Very shallow soil is found in the mid and eastern part of Miraj
tahsil. Mostly it is found in open-barren land and considered as low
productive. This area can be brought under cultivation using advance
technology and water from Mahisal canal.
The over irrigation and wrong cropping practices have created the
problem of salinization. Villages such as Samdoli, Kavathe Piran,
Dudhgaon, Kasabe & Mouje Digraj, etc. are containing pieces of saline
soil. Due to this problem a considerable amount of well fertile land
becomes saline waste.
2.8 Natural Vegetation
Miraj tahsil occupy very small portion of natural vegetation in the
form of bushy and stunted tree growth on the hills in the north-eastern
part. This part is mostly barren having scattered stunted and bushy tree
species such as Acacia aburnea (Murmati), Acacia arabica (Babul),
Ziziphus jujuba (Bor). However, this area contains few matured scattered
trees of Azadirachta indica (Neem), Eugenia jambulana (Jambhul),
Tamarindus indica (Chinch), Pongamia glabra (Karanj) (Sangli District
Gazetteer, 1969).
Chapter-II
- 43 -
Fig.2.6 Source: Based on Survey of India Toposheet (47/L9/NE and 47/L13/NW)
The natural vegetation of Miraj tahsil is grouped into 3 general
categories viz. Fairly dense scrub, Open Mixed Jungle and Open Scrub
(Fig 2.6). The name identification of natural vegetation is recognized by
the village where forest is located e.g. Salgare Reserved Forest,
Dongarwadi Projected Forest, Khanderajuri Projected Forest, Bhose
Social Forestry and Bhose Reserved Forest. The name of forest indicates
that available vegetation comes under reserved forest and some of them
are projected forest. Some of the areas in eastern parts of Miraj tahsil are
Miraj Tahsil
Natural Vegetation
Chapter-II
- 44 -
rocky and murmad (rock-strewn-rough) therefore, only inferior type of
grass is grown in this area. In some localities scattered grown trees are
found especially on the bank of streams, along the roads and uplands. In
Miraj tahsil total 1079 hectare land is covered by Natural Vegetation,
which becomes only 1.16% to total geographic area. Only 1% area is
under forest therefore, administrators must look into the matter and take
some serious measures to increase the forest land.
2.9 Drainage System
Generally the drainage basin is known as an area that is drained
by a river and its tributaries. Krishna is the main river of Miraj tahsil and
Warana is the largest tributary of the Krishna in the Sangli district. The
Krishna is one of the largest sacred rivers of southern India.
Approximately 105km of the river course falls inside the Sangli district
out of that 65km is in Miraj tahsil. The Krishna River is flowing from
north-west to south-east direction and the Warana River is from east to
west. The drainage system of Miraj tahsil is mainly controlled by geology
and physiography of the region.
Krishna River
Warana River
Miraj TahsilDrainage System
Legend
Water Tanks
Stream Orders
Stream Order-4
Stream Order-1
Stream Order-2
Stream Order-3
Stream Order-5
Stream Order-65 0 5 10 152.5
km
Scale
·
Fig.2.7
Source: Based on Survey of India Toposheet ( Toposheet No: 47L/5NE, 47L/9NE, NW, SE, SW, 47L/10NE, 47L/13NE, NW, SE, SW, 47L/14NW )
Chapter-II
- 45 -
The drainage network is the network of the main river and its
tributaries. The drainage system of Miraj tahsil contains five micro
watersheds and streams up to order six (Fig.2.7). The entire tahsil is
considered as one basin and calculations are made to understand the
morphometric characteristics. The morphometery is the quantitative
description of the basin and its network.
Stream ordering describes the
position of a stream in the drainage
network and it is calculated by applying the
Horton’s law of drainage network
development. There are total 1516 streams
in which order one streams are 1260 and
its total length is 774km. The last stream is
of order six and its total length is 4km. The summery of morphometric
analysis of the study region is represented in Table 2.3a and 2.3b. The
above Table is the output of various calculations based on the standard
Table 2.3a Morphometric Analysis of Study area
Sr No Morphometric Parameter Unit Value
1 Order - 6
2 Bifurcation Ratio - 4.20
3 Basin Area km2 926.10
4 Absolute (Highest) Relief Meter 835
5 Lowest Relief Meter 535
6 Relative Relief (H - L) Meter 300
7 Length of the Basin Km 59.86
8 Width of the Basin Km 31.42
9 Elongation Ratio - 0.57
10 Stream Frequency Stream / km2 1.80
11 Drainage Density Km / km2 1.64
Source: Calculations are made based on the characteristics
Topo No : 47L/5NE, 47L/9NE, NW, SE, SW, 47L/10NE, 47L/13NE, NW, SE, SW, 47L/14NW
Table 2.3 b Stream Ordering
Stream Order
No of Streams
Total Length
1 1260 774
2 311 342
3 70 201
4 21 124
5 5 71
6 1 4
Length in Km
Chapter-II
- 46 -
methods hence, here only output is depicted. From the morphometric
calculation it depicts that it is sixth order basin with a bifurcation ratio
4.20, so it can be interpreted as one stream bifurcates into four small or
tributary streams. This figure falls between 3 and 5 hence, it is expected
that the effect of geology on the area is very low. The relative relief of the
area is moderately low of 300m but its highest relief is 835m and lowest
of 535m. The elongation ratio of the study area is 0.57, which is not near
to one, so it is not in a circle shape.
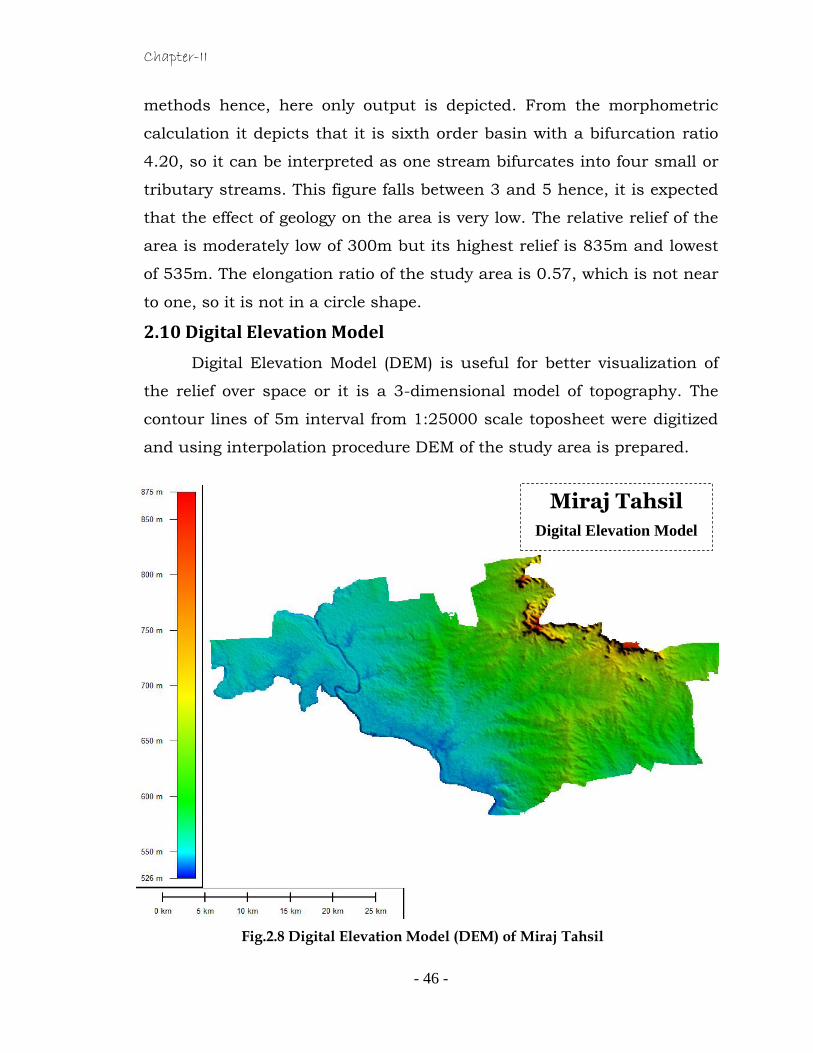
2.10 Digital Elevation Model
Digital Elevation Model (DEM) is useful for better visualization of
the relief over space or it is a 3-dimensional model of topography. The
contour lines of 5m interval from 1:25000 scale toposheet were digitized
and using interpolation procedure DEM of the study area is prepared.
Fig.2.8 Digital Elevation Model (DEM) of Miraj Tahsil
Miraj Tahsil
Digital Elevation Model
Chapter-II
- 47 -
Table 2.4 Statistics of Roads in Miraj Tahsil, 2006.
Road Category Total Length (in
km) Metal Stony Murum
Major State Highway 29.1 29.1
State Highway 101.12 85.12 16
Major District Road 207.56 166.8 27.4 13.36
Other District Road 329.68 71.41 90.57 167.7
Tahsil Roads (Rural) 504.24 87.06 109.5 307.68
Total Length in km 1171.7 439.49 227.47 504.74
Source: Public Welfare Department, Zilla Parishad Sangli, 2006.
Socio-Economic Set-up
There are various indicators to check the socio-economic condition
of an area. In this study some of the important indicators are studied.
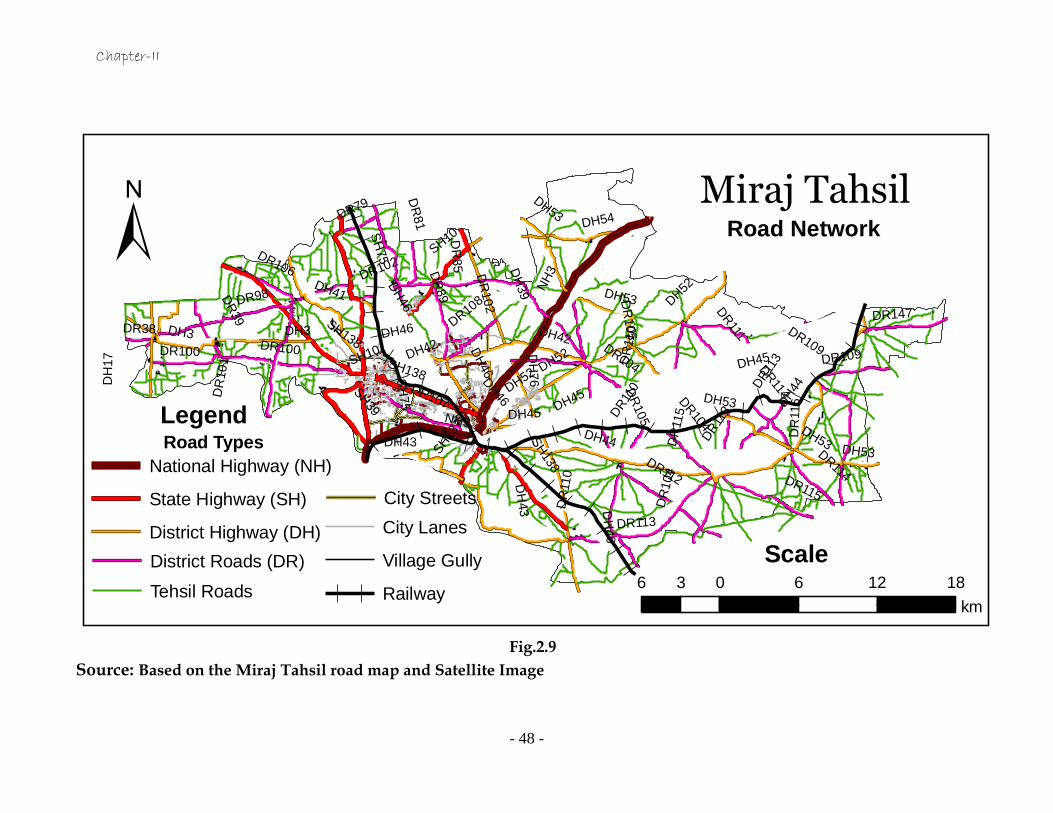
2.11 Road Network
The development of any country or region depends on the road
network of that area. Similarly, the road network of Miraj tahsil has
supported to the overall development.
Miraj tahsil is having quite good road network if compared with
other tahsils of Sangli district (Fig 2.9). Miraj tahsil comprises about 13
per cent of land under urban use therefore the total length of road is also
quite more. The road condition within urban area is good, but in
peripheral areas it is not up to the mark.
Miraj is an important railway junction in western Maharashtra.
This junction is connected by broad gauge (towards Pune), metre gauge
(towards Belgaon) and narrow gauge (towards Latur). At present all
routes are changed to broad gauge and providing the service. The
officials of SMK Municipal Corporation have to plan and construct a
number of wide roads in the city, to reduce traffic density on the crowded
streets of Sangli and Miraj.
Chapter-II
- 48 -
DH44D
H40
NH
3
DH45
SH10
DH3
SH
75
DR98
DH42
DH53
DH41
DH
43
DH52
DH
39
DR109
DR112
DH
17
DR113
DR104
SH
138
DR115
DR
81
DR100
DR
105D
R11
0
DR147
DR114
DH54
DR
116
SH39
DR
102
DR
10
1
DH46
DR106
DR
111
DR107
DR108
DH
76
DR
39
DR
85
SH
137
DR79
DR
89
DR38
DH53
DR
110
DR
10
5
DH53
DR100
DH52
NH3
DR114
DH46
DH45
SH
75
SH10
DH53
DR
110
DR109
DR102
DH
44
DR
104
SH138
DH45
DH
46
DH3
DH42
SH138
DH53
DR
113
DH43
DH52
DR
115
DR
113
DR104
DH
46
± Miraj TahsilRoad Network
LegendRoad Types
Scale
National Highway (NH)
State Highway (SH)
District Highway (DH)
District Roads (DR)
Tehsil Roads
City Lanes
Village Gully
Railway
City Streets
6 0 6 12 183
km
Fig.2.9
Source: Based on the Miraj Tahsil road map and Satellite Image
Chapter-II
- 49 -
Table 2.5 Growth of Population in Miraj Tahsil
Period Population
Actual Decadal Variation
Decadal Variation
in %
Annual Variation
in %
Rural
1971 207207 - - -
1981 237332 30125 14.54 1.45
1991 270888 33556 14.14 1.41
2001 293546 22658 8.36 0.84
Urban
1971 201597 - - -
1981 268988 67391 33.43 3.34
1991 363751 94763 35.23 3.52
2001 462502 98751 27.15 2.71
Total
1971 408804 - - -
1981 506320 97516 23.85 2.39
1991 634639 128319 25.34 2.53
2001 756048 121409 19.13 1.91
Source: District Census Handbook of Sangli, 1971 - 2001
2.12 Demographic Dimensions
Dynamics of population is one of the prime aspects of geographical
studies. The demographic attributes such as population growth,
population density and its distribution, sex composition, etc. are used to
understand the condition of the region.
2.12.1 Growth of Population
Population growth is the most fundamental demographic processes
with which change in population during specific time is understood.
Table 2.5 elaborates the population growth and its decadal and annual
variation for the period of 1971 to 2001.
In 1971,
the population
of Miraj tahsil
was 4,08,804
persons, by
1981 it was
5,06,320 with
growth rate
23.85 per cent.
In period of 10
years total
97,516 persons
were added in
which 30,125 persons from rural area and 67391 from urban.
During 1991 population size of the tahsil was 6,34,639 persons, it
rose to 7,56,048 in 2001 and the decadal growth rate was 25.34 per
cent. The rural area is having average 1.2 per cent annual growth rate
whereas in urban area it is 3.2 per cent, which is about three times
more.
Chapter-II
- 50 -
Fig.2.10b Distribution of Rural & Urban Population
Fig.2.10a Population Growth of Miraj Tahsil
In rural areas the
highest growth rate was
recorded during 1971 to
1981 that was 14.54 after
that per decade it starts
decreasing to 14.14 and
8.36 respectively. Same
trend of declining growth
rate of population is noticed
in urban area as well as for
entire Miraj tahsil.
In 1971, population
of rural area was more than
urban but after 1981
population of urban area
starts increasing very fast
and gap between them
become wider and wider.
The population of urban
area is rapidly rising
because of development in industrial sector, increasing job opportunities,
educational centres, commercial activities, etc. in urban areas.
2.12.2 Spatial Distribution of Population
The spatial distribution of population refers to the way people are
spread over the region. The population distribution of Miraj tahsil is
uneven (Fig 2.11), the central part of the tahsil is highly populated than
the peripheral areas. The western part of the tahsil is river side, highly
fertile, and well accessible, so the concentration of population is high. On
the eastern side of tahsil the condition is an opposite. In general the
concentration of population is high in the central part of the tahsil and
Chapter-II
- 51 -
thins out to the peripheries from core. This is a common phenomenon
noticed with all urban centres.
2.12.3 Population Density
The population density is a simple concept of relating population
size to the land area with view to assess crudely the pressure of
population upon the resources of the area (Kurne, 2008). Separate
mapping of 1971 and 2001 dataset has been carried out to understand
Fig.2.11
1 Dot Represents 600 Persons
Miraj Tahsil
Distribution of Population
2001
Chapter-II
- 52 -
the spatio-temporal changes in the density of population (Fig. 2.12). The
population density is grouped into five categories by applying random
class interval method.
2.12.3.1 Areas of Very High Population Density (> 2551 person per sq km)
In 1971 there was only one village, which was in the category of
very high density of population i.e. Madhavnagar. Therefore, in 1971
census it is declared as census town. In 2001, Sangli and Miraj are
1971 & 2001
Fig.2.12 Population Density, 1971 and 2001
1971
2001
Miraj Tahsil
Population Density (1971)
Chapter-II
- 53 -
added in this class and at present only three localities are having
population density more than 2551 persons per sq km.
2.12.3.2 Areas of High Population Density (1051 to 2550 person / sq km)
Sangli was only one area with high population density in 1971. In
2001, four villages are added in this group namely Kupwad, Budhgaon,
Haripur and Bamnoli. Out of these, Kupwad is a part of Municipal
Corporation and Budhgaon was declared as census town in the same
year. Rest Haripur and Bamnoli are the villages but located on the
periphery of urban area, therefore, the density of this area was high
(1051 to 2550 km2).
2.12.3.3 Areas of Medium Population Density (701 to 1050 person / sq km)
In 1971, there were three localities, in the category of medium
population density with 701 to 1050 persons per sq km namely Miraj,
Haripur and Budhgaon. Although Miraj was having Nagarpalika and long
historical background, it was coming under medium population density.
In 2001, villages Inam Dhamni, Ankali, Takali and Padmale are in this
category. These villages are on the periphery of Sangli and Miraj,
therefore, leap frog urban development can be noticed in these localities
hence, population density has increased.
2.12.3.4 Areas of Low Population Density (351 to 700 person / sq km)
In 1971, there were 10 villages in this category of low population
density with 351 to 700 persons per sq km. In 2001, same group
contains 23 villages. The villages in the western side of tahsil are in this
class except village Sheri Kavathe.
2.12.3.5 Areas of Very Low Population (< 350 person / sq km)
This is the last category containing less than 350 persons per sq
km, but it is having highest number of villages. In 1971, there were 38
villages and in 2001 it becomes 32 villages. The eastern side of the
villages is laying in this class because of low population and total village
area is also quite big.
Chapter-II
- 54 -
2.13 Sex Composition
Sex ratio is one of the important social indicators to assess the
balance of male female population in the society.
Table 2.6 Sex Composition of Miraj Tahsil
Year Category Male Female Total Sex Ratio (per 1000
Male)
1971
Rural 108143 (50.36)
99064 (51.04)
207207 (50.69)
916
Urban 106587 (49.64)
95010 (48.96)
201597 (49.31)
891
Total 214730 194074 408804 904
1981
Rural 123005 (46.68)
114327 (47.08)
237332 (46.87)
929
Urban 140496 (53.32)
128492 (52.92)
268988 (53.13)
915
Total 263501 242819 506320 922
1991
Rural 140482 (42.71)
130406 (42.66)
270888 (42.68)
928
Urban 188468 (57.29)
175283 (57.34)
363751 (57.32)
930
Total 328950 305689 634639 929
2001
Rural 151386 (38.90)
142160 (38.75)
293546 (38.83)
939
Urban 237763 (61.10)
224739 (61.25)
462502 (61.17)
945
Total 389149 366899 756048 943
Source: District Census Handbook of Sangli, 1971 - 2001
The sex composition details are useful in the several planning
activities, analysis of other demographic characters and economic aspect.
The female sex ratio of Miraj tahsil is continuously increasing. In 1971,
the sex ratio was 904 females per 1000 males, 916 in rural and 891 in
urban area (Table2.6). During 1981 sex ratio was 922, which augmented
to 929 in 1991 and in 2001 it increased by 14 points to 943 and in rural
and urban areas the figures were 939 and 945 respectively. The
percentage of females in 1971 was 47 and male was 53, whereas in 2001
the female percentage has increased to 49 and male 51(Fig2.14).
Fig.2.13 Sex Composition
Chapter-II
- 55 -
2.14 Conclusion
Miraj tahsil is situated in south-western part of state on the border
of Maharashtra and Karnataka. This tahsil has influencing on adjacent
areas because it is having various factors like railway junction, hospitals
and medical facilities, famous market yard, district administrative
headquarter, etc. Miraj tahsil is having dynamic nature by its physical
and human resources. It possess diversity like dry as well as well
irrigated agricultural land, it is having major rivers as well as drought
prone area, there is mixture of soil pattern, etc. Also Miraj is the most
urbanized tahsil in Sangli district. Considering its growth and expansion
it is essential to make proper planning for utilization of physical and
human resources.
The relative relief of the study area is 300m and except north-
eastern uplifted parts rest tahsil is having average height within 500 to
650 metre. River Krishna and Warana have played major role in the
Fig.2.14 Male-Female Population Distribution
Chapter-II
- 56 -
transformations occurred in the tahsil. The soil of this area varies from
deep black (near river vicinity) to shallow rocky (towards eastern part)
and its tone is varying from dark black to light brown. The increasing
proportion of salt affected soil is major problem in the western part of
tahsil. Only one per cent land is under forest and is decreasing day by
day, which is another serious problem. As per morphometric analysis the
elongation ratio of Miraj tahsil is 0.57 and this area is not having sharper
flood hydrology. In other words the rainfall water will not reach the basin
at same time.
The concentration of population is high in the central part of the
tahsil, which is an urban area. Sangli, Miraj and Madhavnagar are
having population density more than 2551 persons per sq km. The leap
frog urban development is found in the villages around urban area e.g.
towards Haripur, Bamnoli, Subhash Nagar, Sangliwadi outskirts, etc.
The percentage of female population is 49%, which is near about equal to
male. The female literacy is increasing remarkably in both urban and
rural areas and its credit goes to government policies as well as parents.
2.15 Suggestions
During the study of physical and socio-economic set-up of Miraj
tahsil few suggestions are come-up those are listed below.
The roads are considered as vein in the development process of an
area. The roads condition in rural areas particularly in eastern
part of tahsil is so worst hence duly attention has to be paid on it.
The road width has to be increase in the gaothan areas to avoid
traffic problems and accidents.
The climatic data is very much important for planning and there is
variation in the recorded data. Therefore, the count of climatic
observation centres in the tahsil needs to be increase and also
maintain proper records.
Chapter-II
- 57 -
The unused tube wells have to be use for rainwater harvesting to
increase the level of ground water applying rain water harvesting
programs. This will be helpful for flora and fauna in the Miraj
tahsil.
References:
Andrew, Mason (1997): Will Populat1ion Change Sustain the ‘Asian Economic
Miracle’? East-West Center, Asia Pacific Issue No. 33 Oct-1997.
Bureau of Economics and Statistics, Govt. of Maharashtra (1971-72, 1981-82,
1991-92, 2001-02, 2006-07): Socio-economic Reviews and District
Statistical Abstracts of Sangli District.
Census of India (1971, 1981, 1991, 2001): District Census Handbook Sangli,
Census of India, Maharashtra.
Chandna, R.C. and Sidhu, Manjit S. (1980): Introduction to population geography,
Kalyani publishers, New Delhi, pp.76
Chaugule, J.B. (1988): Eco-Morphological Analysis of Warana River Basin –
Study in Regional Development, Unpublished Ph. D. Thesis, Shivaji
University, Kolhapur.
Gaikwad, S.B. (2003): Drought Prone Area of Sangli District: A Geographical
Study, Ph. D. Thesis submitted to Shivaji University, Kolhapur.
Gaikwad, Shrikrishna B. (1993): Post independence Growth of sugar Industry in
Maharashtra: A Geographical Appraisal, Ph. D. Thesis submitted to Shivaji
University, Kolhapur.
Jadhav, M.G. (1980): Sugarcane Cultivation in Upper Krishna Basin:
Geographical Analysis, Unpublished Ph. D. Thesis submitted to Shivaji
University Kolhapur.
Jagtap, J.P. (1985): Distribution of Soil Patterns in Sangli District, M. Phil Thesis
submitted to Shivaji University, Kolhapur. pp. 9-25.
Kulkarni, K.G. (1983): Sangli District: A Study in Rural Settlement, Ph. D. Thesis
submitted to Shivaji University, Kolhapur.
Kurni, M.S. (2008): Urban Growth and its Impact on Environment in Belgaum
City, Ph. D. Thesis submitted to, Karnataka University Dharwad.
Chapter-II
- 58 -
Nagaraj, H. (1997): Changing Pattern of Agricultural Development in Chitradurga
District – A Spatio-Temporal Analysis, Ph. D., Thesis submitted to
Bangalore University Bangalore.
Patil, P.V. (2002): Geographical Analysis of Agricultural Technology in Sangli
District, Ph D. Thesis submitted to Shivaji University, Kolhapur.
Pawer, C.T. (1981): Irrigation and its impact on agricultural landuse in upper
Krishna basin (Maharashtra), Ph. D. thesis, Shivaji University, Kolhapur pp
4-6.
Ramotra, K.C. (2004): Spatial Patterns of Urbanization in Maharashtra, Trajectory
(A Journal of Research Articles), Rayat Shikshan Sanstha, Vol. 1, pp. 32-
40.
Other References:
Satellite Image of Sangli (2007): Satellite Image of Sangli from Digital Globe.
Survey of India Toposheet (1940): 47/L9 (1:63360 Scale)
Survey of India Toposheet (1995): 47/L9/NW, 47/L9/SW, 47/L9/SE (1:25,000
Scale)
Survey of India Toposheet (1995): 47/L9 (1:50,000 Scale)
Urban Planning Reports (1971): Regional Planning Report of Sangli-Miraj Urban
area.
Web References:
Google Earth (Version-5.1.3533.1731) 2009:
http://www.kh.google.com
KOSMO: Open Source GIS Software (2009):
www.opengis.es
National Family Health Survey (NFHS-3) (2010):
http://www.nfhsindia.org//
Office of the Registrar General, India (2001):
http://www.censusindia.net/ and
http://censusindia.gov.in/Census_Data_2001/Census_data_finder/H_Series/
Household_Size.htm
Physiography (2010):
http://sangli.nic.in/htmldocs/district_at_a_glance.htm
Chapter-II
- 59 -
Sangli District Gazetteer (2006):
HTTP://WWW.MAHARASHTRA.GOV.IN/ENGLISH/GAZETTEER/S
ANGLI/
Wikipedia (2010):
http://en.wikipedia.org/wiki/Sangli


![[2] THE ONCOPATHOLOGY CENTRE, MIRAJ](https://static.documents.pub/doc/80x56/55cf8f0b550346703b985c11/2-the-oncopathology-centre-miraj.jpg)