Geohistory analysis of Bombay High region Madan Mohan Keshava Deva Malaviya Institute of Petroleum Exploration, Oil and Natural Gas Commission, Dehra Dun 2481 95, India Received 15 June 1985
Geohistory diagrams have been constructed for three representative sites in the Bombay High region, Offshore West-Coast India. The model curve for 60% lithospheric injection matches the initial part of a thermo-tectonic curve for one of the sites, where a complete Tertiary sequence is developed. The study suggests that the four Paleogene unconformities, recognised in this region, were caused by eustatic falls. A distinct phase of active subsidence occurred during the late Midd le- Late Miocene, probably due to more active spreading at the Mid-Indian Ocean Ridge.
The Bombay Offshore Basin is located on a divergent margin at the Western Continental Shelf of India, which is believed to be the largest continental terrace in the world (Figure 1). This basin came into existence during the Late Cretaceous, about 70 Ma ago, when a new spreading centre developed between Madagascar and India-Seyschelles (Parker and Gealey, 1983). Tectonically the basin is divided into the Surat depression, Bombay platform, Ratnagiri block faulted zone, a Shelf margin basin, and the Shelf-edge basement arch (Figure 2). The stratigraphic fill of the basin, covering an area of 120 000 km ~, consists only of Tertiary sediments which in places are more than 5 km thick (Shukla, 1983).
The Bombay High is a giant oil field, with nearly half of India's total oil reserves, situated in the Bombay platform area of the Bombay Offshore Basin. The field is 160 km off Bombay in the Arabian Sea in a water depth of 75 m. Three deep wells (Figure 3) have been selected for the geohistory analysis of Bombay High region, one at Bombay High proper (A), a second at the flank of the Bombay High (B) and the third in the deeper continental shelf area (C). Two of these wells bottomed in basement, one in granitic basement of possibly pre-Cambrian age, the other in Late Cretaceous/Early Paleocene basaltic basement, The third well terminates in Early Eocene sediments, but Late Paleocene strata overlying a basaltic basement are likely to be present below the drilled depth.
Paleocene sand and siltstones which contain fresh unaltered detrital feldspar, zeolite and montmor- illonite suggesting a volcanic provenance, perhaps the Deccan Trap (Whitemarsh et al., 1974). According to Mohan et al. (1982) the Bombay High area has been a paleohigh, possibly since Pre- Cambrian times, where Mesozoic marine sediments are not expected. The basaltic basement therefore, can be taken as fundamental basement for the purposes of reconstructing the subsidence history of this region.
In the Bombay High region, granitic basement of possible pre-Cambrian age has been encountered in one of the wells. The other wells have basaltic basement of Late Cretaceous-Early Paleocene age. Basalt thickness is small over the Bombay High proper, but is expected to increase towards its flanks.
The oldest sediments above basement in this region are Late Paleocene, encountered in a well adjoining Well C in the deeper continental shelf area. In this well, an unconformity has been found between the Upper Paleocene (=P4) and basal Lower Eocene (=P 6 b), the uppermost Paleocene (-- P5) being absent (Mohan et al., 1980; Mohan and Kumar, 1982). This unconformity has been identified on seismic profiles and was used to estimate the thickness of the Upper Paleocene and Lower Eocene sediments at the site of Well C.
The first marine strata over the basaltic basement were laid down in the deeper continental shelf area during the early part of the Late Paleocene when the Bombay High and its flank were emergent as an Island. Marine conditions advanced during the Middle Eocene, when the flank areas (Wells A and B) of the Bombay High were submerged. It was not until the Early Oligocene that crestal parts of the Bombay High were covered by the sea for the first time.
The chronostratigraphy and the paleobathymetric profiles for the three selected wells have been worked out by Mohan et al. (1980, 1982) and Mohan and Kumar (1982) and are reproduced in Figures 4-6. The paleobathymetric estimates shown in these Figures have been found by taking the mean of the paleobathymetric ranges established at several points of faunal study, as has been suggested by van Hinte (1978).
Marine and Petroleum Geology, 1985, Vol 2, November
Geohistory of Bombay High region: M. Mohan
I o~ • • 4000
Figure 1 Map showing physiographic outl ine of India and surrounding Indian Ocean with Deep Sea Drilling Project drill sites (*) and magnetic anomalies after Parker and Gealey (1983). Patterned areas show ocean f loor as: Kqz-Cretaceous Quite Zone, Tp - Paleocene, Te - Eocene, To - Oligocene, Tm-p-Miocene- Pliocene. Arrow points to Bombay High Region as given in Figure 2
SAURASHTRA PENINSULA
SAURASHTRA ]' \\ ARCH ] ~, \| ~
' I ~ i
SHELF EDGE BASEMENT ARCH
BOMBAY PLATFORM
ARABIAN SEA
\ ,
,,,,,: k\ \
R A T N A'~-~" BLOCK
I I 0 0 Km
, = L • I
' ~ Lows ~ ~ Zone of Steep ""~'~-"--=~ Dip 8 Foults
Highs ,< "< ~ -r- Fou l l s
Figure 2 Structural elements of Bombay Offshore Basin (after Shukla, 1983). Area of Figure 3 outl ined
Figure 3 Location of three selected wells A,B and C, in Bombay High Region. For regional setting see Figure 2
MSL WATERI . . . . . . I
. 5 0 0 m
- I O 0 0 m
"' ' ! -.1" _-'-._-
, , , i
I "I"- ~- ~ - 1 5 0 0 m
0 I < i , t
I I
laJ |
=~ I - - - ' - - - -= . ~ ' | " ' ,
_--_~_-r_
BASEMENT..v v v 2OOOm
PALEOBATH 0 I00 m
( N22 L
N21 T
/
IN9 T
I N S T
I N 7 T
I N 6 T
4 N 6 M
IN5 E
c N 3 T 4, PARACON • N 19 ~PARACON 4 N 12 "~-NONCON
Figure 4 Stratigraphy and paleography of well A. N22, P12 etc. planktonic foraminiferal zones after Blow ( 1969, 1979); L = Late, T = Top, M = Middle, E = Early, Paracon = Paraconformity and Noncon = Nonconformity
The geology of the Bombay Offshore Basin and Bombay High region have been dealt with in detail by Sahay (1978), Rao and Talukdar (1980) and Basu et al. (1980).
U n c o n f o r m i t i e s
Mohan and Kumar (1982) worked out the time span involved in the different unconformities. The timing of events that caused the reversal of baselevel trends were
M a r i n e a n d P e t r o l e u m G e o l o g y , 1 9 8 5 , V o l 2 , N o v e m b e r 3 5 1
Geohistory of Bombay High region: M. Mohan
P A L E O B A T H
0 lOOm
P
N24 T 2'2 MO NI9 T
8"5 MO
I0 MO
N g T N 8 T
4 N 7 T
I N 6 T
q N 6 M
q N 5 E
4 N 3 T @PARACON 4 P 1 9 E @PARACON 4 PI3 ONONCON
I
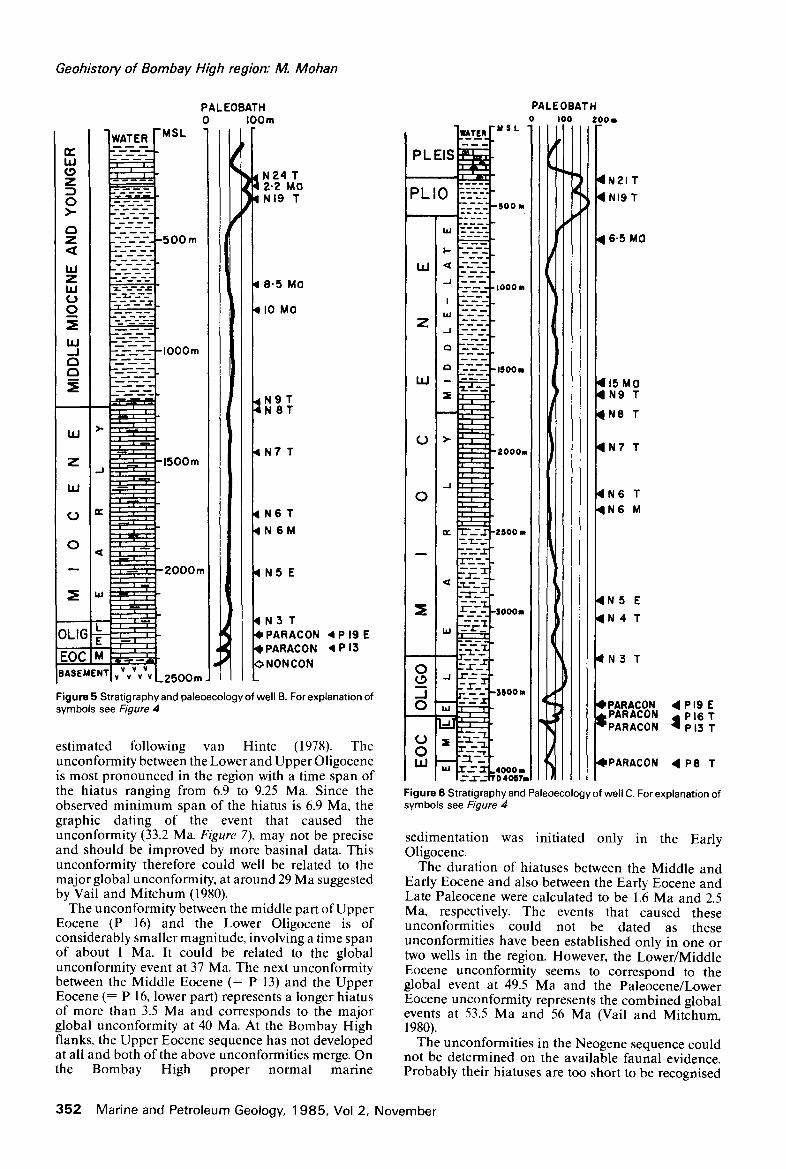
F i g u r e 5 Strat igraphy and paleoecology of well B. For explanation of symbols see Figure 4
estimated following van Hinte (1978). The unconformity between the Lower and Upper Oligocene is most pronounced in the region with a time span of the hiatus ranging from 6.9 to 9.25 Ma. Since the observed minimum span of the hiatus is 6.9 Ma, the graphic dating of the event that caused the unconformity (33.2 Ma, Figure 7), may not be precise and should be improved by more basinal data. This unconformity therefore could well be related to the major global unconformity, at around 29 Ma suggested by Vail and Mitchum (1980)•
The unconformity between the middle part of Upper Eocene (P 16) and the Lower Oligocene is of considerably smaller magnitude, involving a time span of about 1 Ma. It could be related to the global unconformity event at 37 Ma. The next unconformity between the Middle Eocene (= P 13) and the Upper Eocene (= P 16, lower part) represents a longer hiatus of more than 3.5 Ma and corresponds to the major global unconformity at 40 Ma. At the Bombay High flanks, the Upper Eocene sequence has not developed at all and both of the above unconformities merge. On the Bombay High proper normal marine
"MSL " WAT[R
P L -IS
P L I O =-=--:- " ----Z_'I- SO 0 m
teJ 7.-_--_%
I-- "...------_"
LLI < - " - ' - - -
-_--_--_-I- 1000 m
I l l . . . .
Z ------. -
: a %.----"-"
a : - - - - ) - , ~ o o m
I ~ , , i -
, I ! t n
, ' .
C) i>- ----,--~ , ' ,,'-ZOOOm
i i i
I ' i l
: - - I I r " I
0 ' ' ! • i •
l I ' . ' - i
oc "r_"._-.l"l-2500 m :-._-
"r "1- - j - _
=e! ,., - E 3 1 -
• u
.--._- --
0 ------- ~ . J 1"._----
.--I ,,~ - - - ~_'¢'-~---:x. ~'J'lljO0 m
t e l , . L . 1
I - -
~ ~ -~-.-~,
LIJ ~J r...-.1"1.4ooo m . r :ITD 40§7m ~- _
PALEOBATH o IOO zoom
NZlT
4 NI9 T
• 6•5 MO
• 15 MO • N9 T
EIN8 T
q N 7 T
4 N 6 T 4 N 6 M
4 N 5 E
4 N 4 T
q N 3 T
I PARACON • P 19 E PARACON P 16 T PARACON ~ PI3 T
PARACON • P8 T
Figure 6 Strat igraphy and Paleoecology of well C. For explanation of symbols see Figure 4
sedimentation was initiated only in the Early Oligocene.
The duration of hiatuses between the Middle and Early Eocene and also between the Early Eocene and Late Paleocene were calculated to be 1.6 Ma and 2.5 Ma, respectively. The events that caused these unconformities could not be dated as these unconformities have been established only in one or two wells in the region. However, the Lower/Middle Eocene unconformity seems to correspond to the global event at 49.5 Ma and the Paleocene/Lower Eocene unconformity represents the combined global events at 53.5 Ma and 56 Ma (Vail and Mitchum, 1980).
The unconformities in the Neogene sequence could not be determined on the available faunal evidence. Probably their hiatuses are too short to be recognised
352 Marine and Petroleum Geology, 1985, Vol 2, November
Geohistory of Bombay High region: M. Mohan
Base Level Reversal
W
Z uJ
W I -
0 . j
-J.
o
Ma C
25 _ uR98mlMa
NON- DEPOSITIONAL
, o
E R O S I O N A L "~ _._ -------------
,,, uR57.5m/Mo
I M SL
2Kin
4Km
B A uR57m/Mo ~ u R 4 O m / M a
33-2M0
uR55m/MO
~DOM.CARBONATES~ ,,=OGENE
~"~DOM.SHALES -- PALEOGENE
Figure 7 Graphic extrapolation estimate of time of reversal in Base-level Movement (van Hinte, 1978) that caused Early/Late Oligocene unconformity in Bombay Offshore Region. Time thus, derived (line a, 33.2 Ma) appears to be inaccurate as more hiatuses are required from basinward decreasing magnitude. This unconformity could well be related to eustatic fall at 29 Ma (Vail and Mitchum, 1980)
on the basis of nepionic acceleration in the Miogypsinidae, in the Early and Middle Miocene. The Spiroelypeus ranjanae extinction datum in the region corresponds to the lower N5 (21.5 Ma) correlating with a shallowing in the Bombay Offshore Basin which must be expressed as a local unconformity in its marginal parts.
A minor unconformity is observed in the lower Middle Miocene in the marginal parts of the region. At this time, carbonate sedimentation was succeeded by clastics but on the Bombay High proper, however, this unconformity is not observed.
Compaction
A considerable amount of work has been done on the compaction of shales and a distinct relationship between shale porosity and burial depth has been established, but the compaction in carbonates and sandstones has not been worked out in detail. For sandstone compaction, a relationship between porosity and depth of burial has been proposed by Horowitz (Hardenbol et al. , 1981) and estimates for the compaction in carbonates still remain very broad. Hardenbol et al. (1981) have assumed that reef carbonates undergo compaction comparable to the porosity reduction of sand. They further assume that grain carbonates compact like sand containing 30% shale, and micrites like shales containing 35% sand.
In the present work, the lithostratigraphic succession mainly comprises grey shales and micrites. The
compaction for shale has been calculated by the use of sonic porosities for the drilled sequence at the site of Well C and by extrapolation of the porosity/depth curve below the drilled depth (Figure 8). Micrites have been assumed to compact 20% less than shales. Net thicknesses (TN) and initial thickness (To), thus calculated, are given in Table 1.
It is obvious that such assumptions in accounting for compaction do not provide an entirely accurate data. But, in general, the errors are not expected to alter the results of geohistory analysis significantly and further precision may be obtained in future when the compaction in limestones is better understood.
S e d i m e n t a t i o n ra tes
The average rates of sediment accumulation in the Bombay High region, generally correlate well over the entire Bombay Offshore Basin and also correspond with those reported from DSDP site 219 (Mohan and Kumar, 1982). A maximum uncorrected rate of over200 m/Ma was established for the Late Paleocene, decreasing to about 70 m/Ma during the Early Eocene. During the Middle and Late Eocene, the rate was rather low, nearly 25 m/Ma. A slightly increased rate ranging from 35 m/Ma to 55 m/Ma, has been established for the Early Oligocene period. A further increase is observed during the Late Oligocene and the early part of the Early Miocene (Aquitanian), when the rate ranged from 35 m/Ma to 90 m/Ma. The rate sharply increased during the Burdigalian, attaining a
Marine and Petroleum Geology, 1985, Vol 2, November 353
n~
--.
o~
"0
8 t'-
0 .<
o [3"
AG
E
PL
EIS
TO
CE
NE
PL
IOC
EN
E
LA
TE
M
IOC
EN
E
MID
DL
E
I O
CE
N
E
UJ
).-
z
'=J
LLI
~.)
< 0
I,LI
:E
LA
TE
D
LIG
OC
E
NE
z < J ,¢[
¢3
n-
rn
Z C~
<~
ZO
NA
LTO
P
MO
LI
THC
D
EP
. U
NIT
S
A
IN +
8
4
p.///
///~
A
/.241
/ 32
5 ,/
H//
//
NI9
{T
OP
} 3-
5 -
~0
%L
1.4
25-
715
- 15
,1
682
1641
D
1
34
13
17
75
?o %
L
N21
(TO
P)
-1"5
SH
6-5-
SH
IN÷
30
%1.
.N
9 (
TO
P)-
-15
"5 r
Lzt
N
8 (
TO
P)
- -1
6 L
st
-N7
(TO
P)-
-1
7 -
L
st
-N6
(TO
P)-
-18
-5 ~
L
st
-196
5
2250
N 6
(Mid
dle
)."
19
23
50
s~
" N
5(Lo
wer
).~
.21.
5- $
Oe/
eL 2
~25
S
H÷
m%
L
30
30
N
4 (
TO
P)-
,22
.5,
sN+
~
0%L
N5
(T
OP
)-'2
5
,327
5 $
w+
.
., zT. ?--
,o~
, -3
535
B
C I
C 2
C
3
D
~11/
I// /,
B
,o
o
~'I
II
•
C~
29
0
35n
~
9~
;
II/_/
/ II
//l
I1//,
C
2
86
7
97
2
99
8
~//3
//~I ~
C3
r//
/~//,
59
5
9
60
6
0
135
136
137
17
9
r////
/i/~
PI9
(Lo
we
r)i3
4.5
S
. +
OL
IGO
CE
NE
P
I8
;}6.
5 70
%L
3650
P
16
37"5
L
AT
E
EO
CE
NE
P
IG
38"5
S
H
MID
DL
E
EO
CE
NE
P
13
42
s#
+
-367
5 P
I0
4
9
ZO
e~L
39
25
E
AR
LY
EO
CE
NE
P
S(L
ow
er)
;50
.6
sH÷
P
6b
15
3"5
10%
L 4
26
5
LA
TE
P
AL
EO
CE
NE
P
4
[56
s
#+
6
0
=0
%-
4800
1 E
3AS
ALT
tC B
AS
EM
EN
T B
UR
IAL
D
EP
TH
PA
LE
OB
AT
HY
ME
TR
Y
TO
TA
L
SU
BS
IDE
NC
E
TO
TA
L
NE
T
TH
ICK
NE
SS
(TN
t)
TN
t x'7
26
(SU
BS
IDE
NC
E
DU
E
TO
SE
D.
LO
AD
)
E
F
G
H
[
V//
//,'
/t
E
I 9
0
191
192
193
24
5
25
5//
27
0;
~'l//
//i/,
F
28
5
28
6
28
7
29
0
33
3
34
6 37
o '6
'
G
I00
I0
0
I00
I0
1
IlO
11
3 11
6 1
24
1
44
~H~I~
O - T
EC
TO
NIC
S
UB
SID
EN
CE
A
ND
IC
C
HA
NG
E
(TC
t-
EU )
Immm;~mu m
,'J m~mmm
• )('-
NE
T
TH
ICK
NE
SS
(T
N)
-LIM
ES
TON
E
AR
E
AS
SU
ME
D
TO
CO
MP
AC
T 2
0%
LE
SS
T
HA
N
SH
ALE
S
-PR
ES
EN
T
WA
TER
D
EP
TH
8
4m
-AL
L
VA
LUE
S
AR
E
IN
ME
TE
RS
/8
7"/
H
57
5
577
58
0
58
5
63
4
64
4
65
9
89
3
81
4
//A///
~/~ y/
/I///,
~ I
10
5
105
10
5
10
6
III
III
112
11
4
118
11
9
//16
8¢
~//
I///
~
J 2
45
2
46
2
46
2
47
2
56
2
58
26
1 2
65
2
71
2
74
34
6~'3:
~/.6
~----
---
IIlI
II//
K
26
0
261
261
26
2
27
0
27
2
27
4
27
7
28
2
28
3
321
33
4
~4,//I/
~/'///H
/Z ~/ll/
/,'Iy
L
,,5
,,
5
,,5
,,
6
,,8
,,
9
,20
,2
, ,2
2
,23
,3
3
,35
M
25
25
2
5
25
2
6
26
2
6
26
2
7
27
2
8
29
31
3
5
~//,///4
;~/~j
~ /'
" //
/I//
//
N
25
0
25
0
25
0
25
1
25
8
25
9
26
0
26
2
26
5
26
6
28
3
28
8
30
4
35
0
39
0
/40
()J
/I//I/
/I,~
f/Illrl//
0 3
40
3
40
34
1 3
42
3
49
3
50
35
1 3
54
3
57
3
62
3
75
3
79
39
1 4
18
4
30
1
43
7
//55
1~
r/I?/
//,~
K
/i,'
/'I
P
53
5
53
5
53
6
53
8
54
8
54
9
55
0
55
3
55
7
55
8
57
7
581
59
3
61
2
62
3
62
4
66
1
~/~
7~
5
04
~/
///I//
/~
47
16
4
67
3
4631
!4
55
4
35
26
34
91
33
6S
"319
8 2
95
7
29
09
22
31
2132
18
76
1590
14
84
1461
12
12
87
0
84
15
0 12
5 7
5
60
7
5
65
6
5
55
5
0
50
I0
0
70
I0
0
I00
5
0
75
8
0
48
00
48
23
4
75
6
46
29
3
58
6
35
66
3
43
4
32
63
3
01
2
29
59
228
1 2
23
2
19
46
16
90
! 15
84
1511
12
87
93
0
39
83
3
88
5
38
27
363
1 2
93
7 2
88
7
27
72
2
60
7
23
55
2
26
6
1746
16
50
1425
11
85
10
78
10
55
8
22
5
04
2
89
2
28
20
2
77
8
26
3
2132
2
09
6
2012
18
93
171
0 1
64
5
1267
11
98
10
34
8
60
7
83
7
66
5
97
3
66
13
05
11
24
7
1264
9
64
9
34
8
42
7
30
1
701
69
5
61
5
50
4
18
24
1
85
3
1853
19
18
1394
1
39
5
1357
|
i
P Y
N*I
9
8
58
196
69
4
5O
I15
165
252
89
52O
96
22
5
24
0
I07
23
23
3
31
8
Tab
le 1
Str
atig
raph
ic in
form
atio
n, p
rese
nt th
ickn
ess,
initi
al th
ickn
ess
and
rest
ored
thic
knes
s fo
r un
its u
n w
ell C
of
Bom
bay
Off
shor
e R
egio
n,
Indi
a, w
ith
TD
as
40
57
m.
Thi
ckne
ss a
nd l
ithol
ogy
of l
ower
uni
ts h
ave
been
est
imat
ed fr
om s
eism
ic s
trat
igra
phy
and
adja
cent
wel
l da
ta
(3
~o
:3"
@
=o
Geohistory of Bombay High region: M. Mohan
0 POROSITY --=-
• 4 .6 .8 I I |
O" 7 : ~ Z ~ z
I + . 0 0 2 5 z
0"7 : /(~Z I +.001 Z
( A F T E R - H O R O W I T Z 1 9 7 5 )
0
I O 0 0 m
2000m
I- n
LId
3 0 0 0 m
- 4 B O O m
5 B O O m
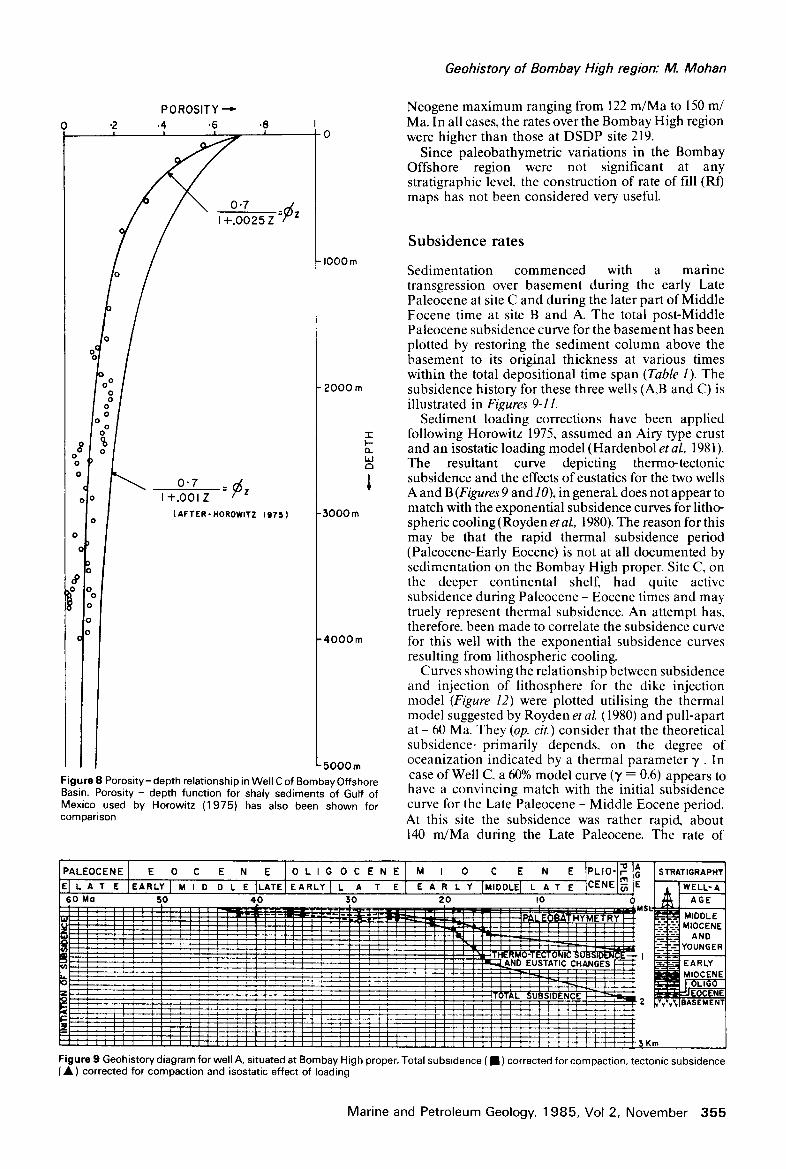
F i g u r e 8 P o r o s i t y - d e p t h r e l a t i o n s h i p i n W e l l C o f B o m b a y O f f s h o r e
B a s i n . P o r o s i t y - d e p t h f u n c t i o n f o r s h a l y s e d i m e n t s o f G u l f o f
M e x i c o u s e d b y H o r o w i t z ( 1 9 7 5 ) h a s a l s o b e e n s h o w n f o r c o m p a r i s o n
Neogene maximum ranging from 122 m/Ma to 150 m/ Ma. In all cases, the rates over the Bombay High region were higher than those at DSDP site 219.
Since paleobathymetric variations in the Bombay Offshore region were not significant at any stratigraphic level, the construction of rate of fill (Rf) maps has not been considered very useful.
S u b s i d e n c e ra tes
Sedimentation commenced with a marine transgression over basement during the early Late Paleocene at site C and during the later part of Middle Eocene time at site B and A. The total post-Middle Paleocene subsidence curve for the basement has been plotted by restoring the sediment column above the basement to its original thickness at various times within the total depositional time span (Table 1). The subsidence history for these three wells (A,B and C) is illustrated in Figures 9-11.
Sediment loading corrections have been applied following Horowitz 1975, assumed an Airy type crust and an isostatic loading model (Hardenbol et aL 1981). The resultant curve depict ing thermo-tectonic subsidence and the effects of eustatics for the two wells A and B (Figures 9 and/0), in generak does not appear to match with the exponential subsidence curves for litho- spheric cooling (Royden et aL 1980). The reason for this may be that the rapid thermal subsidence period (Paleocene-Early Eocene) is not at all documented by sedimentation on the Bombay High proper. Site C, on the deeper continental shelf, had quite active subsidence during Paleocene - Eocene times and may truely represent thermal subsidence. An attempt has, therefore, been made to correlate the subsidence curve for this well with the exponential subsidence curves resulting from lithospheric cooling.
Curves showing the relationship between subsidence and injection of lithosphere for the dike injection model (Figure 12) were plotted utilising the thermal model suggested by Royden et al. (1980) and pull-apart at - 60 Ma. They (op. cir.) consider that the theoretical subsidence-primarily depends, on the degree of oceanization indicated by a thermal parameter y . In case of Well C, a 60% model curve (T = 0.6) appears to have a convincing match with the initial subsidence curve for the Late Paleocene - Middle Eocene period. At this site the subsidence was rather rapid, about 140 m/Ma during the Late Paleocene. The rate of
I I I I I 1 - 1 " 1 I ^ I
i P A L E O C E N E i E 0 C E N E i 0 L I G 0 C E N E i M I 0 C E N E t P L I O - I r = [ ~ I S T " A ' I ' I G " A P H ?
1 6 0 MO 5 0 4 0 3 0 2 0 I 0 0 J , ~ A G E I I , , , , , , , , , I , , , , , , ~ = ~ [ - . . . . . r ' ~ - . . r - r - 4 . . . ~ - . ~ . . . . . . . . I . . . . . . . . . . . M S L , _ . j _ j W . . . . . . . . I . . . . . . . r . . . . ~ P A E O B A T H Y M E T R Y __ : : D D L E . . . . . . . . . . q I . . . . . . . . . . . . . . . . ~ H ~ . - ~ - - I M ~ , , , ~ ~ ] I ' I I I I [ I ' I [ I t I J i i i t i r ~ N . , , i I - - - ' & - . . - J . . . . . .
,., ' ' ; ~ ' ~ = : : ~ ' ' ~ : ~ ~ ~ ! t W--{'="-q & l a r l I ~ , , i ' ' q "~ ~ J 1 I I L----J':--'J ~ - - v I u~ , , I , ' ' I , I J , : z , , ~ , , , - ! , ] / z / / / / / ~ ' ~ , I - i - L ] - - - - - ~ - ~ Y O U N G E R
I I j 1 i ' : I I I ; ~ J I I t " ~ L ] H R M - - I ~ . : ; ~ , I , , ' , ', i ] ' ; . ,T E O - T E C T O N I C S U B S I D E N ~ I I---~--- ' l . J i i i ' [ ~ ~ I I , . , ~ , , . A N D E U S T A T C C H A N G E S ~ I=.-E.--J E A R L Y
' ' ~ ', ' I ! , ' ~ - [ ' 1 t : . . . . . . . . . . . . . . . . . . . . . . I, t t ~ M I O C E N E I , ~ , ! ' ~ ' ' i ' i i i h l : ; , i i t i , ; i ~ r , , , , ~ I - - - - -
' , , e I I , . , ,, , ] ; [ ; I i j = I I [ I j
~ J ', I i : , : ' i = = , , r I i i ' , * ITOTAL SUeS DENCE ~ _ . . ~ ; i , = ! k L , ', I I I I . I I Z ~vvvvW B A S E M E N T
~r_[ I [ i , i i ~ I i [ , , i I ' I t t i . . I I I i I t = t ' , . i I
a 1 I j I i I J I I l I T I j [ = = a i i : i [ ] i i i i J ~ i i ] i z , t i ~ i i i
~ ' [ [ I i i ~ i l [ J i t ] ~ I I ] ] I ] S K i n
F i g u r e 9 G e o h i s t o r y d i a g r a m f o r w e l l A , s i t u a t e d a t B o m b a y H i g h p r o p e r . T o t a l s u b s i d e n c e ( • ) c o r r e c t e d f o r c o m p a c t i o n , t e c t o n i c s u b s i d e n c e ( ~ ) c o r r e c t e d f o r c o m p a c t i o n a n d i s o s t a t i c e f f e c t o f l o a d i n g
Mar ine and Petro leum Geology, 1 9 8 5 , Vol 2, Novembe r 3 5 5
Geohistory of Bombay High region: M. Mohan
rPA~EOCENE I E O C E N E IO L , G O C E N E M , O C E N E 1.L,O-Im-I~ IST.T,~AF'HY E l ~ A ' E E A . ~ I " ' 0 O L E I ' A ' I E A " ' ' 1~ A ~ E E A . L . I"'00~EI " AT E ICE"EI~.IE I ~ 1 ~E~'B ~OMo so ~o so z0 ,o o 1 ~ 1 AGE
zU 1 ; I [ . . . . . ,~ - - . ,¢~ 'F ' , - , , , - ' , -%: , . . . . : - ~ - . = . . . . . . . . . . . . I ' , . . . . . . ' ; ' 1 I L ~ R t u a r r ~ r f I . . . . . . . . . . ! ' ' ~ ; - . L ] I I I I I I I I I I I l I I t:----_---T_--:-~''"~ "=
~,,t ! t , ' i ! , I ~ I - i - - P F I I I I I l - ~ t - - ~ + - - - ' * - - . . . . . . ~ A - J ~ l . . . . . . . ~ . . . . . . % R
I " ~ ' " : ' : " ' : ~ , ! , , ~,THERMO-TECTONIC SUB$1DENCEt- - f - I - ' ~---z--7,=~l ST RATA I ! ; i : ! ' [ ' i T ] i 1 i • ~ . ; . ~ D E U S T A T C C H A N G E ~
/ ~ o ~ _ _ " - ! ' ! i i 1 : ~ ~. -~ ~ - T - ~ - _,...~ t R i I I ~ . . . . . . . . . I
IOi i [ r " ' ' : l ~1 i ' ' I r ' [ ~ I i ~ I I I I t T . , I I ] T I I I t . ,11~"- t I , [ * r T J -- ~ . ~ . ~ . - . - I , ~ , I t ' . ! ! I I t I t ! I . . . . . . . . . . . . . . . . . . . . . . . . . . ~ L I G O ~ E N E ]
Iz--ll~--I~ ~ ~ ~ ! | ~ ~ I I I I ~ ~ ~ " " ' ~ I ~, : ~, ', : { ~, I ~ ~ ~ = ~ ' ~ ~ I i i t I ' ' ~ ' ~TOTAL . . . . SUpSIDENCE . . . . . . . . . F = ' T " ~ ~v ~v BASEMENTv"~r" - -
F i l l , i]!_L ~ ! i i i i l ] i i l l ; i ] ; i [ i l ] i i i i ; i l l t ] i i l . . I I I I ; I 1 I I 1 I ] I I I 1 I 1 I I I I i I I l i I I I l I I i I I l l I I I . ~ l ~m
F i g u r e 1 0 G e o h i s t o r y d i a g r a m f o r w e l l B, s i t u a t e d o n t h e f l a n k o f B o m b a y H i g h . T o t a l s u b s i d e n c e ( i ) c o r r e c t e d f o r c o m p a c t i o n ; t e c t o m c s u b s i d e n c e ( • ) c o r r e c t e d f o r c o m p a c t i o n a n d i s o s t a t i c e f f e c t s o f l o a d i n g
PALEOCENEI E 0 C E N E I 0 , , G 0 C E N E I M , 0 C E N E IPL'O-I~l~ STRATIGRAPHY E l ' A T E kA"L ' I " ' 0 O ' E " ' ' I E ' " L Y I L ' T E I E A " L Y J''OOLEt " ' T E ICE"EI~I E , JWELL-C 6 0 M o 5 0 4 0 5 0 2 0 I 0 0 ~ I A G E
~ J ~ ' ~ ' - - J_ - - r ' l . E lO / . . . . ~ * , ! i i I I I i I I I t I I T I ~ - F F ~ t t ] I I I I I l ! . . . . . O ^ , r ~ A T . V U r T P V ~ ! \ ~ ' ~ - L ; ! ! ] [ E ' ' ; : ' :_ ' ' I i t ' , ' ~ " ~ " , " ; ' T 3 - ' r " I t I - - - : ' - L O C I - ,~-~AJL, , ! !![ ] ! ! ! ! ! ! , ! ~ t l l ~ - ~ ~ ~ , , , , , , , , l ` ~ , o c
P ' ' I T-- '~.,. .L._] T ~ - - ~ - - ~ & . . . . ~ I . . . . . . . . . . . . . . ' , - - - M : b - = - . . . _ ~ ~ . . . . _ . . . . . . . . . . . . . . . . . . . ~ l t . t l i l l l . . . . . . . . . . . . . . . . - : ~ , 1
9 " - : ! __ L - E L i L - ~ i T - ~ " L ~ . . . . . ~ ~ I ' ~ : , : ~ ,. =~ ' ~ __i___ ~ ] i__ ~ I . . . . I ! 1 , ~ . t I I { I J I ] T ' P , - : ~ - ~ ' ~ t Z ' , 1 '
i ~ - ~ - C ~ " I ', ~ " " - - , - -T - ~ - ; , - N i t ! : : ' ~ ~ ~ ' : ' ~ ' = ! ~ : ' J ' ' ! ! : ' I ' ~ , ! ' : - - - . ' I i ', . , - - : ~ T H E R M O - T E C T O N I C S U B S I D E N C E ! , i I 1; E
i + , r ~ _ - . l l , i ' . I , l ' . , : i l , , ~ , F~=_I~ ~i , ! : . 1 ' : (i ' ' ; ~ l i I rz--~--c,~ 'qOL'GO Z '1 ~ ~ ~ ~ ~ ~ I I t ) I ; ', = D ~ ' ~ ~ ~ I : , ; , LTJ - I ?~.: , i l i l l , ! . + ~ , , i c , ' - - : t t f ) = ! l 1 1 t t ~ - - ~
' ~ ' ' I' t '. ! ITOTAL, ,SUBSIDENCI~ C~" " ' - , . . ' ' ' ' : : ' ' ' ? i ; . I I "l ] , [ [ ~ ] I ] J I I ] [ ] ~ l J ] J I I [ I --.'r.: I . . . . . . . . i . . . . . I l I I / , I . . . . . . . . . ~ g L - _ - ~ - ~ L J P A L E I
I I i [ '~ i '~ I ] I I I , I I I t I I ', I 'i I ', ', i I I I ', I ', ', ] ~ L ' I ~ ~ : : ', ', I ', ', I ~ ~ ', I ', I t t ' I I I ] I ', ', ', ~ I [ :, ,~T [ - ~ 5 1 ~ v l l F l S l a a l ~ r r l
F i g u r e 1 1 G e o h i s t o r y d i a g r a m f o r w e l l C, s i t u a t e d a t d e e p c o n t i n e n t a l s h e l f in B o m b a y O f f s h o r e B a s i n . T o t a l s u b s i d e n c e ( I 1 ) c o r r e c t e d f o r ' p s e u d o - s u b s i d e n c e " a n d c o m p a c t i o n ; t e c t o n i c s u b s i d e n c e ( & ) a l s o c o r r e c t e d f o r i s o s t a t i c e f f e c t s o f l o a d i n g • S t i p p l e d l i ne g i v e s p r e d i c t e d s u b s i d e n c e f o r 6 0 % o c e a n i s e d c o n t i n e n t a l c r u s t a n d pu l l - a p a r t t i m e 6 0 M a ( R o y d e n e t al. 1 9 8 0 )
F i g u r e 1 2 R e l a t i o n s h i p b e t w e e n s u b s i d e n c e a n d i n j e c t i o n o f t h e l i t h o s p h e r e f o r t h e d i k e i n j e c t i o n m o d e l f r o m R o y d e n et al. ( 1 9 8 0 )
. 0
2
" 3
- 4
. 5
, 6 K m
3 5 6 M a r i n e a n d P e t r o l e u m G e o l o g y . 1 9 8 5 , V o l 2 , N o v e m b e r
Geohistory of Bombay High region." M. Mohan
subsidence gradually decayed to 45 m/Ma in the Early Eocene and 15 m/Ma in the Middle Eocene (Figure 11).
The Late Paleocene sequence has not been penetrated by this well and has been recognized from the reflection seismic record; therefore, a finer biozonation defining its chronological subdivision has not been possible. This has resulted in the abrupt and anomalous shape of the thermo-tectonic curve for the Paleocene part Even with this limitation the model curve for 60% injection of the lithosphere matches the Late Paleocene and Eocene data points very closely. The data points for the late Middle and Late Miocene fall significantly below the model curve suggesting active tectonic subsidence.
Eus t a t i c c h a n g e s a n d r eg iona l s u b s i d e n c e / upl i f t
Hardenbol et al. (1981) have suggested that the distance between the thermo-tectonic curve and the model subsidence curve is a measure of the long term eustatic changes and can be measured directly from the plot in Figure 11, if no uplift (or subsidence) occurred. The values thus evolved require correction for the loading effect of eustatic sea level changes:
P M D = EF + ~ m X E F = 1.309EF
or EF = MD 1.309
Where, EF is the eustatic level difference and MD is the measured distance of the data point below or above the model subsidence curve (Figure 11, Table 2). Their corrected values for eustatic water loading (MD/1.309) have also been shown in Table 2.
The calculation of long term eustatic sea level changes is based on an isostatic comparison on an Airy type crust (Hardenbol, op. cit) and is given by the equation:
WD 1 + TS = WD 2 + EF + MC + Ru (1)
Where WD l is the original water depth, TS is thermal subsidence from model subsidence curve, WD 2 is the present water depth, MC is the mantle compensation after an eustatic change and Ru is the present day expression of the regional uplift.
Hardenbol (op. tit.) determined the effects of mantle compensation by:
P MC = EF p ~ _ ~ = 0.45 EF (2)
Where, Pw = 1.03 g cm -3 and P m = 3.33 g cm -3
Substituting the value of MC, Equation (1) can be written as:
EF = WD1 - WD2 + TS - R u 1.45 (3)
Hardenbol et al. (op. ci~) recommend that in other than water filled basins, isostatic compensation can be
made by removing the sediment and restoring the water depth as follows:
WD 1 - ( W D 2 + WR) + T S - R u EF - 1.45 (4)
Where, WR is the restored water column after backstripping and taking into account unloading adjustment and porosity restoration of the underlying section.
In cases where regional subsidence (Rs) is applicable instead of regional uplift, the equation (4) can be expressed as:
WD 1 - (WD 2 + WR) + TS + Rs EF = 1.45 (5)
A general look on Figure 11 suggests that all of the unconformities in the Paleogene section are most probably due to fall in eustatic level at corresponding time intervals. Active subsidence during the Middle - Late Miocene period is suggested.
The eustatic sea level at different times, within the Tertiary succession, have been directly measured from Figure 11 and after applying the necessary correction for the loading effect (MD/1.309), the values have been listed in Table 2. The eustatic changes thus, established for Well C, exhibit remarkable similarity in trend (Figure 13) with the global sea level changes established by Vail et al. (1977). The exact magnitude of the changes appear to have been effected by the active subsidence during Middle - Late Miocene (Figure 13), which otherwise has also been established by the regional geological evidence.
If we assume that the quantified global sea level changes established by Vail et al. (1977) are real, their numerical values can be used for calculation of regional uplift (Ru) and regional subsidence (Rs).
The calculation of regional subsidence (Rs) can be achieved by:
Rs = 1.45 FE + (WD 2 + WR) -- WD I - TS (6)
Where the value of EF is derived from the data established byVailetal . (1977). The regional uplift (Ru) can, similarly, be established by:
Ru = - 1 . 4 5 F E - ( W D 2 + WR) + WD 1 + TS (7)
The values for the regional uplift or subsidence of the basement at the site of Well C have been calculated from equations (6) and (7) and are given in Table 3.
The corrected value of MD is a measure of the long term eustatic changes if no uplift (or subsidence) takes place (Hardenbol et al., 1981). These values (Table 2) do not match with the global values of eustatic sea level changes given by Vail et al. (1977), clearly suggesting that there had been significant regional uplift/ subsidence at the site C. Therefore, utilising the numerical values of eustatic sea level changes, as established by Vail et al. (1977), the regional uplift/ subsidence have been calculated by equations (6) and (7). The values for WD! (initial water depth), WR (restored water column), EF (theoretical values of eustatic sea level changes) and TS (thermal subsidence) are given in Table 3. The WD 2 (present water depth) is 84 m.
Marine and Petroleum Geology, 1985, Vol 2, November 357
Geohistory of Bombay High region: M. Mohan
Table 2
Ma Exponential thermal Observed value of subsidence values Thermotectonic (after Royden et al., subsidence + Eust- 1980, from Figure 11 atic changes from (7 = 0.6) Figure 11
Position of sea level with respect to the present level assuming no subsidence/uplift MD (From M D / 1 . 3 0 9 Figure 11)
Theoretical value of Eustatic changes with respect to present sea level (after Vail et aL, 1977) (+) rise : (-) fall.
Ma Theoretical value of Eustatic changes with respect to present sea level (after Vail et el., 1977) (+) rise : (-) fall
Paleobathymetry Restored water Thermal subsidence Regional subsidence (Rs-) column (WR) calculated from 60% /uplift (RU +) of the base- after back stripping, exponential thermal sub- ment with respect to its calculated from sidence curve {after present position Table 1. Royden et al., 1980) calculated by equation
After accounting for the eustatic sea level changes, the thermo-tectonic curve (Figure 11) is modified to depict the regional subsidence/uplift history of the basement at site C (Figure 14, Table 3). It has not been possible to apply corrections for short term eustatic sea level
changes so the Rs curve shown in Figure 14, may not be precisely, but generally correct.
It is clear from Figure 14 that most of the Paleogene unconformities can be the result of eustatic sea level falls at 53.5 Ma, 49.5 Ma, 40 Ma and 29 Ma. It is likely that minor uplift may be associated with the Paleocene/Eocene and Middle/Upper Eocene
3 5 8 Mar i ne and Pe t ro leum Geology, 1 9 8 5 , Vol 2, N o v e m b e r
Geohistory of Bombay High region: M. Mohan
I"LI" 17~ I U L;I:.NI:.
P L I O C E N E
UJ L A T E Z tU MIDDLE C.) O m
~E E A R L Y
z L A T E
O
I~ MIDDLE
I L A T E bd Z LU MIDDLE U O
EARLY
L A T E f~
WELL- C BOMBAY OFFSHORE BASIN
PLOT FOR CORRECTED VALUES OF MD INCREASE
I I
4OOm 3DOra 2OOm lOOm O lOOm 2OOm 3OOm
VAIL ET AL (1977)
+2OOm +lOOm 0 -lOOm -2OOm
, ~ , ' ~ '
I I /
r / -
\ c.___
L_
MO O 2 . 8
6'6 9 '8
22'5
29
40
49"5
60
Figure 13 Correlation of corrected values of M D from Figure 1 1 with the global sea level changes, suggesting a distinct phase of active subsidence during late Midd le-Upper Miocene at the site of Well C in Bombay Offshore Region
LEOC NE E 0 C E N E I OL' 0 C EN E L A T E EARLY M I D ° L E ILATE~ EARLY I L A T E I
M I Oy C E N E IPLlO-l~i EARL M,OOLE LATE ICE"EI I
+500m
PRESENTSEA LEVEL
- 500m
IOO0 m
500 m
WELL-C
5OOm
F i g u r e 14 Regional subsidence (Rs) curve for the basement with respect to its present position, at site of well C in Bombay Offshore Region. Fall in eustatic level is observed corresponding to the Paleogene unconformities. A phase of active regional subsidence in the late Middle-Upper Miocene is distinct
unconformities. The regional subsidence (Rs) from Lower Oligocene (36.5 Ma) to lower Lower Miocene (22.5 Ma) had been very gradual and practically negligible. The eustatic fall at 29 Ma resulted in erosion of the sediments deposited during the time span of 34.5-29 Ma (5.5 Ma).
The subsidence during the Lower Miocene and lower Middle Miocene, from 22.5 Ma to 15 Ma, continued to be slow and gradual but it had been rather rapid during lower Middle and Upper Miocene, between 15 Ma and 6.5 Ma, recording a subsidence of
about 450 m at site C. During this period of 8.5 Ma, there had been a cumulative eustatic fall of about 250 m, but sedimentation continued uninterrupted. This suggests that there must, at least, have been more than 250 m (if not 450 m) of cumulative subsidence. During the last 6.5 Ma, subsidence has been minor and an uplift of about 100-150 m is recorded within the latest 3.5 Ma.
Thus the sedimentation history at site C reveals a distinct phase of active regional subsidence between 6.5 Ma and 15 Ma. The magnitudes of the subsidence
Marine and Petroleum Geology, 1985, Vol 2, November 3 5 9
Geohistory of Bombay High region: M. Mohan
calculated in this paper are based on the numerical eustatic sea level changes as proposed by Vail et al. (1977). If these values of eustatic changes are not realistic, the magnitude of subsidence would have to be suitably modified.
The active subsidence phase might be the result of compressional activity related to the active spreading on the Mid-Indian Ocean Ridge during the late Middle-Late Miocene. Parker and Gealey (1983) comment that spreading on the Mid-Indian Ocean Ridge was active during the Late Miocene (9 Ma).
C o n c l u s i o n s
The regional subsidence history can be determined with adequate stratigraphic and paleobathymetric control and with the knowledge of the magnitude of eustatic sea level changes.
A distinct phase of active subsidence in the late Middle-Late Miocene has been demonstrated in Bombay Offshore region. The determination of the magnitude of the subsidence is tentative and depends on the magnitude ofeustatic sea level changes. Further refinements, in the knowledge of the magnitude of eustatic change and in the models used in this study, are expected to provide a precise subsidence history and insight to the events that caused transgressions and regressions.
Acknowledgements The inspiration and guidance received from Mr. S.N. Talukdar, Member Exploration and Mr. L.L. Bhandari, Director, KDMIPE, Oil and Natural Gas Commission are gratefully acknowledged. The author is especially thankful to Prof. J.E. van Hinte of the Free University, Amsterdam for suggesting improvements, useful and inspiring discussions, guidance and critically reviewing the manuscript The helpful suggestions from Dr. S.K, Biswas and Mr. V. Raiverman of the Oil and Natural Gas Commission have been specifically useful in this study. The help received from Mr. P. Kumar at various stages of this study and preparation of the manuscript has been an outstanding support.
Thanks are due to Mr. Achal Singh for care in preparing the illustrations.
The views expressed in this paper are those of the author and not necessarily of the Oil and Natural Gas Commission.
B i b l i o g r a p h y
Basu, D.N., Banerjee, A. and Tamhane, D.M. (1980) Source area migration trends of oil and gas in Bombay Offshore Basin, India, AAPG 64, (2), 209-220
Hardenbol, J., Vail, P.R. and Ferrer, J. (1981) Interpretting paleoenvironments, subsidence history and sea level changes of passive margins from seismic and biostratigraphy, Oceanologica acta, Supplement on vo/, 4, 33-44
Horowitz, D.H. (1975) Mathematical modelling of sediment accumulation in prograding deltaic systems, in: Quantitative techniques for the analysis of sediments, (Ed. D.F. Merrian) Proc. IX Int.Sed.Cong., Nice, France
Mohan, Madan and Kumar, P. (1982) Paleogene and Early Neogene sedimentation rates in an Arabian Sea sedimentary basin, Geosc. J. III, (2), 151-164
Mohan, Madan~ Narayanan, V. and Kumar, P. (1980) Paleogene and Early Neogene biostratigraphy of Bombay Offshore Region; 7th Ind. Colloq. Micropal. Stratig. (December, 1978) Madras University, 180-194
Mohan, Madan, Kumar, P., Narayanan, V., Govindan, A., Soodan, K.S. and Singh P. (1982) Biofacies, Paleoecology and Geological History of Bombay Offshore Region, Bull. ONGC 19, ( 1 ), 13- 27
Parker, E.S. and Gealey. W.K. (1983) Plate Tectonic evolution of the Western Pacific Indian Ocean Region, Proc. EAPI/ASCOPE/ CCOP/IOC Workshop: On the geology and hydrocarbon potential of the South China Sea sand possibilities of joint development. Honolulu, August 22-26 (pre-print)
Rao, R.P. and Talukdar, S.N. (1980) Petroleum Geology of Bombay High Field, India, in: Giant Oil and Gas fields of the past decade, AAPG, Mem. 30, 487-506
Royden, L., Sclater, J.G. and Von Horzon, R.P. (1980) Continental margin subsidence and heat flow. Important parameters information of petroleum hydrocarbons, Bull. AAPG. 64, (2), 173-187
Sahay, B. (1978) Geology of Bombay high and adjoining structures, Offshore South-East Asia Conference, 1-11
Shukla, S.N. (1983) Petroleum geology of India, in: Schlumberger Well Evaluation Conference, India, 23-25
Vail, P.R. and Mitchum, R.M. (1980) Global cycles of sea level changes and their role in exploration, Proc. Tenth World Petroleum Congress, 2, Expl. Supply and Demand, 95-104
Vail, P.R., Mitchum, R.M., Jr. and Thompson, S. II1. (1977) Seismic stratigraphy and global changes of sea level. Part 3. Relative changes of sea level from Coastel Onlap, in: Seismic Stratigraphy-Application to hydrocarbon exploration, (Ed. C.E. Payton) AAPG Mem. 26, 63-81
Van Hinte, J.E. (t 978) Geohistory analysis-application of micropaleontology in: Exploration geology. AAPG, Bull. 62, 201-222
Whitmarsh, R.B., Weser, O.E., Ross, D.A., eta/. (1974) Initial reports of the deep sea drilling projects, 23, 35-115
3 6 0 Ma r i ne and Pe t ro leum Geology, 1 9 8 5 , Vo l 2, N o v e m b e r