(jU^S^^-M STATE OF ILLINOIS WILLIAM G. STRATTON, Governor DEPARTMENT OF REGISTRATION AND EDUCATION VERA M. BINKS, Director DIVISION OF THE STATE GEOLOGICAL SURVEY M. M. LEIGHTON, Chief URBANA REPORT OF INVESTIGATIONS—NO. 162 GEOLOGIC ASPECTS OF RADIO WAVE TRANSMISSION BY M. WILLIAM PULLEN PRINTED BY AUTHORITY OF THE STATE OF ILLINOIS URBANA, ILLINOIS 1953 LIBRARY nr.T ft 1QM
Transcript
(jU^S^^-M
STATE OF ILLINOIS
WILLIAM G. STRATTON, Governor
DEPARTMENT OF REGISTRATION AND EDUCATIONVERA M. BINKS, Director
DIVISION OF THE
STATE GEOLOGICAL SURVEYM. M. LEIGHTON, Chief
URBANA
REPORT OF INVESTIGATIONS—NO. 162
GEOLOGIC ASPECTS
OF RADIO WAVE TRANSMISSION
BY
M. WILLIAM PULLEN
PRINTED BY AUTHORITY OF THE STATE OF ILLINOIS
URBANA, ILLINOIS
1953
LIBRARY
nr.T ft 1QM
ILLINOIS STATE GEOLOGICALSURVEY
3 3051 00005 8440
STATE OF ILLINOIS
WILLIAM G. STRATTON, Governor
DEPARTMENT OF REGISTRATION AND EDUCATIONVERA M. BINKS, Director
DIVISION OF THE
STATE GEOLOGICAL SURVEYM. M. LEIGHTON. Chief
URBANA
REPORT OF INVESTIGATIONS—NO. 162
GEOLOGIC ASPECTS
OF RADIO WAVE TRANSMISSION
BY
M. WILLIAM PULLEN
PRINTED BY AUTHORITY OF THE STATE OF ILLINOIS
URBANA, ILLINOIS
1953
MANUSCRIPT COMPLETED JANUARY 1952
ORGANIZATION
STATE OF ILLINOIS
HON. WILLIAM G. STRATTON, Governor
DEPARTMENT OF REGISTRATION AND EDUCATIONHON. VERA M. BINKS, Director
BOARD OF NATURAL RESOURCES AND CONSERVATION
HON. VERA M. BINKS, Chairman
W. H. NEWHOUSE, Ph.D., Geology
ROGER ADAMS, Ph.D., D.Sc, Chemistry
LOUIS R. HOWSON, C.E., Engineering
A. E. EMERSON, Ph.D., Biology
LEWIS H. TIFFANY, Ph.D., Pd.D., Forestry
GEORGE D. STODDARD, Ph.D., Litt.D., LL.D., L.H.D.,
President of the University of Illinois
DELYTE W. MORRIS, Ph.D.,
President of Southern Illinois University
GEOLOGICAL SURVEY DIVISIONM. M. LEIGHTON, Ph.D., Chief
(67358—2M—3-53)
srs7
STATE GEOLOGICAL SURVEY DIVISIONNatural Resources Building, Urbana
M. M. LEIGHTON, Ph.D., Chief
Enid Townley, M.S., Geologist and Assistant to the Chief
Velda A. Millard, Junior Assistant to the Chief
Helen E. McMorris, Secretary to the Chief
RESEARCH(Not including part-time personnel)
GEOLOGICAL RESOURCESArthur Bevan, Ph.D., D.Sc, Principal Geologist
Frances H. Alsterlund, A.B., Research Assistant
Coal
Arthur Bevan, Ph.D., D.Sc, Acting HeadG. H. Cady, Ph.D., Senior Geologist and Head, EmeritusErnest P. Du Bois, Ph.D., GeologistGeorge M. Wilson, M.S., GeologistRobert M. Kosanke, Ph.D., GeologistRaymond Siever, Ph.D., Associate Geologist
Jack A. Simon, M.S., Associate Geologist
John A. Harrison, M.S., Assistant GeologistMargaret A. Parker, M.S. Assistant GeologistFrederick E. Williams, M.S.,, Assistant GeologistKenneth E. Clegg, M.S., Research Assistant
Oil and GasA. H. Bell, Ph.D., Geologist and HeadLester L. Whiting, B.A., Associate GeologistVirginia Kline, Ph.D., Associate GeologistWayne F. Meents, Assistant GeologistKathryn C. Irving, Technical AssistantEugene Frund, B.A., Research Assistant
Petroleum Engineering
Paul A. Witherspoon, M.S., Petroleum Engineer andHead
Frederick Squires, A.B., B.S., Petroleum Engineer,Emeritus
Industrial Minerals
J. E. Lamar, B.S., Geologist and HeadDonald L. Graf, Ph.D., Associate GeologistJames C. Bradbury, A.M., Assistant GeologistRobert J. Cronk, M.S., Assistant GeologistRaymond S. Shrode, M.S., Assistant Geologist
Clay Resources and Clay Mineral Technology
Ralph E. Grim, Ph.D., Consulting Clay MineralogistW. Arthur White, M.S., Associate GeologistHerbert D. Glass, Ph.D., Associate GeologistEdward C. Jonas, M.S., Assistant Geologist
Groundwater Geology and Geophysical Exploration
Frank C. Foley, Ph.D., Geologist and HeadMerlyn B. Buhle, M.S., Associate GeologistTheodore R. Walker, Ph.D., Assistant Geologist (on
leave)Richard F. Fisher, M.S., Assistant Geologist (on leave)Robert D. Knodle, M.S., Assistant GeologistJohn W. Foster, M.S., Assistant GeologistJames E. Hackett, M.S., Assistant GeologistMargaret J. Castle, Assistant Geologic Draftsman (on
leave)Lidia Selkregg, D.N.S., Research Assistant
Geophysical Research
M. William Pullen, Ph.D., Geologist and HeadRobert B. Johnson, M.S., Assistant GeologistBennie Ellis, Assistant (on leave)
Engineering Geology and Topographic MappingGeorge E. Ekblaw, Ph.D., Geologist and HeadWilliam C. Smith, M.A., Assistant Geologist
Stratigraphy and Areal Geology
H. B. Willman, Ph.D., Geologist and HeadJ. S. Templeton, Ph.D., GeologistDavid H. Swann, Ph.D., GeologistElwood Atherton, Ph.D., Associate GeologistCharles W. Collinson, Ph.D., Assistant GeologistDonald B. Saxby, M.S., Assistant GeologistT. C. Buschbach, M.S., Assistant GeologistHoward R. Schwalb, B.S., Research AssistantCharles C. Engel, Technical AssistantJoseph F. Howard, Assistant
Topographic Mapping in Cooperation with the UnitedStates Geological Survey.
February 18, 1953.
GEOCHEMISTRYFrank H. Reed, Ph.D., Chief ChemistGrace C. Johnson, B.S., Research Assistant
Coal Chemistry
G. R. Yohe, Ph.D., Chemist and HeadFrancis Scheidt, B.S., Research AssistantRudolph L. Pedrotti, M.S., Research Assistant
Physical Chemistry
J. S. Machin, Ph.D., Chemist and HeadTin Boo Yee, M.S., M.A., Assistant ChemistFrances H. Staplin, M.A., Research Assistant
Fluorine Chemistry
G. C. Finger, Ph.D., Chemist and HeadRobert E. Oesterling, B.A., Assistant ChemistJoseph E. Dunbar, M.S., Special Research AssistantMelvin J. Gortatowski, M.S., Special Research Assist-
ant
Chemical Engineering
H. W. Jackman, M.S.E., Chemical Engineer and HeadP. W. Henline, M.S., Chemical EngineerR. J. Helfinstine, M.S., Mechanical EngineerB. J. Greenwood, B.S., Mechanical EngineerJames C. McCullough, Research Associate (on leave)Walter E. Cooper, Technical AssistantRaymond H. Pellum, Technical Assistant (on leave)Edward A. Schaede, Technical Assistant
X-RayW. F. Bradley, Ph.D. Chemist and Head
Spectrochemistry (formerly Physics)
Kenneth B. Thomson, Ph.D., PhysicistR. J. Piersol, Ph.D., Physicist, EmeritusJuanita Witters. M.S., Assistant Physicist
Analytical Chemistry
O. W. Rees, Ph.D., Chemist and HeadL. D. McVicker, B.S., ChemistEmile D. Pierron, M.S., Associate ChemistFrancis A. Coolican, B.S., Assistant ChemistCharles T. Allbright, B.S., Research AssistantRobert L. Eissler, B.S., Research AssistantWilliam J. Armon, B.S., Research AssistantEvelyn Veazey, B.S., Research AssistantRaymond Isaac, B.S., Research AssistantEugene Lange, Technical AssistantGeorge R. James, Technical AssistantLois Jean Ruffner, Technical Assistant
MINERAL ECONOMICSW. H. Voskuil, Ph.D., Mineral EconomistW. L. Busch, A.B., Assistant Mineral EconomistEthel M. King, Research Assistant
EDUCATIONAL EXTENSIONGilbert O. Raasch, Ph.D., Geologist in ChargeMargaret H. Bargh, B.S., Research AssistantLouis Unfer, Jr., M.A., Research Assistant
RESEARCH AFFILIATES IN GEOLOGYT Harlan Bretz, Ph.D., University of ChicagoStanley E. Harris, Jr., Ph.D., Southern Illinois Uni-
versity
C. Leland Horberg, Ph.D., University of ChicagoHeinz A. Lowenstam, Ph.D., California Institute of
TechnologyPaul E. Potter, Ph.D., Assistant Geologist, Stale Geo-
logical SurveyWilliam E. Powers, Ph.D., Northwestern UniversityPaul R. Shaffer, Ph.D., University of Illinois
Harold R. Wanless, Ph.D., University of Illinois
J. Marvin Weller, Ph.D., University of Chicago
CONSULTANTSGeology, George W. White, Ph.D., University of Illinois
Ralph E. Grim, Ph.D., University of Illinois
L. E. Workman, M.S., Former Head, SubsurfaceDivision
Ceramics, Ralph K. Hursh, B.S., University of IllinoisMechanical Engineering, Seichi Konzo, M.S., University
of Illinois
Editing, Dorothy E. Rose, B.S.
GENERAL ADMINISTRATION(Not including part-time personnel)
Library
Anne E. Kovanda, B.S., B.L.S., LibrarianRuby D. Frison, Technical AssistantFrances Beer, B.A., Technical Assistant
Mineral Resource Records
Vivian Gordon, HeadGretchen B. Bauerle, Technical AssistantShirley R. Cole, B.S., Technical Assistant
Judy Ann Day, Technical AssistantMary L. Bahe, B.A., Technical AssistantLorna J. Elliott, Technical Assistant
Publications
Jane V. Olson, B.A., Associate Technical EditorBarbara Zeiders, B.S., Assistant EditorMeredith M. Calkins, Geologic DraftsmanGordon W. Johnson, B.S., Assistant Geologic Draftsman
Irene H. Benson, Technical AssistantLois Winiarski, Technical Assistant
February 18. 1953
Other Technical Services
Leslie D. Vaughan, Research AssociateBeulah M. Unfer, Technical AssistantA. W. Gotstein, Research AssociateGlenn G. Poor, Research AssociateGilbert L. Tinberg, Technical AssistantWayne W. Nofftz, Supervisory Technical AssistantDonovon M. Watkins, Technical Assistant
Financial Records
Velda A. Millard, In ChargeLeona B. Kenward, Clerk-Typist IIIVirginia C. Sanderson, B.S., Clerk-Typist IIJoann M. Dunbar, Clerk-Typist IIrma E. Toppe, Clerk-Typist I
Clerical Services
Mary Cecil, Clerk-Stenographer IIIMary M. Sullivan, Clerk-Stenographer IIIEthel M. Henwood, B.A., Clerk-Stenographer IILyi.a Nofftz, Clerk-Stenographer IIKathryn M. Retallick, A.B., Clerk-Stenographer IIPhyllis J. Barham, Clerk-Stenographer ILillian Weakley, Clerk-Stenographer I
Shirley Colvin, Clerk-Stenographer IBarbara Jolloff, Clerk-Stenographer I
Mary J. de Haan, Messenger-Clerk I
Automotive Service
Glenn G. Poor, In ChargeRobert O. Ellis, Automotive MechanicEverette Edwards, Automotive MechanicDavid B. Cooley, Automotive Mechanic s Helper
CONTENTS
Page
Chapter 1.—Introduction 9
Radio waves and geology 9
Objectives 10
Scope 11
Acknowledgments 11
Chapter 2.—Theoretical concepts of propagation 12
Radio waves 12
Influence of earth materials 12
Ground-wave at broadcast frequencies 13
Wave-guide transmission and propagation 13
Geologic wave-guides 13
Chapter 3.—Previous work 15
Chapter 4.—Equipment for radio field intensity measurements 19
Previous work 19
Present work 19
Instrumentation for reconnaissance investigation 19
Instrumentation for detailed investigation 20
Instrumentation in mobile operation 22
Instrumentation and investigation in the laboratory 22
Chapter 5.—Radio field intensity measurement 24
Field intensity and loop orientation 24
Field intensity records 24
Ground-wave versus sky-wave signals 24
Constancy of ground-wave intensity 26
Modulation effect 27
Outline of field procedure 27
Chapter 6.—Effects of cultural and natural features 28
Wires and steel bridge 28
Description of Area I 28
Wire fences 32
Description of Area II 32
Description of Area III 32
Overhead wires 33
Grounded electric service poles 33
Topography 34
Topographic shadow effect 34
Shadow effect from woods 37
Description of Area IV 37
Streams 38
Buried pipes 38
Road materials 38
Lakes and ponds 38
Chapter 7.—Effects of meteorological conditions 39
Chapter 8.—Effects of geologic features 41
Faulting 41
The Shawneetown fault in Illinois 41
Signal from broadcast station WILL 42
Signal from broadcast station KWK 42
Signal from broadcast station WJPF 43
Signal from radio range station AF 43
The Shawneetown fault in Kentucky 44
[5]
PageInman East fault 46
Cryptovolcanic structure near Kentland, Indiana 47
Geologic setting 47
Field hazards 49
Field intensity measurements 49
Field intensity contour maps 49
Signal intensity versus magnetic intensity 52
Signal intensity behavior 52
Depth to bedrock 52
Dome structure with suspected igneous origin 53
Geologic setting 53
Field hazards 54
Field intensity measurements 55
Ore bodies 55
Geologic setting 55
Ore deposits 56
Areas of working and abandoned mines 56
Prospective ore-bearing areas 56
Areas of newly discovered ore bodies 57
Underground mined-out areas 59
Geologic setting 60
Truax-Traer coal mines 60
Re-examination of B. & VV. mine 61
Soils 62
Soil influence on signal strength 63
Bedrock valleys and depth to bedrock 64
Nonglaciated areas 64
Glaciated areas 65
Chapter 9.—Summary and conclusions 67
Appendix A.—FCC ground conductivity map of the U.S 71
Appendix B.—Glossary of radio terms 72
ILLUSTRATIONS
Figure Page
1. Field intensity contour map near Homewood, Illinois 20
2. Circuit of field intensity meter 21
3. Wooden- bodied station wagon with radio field intensity measuring equipment 21
4. Operator in working position 22
5. Signal intensity record 25
6. Signal intensity record 25
7. Four-hour record of WLW illustrating sky-wave 26
8. Record of WGN illustrating ground-wave 26
9. Location of broadcast transmitters—distance from area of traverse in area I 29
10. Natural and cultural features along line of traverse 29
11. Signal intensity curves of signals arriving from the northeast 30
12. Signal intensity curves of signals arriving from the southeast 30
13. Signal intensity curves of signals arriving from the southwest 31
14. Signal intensity curves of signals arriving from the northwest and southeast 31
15. Natural and cultural features along line of traverse in area II 32
[6]
Page
16. Natural and cultural features along line of traverse in area III 33
17. Signal intensity curve near Harrisburg, Illinois 34
18. Topographic map of Shawneetown Hills area 35
19. Signal intensity curve illustrating shadow effect of interposed hills 36
20. Signal intensity curve run across Shawneetown Hills 37
21. Natural and cultural features along line of traverse in area IV 38
22. Map of traverse across Shawneetown fault in Gallatin County, Illinois 42
23. Signal intensity curve recorded across the Shawneetown fault (Sta. WILL) 43
24. Signal intensity curve recorded across the Shawneetown fault (Sta. KWK) 43
25. Signal intensity curve recorded across the Shawneetown fault (Sta. WJPF) 44
26. Signal intensity curve recorded across the Shawneetown fault (Radio Range Sta. AF) .... 44
27. Topographic map of the Shawneetown area 45
28. Field intensity curve recorded across the Shawneetown fault in Ohio River bottoms in Kentucky . 46
29. Field intensity contour map near Kentland, Indiana (Sta. WIND) 48
30. Field intensity contour map of the Kentland, Indiana, area (Sta. WAAF) 50
31. Topographic map of the Hicks dome area, Hardin County, Illinois 51
32. Geologic map and cross section of the center of Hicks dome, Hardin County, Illinois 53
33. Signal intensity curve recorded across Hicks dome 54
34. Signal intensity curve recorded over a rich iron deposit in the Galena, Illinois, area 57
35. Signal intensity curve recorded over the Kittoe ore body (Sta. WMAQ) 58
36. Signal intensity curve recorded over the Kittoe ore body (Radio Range Sta. CHI) 59
37. Map of traverse across mined-out area, Gallatin County, Illinois 59
38. Signal intensity curve recorded across mined-out area, Gallatin County, Illinois 61
39. Map of traverse between Clinton and Springfield, Illinois 62
40. Signal intensity curve recorded across various soil types near Kenny, DeWitt County, Illinois . . 63
41. FCC map of ground conductivity in the United States 69
1 Terman, F. E., Radio engineer's handbook: New York,McGraw-Hill, 1st ed., p. 708, 1943.
2 Idem., p. 674.3 Standards of good engineering practice concerning stand-
ard broadcast stations 550-1600 kc: Federal Communica-tions Commission, Washington, D.C., U. S. Govt. PrintingOffice, pp. 33-34, 1940.
4 Smith, Woodrow, Antenna manual : Santa Barbara, Edi-tors and Engineers, Ltd., p. 149, 1948.
5 See Glossary of Radio Terms : Appendix B.6 Skilling, H. H., Fundamentals of electric waves: New
York, John Wiley, 2nd ed., p. 149, 1948.
measured in air at a distance from a trans-
mitter. 7It is the influence of earth materials
on radio field intensity which is of interest
to the geologist.
The present investigation is concerned
with the relationship between radio fields
and earth materials. If geologic features such
as folding, faulting, and abrupt lithologic
changes present electrical discontinuities
(changes in effective conductivity and dielec-
tric constant) which influence the behavior
of radio fields measured in air at the earth's
surface, recognition of such behavior through
field strength measurements would provide a
means of mapping these geologic features.
If significant field strength anomalies are
found in areas of known geologic features,
and can be correlated with them, it wouldappear that unknown geologic features
might be interpreted from measurements of
field strength.
Because radio waves at broadcast frequen-
cies (550-1600 kc.) are readily available and
are known from previous work to be influ-
enced by earth materials, they were employed
throughout most of the investigation. Theyare propagated primarily by ground-wave
and by sky-wave. Ground-wave intensity at
a given distance from a transmitter, at these
frequencies, is relatively constant and prac-
tically all daytime propagation is possible
only by this means. Sky-wave fluctuates in
intensity almost continuously. Sky-wave
propagation, at broadcast frequencies, is op-
erative only at night, such propagation
during daytime being theoretically impos-
sible.8 Therefore, field intensity measure-
ments were restricted to daytime ground-
wave signals for the present study.
7 Terman, op. cit., pp. 708-709.8 Electronics Engineers of the Westinghouse Electric Cor-
poration, Industrial electronics reference book: New York,John Wiley, p. 337, 1948.
[9]
10 RADIO WAVE TRANSMISSION
Attenuation measurements on diamond
drill cores were made in the laboratory, but
laboratory conditions are so different from
those of the field that the measurements
were possibly only indicative of electromag-
netic conductivities of rock cores. Early
measurements in the field made with prim-
itive equipment suggested that certain radio
fields were influenced by specific geologic
features; later more elaborate instrumenta-
tion indicated in much greater detail the
influence of natural and cultural features
as well as geologic conditions. Many influ-
encing features other than geologic were
therefore investigated, and it was found
possible to recognize and to separate in some
instances the influence of geologic features
on radio field intensity.
OBJECTIVES
Striking similarity between a ground con-
ductivity map of the United States (fig. 41 )
,
published by the Federal Communications
Commission in 1938, 9 and the U. S. Geolog-
ical Survey geologic map of the United
States10 was the impetus for this investiga-
tion. A search for the explanation of this
similarity led to the study of irregular and
unpredictable radio reception.
The major objectives were to collect data
on field intensity of transmitted radio waves,
and to determine what influence geologic
conditions and earth materials have on field
strength. To attain these objectives, it was
necessary to develop suitable instrumenta-
tion and field techniques. Instruments were
needed that would be compact and portable,
yet rugged enough to withstand field opera-
tion, and that would give reliable continuous
measurements. Field techniques had to be
developed that would permit rapid and reli-
able field intensity measurements. Field
intensity anomalies caused by specific geo-
logic features needed to be examined to
ascertain if there were optimum frequencies,
powers, orientations, and distances that
would provide the strongest or most readily
identifiable signal anomaly.
9 FCC, Standards of good engineering practice, op. cit.,
pp. 33-34.10 Geologic map of the United States: U. S. Geol. Survey,
1932.
Before the influence of earth materials on
radio field strength could be determined, it
was necessary to be able to recognize other
factors that affect field strength. Therefore,
a secondary objective of the work became
the recognition of the other factors as
hazards. The following features and factors
were tentatively considered potential field
hazards
:
A. Cultural
1. Wire fences
2. Electric power, telephone, and
other transmission lines
3. Pipe lines
4. Bridges
5. Buildings and towers
6. Road materials (concrete, black-
top, gravel, and dirt)
7. Stability of power output at the
radio transmitter
B. Natural
1. Trees and other vegetation
2. Bodies of water—lakes, ponds,
and streams
3. Topography
C. Meteorological
1. Barometric pressure
2. Wind velocity and direction
3. Sunlight and cloudiness
4. Temperature
5. Humidity
6. Magnetic storms
7. Precipitation
8. Natural electromagnetic phenom-
ena
The following types of geologic conditions
were selected for investigation
:
1. Bedrock with faulting
2. Bedrock with folding
3. Cryptovolcanic structure
4. Variation in soil types
5. Variation in bedrock lithology
6. Variation in depth to uniform bedrock
7. Buried glacial drift-filled valleys
8. Ore deposits
This investigation was experimental, from
a geological point of view. It is hoped that
the data will contribute to a better practical
understanding, and to the eventual theoret-
ical understanding, of the phenomena in-
volved in anomalous radio reception.
INTRODUCTION Jl
SCOPE
Measuring and recording equipment was
tested experimentally to achieve satisfactory
instrumentation. Various methods of analysis
and presentation of the combined electro-
magnetic and geologic field data were tried
before a satisfactory system was worked out.
Several hundred miles of traverses were
selected along which radio field intensities
were measured and recorded. The traverses
were run mainly in Illinois, but to clarify
the picture, some were run in Kentucky,
Indiana, and Wisconsin.
A laboratory investigation of transmission
of radio signals through, or along, diamond
drill cores of different lithologies was made
in an attempt to determine the transmission
or attenuation behavior of the cores.
In the field, various man-made and
natural features were examined for their in-
fluence on radio field intensity. The value
and character of their influence depends on
their orientation with respect to the direction
of signal arrival and the point of measure-
ment, and on the frequency, power, and dis-
tance to the radio station being monitored.
With empirical data on the value and char-
acter of signal anomalies caused by these
features, it became possible to investigate and
evaluate the influence of geology on field in-
tensity. Traverses could then be run meas-
uring radio field intensities across areas of
known geology, both in the presence and
the absence of obvious natural and man-
made field hazards.
The present work sets forth experimental
data that illustrate many of the factors and
features affecting radio field intensity at
broadcast frequencies. The report evaluates
the use of field intensity measurements as an
aid in geologic exploration and offers a newconcept of the methods of transmission of
radio waves through earth materials.
ACKNOWLEDGMENTSThis work was part of a research investi-
gation program of the Division of Ground-
water Geology and Geophysical Exploration
of the Illinois Geological Survey. The writer
gratefully acknowledges the active interest
and support of the investigation by M. M.Leighton, Chief of the Survey.
For encouragement to undertake the
work, the writer is indebted to Carl A. Bays,
formerly Geologist and Engineer and Headof the Division of Groundwater Geology
and Geophysical Exploration of the Illinois
Geological Survey; Ernest P. Du Bois,
Geologist in the Coal Division, Illinois
Survey; Stewart Folk, former Associate
Geologist in the Oil and Gas Division of
the Illinois Survey; to Harold R. Wanless,
Professor of Geology at the University of
Illinois; to A. James Ebel, former Assistant
Professor of Electrical Engineering at the
University of Illinois; and to R. D. Car-
michael, Dean Emeritus of the Graduate
School of the University of Illinois.
For advice and guidance, the writer is
especially indebted to Carl A. Bays and H.R. Wanless, J. R. Sommers, Robert Floyd,
Stanley Snow, and Robert Mann, all elec-
trical engineers with Carl A. Bays and As-
sociates, Inc., aided with advice on instru-
ment operation and maintenance and in
interpretation of signal intensity anomalies
caused by or related to factors other than
geologic conditions.
Appreciation is also extended to M. B.
Buhle, R. D. Knodle, Jack Wolf, and Ben
Ellis, of the Illinois Geological Survey,
who drove many hundreds of miles on field
intensity traverses and assisted in instru-
ment maintenance and field operations.
CHAPTER 2— THEORETICAL CONCEPTS OF PROPAGATION
RADIO WAVES
Radio waves (electromagnetic waves)
are subject to the same laws as light waves
in regard to reflection, refraction, diffrac-
tion, polarization, interference, and speed of
propagation. A radio wave transmitted from
a nondirectional antenna at approximately
186,000 miles per second spreads out and
travels in all directions. There appear to
be two boundaries for this spreading wave,
the surface of the earth and some ionized
layers that are about 30 to 250 miles above
the earth's surface.
The behavior of the wave depends upon
its frequency. If the frequency is higher than
approximately 30 mc, the wave may pass
through the ionosphere and travel into space
beyond, while in the vicinity of the antenna
at the earth's surface, much of it will be
rapidly absorbed and attenuated by earth
materials. If the frequency of the wave is
lower than approximately 30 mc, it may be
reflected earthward by the ionosphere, while
in the vicinity of the antenna it will follow
the earth's surface for some distance before
becoming absorbed or attenuated by earth
materials.
The part of the wave that follows the
earth's surface is called surface or ground-
wave. The remainder of the wave is called
the sky-wave or space-wave. According to
Brainerd et al.:1
The ground wave is usually further subdividedinto a direct wave, a wave reflected from the
ground (of importance when the receiving an-
tenna is well above the ground) and a surface
or guided wave. The ground wave is usually re-
fracted in passing through the lower atmosphere,and this combined with the guiding effect whichexists (the earth may act as a wave guide some-what as one wire of a transmission line does)
tends to cause the ground wave to follow the
curvature of the earth when the frequency is not
too great. But the ground wave often suffers se-
vere attenuation, so that it cannot account for
long-distance transmission except at relatively-
low frequencies.
1 Brainerd, J. G., ed., Ultra-high-frequency techniques:
New York, D. Van Nostrand, pp. 436-437, 1946.
According to Laport: 2
In free space devoid of all substance, includ-ing air or gases, an electromagnetic wave is
propagated without any dissipation of its energy.The inverse relationship between field strength
and distance is due to the expansion of the wavein three dimensions and the distribution of radi-
ant energy over a larger and larger volume of
space, so that the power flow follows the inverse-
squares law with respect to distance.
However, ground-wave signal strength
measured in microvolts per meter at a dis-
tance from the antenna commonly differs
from that calculated from the inverse pro-
portion relationship. This is because the
earth's surface, or ground, is not a perfect
conductor but has resistance, or a finite con-
ductivity, so that some of the field strength
is absorbed or attenuated.
INFLUENCE OF EARTHMATERIALS
The influence of earth materials on radio
wave propagation and reception has been
recognized for many years. Theories have
been formulated to account for the kind and
amount of influence by earth materials, and
field observations have been conducted to
test these theories. Sommerfeld 3 considered
ground-wave propagation and arrived at an
empirical equation which expresses signal
intensity as a function of power, distance,
frequency, and earth conductivity. Byrne,4
and later Higgy and Shipley,5 made radio
transmission surveys in Ohio and found that
their measured field strengths agreed reason-
ably well with field strengths predicted from
Sommerfeld's equation.
2 Laport, Edmund A., Radio antenna engineering: NewYork, McGraw-Hill, p. 9, 1952.
3 Sommerfeld, A., The propagation of waves in wireless
telegraphy: Annual of Physik, vol. 4, no. 28, p. 665, March1909.
4 Byrne, J. F., Radio transmission characteristics of Ohioat broadcast frequencies: Ohio State Univ. Eng. Expt. Sta.
Bull. 71, July 1932.5 Higgy, R. C, and Shipley, E. D., Radio transmission
survey of Ohio: Ohio State Univ. Eng. Expt. Sta. Bull.
92, May 1936.
[12]
PROPAGATION 13
GROUND-WAVE AT BROADCASTFREQUENCIES
Broadcast frequencies range from 550 to
1600 kc. Sky-wave reception from broad-
cast stations is not usually possible in the
daytime, and as all measurements were taken
in the daytime, they were necessarily meas-
urements of the ground-wave. The normal
range of ground-wave reception is from
approximately 50 miles, at the higher fre-
quencies, to more than 400 miles at lower
frequencies.
Terman6cites the work of Howe, who,
assuming an average value for ground con-
ductivity, concludes that radio waves pene-
trate the earth's surface at least 20 feet at
10 mc and 45 feet at 1 mc. Therefore,
ground-wave signals at broadcast frequencies
and lower were used in the present investi-
gation.
WAVE-GUIDE TRANSMISSIONAND PROPAGATION
In addition to the ground-wave theory,
another method of propagation, not yet gen-
erally recognized as being particularly ap-
plicable at broadcast frequencies, is by
wave-guide. This theory is a generally ac-
cepted explanation for transmission through
hollow metal tubes at microwave frequen-
cies. Wave-guide transmission may be
thought of as transmission of electromagnetic
waves in a dielectric medium bounded by
one or more conducting planes. 7 Wave-guides, manufactured for use in ultra-high
frequency transmission, are usually rectan-
gular or circular in section. Propagation can
also take place in the Z direction (trans-
verse) between two roughly parallel planes
having finite conductivity.
The wave lengths of an electromagnetic
field that can be transmitted through a
wave-guide are limited by the physical di-
mensions of the wave-guide itself. When6 Terman, F. E., Radio engineers handbook: New York,
McGraw-Hill, 1st ed., p. 698, 1943.7 Sarbacher, R. I., and Edson, W. A., Hyper and ultra-
high frequency engineering: New York, John Wiley, 1947.Skilling, H. H., Fundamentals of electric waves: New
York, John Wiley, 2nd ed., 1948.Brainerd, op. cit., pp. 455-494.Ramo, Simon, and Whinnery, J. R., Fields and waves
in modern radio: New York, John Wiley, pp. 292-295, 1947.
wave lengths exceed the cut-off frequency
dimension of the wave-guide, the waves are
not transmitted along the guide. When the
wave lengths are smaller than the cut-off
frequency dimension of the wave-guide, the
waves may be transmitted by one of several
possible modes. Although much is knownabout the behavior and mechanics of guided
waves at higher frequencies, there are not
enough data to permit a description of the
behavior of guided waves at all frequencies.
Ramo and Whinnery8state:
For any given set of planes with arbitraryfixed spacing, there should be some frequenciesand some angles of reflection for which boundaryconditions could be satisfied by a wave having acomponent of propagation in the Z direction.
The wave-guide theory is applicable not
only at very high frequencies but also at
lower frequencies. At frequencies below a
few hundred kilocycles the ionosphere can
act as a good reflector of radio waves. 9
Since at these frequencies the earth is also
a good reflector, one can consider the surface
of the earth and the ionosphere as boundary
conductors of a large parallel-plane wave-guide having an air dielectric. Transmission
of low-frequency waves over large distances
(thousands of miles) is possible by this modeof propagation. If the earth is considered as
the floor of a wave-guide, the variable elec-
trical conductivity of the floor will cause
some energy to be attenuated, thereby caus-
ing a change in field intensity. Theoretically,
as the floor of the guide becomes lower in
conductivity or as the frequency decreases,
the wave penetrates deeper into the floor.
GEOLOGIC WAVE-GUIDES
Wave-guide propagation in bedrock strata
may take place under certain geologic con-
ditions. A wave-guiding system may be
thought of as a dielectric region between
two parallel conducting planes. In rocks, a
dry, poorly conducting rock stratum may be
considered as the more-or-less dielectric re-
gion. If the rock strata above and below this
dielectric region are porous and saturated
with electrolyte, or have low electrical re-
8 Ramo and Whinnery, op cit., p. 294.9 Jordan, E. C, Electromagnetic waves and radiating sys-
tems : New York, Prentice-Hall, p. 662, 1950.
14 RADIO WAVE TRANSMISSION
sistivities, as shales and clays, they could be
considered as parallel conducting planes.
Theoretically, in a wave-guide with the
parallel planes perfect conductors and with
an air dielectric, a uniform plane wave
should propagate between the planes in a Zdirection with a phase velocity equal to the
velocity of light and with no attenuation.10
In a geologic wave-guide, with poorly con-
ducting strata as the dielectric and good
10 Ramo and Whinnery, op. cit. 292.
conducting strata as the roughly parallel
planes, similar wave propagation may be
possible, but the waves would be subject to
much attenuation (from losses in the con-
ductors and dielectric), and the wave veloc-
ities would be lower.
Regardless of the concept of propagation,
whether by guided wave or the so-called
ground-wave, it is known that signal inten-
sity is affected measurably by the earth ma-
terials along the signal path.
CHAPTER 3— PREVIOUS WORK
There is only a limited amount of litera-
ture that deals directly with the relationship
between transmitted radio fields and geo-
logic conditions. However, there is consider-
able collateral literature, dealing more or
less indirectly with the subject, in the fields
of radio, electronics, communication and
propagation engineering, and physics.
Bailey et al.1 experimented with radio
wave propagation using a frequency of 60
kc. Horizontal antenna lengths ranged from
14,000 to 17,000 feet. The effects of differ-
ent earth materials beneath the antennas on
directional characteristics were recognized.
To the authors, variations in reception (and
propagation) characteristics, at least in part,
correlated with geologic formations, which
they illustrated with cross sections of the
rocks beneath their antennas.
Eve et al.2 attempted to demonstrate
penetration of rocks by radio waves in the
Mount Royal tunnel. Because the tunnel
was open at both ends and traversed by rail-
road tracks, their results were not considered
conclusive. However, their data suggested
that penetration is a function of frequency
and that the higher frequencies were attenu-
ated more than the lower frequencies. Sig-
nals at broadcast frequencies and lower were
detectable throughout the entire tunnel.
Eve et al.3 experimented with radio wave
penetration of rocks in Mammoth Cave,
Kentucky. This site was selected as the test-
ing place because of its miles of underground
passageways and rooms which contained no
railroad tracks, wires, or other metallic con-
ductors. Using various types of receiving an-
tennas, signals from the surface at broadcast
frequencies and lower were detected 150-
1 Bailey, A., Dean, S. W., and Wintringham, W. T., Thereceiving system for long-wave transatlantic radio telephony:Proc. Inst. Radio Eng., vol. 16, no. 12, pp. 1645-1705, De-cember 1928.
2 Eve, A. S., Steel, W. A., Olive, G. W., McEwan, A. R.,and Thompson, J. H., Reception experiments in Mount Royaltunnel: Proc. Inst. Radio Eng., vol. 17, no. 2, pp. 347-376,February 1929.
3 Eve, A. S., Keys, D. A., and Lee, F. W., The penetra-tion of rock by electromagnetic waves and audio frequencies
:
Proc. Inst. Radio Eng., vol. 17, no. 11, pp. 2072-2074, No-vember 1929. Also, U. S. Bureau of Mines Tech. Paper 434,pp. 37-40, 1928.
350 feet below the surface. The overburden
is composed of limestone and sandstone.
Using an audio frequency of 500 cycles,
signals were detected through 900 feet of
rocks, suggesting again the increase in
depth of penetration with decrease in fre-
quency.
Volker Fritsch4 has written extensively on
the influence of underground geology on
transmitted radio fields. He has described
and illustrated numerous geologic conditions
that improve signal reception and others
that weaken or prevent it entirely. He dem-
onstrated that radio signals at various fre-
quencies can be detected in tunnels andmines, and cites experiments by Lowy, whodetected 700 meter signals at a depth of
1000 meters. Underground in mines at Kot-
terbach, using frequencies of 300 meters
(1000 kc) or greater, Fritsch correlated
signal strength values with fractures, dip
and strike of formations, and ore bodies.
In a coal mine at Grunbach, situated in
a synclinal structure, Fritsch found recep-
tion very poor. In a mine at Ostrau (Mo-ravia), reception from surface stations waspossible at depths of 400-500 meters because
of the presence of a good geologic conductor
which dips steeply (or vertically). Frac-
tures, ore bodies, or other geologic struc-
tures (conductors) favor reception if they
4 These articles by Volker Fritsch were translated and ab-stracted by Professor Ernst Cloos from inaccessible Germanpapers for the Geological Society of America:
Eineges iiber die Grundlagen der Funkmutung: Montan.Rundschau. Jahrg. 26, no. 4, pp. 1-6, 1934.
Beitrage zur Radiogeologie: Beitr. angew. Geophysik., Bd.5, H. 3, pp. 315-364, 1935.
Beitrage zu den Beziehungen swischen AusbreitungHertz'scher Wellen und geologischer Beschaffenheit desUntergrundes (Funkgeologie). Grundlagen und Anwendungder Kapazitatsmethode: Beitr. angew. Geophysik. Bd. 5,
H. 4, pp. 375-379, 1936; Bd. 6, H. 1, pp. 100-119, 1936.Beitrage zur Funkgeologie, III. Einiges iiber die Ausbrei-
tung Hertz'scher Felder in Gebirgen : Beitr. angew. Geo-physik., Bd. 6, H. 3, pp. 277-306, 1937.
Beitrage zur Funkgeologie, IV. Darstellung der Eingen-schaften geologischer Leiter: Beitr. angew. Geophysik., Bd.6, H. 4, pp. 407-412, 1937.
Beitrage zur Funkgeologie, VII. Einiges iiber die Ausbrei-tung elektromagnetischer Wellen in Bergwerkschacten undStollen: Beitr. angew. Geophysik., Bd. 7, H. 4, pp. 449-461,1939.Die funkgeologische JJntersuchung des Zinnobervorkom-
mens von Schonbach bei Eger (Sudetenland) : Neues Jahrb.f. Geol. B., Vol. 84, H. 1, pp. 90-116, 1940.
Messverfahren der Funkmutung: Munich, R. Oldenbourg,1943.
[15]
16 RADIO WAVE TRANSMISSION
connect the receiver with the surface.
Fritsch believes that changes in field inten-
sities can be predicted over an area of knowngeologic conditions and, also, that observed
changes in field intensities may lead to the
discovery of unknown geologic conditions.
Felegy and Coggeshall, 5 investigating the
applicability of radio for emergency mine
communications, successfully transmitted
and received radio signals to and from the
surface through intervening rocks. Ampli-
tude-modulated radio transmission with
voice modulation was used at frequencies
from 33 to 220 kc running from 2-3 watts
transmitter output power. Continuous two-
way communication via rock strata (400
feet of sandstone, 150 feet of conglomerate,
30 feet of slate and clay, and a thin layer
of surface soil) was maintained at the Re-
liance Colliery, Mt. Carmel, Pennsylvania,
at distances up to 1050 feet, and intermittent
communication was possible up to 2040 feet.
The above authors refer to the work of
Wadley, 6 who claims to have transmitted
signals through 5000-6000 feet of quartzite,
using 500-foot linear antennas that touched
nothing but air, both underground and at
the surface. He used code signals from a 10
watt transmitter on frequencies between 100
and 300 kc.
Ernst Cloos 7 published what is probably
the first geological report in this country
which recognizes definite geologic influence
on behavior of field strength. Using crude
equipment, he was able to map faults and
steeply dipping contacts between different
kinds of rocks in the Baltimore area by an
audible decrease in signal strength or com-
plete absence of signal near or over these
features. Best results were obtained whenusing a 250-watt broadcast station on a fre-
quency of 600 kc. He concluded that in an
area of known geologic conditions, with
recognition of intensity disturbances caused
by overhead wires, railroad tracks, road
5 Felegy, E. W., and Coggeshall, E. J., Applicability of
radio to emergency mine communications: U. S. Bureau of
Mines Rept. Inv. 4294, May 1948.6 Wadley, T. L. (Underground communication by radio in
gold mines on the Witwatersrand). Suid-Afrikaanse Weten-skaplike En Nywerheidnavorsingsraad : TelekommunikasiesNavorsinglaboratorium, Johannesburg, South Africa, T.R.L.3, Nov. 1946.
7 Cloos, Ernst, Auto-radio—an aid in geologic mapping:Am. Jour. Sci., ser. 5, vol. 28, pp. 255-268. 1934.
cuts, and the like, if the remaining inten-
sity anomalies could be repeated over a peri-
od of days, months, and years, they could be
definitely correlated with the geologic con-
ditions.i
Spieker 8 recognized a strong correlation
between a radio transmission map of Ohio9
and the geologic map. The radio trans-
mission investigation was made to determine
the most economical and efficient communi-
cations system that could be set up for use
by the Ohio State Highway Patrol. On the
radio transmission map the state was divided
into zones classified as to effectiveness of
transmission. Spieker observed that the area
of best transmission was underlain generally
by Ordovician, Silurian, and Devonian lime-
stones; the second best area by Devonian
and Mississippian shales; the third by Penn-
sylvanian and Permian rocks of varied li-
thology but with considerable sandstone ; the
fourth and poorest area by thick Pleistocene
deposits.
From these observations Spieker con-
cludes: 10
The generalization is obvious that radio trans-
mission is affected by the texture of the rock im-mediately beneath the surface ; tight, solid rock
affords the best conditions and loose, open-tex-
tured materials the worst. This is supported bythe fact that the values fall off notably as exist-
ing river channels are crossed, due perhaps in
part to the topographic deflection, but probablyalso to the alluvium in the valleys.
Barret 11 was granted a United States
patent wherein he claims the ability to make
use of electromagnetic waves for acquiring
useful subsurface geologic information. Hedescribes suitable apparatus and techniques
for determining the location and character
of hidden geologic faults, for locating and
defining buried masses such as salt domes
and igneous plugs, and for locating and de-
fining electrical discontinuities in buried
strata.
s Spieker, F. M., Radio transmission and geology: Bull.
Am. Assoc. Petr. Geol., vol. 20, no. 8, pp. 1123-1124,
August 1936.9 Higgy, R. C, and Shipley, E. D., Radio transmission
survey of Ohio: Ohio State Univ. Eng. Expt. Sta. Bull. 92,
May 1936.10 Spieker, op. cit., p 1124.11 Barret, W. M., Electrical apparatus and method for geo-
logical studies: U. S. Patent 2,172,688, 1939.
PREVIOUS WORK 17
More recently, Barret12 conducted a dem-
onstration before a group of geophysicists,
geologists, and other technical men to prove
that radio waves may be transmitted to
depth in the earth. The site was at the
Morton Salt Company's Kleer mine at
Grand Saline, Texas, where signals were
received underground on a frequency of
1602 kc from a transmitter on the surface
1200 feet away. Electric and telephone lines
were cut and grounded at the top and bot-
tom of the shaft, and pipes and the like
were also grounded. The receiver was lo-
cated in an abandoned part of the mine
which was free from metal and separated
from the shaft by 1800 feet of circuitous
tunnels. Code signals from the portable
transmitter at the surface apparently trav-
eled through some 700 feet of sedimentary
rocks before they were picked up by the
receiver.
Howell 13 conducted field intensity investi-
gations in faulted areas of California and
New Jersey. He found that a decrease in
intensity occurred above some faults in addi-
tion to a possible change in the direction of
the field. He observed, like Cloos, that rel-
atively weak electromagnetic fields seem to
be more strongly influenced by geologic con-
ditions than strong fields.
Blackburn14 investigated field intensity
variations in areas of known geologic con-
ditions and concluded that field variations
reflect geologic conditions. He claims to have
used his "radiographic" method in commer-
cial work in the United States and Canada.
He ran continuous traverses and recorded
field measurements on a graphic recorder of
the Esterline-Angus type.
Kerwin, 15at Massachusetts Institute of
Technology, reviewed the literature and
concluded that geologic mapping based on
observation of field intensity variations
should be practical. Supported by a grant
12 Barret, W. M., Salt mine test proves earth penetrationby radio waves: World Petroleum, vol. 20, no. 3, pp. 62-63,March 1949.
13 Howell, B. F., Jr., Some effects of geologic structure onradio reception: Geophysics, vol. 8, no. 2, pp. 165-176, April1943.
14 Blackburn, M. S., Radiographic method of geophysicalexploration: World Oil, vol. 126, no. 11, August 11, 1947.
15 Kerwin, Larkin, Use of the broadcast band in geologicmapping: Jour. Applied Physics, vol. 18, no. 4, pp. 407-413,April 1947.
from the Geological Society of America, he
designed suitable field equipment and con-
ducted several successful preliminary investi-
gations of known geologic situations. Hemade continuous surveys and recorded the
measurements graphically. He found that
field intensity decreased over a basic dike
with an electrical resistivity lower than that
of the surrounding conglomerate, but in-
creased over a dike with a resistivity higher
than that of the surrounding rocks.
Mcllwain and Wheeler16 presented a
paper at the technical session of the 1948
National Convention of the Institute of
Radio Engineers which is available only in
abstract form.
A theoretical and experimental study of the
propagation of radio waves through ground hasresolved certain inconsistencies in prior work.Tests covered depths to several hundred feet andfrequencies from 0.6 to 1.000 mc. As expected, dryground is better than wet. At lower frequencies,
ground behaves as a homogeneous, poorly con-
ducting medium ; at the higher, the rate of at-
tenuation increases much more rapidly, indicat-
ing pockets of moisture separated by dry ground.A special technique has been used to test the
horizontal propagation through substrata, whichis especially useful to detect and trace dry layers,
sandwiched between wet layers. The results showthe limitations of radio waves for deep geophys-ical prospecting, though they may be useful for
related exploration.
Haycock, Madsen, and Hurst17investi-
gated propagation characteristics of electro-
magnetic waves in earth and through rocks,
to evaluate the possibility of using radar
methods and techniques to determine geo-
logic discontinuities within the earth.
Velocity, attenuation, and frequency of
electromagnetic waves in earth materials
were measured experimentally in the field.
From standing wave measurements, the
wave length and velocity of propagation in
the earth materials used were calculated to
be about one-tenth of that in the air. At-
tenuation measurements made with trans-
mission lines and antennas buried in soil
indicated 7.5 db per 100 feet at 350 kc, 11.7
db per 100 feet at 600 kc, and about 62 db
per 100 feet at 5 mc. The authors success-
10 Mcllwain, Knox, and Wheeler, H. A., The propagationof radio waves through the ground: Proc. Inst. Radio Eng.,vol. 36, no. 3, p. 377, March 1948.
17 Haycock, O. C, Madsen, E. C, and Hurst, S. R.,
Propagation of electromagnetic waves in earth : Geophysics,vol. 14, no. 2, pp. 162-171, April 1949.
18 RADIO WAVE TRANSMISSION
fully demonstrated penetration of 400 feet
of overburden by radio waves in mine-tunnel
tests; frequencies between 300 and 1000 kc
are apparently best suited for such through-
the-earth propagation.
The authors conclude that, because of the
apparent short propagation distances possible
in earth materials as compared with the far
greater distances possible in radar work, and
because of directional antenna limitations
at frequencies between 300 and 1000 kc,
radar techniques for location of under-
ground discontinuities appear to be inade-
quate.
It seems apparent, from a review of
previous work, that there is some relation-
ship between observed variation in field in-
tensity and surface and subsurface geologic
conditions. There is, however, a wide di-
vergence of opinion as to the exact nature
of the relationship and of the mechanics
and phenomena involved. And there has
been no systematic investigation described,
and no extensive treatment of the subject,
from the geological point of view.
CHAPTER 4— EQUIPMENT FOR RADIO FIELD
INTENSITY MEASUREMENTS
PREVIOUS WORK
Instrumentation for measurement of sig-
nal intensity progressed from the simple
scheme of Cloos, 1 who used a 1933 Majestic
automobile radio and loud speaker, to the
more elaborate equipment of Kerwin, 2 whoused a radio direction finder with a shielded
loop antenna. Kerwin measured signal
strength in the intermediate frequency
(I.F.) stage of his receiver with a Vomaxvacuum-tube volt-meter and recorded it on
an Esterline-Angus continuous recording
milliammeter.
Felegy and Coggeshall 3 used conventional
6-tube amplitude modulation superhetero-
dyne receivers with a frequency coverage
from 80-175 kc in one band. Their trans-
mitters had two stages (oscillator and ampli-
fier), were amplitude-modulated, and had
a power output of 2-4 watts, depending upon
the impedance match obtained between the
transmitters and the radiating material.
Howell 4 operated at broadcast frequencies
using a portable direction finder with loop
antennas for determining direction of signal
arrival, and a portable field strength meter
(a tuned radio-frequency receiver with a
nondirectional antenna) for determining
variations in field intensity.
Blackburn 5 used a small Hallicrafter com-
munications receiver at broadcast frequen-
cies and recorded signal strength continuous-
ly with an Esterline-Angus recorder actuat-
ed by a speedometer cable drive.
1 Cloos, Ernst, Auto-radio—an aid in geologic mapping:Am. Jour. Sci., ser. 5, vol. 28, pp. 255-268, 1934.
2 Kerwin, Larkin, Use of the broadcast band in geologicmapping: Jour. Applied Physics, vol. 18, no. 4, pp. 407-413April 1947.
3 Felegy, E. W., and Coggeshall, E. J., Applicability ofradio to emergency mine communications: U. S. Bureau ofMines Rept. Inv. 4294, May 1948.
4 Howell, B. F., Jr., Some effects of geologic structure onradio reception: Geophysics, vol. 8, no. 2, pp. 165-176, April1943.
6 Blackburn, M. S., Radiographic method of geophysicalexploration: World Oil, vol. 126, no. 11, August 11, 1947.
PRESENT WORK
Several systems of measuring signal
strength were used early in the present
work. These included equipment loaned by
the University of Illinois broadcast station,
WILL, and field intensity meters construct-
ed in the Illinois Geological Survey labora-
tory.
Instrumentation for Reconnaissance
Investigation
The field intensity contour map (fig. 1)
was made from measurements taken with an
Illinois Survey laboratory-constructed field
intensity meter designed for use in conjunc-
tion with automobile and battery-portable
radio receivers (fig. 2). The Dixmoor water
well (see fig. 1), owned by the village of
Homewood, Illinois, produces water from
porous Niagaran reef rock at depths from
92-104 feet and a crevice zone from 195-201
feet, as indicated by a geophysical log of the
hole. The village needed a larger water sup-
ply and started a test hole approximately
one mile west of the Dixmoor well hoping
to encounter water-bearing reef rock. Thefield intensity traverse was run as the well
was being drilled, to ascertain if such a sur-
vey, in advance of drilling, might not indi-
cate the areal extent of the reef. Intensity
values in the vicinity of the Dixmoor well
are between 20 and 30 microamperes. It is
possible that the area with values of 40
microamperes and less indicates part of the
areal extent of the reef because reef rock
was encountered in the test hole. The areas
to the south and west have vastly different
intensity values, perhaps indicative of strata
other than reef rock. The entire area wasresurveyed two weeks after the initial sur-
vey, using different equipment, but of the
same type, and signal values were essentially
duplicated.
[19]
20 RADIO WAVE TRANSMISSION
WJOB 1230 kc
250 w,l5mi.
T. 36 N.
R. 13, 14 E.
ILLINOIS STATE GEOLOGICAL SURVEY
FIG. .—Field intensity contour map near Homewood, Illinois (based on spot readings with auto-
radio intensity meter).
The validity of intensity measurements
made with this type of equipment is condi-
tioned by spot readings, field hazards, the
personal element in tuning in a signal for
maximum intensity, reading and recording
the value, and the height of the receiving
antenna above the earth's surface. However,
in spite of the opportunity for error, inten-
sity measurements with this equipment
showed anomalies where they might be ex-
pected, many of which were supported later
through rechecks employing more elaborate
instruments.
Instrumentation for DetailedInvestigation
The chief component of the ultimate in-
strumentation used in the present work is
the commercial field intensity meter, type
308-B, built by the Radio Corporation of
America. This instrument is shock-mounted
on aircraft-type Lord mounts on a small
table fastened to the wooden floor of a
wooden-bodied station wagon (figs. 3 and
4). The 308-B is a compact, fairly rugged
precision instrument, easy to operate, and it
covers a frequency range from 120 kc to 18
mc in six bands using three separate rotat-
able shielded loop antennas.
The power supply for the 308-B meter is
an RCA-type 93-A vibrator unit with a
nonspillable 6-volt storage battery, and a
shielded cable for carrying voltage to the
meter. This unit is fastened to the floor be-
neath the table. An auxiliary 6-volt storage
battery is connected in parallel with that
of the 93-A battery to prolong battery life
and permit longer intervals of operation.
The recorder, an Esterline-Angus model
A.W. with a 10-milliampere movement, is
similarly shock-mounted on a small table
fastened to the floor of the vehicle (fig. 4).
A glass pen traces the field intensity record
on a paper chart driven past it at a constant
speed (one of several speeds available from
a spring-drive mechanism). However, on
traverses, the chart is actuated by a Clark
recorder drive, model 102-A (fig. 4). Thecomplete Clark recorder equipment includes
a recorder drive, a speedometer tee for tying-
in to the car speedometer, and intercon-
necting flexible drive cables. With this ar-
rangement, the vertical scale of the chart is
directly proportional to the mileage of the
traverse as registered on the car speedometer.
In addition to the signal intensity recording
pen of the recorder, there are two side-mark-
ing chronograph pens.
EQUIPMENT 21
Xl
1*1
<• COIL &
TO PLATE OF LAST IF. TUBE
INED—L
„ 2 MEG.
TO RCVR. IF FREQ. *
ILLINOIS STATE GEOLOGICAL SURVEY r1.4V. _45V. *45V
Fig. 2.—Circuit of field intensity meter designed for use with automobile and battery portable radios.
Fig. 3.—Wooden-bodied station wagon with permanently mounted radio field intensity measuringequipment.
22 RADIO WAVE TRANSMISSION
pIG . 4_Operator in working position. The 308-B field intensity meter (center) ;Esterline-Angus
recorder and Clark speedometer drive (left).
Instrumentation for reliable continuous
measurement of field intensity, automatic-
ally recorded, is essential in undertaking a
comprehensive investigation of the influence
of earth materials on radio wave transmis-
sion. These conditions are adequately met
with the RCA 308-B field intensity meter,
the Esterline-Angus recorder, and the Clark
speedometer-actuated recorder drive.
Instrumentation in MobileOperation
The instruments were permanently
mounted in an International station wagon
with a wooden body. This vehicle was
chosen on the basis of tests in which measure-
ments were taken from inside the vehicle,
from the tailgate of the vehicle, and from
10 to 50 feet away from the vehicle. The
measurements indicated differences insuffi-
cient to warrant their being taken from
outside the vehicle. Dewitt and Omberg6
6 Dewitt, J. H., Jr., and Omberg, A. C, The relation of
the carrying car to the accuracy of portable field intensity
measuring equipment: Proc. Inst. Radio Eng., vol. 27, no.
1, pp. 1-4, January 1939.
investigated the accuracy of portable meas-
uring equipment and found that radio fre-
quency fields are distorted in the vicinity
of metal-bodied cars due to a secondary field
resulting from eddy currents. They found
that the wooden-bodied station wagon is
almost completely free from field distortion.
Instrumentation and Investigation
in the Laboratory
There has been comparatively little lab-
oratory investigation on the behavior of elec-
tromagnetic waves in rocks. This may be
due in part to the apparent lack of economic
application and to the difficulty of simulat-
ing field conditions. Wheeler7 made some
laboratory investigations on the dielectric
constant and the A.C. and D.C. conduc-
tivity of oil sands. His instrumentation con-
sisted of a radio frequency generator, a radio
frequency bridge, and a communications-
type receiver. Frequencies employed ranged
from 1 to 30 mc. Although his results were
7 Wheeler, R. T., The dielectric properties of oil sands
:
Petr. Engineer, vol. 19, no. 9, pp. 141-154, June 1948.
EQUIPMENT 23
far from complete, he concluded that the
dielectric constant decreases rapidly with
increase in frequency above 1 mc, and salt
water in a sand is the chief factor in rais-
ing its dielectric constant.
At the Illinois Geological Survey labora-
tory, diamond drill cores were used in radio
wave attenuation tests at frequencies rang-
ing from 100 kc to 18 mc. Radio signals
were transmitted through, or along, dia-
mond drill cores of different lithologies to
investigate the attenuation of signals trans-
mitted through rocks.
The rock cores were used as transmis-
sion lines connecting a signal generator with
a field intensity measuring receiver. Curves
were drawn for the transmission ability of
each core for frequencies between 100 kc
and 18 mc. For control, transmission curves
were drawn for air path and for direct
coaxial connection between transmitter and
receiver for the same range of frequencies.
The results indicated that for certain fre-
quencies all cores tested behaved as trans-
mission lines yielding field intensities be-
tween those obtained with direct connection
and with air path. Admittedly, laboratory
conditions differ considerably from those in
the field ; thus the measurements, while
possibly indicative of electromagnetic trans-
mission in rocks, were not conclusive.
CHAPTER 5— RADIO FIELD INTENSITY MEASUREMENT
FIELD INTENSITY AND LOOPORIENTATION
Signal intensities were measured in the
field. Relative field intensity was measured,
rather than actual field intensity, in micro-
volts per meter. The chief interest is in sig-
nificant changes of intensity ; actual intensity
values were rarely measured because they
require considerable additional instrument
calibration and manipulation which slows
the speed of the surveys.
The shielded loop antenna of the 308-B
meter is bidirectional. There are two places,
180 degrees apart through the complete
360 degrees of rotation, where signal in-
tensity is at its maximum ; also two places,
180 degrees apart, where signal intensity
is at a null, at a minimum, or absent. Mostof the several hundred miles of recorded
traverses were run keeping the loop man-
ually oriented in the direction of maxi-
mum signal intensity. This is not difficult
to accomplish on straight roads following
section or fractional section lines, but re-
quires more attention on winding roads,
especially in hilly terrain where a reference
point on the horizon is difficult to maintain.
Maximum signal intensity is indicated by
the highest reading obtainable on the D.C.
milliammeter of the 308-B meter. As the
loop is rotated away from maximum signal
orientation, there is a decrease in the D.C.
milliampere readings.
FIELD INTENSITY RECORDS
Field intensity values, indicated by the
D.C. milliammeter of the 308-B, were auto-
matically recorded on the paper chart of the
Esterline-Angus graphic recorder (fig. 4).
Signal intensity is recorded on the chart as
the chart is driven past the main recording
pen (figs. 5 and 6). In addition to the main
recording pen, there are two chronograph
or marking pens on the Esterline-Angus.
They are located near the right and left
margins of the chart, are 6-volt D.C.
solenoid-actuated, and manually controlled
from switches under the front edge of the
recorder table (fig. 4). The pens trace
vertical lines parallel to the chart margins,
but, when actuated, they mark a short line
normal to the vertical trace. The pen at
the right was used to ink marks to corre-
spond with map reference points along a
traverse. In figure 5, these marks, labeled
distance mark, bear the same number (map
reference station number) as numbered
points one-half mile apart on a geographic
base map. The pen at the left was used to
ink marks to correspond with field strength
anomalies caused by a readily identifiable
field hazard, such as an overhead wire, a
railroad track, or a bridge. The dashed
lines connect points on the curve (signal
strength anomalies) with their respective
solenoid pen marks.
When the marking pens are not used, the
map reference points are indicated on the
chart by the main recording pen in the
form of an arc (fig. 6), by momentarily
turning the selector switch of the 308-B to
a calibrate position. The readily identifi-
able signal strength anomalies are indicated
on the chart with an X or a check mark,
and labeled stream, bridge, oh for over-
head wire, etc. (fig. 6). The telephone
and electric wire conditions are noted on
the left margin of the chart. This method
of indicating identifiable signal strength
anomalies, wire conditions, and map ref-
erence points on the chart is faster and
possibly more accurate than the solenoid
marking-pen method, and is now employed
wherever roads are not too rough.
GROUND-WAVE VERSUSSKY-WAVE SIGNALS
The Federal Communications Commission
specified that in the broadcast band (550 to
1600 kc), primary service area means the
area in which the ground-wave is not sub-
[24]
MEASUREMENT 25
S,GN*L INTENSITY INCRE
ILLINOIS STATE OEOLOOICAL SURVEY
*&
Fig. 5.—Signal intensity record (taken from a
chart recorded in the field) showing signal in-
tensity curve, distance marks, map reference
station numbers, and readily identifiable signal
strength anomalies.
ject to objectionable interference or objec-
tionable fading. 1 Westinghouse engineers2
describe ground-wave as follows:
In the broadcast band, there is virtually nosky-wave propagation in the daytime. Therefore,
primary coverage is determined by power, fre-
quency, and ground constants.
At night the ionosphere contributes to sky-wavepropagation. If the radiating system radiates
an appreciable amount of energy at high angles
measured from the ground, the sky-wave is
reflected by the ionosphere into a region havingappreciable ground-wave coverage. There it
adds with its characteristic varying and uncer-
tain phase position to the ground-wave produc-ing fading. The sky-wave produces secondarycoverage beyond the fading region, but it is
relatively unreliable.
Ground-wave propagation is good at the low-
1 F. C. C. Rules and Regulations, Rules governing stand-ard broadcast stations: Section 3.11, Rules in force as of
March 1, 1940: U. S. Gcrvt. Printing Office, Washington,D.C.. 1940.
2 Electronics Engineers of the Westinghouse Electric Cor-poration, Industrial electronics reference book: New York,John Wiley, p. 337, 1948.
*'•"«« WTEHS.TY .HC******ILLINOIS STATE SEOLOSICAL SURVEY
Fig. 6.—Signal intensity record (taken from a
chart recorded in the field) showing signal in-
tensity curve, distance, map reference station
numbers, readily identifiable signal strength
anomalies, and wire conditions, (oh stands for
overhead wire, x indicates its position on the
curve.)
frequency end of the broadcast band but dete-
riorates near the high-frequency end of the
band. . . .
During the day coverage is completely byground-wave. At night a region of ground-wavecoverage is surrounded by a fading zone or at
least a zone of inadequate signal. The fadingzone is surrounded by a ring of sky-wavecoverage.
Signal intensity records of sky-wave prop-
agation illustrate the characteristic fading
and variance of signal level. An illustra-
tive record (fig. 7) was made with the
308-B equipment at a fixed location, be-
tween 9 p.m. and 1 a.m. local time. Signal
intensity records were made in the daytime
of ground-wave propagation with the 308-B
equipment at a fixed location (fig. 8 is illus-
trative of ground-wave field strength).
26 RADIO WAVE TRANSMISSION
ILLINOIS STATE GEOLOGICAL SURVEY
Fic. 7.—Four-hour record of WLW (Cincinnati,
Ohio) 700 kc, 50,000 watts—illustrating sky-
wave signal intensity fluctuation, recorded at a
fixed location in Urbana, Illinois, 200 miles fromCincinnati.
These curves illustrate the remarkably con-
stant signal intensity usually encountered in
ground-wave propagation within the pri-
mary coverage area.
CONSTANCY OF GROUND-WAVEINTENSITY
The validity of the premise that influenc-
ing features cause varying signal intensity
depends upon the assumption that the signal
being measured is fluctuating very little in
strength at its site of emanation. Federal
Communications rules and regulations speci-
fy that each station shall be operated at all
times as near to the authorized power as
practicable. The operating power tolerance
may be permitted to vary from 5 percent
above to 10 percent below the authorized
power for short periods. 3 The preceding
3 Standards of good engineering practice concerning stand-ard broadcast stations 550-1600 kc. : Federal Communi-cations Commission, U. S. Govt. Printing Office, Washington,D.C., p. 51, 1940.
Fig. 8.—Record of WGN, 720 kc, 50,000 watts-illustrating ground-wave signal intensity, re-
corded at a fixed location in Urbana, Illinois,
130 miles from Chicago.
assumption was verified by many signal in-
tensity measurements. Signal intensity was
recorded, from a fixed location, for time
intervals ranging from 5 minutes to 12
hours. The ground-wave intensity curves
show slight changes during short intervals
and somewhat larger changes over longer
intervals. The variations in signal intensity
as transmitted, for the stations monitored,
are negligible in comparison with variations
caused by influencing factors in the field.
Thus it appears that an electromagnetic
field radiating from a modern broadcasting
station is sufficiently constant in intensity,
in the ground-wave area, that significant
MEASUREMENT 27
changes can be attributed to factors other
than fluctuation at the transmitter. This
was borne out by repeated runs over the
same traverse, the field chart record being
essentially duplicated on runs made weeks,
months, and years apart. If the signal
strength varied significantly at the transmit-
ter, measured intensity curves over a trav-
erse at various time intervals would not
be reproducible.
Modulation Effect
With some types of field intensity meters,
signal intensity fluctuates with the modu-
lation of the carrier signal. Modulation
varies with the type of program being trans-
mitted. A symphony orchestra or singer
running the gamut of tone, pitch, and vol-
ume causes more irregular modulation levels
than do the more quiet programs. Themodulation effect is commonly most evi-
dent when monitoring a station at a very
short distance. In such instances a signal
with little modulation effect should be
selected.
The modulation effect appeared occasion-
ally using the reconnaissance-type field in-
tensity meter (fig. 2) in conjunction with
battery-portable and automobile radios.
Kerwin describes modulation effect in con-
nection with field intensity surveys in
Massachusetts. 4
One of the disadvantages of using the broad-cast band with the present equipment here be-
came apparent. The modulating voltage hadsome effect on the instantaneous readings, al-
though not the average. Therefore readingsextending over some period of time were neces-
sary to obtain accurate values. The type of
program being broadcast also has an effect as
the modulation of musical programs is muchsmoother than those of the "soap-opera" type,
and gave records which were much easier to
interpret.
Fortunately, the RCA 308-B field in-
tensity meter is essentially free from the
modulation effect. All recorded signal in-
tensity curves made with the 308-B can be
4 Kerwin, Larkin, Use of the broadcast band in geologic
Fig. 15.—Natural and cultural features alongline of traverse (Area II, 5 miles west of Gib-
son City, Illinois).
the entire traverse. A slight decrease in
intensity was observed at the north end of
the traverse at the fenced-in farmyard. Thedecrease may have been caused by the
additional fence or by a metal windmill
tower at the east side of the road.
The effects of the fences on the east
are slight. A fairly consistent, but small, de-
crease in intensity was recorded near a fence
on the east where another fence (oriented
east-west) met it at right angles. It is pos-
sible that these decreases may have resulted
from reradiation by the fences in some out-
of-phase relationship, or that the wire fence
configuration was such that it absorbed or
otherwise attenuated part of the radiated
field.
Description of Area III
In Area III, five miles southwest of
Champaign-Urbana, Illinois (fig. 16), a
one-mile traverse was run across 45 feet of
topographic relief. Signals from 11 broad-
cast stations were measured while running
the traverse across the area. Signal arrival
directions were roughly north, east, south,
and west. Signal frequencies ranged from
580 to 1580 kc, distances from 4 to 140
miles, and powers from 250 to 50,000 watts.
The line of traverse followed a secondary
gravel road across the ground moraine about
four miles west of the Champaign reces-
CULTURAL AND NATURAL FEATURES 33
sional moraine. 3 Drift thickness ranges
from approximately 230 to 280 feet depend-
ing upon ground elevation. The underlying
bedrock surface is fairly uniform and lies
approximately 475 to 500 feet above sea
level.4 The beds are Tradewater in age
and probably of uniform sedimentary cyclic
lithology. Here they lie about two miles
west of the local crest of the LaSalle anti-
cline and probably dip gently to the west.
The eleven runs along this traverse were
made from west to east along a secondary
gravel road. Twelve different fence sys-
tems were encountered along the traverse.
No one fence ran the entire length of the
traverse. There were short east-west fences
parallel to the traverse ; some north-south
fences joined the east-west fences; some
north-south fences ended at the line of trav-
erse without meeting or joining any of
those oriented east-west. The fences were
two-, three-, and four-strand barbed wire
on both metal and wooden poles.
Wire fence effects on field intensity were
either slight or nonexistent for the eleven
traverse runs. The slight effects were not
consistent for the various signals measured.
For all practical purposes of radio field in-
tensity investigation, except in rare and spe-
cial instances, effects of wire fence can gen-
erally be ignored in Illinois.
3 Leighton, Ekblaw, and Horberg, op. cit.
4 Horberg, Leland, op. cit., pi. 2.
OVERHEAD WIRES
The effects of an overhead telephone wire
were reported in the discussion of Area I
and the effects of both telephone and elec-
tric wires were observed in field measure-
ments in Area III (fig. 16). These wires
in Area III crossed the line of traverse at
right angles at both the east and west ends.
The field strengths of the eleven signals
measured decreased beneath the north-south
electric and telephone wires. Signals arriv-
ing from the north and south underwent the
greatest attenuation; signals from the east
and west the least.
GROUNDED ELECTRIC SERVICEPOLES
A special type of signal intensity anomaly
is illustrated by figure 17. The traverse wasrun from west to east, starting 2Vi miles
east of Harrisburg, Illinois, along State
Highway 13. REA electric service wires on
poles parallel the road along the west half
of the traverse; along the east half there
were no wires of any kind. The series of
peaks (intensity increase and decrease)
which make up the curve for the west half
is caused by the grounding of every other
or every third REA pole. Grounding of
certain poles is a common practice. Themaximum intensity peaks occur opposite the
ungrounded poles, the minimum peaks op-
posite the grounded poles.
Map reference
station number 703
Wire fence
2 strand
telephone wire
-Road
\2 strand electri
REA. line
Topographic profile
Vertical exaggeration 16.4
ILLINOIS STATE GEOLOGICAL SURVEY
Scale
1/2 I mile
Fig. 16.—Natural and cultural features along line of traverse(Area III, 5 miles southwest of Champaign-Urbana, Illinois).
34 RADIO WAVE TRANSMISSION
TOPOGRAPHY
In trying to determine the effect of
topography on signal intensity it is difficult
to eliminate the effects of geologic condi-
tions involved in the control of the topogra-
phy. In drift-covered areas, topographic
variation may correspond to variation in
drift thickness above the bedrock, or the
relief may be the result of bedrock topogra-
phy; thus signal intensity anomalies could
be the result of drift thickness and/or
topographic variation, or changes in sub-
surface geologic conditions.
In areas of moderate relief, with little or
no glacial drift cover, it is difficult to lay
out a traverse that will not cross lithologic
boundaries in the bedrock. Areas of great
relief, with or without glacial drift cover,
are commonly associated with numerous
lithologic changes in the bedrock. Areas
of small relief hardly offer fair tests of
topographic influence on radio signal in-
tensity. Thus, the problem of completely
isolating a signal anomaly due solely to
topographic influence is most difficult.
Area II (fig. 15), which has about 80
feet of topographic relief, was selected to
study the possible effect of topographic re-
lief on signal intensity because the only
known change in geologic conditions is the
80-foot variation in thickness of drift cover.
In all the recorded curves there is a slight
increase in signal strength atop a small
hill (fig. 15, point 1 along the traverse),
which may be attributed to the topographic
high and/or to the increase in drift thick-
ness over the essentially flat bedrock sur-
face. This slight increase in signal intensity
is insignificant compared to the relief of the
curves recorded along this 3960-foot
traverse.
Area III (fig. 16) has about 45 feet of
topographic relief, caused by variation in
drift thickness. As in Area II, the bedrock
relief is probably small. Eleven runs were
made across the traverse using different sta-
tions, powers, frequencies, distances, and
directions of signal arrival, and at no place
was there even a small signal anomaly
which appeared related in any way to the
45 feet of topographic relief.
ILLINOIS STATE 6E0L0GICAL SURVEY
Fig. 17.—Signal intensity curve recorded alongtraverse near Harrisburg, Illinois. High ampli-tude of curve in west half of traverse is causedby grounded electric service (REA) poles. Maxi-mum intensity peaks occur opposite ungroundedpoles, minimum peaks opposite grounded poles.
Topographic Shadow Effect
The only significant signal anomaly
caused by topography in Illinois can be
called a topographic shadow effect. This
shadow effect, resulting from a barrier to
signal propagation, is well illustrated in
figures 18, 19, and 20. The map (fig. 18)
shows the Shawneetown Hills and station
points along the traverses. Signal intensity
was recorded continuously as a traverse
was run from south to north (stations
600-601-602-603) around the east side of
the hills. A control traverse (fig. 20) was
run from north to south over the hills
(fig. 18, stations 264-263-614-615). Thesignal measured, on both traverses, was
CULTURAL AND NATURAL FEATURES 35
R- 9 E RJQ E,
SCALE3 MILES3
Fig. 18.—Topographic map of Shawneetown Hills area, Gallatin County,Illinois. Traverses were run along roads between the numbered points (map
reference station numbers).
36 RADIO WAVE TRANSMISSION
from WEBQ, Harrisburg, Illinois, 22 to
23 miles to the west.
Signal intensity on the traverse around
the hills (fig. 19) shows a decided de-
crease between station 601 and 602. Here
the Shawneetown Hills come directly be-
tween the antenna of WEBQ and the
measuring equipment along the traverse.
North and south of the hills (out from
behind them) signal intensity increases
strongly.
In comparing the curves of the two trav-
erses it should be remembered that the
first was run from south to north and the
second from north to south. Signal intensity
along the control traverse is slightly higher
north and south of the hills than it is on
the hills. The intensity decrease on the hills
may be due to either the geology, which
differs from that of the Ohio River flood
plain, or perhaps to attenuation by woods
and vegetation on the hills. The signifi-
cant feature of the curve is the ap-
parent absence of any signal anomaly due to
topographic influence. If topography exerted
any great influence one might expect a
strong signal increase on top of the hill,
which rises about 200 feet above the sur-
rounding Ohio River flood plain.
Summary
Hundreds of miles of recorded field in-
tensity measurements at broadcast frequen-
cies in Illinois have shown that small topo-
graphic relief (20 to 60 feet) has little or no
influence on signal strength. In areas of
greater relief (60 to 400 feet), except for
the topographic shadow effect, signal anoma-
lies resulting from topographic influence
appear, in general, to be insignificant.
Where they are significant, it is difficult
to assign the cause of the anomaly solely
to topographic influence because in such
areas geologic conditions sometimes change
rapidly within short distances and maybe the chief cause of an anomaly.
Concerning topographic influence, Ker-
win concludes: 5
5 Kerwin, Larkin, Use of the broadcast band in geologic
nois. Intensity decrease between stations 601and 602 caused by a shadow effect of the hills.
Arrow above "WEBQ" indicates direction of
signal arrival.
It was also observed that topography appearedto have relatively little effect. In driving overstretches of country in Arlington where the geol-
ogy was uniform, the field remained essentially
constant except for manhole effects, etc., whetherthe receiver was passing over rolling hills, pro-
ceeding through cuttings, or on level ground. Anotable exception was observed on top of PineHill, a prominence beside the Medford Dike andvery close to the transmitting antenna of the
broadcasting station being recorded. At the top
of the hill the signal was extremely strong, butit weakened considerably as the bulk of the
mountain was interposed sharply between the
receiver and transmitter.
At broadcast frequencies and lower, the
topographic effect on signal intensity in
Illinois is not appreciable. Apparently, topo-
graphic effect increases with increase in
frequency until at very high frequencies (30
to 300 mc), ultra-high frequencies (300
CULTURAL AND NATURAL FEATURES 37
to 3000 mc), and super-high frequencies
(3000 to 30,000 mc) even a small knoll
may produce a dead spot (area of no field
strength) behind it.6
SHADOW EFFECT FROM WOODS
Description of Area IV
In Area IV, four miles west of Monti-
cello, Illinois, a series of traverses was run
between stations 346 and 347 (fig. 21) to
investigate the influence of trees on signal
intensity. The 10 broadcast transmitters
ranged in power from 250 to 50,000 watts,
in frequency from 550 to 1580 kc, in dis-
tance from 17 to 140 miles, and the signals
had widely separated directions of arrival.
The 3960-foot traverse was run from south
to north on a secondary gravel road. Thebedrock immediately underlying the trav-
erse area is McLeansboro or Carbondale
of the Pennsylvanian system, and the area
is about 15 miles west of the axis of the
LaSalle anticline. Here the bedrock is part
of the south slope of a large buried valley,
the Mahomet, which is considered pre-
glacial.7 The glacial drift thickens from
about 300 feet (sta. 346 at the south) to
approximately 400 feet (sta. 347 at the
north), as the traverse crosses the south
wall toward the center of the valley. Thearea investigated is covered by ground mo-
raine, with 10 feet of topographic relief
along the 3960-foot traverse, and lies about
five miles west of the Cerro Gordo reces-
sional moraine. 8
Interpretation of the ten signal intensity
curves recorded along this traverse showor suggest the following conclusions:
—
Signals measured after they have comethrough the woods show:
1. Little or no attenuation for frequen-
cies lower than 1000 kc.
2. Progressively greater attenuation for
signals higher than 1000 kc.
3. Signals measured near the fringe edge
ILLINOIS STATE GEOLOGICAL SURVEY
6 Morecroft, J. H., Principles of radio communication:New York, John Wiley, 3rd ed., pp. 372-380, 1944.
7 Horberg, Leland, A major buried valley in east-centralIllinois and its regional relationships: Jour. Geol., vol. S3,no. 5, 1945; reprinted as Illinois Geol. Survey Rept. Inv.106, p. 353, 1945.
8 Leighton, Ekblaw, and Horberg, op cit., p. 22.
Fig. 20.—Signal intensity curve recorded in the
Shawneetown Hills area, Gallatin County, Illi-
nois. Slight decrease in field intensity betweenstations 263 and 614 occurs on the hills.
of their primary coverage area are
not a good test for attenuation by
woods, as part of the arriving sig-
nal may be propagated by components
other than ground-wave.
Signals measured before they entered the
woods show
:
1. Decreased intensity along the margin
of the woods, possibly the result
of reflection or absorption at the
boundary of the woods.
Signals measured arriving from all direc-
tions show:
1. Decreased intensity at margin of
woods.
2. Individual trees along the roadside
(fig. 21) cause no noticeable influ-
ence upon signal intensity.
38 RADIO WAVE TRANSMISSION
The influence of the geologic component
is uncertain and probably not significant.
If bedrock and moraine conditions in the
preglacial valley exert any influence on sig-
nal intensity it cannot be recognized as such
in the recorded curves.
STREAMS
In Area III the line along which signal
intensities were measured crosses a small
stream nearly at right angles (fig. 16).
Field intensity decrease over the stream wasrecorded for signals arriving from north-
south directions (Chicago and St. Louis),
120 and 140 miles distant. Field intensity
increase over the stream was recorded for
all other signals (arriving from east-west
directions), 4 to 80 miles distant. Signal
arrival with respect to stream orientation
and possibly distance appear to govern the
type and magnitude of intensity variation
over the stream rather than frequency or
power of the signals.
Collateral observations indicate that
stream-caused signal anomalies (either in-
crease or decrease) are usually sharp but of
relatively small magnitude.
BURIED PIPES
The influence of buried pipelines on sig-
nal intensity is not established. Along the
traverses run in Illinois numerous pipelines
were crossed, but in each instance the signal
intensity anomalies caused by nearby elec-
tric, telephone, or transmission wires, over-
rode those of the pipelines. If signal in-
tensity measurement across a pipeline could
be made in the absence of overhead wires
and other hazards, a small to mediumanomaly might be expected. The anomaly
would be either an intensity increase or de-
crease depending upon orientation of the
long axis of the pipeline in the radio field
being measured.
Map referencestation number
Road
^Single strand telephone wire
*" ^^Wire fence
» » » j. t\ K »<*>
Woods
ILLINOIS STATE 6EOLO6ICAL SUBVEY
Scale
1/2
Fig. 21.—Natural and cultural features alongline of traverse (Area IV, 4 miles west of
Monticello, Illinois).
ROAD MATERIALS
Signal intensity is apparently not influ-
enced by dirt, gravel, or tar roads. Numer-ous traverses along roads changing from
dirt to gravel to tar showed little if any
variation in signal intensity. Crossing a
reinforced concrete highway would prob-
ably cause an intensity anomaly, but where
such roads were crossed, associated wires
seemed to override completely any anomaly
caused by the differences in material sur-
facing the highways.
LAKES AND PONDS
The influence of lakes and ponds on
signal intensity is not certain. Because of
scarcity of lakes and ponds in the areas in-
vestigated, and the lack of good field condi-
tions for measuring signal intensity around
them, it was difficult to ascertain their in-
fluence. Bodies of water can be expected
to influence signal intensity in varying de-
gree, depending upon their size, shape,
chemical composition, and orientation with
respect to direction of arrival of the signal.
CHAPTER 7 EFFECTS OF METEOROLOGICALCONDITIONS
Meteorological conditions appear to exert
only a small influence on radio waves at
broadcast frequencies, in primary ground-
wave coverage areas, over short periods
(fig. 8). However, they are known to in-
fluence radio waves of low frequency (long
waves) over long time intervals, and waves
of high frequency (short waves) over small
time intervals. There are seasonal varia-
tions on long-wave signal intensity, the
greatest signal strength usually being ob-
served during the winter months. 1
Morecroft, 2 describing a two-year field
strength record of a long-wave transatlantic
signal, reports no evident correlation be-
tween magnetic storms and field intensity.
He does report an evident correlation be-
tween the number of sunspots and average
field intensity, with field strength greater
during solar activity.
Short waves have small ground-wave cov-
erage areas. Their chief value in communi-
cations is their ability to travel great dis-
tances via sky-wave propagation paths.
Short-wave signals are influenced greatly
by cycles of solar activity, and may become
severely attenuated during magnetic storms.
Gracely, 3in his work on variations of
ground-wave signal intensity at standard
broadcast frequencies, attempted to correlate
variations with temperature, precipitation,
humidity, atmospheric pressure, dew point,
and vapor pressure. He concludes there is
closer and more continuous correlation with
temperature than with any other meteoro-
logic feature.
Most of Gracely's signal intensity meas-
urements were spot readings, on six differ-
ent paths, made at 1 :30 p.m., E.S.T., daily
or every fourth day, for periods of nine
months to four years. He discovered that
1 Morecroft, J. H., Principles of radio communication: NewYork, John Wiley. 3rd ed., p. 381, 1944.
2 Idem., pp. 383-385.3 Gracely, F. R.
?Temperature variations of ground-wave
signal intensity at standard broadcast frequencies: Proc.Inst. Radio Eng., vol. 37, no. 4, pp. 360-363, April 1949.
intensity variation was greater over long
paths (up to 558 miles) than over short
paths (down to 76 miles). Precipitation
along the paths investigated frequently cor-
related with marked increases in signal in-
tensity which remained for several days fol-
lowing periods of heavy rainfall. However,there were other periods of rainfall whenno such signal intensity increase was ob-
served. This led to investigation of ground
moisture, along the various paths, taking
into account the rates at which the ground
gains moisture from precipitation and loses
it by runoff and evaporation. The applica-
tion of this anatysis led only to another par-
tial correlation. A few local coincidences
between signal intensity and humidity wereobserved but also permitted only partial
correlation.
In attempting to correlate signal intensity
variation with temperature, the effects of
vegetation along the paths, and effects of the
gradient of the index of refraction of the
lower troposphere were considered. Al-
though some correlations between vegetation
and signal intensity may be possible, vege-
tation alone is not responsible for the varia-
tions recorded. Similarly, it is difficult to
explain the regular intensity-versus-temper-
ature observations in terms of a lower trop-
ospheric reflected wave component which is
varying irregularly in height of reflection
and length of path.
For ground-wave signal intensity at
standard broadcast frequencies the follow-
ing generalizations, according to Gracely,
appear to be established with reasonable cer-
tainty: signal intensities decrease at higher
temperatures; this decrease becomes greater
with distance.
In field experimentation Kerwin4 em-
ployed a stationary monitoring field intensity
meter and obtained continuous field intensity
4 Kerwin, Larkin, Use of the broadcast band in geologicmapping: Jour. Applied Physics, vol. 18, no. 4, pp. 409-413, April 1947.
[39]
40 RADIO WAVE TRANSMISSION
records on an Esterline-Angus recording
milliammeter. He found that in general,
the fieldswere stronger during rainy weather,
and less affected by geology. He concluded
that for periods of three to four hours, with
constant weather and daylight conditions,
the field remained steady.
Figure 8 is a typical curve recording
variation in field intensity of ground-wave
at a fixed location. These curves some-
times exhibit no more variation over a
period of eight hours than they do for one
hour. However, eight-hour curves occa-
sionally exhibit minor variations, usually
in the form of slow, gradual shifts in in-
tensity.
Most of the traverses for the present
work were run in periods five minutes to
half an hour long. The longest traverses,
run at speeds up to 45 miles per hour, took
about one hour. Thus it appears that, with
reasonably constant weather conditions for
short periods of time, signal intensity is
probably not significantly influenced by
temperature or other meteorologic features.
One exception to the preceding general-
ization is the instantaneous intensity change
caused by natural electromagnetic phenome-
na. These phenomena cause momentary
bursts of high signal intensity. A com-
mon example is the burst of noise (static)
which accompanies a lightning flash during
a thunderstorm. This type of interference
is common at broadcast frequencies, is
especially evident at low frequencies (100 to
400 kc), but is less noticeable at high fre-
quencies.
An intensity curve recorded from sta-
tion WILL (580 kc) (fig. 23) fails
to show static bursts (summertime fair-
weather static) because they were not large
enough to deflect the recording pen, al-
though they were heard while monitoring
the signal. A curve from radio range sta-
tion AF (317 kc) (fig. 26), run along the
same traverse 15 minutes later, shows the
effect of almost continuous static bursts.
Such intensity anomalies are not likely to
be confused with those caused by field haz-
ards or geologic conditions because the static-
induced anomalies are characteristically in-
stantaneous bursts of increased intensity.
They are also readily identifiable whenmonitoring the signals with headphones.
Repeated runs over selected traverses,
days, weeks, months, and years apart, under
reasonably constant but different meteoro-
logical conditions, did not reveal any no-
ticeable variations from the general char-
acter of the relative field intensity curves,
as measured with the RCA 308-B field in-
tensity meter.
CHAPTER 8— EFFECTS OF GEOLOGIC FEATURES
The experimentally obtained data on the
influence of cultural, natural, and meteoro-
logical features on signal intensities pro-
vide a starting point for investigation of
geologic influence. The problems of ascer-
taining geologic effects on signal intensities
are, first, separating them from effects of
field hazards and, second, making reason-
able correlations with geology. Obviously,
the effects of all field hazards have not been
completely investigated, but it now appears
possible to recognize and correlate some
geologic effects.
Radio engineers have long held the con-
cept that radio waves penetrate only shal-
lowly into the earth's surface.1 One of the
methods of calculating the constants of the
earth along a path consists of taking sam-
ples of the earth and measuring their con-
ductivities and dielectric constants.2
It
would appear, as the result of tests with cave
and mine communications, that radio waves
do penetrate and are transmitted through
some bedrock. Thus, it seems logical to
postulate that abrupt changes in physical
and structural characteristics of the rock
strata may cause observable intensity and
perhaps other changes in the radio field. If
the electromagnetic field is partly in the air
and partly in the ground, a change in the
part of the field below the surface may be
reflected in the air over the earth's surface
and be measurable.
The following field examples have been
selected from many hundreds of miles of
traverse as representative of the effects of
a variety of geologic situations upon field
intensity. These examples demonstrate not
only the geologic effects, but also limitations
of the method.
FAULTING
Stratigraphic and lithologic discontinuity
of the type usually presented by faulting
1 Terman, F. E., Radio engineers handbook, New York,McGraw-Hill, 1st ed., p. 698, 1943.
2 Idem., p. 709.
might be expected to cause signal intensity
anomalies. To appraise these effects, field
hazards, if present, must be recognized and
their influence accounted for.
Signal intensity was recorded across faults
in Gallatin, White, Hardin, Pope, Johnson,
Union, Jackson, Williamson, and Franklin
counties, Illinois. Signal intensity associated
with some of these faults was apparently
unaffected, with some it may have been
influenced slightly, while with others there
appeared to be a strong influence. An in-
tensity anomaly may be associated with a
fault when lithologic discontinuity also of-
fers electrical, chemical, or magnetic discon-
tinuity to the field. Where fault structures
were traversed, field intensity anomalies
were most often associated with lithologic
discontinuity. This is illustrated by the
Shawneetown fault in Illinois (figs. 22-25),
where signal intensity is commonly higher
on the side of the fault nearest the trans-
mitter.
Shawneetown Fault in Illinois
A major fault zone, known as the Shaw-
neetown in Illinois, trends from east to
west across part of Illinois and Kentucky.
This fault in southern Illinois was selected
to test geologic influence on radio field in-
tensity. According to Butts, 3there is as
much as 2,300 feet of displacement along
the north side of Gold Hill (sees. 27 and
28, T. 9 S., R. 8 E.), Gallatin County,
where Pennsylvanian beds of the Trade-
water group to the north are in contact
with Mississippian Ste. Genevieve lime-
stone to the south. At Horseshoe Gap, three
miles southwest of Equality, the relative
displacement along the fault is not less than
3500 feet.
Numerous traverses, using signals from
different stations, were run across the
Shawneetown fault. Figure 22 shows the
3 Butts, Charles, Geology and mineral resources of theEquality-Shawneetown area: Illinois Geol. Survey Bull.
47, pp. 58-59, 1925.
[41]
42 RADIO WAVE TRANSMISSION
PENNSYLVANIAN
Mc Leonsboro
Carbondale
Tradewater
ILLINOIS STATE GEOLOGICAL SURVEY
Fig. 22.—Route of traverse (along Illinois Highway 1) across the Shawneetown fault in Gallatin
County, showing topographic contours, potential field hazards, and radio broadcast station data.
route of one of the traverses. Station 208
is at the junction of Illinois highways 13
and 1, about three miles east of Equality.
Running south, station 210 is at the junc-
tion of Route 1 and the L & N railroad
;
station 212, just north of the Saline River;
station 215, about two miles northwest of
Gibsonia. The contour lines crossing the
route along which the traverse was run
(Illinois Highway 1) are topographic. Thepotential field hazards, electric and tele-
phone wires, railroad tracks, streams, and
bridges, are indicated. The geologic sec-
tion has been generalized from Butts. Thearrows beside the radio station data indi-
cate the directions of signal arrival.
SIGNAL FROM BROADCAST STATION WILL
The signal from WILL, Urbana, 111.,
170 miles to the north (fig. 23), shows a
fairly constant intensity level north of the
fault, except for the influence of electric
and telephone wires and the metal bridge
approximately at the fault trace. South of
potential field hazards, electric and tele-
phone wires is still evident, but the general
signal intensity drops off. The WILLtransmitting antenna is on ground under-
lain by Pennsylvanian strata, and the 170-
mile signal path from Urbana to the area
of traverse is underlain by Pennsylvanian
rocks. Crossing the fault, the radio field
(above, along, and possibly carried by Penn-
sylvanian strata and glacial drift) encoun-
ters a geologic discontinuity as Pennsylvanian
strata abut against Mississippian beds. Theexact effect of the discontinuity on signal
intensity cannot be differentiated from the
influence of the metal bridge. However,
the lower signal intensity level south of
the fault is interpreted as influenced by the
fault.
SIGNAL FROM BROADCAST STATION KWK
The signal from KWK, St. Louis, Mo.,
125 miles northwest (fig. 24), shows (ex-
cept for the influence of cultural features)
fairly constant intensity levels in this area.
The signal level north of the fault is no-
ticeably higher than the level south of the
fault. The influence of the fault on signal
intensity is confused with the influence of
GEOLOGIC FEATURES 43
ILLINOIS STATE 6E0L0GICAL SURVEY
Fig. 23.—Signal intensity curve of WILL re-
corded across the Shawneetown fault, Gallatin
County, Illinois. Intensity decrease is evidentsouth of the fault (see fig. 22).
the metal bridge, which is situated close
to the fault trace. However, the lower
signal intensity south of the fault suggests
influence by the fault.
SIGNAL FROM BROADCAST STATION WJPF
The signal from WJPF, Herrin, 111., 37
miles west and slightly north of the trav-
erse (fig. 25), also shows fairly constant
intensity levels, except for the influence of
cultural features. The WJPF transmitter
is northwest of the fault, on terrain under-
lain by Pennsylvanian strata. The signal
level north of the fault is considerably
higher than that to the south. The decrease
in intensity at the bridge masks the influ-
ence of the fault, but the fault may cause
lower intensity to the south.
SIGNAL FROM RADIO RANGE STATION AF
The signal from radio range station AF,Advance, Mo., 102 miles southwest, is trans-
mitted at 317 kc. The numerous sharp in-
tensity peaks (fig. 26, to the right) repre-
sent bursts of static and noise. An almost
continuous crackling, popping, and rushing
noise was heard in the headphones while
monitoring the signal along the traverse.
This is characteristic of reception of low
frequencies with low signal intensities in
summer weather.
Signal level decreases at the bridge and
immediately to the south, and also in the
vicinity of the railroad tracks. Influence
on signal intensity by the fault is not
readily apparent. The slight decrease of in-
ILLINOIS STATE GEOLOGICAL SURVEY
Fig. 24.—Signal intensity curve of KWK re-
corded across the Shawneetown fault, GallatinCounty, Illinois. Intensity decrease is evident
south of the fault (see fig. 22).
44 RADIO WAVE TRANSMISSION
ILLINOIS STATE GEOLOGICAL SURVEY
Fig. 25.—Signal intensity curve of WJPF re-
corded across the Shawneetown fault, Gallatin
County, Illinois. Intensity decrease is evident
south of the fault (see fig. 22).
tensity immediately south of the bridge is
the only obvious anomaly on the curve that
cannot be solely accounted for by either
cultural or meteorological effects. If the
fault trace was not close to the bridge, the
decrease could possibly be assigned to the
bridge influence alone, but under the cir-
cumstances the anomaly is assigned to both
bridge and fault influence. It is possible
that a signal at low frequency (317 kc)
with this orientation is not as strongly in-
fluenced by this fault as signals at higher
frequencies.
Shawneetown Fault in Kentucky
Before investigating the Shawneetown
fault in Illinois, it was considered likely
that this major structure would cause a ma-jor variation in signal strength. Preliminary
field investigation across the Shawneetownfault, with reconnaissance-type equipment,
and spot readings 330 feet apart, revealed
large signal anomalies. Subsequent continu-
ous traverses across the fault show that
spot readings, unless removed from field
hazards, can be misleading.
The comparatively small signal anoma-
lies, recorded on continuous traverses across
the fault, may be due to a general signal
attenuation by field hazards. Electric and
telephone wires parallel the road and pass
overhead ; railroad tracks, a stream, and
a river cross the traverse, and the traverse
itself winds over terrain with about 80 feet
of topographic relief. Perhaps the lack of
ILLINOIS STATE GEOLOGICAL SURVEY
Fig. 26.—Signal intensity curve recorded across
the Shawneetown fault, Gallatin County, Illinois.
The intensity decrease immediately south of the
bridge is the only obvious anomaly that maybe due in part to the influence of the fault.
GEOLOGIC FEATURES 45
u
<T> (/)
46 RADIO WAVE TRANSMISSION
large signal strength anomalies across the
fault should be no more surprising than
the small anomalies that were recorded
in the midst of field hazards. The anoma-
lies (figs. 22-26), though smaller in mag-
nitude than might be expected, appear to be
the results of fault influence.
It was desirable to further substantiate
the Shawneetown fault influence on signal
strength by crossing it, if possible, where
there were no associated field hazards. Ac-
cordingly a location was chosen on a level
alluvial plain along the Ohio River bot-
toms in Kentucky (fig. 27). The plain
was about car-roof height in corn at the
time of the traverse. Thus, the factors
of soil, topography, and vegetation were
uniform. Figure 28 shows the curve re-
ILLINOIS STATE GEOLOGICAL SURVEY
Fig. 28.—Field intensity curve recorded along
traverse across the Shawneetown fault, on OhioRiver bottoms in Kentucky.
corded along this traverse. The signal wasfrom WEBQ, Harrisburg, 111., 23 miles
west and slightly north. The transmitting
antenna is north of the fault on terrain un-
derlain by lower McLeansboro beds of the
Pennsylvanian system.
The curve shows an intensity decrease
near the fault, and general field intensity
is higher north of the fault. In the entire
length of the traverse (more than a mile)
there is only the one major anomaly (fig.
28). The signal path from WEBQ partly
parallels or coincides with the strike of the
fault. If a signal from the north or south
were used (with the signal path at a high
angle to the strike of the fault), the effect
of the geologic discontinuity on that signal
might be greater and the signal strength
anomaly stronger. This traverse (fig. 28)
is interpreted as unquestionably demon-
strating geologic influence on signal in-
tensity.
Inman East Fault
Traverses across the Inman East fault,
Gallatin County, 111. (fig. 18), yielded the
common type of signal anomaly with in-
tensity higher on the side of the fault closer
to the transmitter. They also yielded a
special type of anomaly which may result
from some of the electromagnetic field being
transmittted by limestone beds.
The Inman East fault trends northeast-
southwest across the Ohio River bottoms
in Gallatin County (fig. 18). The strati-
graphic throw ranges from approximately
200 to 400 feet. The downthrown strata
are on the east side of the fault. Intersec-
tion of the major plane by drill holes in
the Inman East oil pool (sees. 11, 14, T.
8 S., R. 10 E.) indicates a dip of about 60
degrees to the southeast.4 In the area of
the traverses, alluvial and outwash glacial
debris is approximately 100 to 150 feet
thick; the underlying lower McLeansboro
rocks (Pennsylvanian) present a surface
of gentle relief; the near-surface beds in-
volved in faulting range from No. 6 coal
bed to 50 feet above the West Franklin
limestone (250 feet above No. 6 coal bed).
4 Pullen, M. W., Subsurface geology of Gallatin Countynorth of the Shawneetown fault: In Illinois Geol. Sur-
vey Rept. Inv. 148, 1951.
GEOLOGIC FEATURES 47
Field intensity using the signal from
WJPF (250 watts, 1340 kc), 46 miles
west of the fault trace, was lower east of
the fault than west. Field intensity from
WGBF (5000 watts, 1280 kc), 30 miles
northeast of the fault, was lower on the
west than on the east side, but the intensity
immediately east of the fault was con-
siderably higher than elsewhere on the
east side within a few miles of the fault.
Two explanations of the anomaly are sug-
gested : first, intensity is increased by re-
flection of part of the field at the struc-
tural discontinuity or by excitation of the
structure ; second, intensity is reinforced
at the fault by that part of the field which
is transmitted from the east to the fault
plane by the West Franklin limestone. Thefirst explanation is compatible with radio
theory. If the second explanation is valid it
may operate alone or in combination with
the first.
The transmitting antenna of WGBF, at
Evansville, Ind., is on or close to the outcrop
of the West Franklin limestone. The lime-
stone, with some faulting, extends south-
west and abuts along the Inman East fault
plane at depths of 150 to 300 feet on
the east (downthrow) side. In Schlum-
berger electric logs the West Franklin lime-
stone has high apparent resistivity as com-
pared to strata above and below the lime-
stone. Because of the thickness of the lime-
stone in relation to the electrode configura-
tion, it is probable that there is even greater
resistivity contrast in true in-place resistiv-
ities. Electric logs of some holes that inter-
sect the fault indicate that the material along
the fault plane itself has higher electrical
resistivity than adjacent shales, siltstones,
and sandstones.
In several wells, the surface pipe is seated
and cemented in the West Franklin lime-
stone (Carter Oil Co., E. H. Busick C-87,
sec. 11, T. 8 S., R. 10 E.), thus directly
connecting the limestone strata with the
surface of the ground.
The limestone offers the emitted radio
field a comparatively high resistance path.
Kerwin5 demonstrated high field intensity
3 Kerwin, Larkin, Use of the broadcast band in geologicmapping: Jour. Applied Physics, vol. 18, no. 4, p. 412, April1947.
associated with rocks of high electrical
resistivity and low intensity with rocks
of low resistivity. The increase in intensity
close to the Inman East fault, as com-
pared to intensity measured in the air path
away from the fault, might be the result of
bridging between the West Franklin lime-
stone (carrying part of the field in the
ground from Evansville) and the surface
either by the cemented metal surface pipe in
the drill holes or by high resistance material
along the fault plane, or both.
If the intensity anomalies across the In-
man East fault are valid expressions of geo-
logic influence on field intensity, then bed-
rock structure influence is making itself
felt through 100 to 150 feet of alluvium
and glacial outwash.
CRYPTOVOLCANIC STRUCTURENEAR KENTLAND, INDIANA
Geologic Setting
The Kentland cryptovolcanic structure
lies between the towns of Kentland and
Goodland, Newton County, in north-
western Indiana. Here, disturbed Ordovi-
cian rocks cropped out (before quarry op-
erations) in a flat glacial plain. The largest
of these quarries (McCray) lies about 200
feet south of U. S. Highway 24 in sec. 25,
T.27N.,R.9W. (fig. 30). The disturbed
Ordovician rocks have been described by
Shrock and Malott;6 the history and evolu-
tion of geologic thinking has been sum-
marized and the stratigraphy and structure
have been described by Shrock; 7 and the
paleontology of the rocks has been discussed
by Shrock and Raasch. 8
Field intensity surveys were run over
this area to ascertain if disturbed Ordovi-
cian rocks (apparently pushed up through
younger overlying strata) had any measur-
able influence on signal intensity.
The topography of the area is that of a
level glacial drift plain. The drift thick-
6 Shrock, R. R., and Malott, C. A., The Kentland area
of disturbed Ordovician rocks in northwestern Indiana: Jour.Geol., vol. 41, no. 4, pp. 337-370, 1933.
7 Shrock, R. R., Stratigraphy and structure of the areaof disturbed Ordovician rocks near Kentland, Indiana: Am.Midland Nat., vol. 18, no. 4, pp. 471-531, 1937.
8 Shrock, R. R.. and Raasch, G. O., Paleontology of
the disturbed Ordovician rocks near Kentland, Indiana
:
Am. Midland Nat., vol. 18, no. 4, pp. 532-607, 1937.
48 RADIO WAVE TRANSMISSION
R. 9 W. R. 8 W.
FIELD INTENSITY CONTOUR MAPNEAR KENTLAND, IND.
WIND Chicago
147 GEOGRAPHIC ORIENTATION POINTS
ALONG TRAVERSES
2.5-7 RELATIVE FIELD INTENSITY VALUES
27
ILLINOIS STATE GEOLOGICAL SURVEY
Fig. 29.—Field intensity contour map near Kentland, Indiana (Sta. WIND)
ens in all directions away from the quar-
ries in the cryptovolcanic rocks. Drill-
hole data indicate a maximum thickness
of 160 feet locally.
The geological map of Indiana (1932) 9
shows the quarry area surrounded by De-
vonian (New Albany) strata, with Missis-
sippian (Osage) immediately east and
south. On the basis of fauna found in the
quarries, Raasch and Bays10 consider most
of the exposed disturbed Ordovician strata
Black River and Trenton in age.
Shrock11 considers the disturbed Ordovi-
cian rocks an inlier surrounded by Silurian,
Devonian, Mississippian, and possibly Penn-
sylvanian strata. He believes that most or
all of the disturbed Ordovician strata ex-
posed in the present quarries have been
uplifted at least 1500 feet. The uplift
9 Logan, W. N., Geological map of Indiana: Indiana
Conserv. Coram., Div. Geol. Pub. 112, 1932.10 Raasch, G. O., and Bays, C. A., personal communica-
tion, 1949."Shrock, op. cit., p. 517.
caused faulting, fracturing, shattering, and
brecciation of the strata. The Ordovician
away from the quarries assumes its normal
regional attitude.
Logan reported a well at Kentland12
about three miles west of the quarry area
that penetrated 100 feet of glacial drift,
145 feet of Devonian, 305 feet of Silurian,
and 570 feet of Ordovician strata. If the
present exposed upstanding mass of dis-
turbed Ordovician rocks is the result of a
post-Silurian or Devonian diastrophism,
then it was forced up through the overlying
Silurian or Silurian-Devonian strata. If
the diastrophic incident was post-Ordovi-
cian-pre-Silurian, it is possible that part
of the disturbed Ordovician mass may have
been covered by younger sediments. Since
the geologic relations at the margins of the
disturbed mass are unknown, the age of the
diastrophic event cannot be ascertained.
12 Logan, W. N., Economic geology of Indiana: Handbookof Indiana Geology, pt. 5, p. 950, 1922.
GEOLOGIC FEATURES 49
Regardless of whether Silurian beds were
directly involved in the cryptovolcanic ac-
tion or were later deposited around or partly
over the Ordovician mass, they are probably
in direct contact with the upthrown Ordo-
vician mass, or at least not far from it.
Field Hazards
Field hazards in the area are numerous.
Both telephone and electric wires are paral-
lel to and cross the roads. A railroad track
runs east and west through the middle of
the area (figs. 29, 30). These field hazards
cause diverse intensity anomalies, for the
most part recognizable.
Field Intensity Measurements
The field intensity curves from radio sta-
tion WIND, 560 kc, 5000 watts, 55 miles
northwest (transmitter at Gary, Ind.), are
nearly constant and relatively flat. In gen-
eral, field intensity decreases sharply be-
neath overhead wires and increases near
and at the cryptovolcanic structure. Themap, based on the intensity curves (fig. 29),
shows a closed intensity high around the
cryptovolcanic structure. The transmitting
site of station WIND is on terrain under-
lain by Devonian and Silurian rocks.
Additional traverses were run over the
area using station WDAN, Danville, 111.,
1490 kc, 250 watts, 45 miles south and
slightly west of Kentland. Intensity does
not change over the cryptovolcanic structure.
The transmitter site at Danville is under-
lain by Carbondale strata of Pennsylvanian
age.
The signal from station WDZ, Tuscola,
111. (now relocated at Decatur), 1050 kc,
1000 watts, 80 miles, 35 degrees west
of south, from Kentland, showed a small
intensity increase over the cryptovolcanic
structure. The WDZ transmitter site is
underlain by the crest of the LaSalle anti-
cline, and Devonian-Silurian dolomites are
the first bedrock encountered (at depths
from 30 to 50 feet). There may be some
geologic relationship which causes the sig-
nal intensity from WDZ to increase over
the cryptovolcanic structure while that of
station WDAN remains constant. Thefrequencies of the two stations are close, the
transmitting powers 1000 and 250 watts,
but the stronger station is 80 miles awayand the weaker only 45 miles. Signal in-
tensity from station WDAN, on Pennsyl-
vanian strata, is not influenced by the Ordo-
vician strata exposed around Kentland.
Some of the sedimentary layers between
the Pennsylvanian and Ordovician have low
electrical resistance, such as shale, and as
comparatively good electrical conductors
they may act as shields and prevent the
radio fields from reaching the Ordovician,
Silurian, or Devonian strata below.
Again, two explanations of the anomaly
are suggested : first, intensity increases at
the structure by reflection or excitation;
second, intensity is reinforced at the struc-
ture by that part of the field which maybe transmitted by the Devonian-Silurian
rocks from Tuscola to Kentland where
these beds are in contact with the disturbed
Ordovician rocks.
Field Intensity Contour Maps
A regional survey of the area was madeusing the signal from station WAAF, Chi-
cago, 111. Radio station WAAF operates
on a frequency of 950 kc, with a powerof 1000 watts, and is 75 miles, 15 degrees
west of north, from the town of Kentland.
The field intensity map (contours repre-
sent measured intensity values) gives a
regional picture covering a considerable
area around the cryptovolcanic disturbance
(fig. 30). The transmitter site is underlain
by Silurian strata. Signal intensity in the
Kentland area is relatively weak (20 to 30
microvolts per meter) but increases in the
vicinity of the cryptovolcanic structure.
Field strength calculations for station
WAAF in the Kentland area, using the
Sommerfeld formula as modified by Van der
Pol, indicate an expected field intensity
of 20 microvolts per meter or less. This
value is found in areas at some distance
from the quarries, but at or near the
quarries signal intensity reaches 50 micro-
volts per meter. This intensity anomaly
may be explained by reflection and excita-
tion, and/or signal reinforcement through
Silurian rocks connecting Kentland and
Chicago.
50 RADIO WAVE TRANSMISSION
GEOLOGIC FEATURES 51
R. 7 E
;.-,
Point
;\
sBb
J 9 • I s.
"V
r%
*•*;^^usessnMt>»t> 3̂eim̂ .Wk***•>*.
SCAL£2 MILES
Fig. 31.—Location of field intensity traverse across Hicks dome, Hardin County,Illinois.
52 RADIO WAVE TRANSMISSION
It is of interest that high intensity values
are found in an area north and slightly
west of the exposed cryptovolcanic struc-
ture (fig. 30). It is possible that future ex-
ploration will prove that this high-intensity
area overlies an extension, if not a major
part, of the cryptovolcanic structure.
Signal Intensity Versus MagneticIntensity
Shrock and Malott included a mag-
netic intensity variation map13 made by
Justin Zinn, who used a Hotchkiss super-
dip. A well-defined magnetic anomaly is
shown in the area of the quarries and be-
yond them. This anomaly may be caused
by locally raised pre-Cambrian basement or
intrusive magnetic rock.
The radio field intensity anomaly ex-
tends north and west beyond the quarries
whereas the magnetic anomaly extends
east and northeast. If the signal in-
tensity anomaly were caused by a mag-
netic component of the earth, the two
anomaly patterns might be the same or
similar. This is not the case; therefore it
appears, at least around Kentland, that an
anomaly in the magnetic field does not
greatly influence the intensity of an electro-
magnetic field in the ground-wave area.
Signal Intensity Behavior
Field hazard influence is easily recogniz-
able on the map (fig. 30). The field in-
tensity contour lines are pinched in toward
the railroad track which cuts through the
middle of the area. Signal intensity is ap-
parently reduced considerably near the good
metallic conductors (rails and associated
wires), but the increased signal strength
over the cryptovolcanic structure is strong
enough to overcome this influence.
An interesting observation can be madeby comparing the field intensity contour
maps on stations WAAF and WIND (figs.
29, 30). The intensity anomaly for WINDover the cryptovolcanic structure is relative-
ly small compared to the strong anomaly
for WAAF.The two stations are about equidistant
13 Shrock and Malott, op. cit., p. 366.
from the surveyed area, the frequencies are
roughly similar, the powers are 5000 and1000 watts, yet the weaker station (WAAF)produces the greater intensity anomaly.
This can possibly be explained by the geo-
logic setting of the two transmitters.
WAAF is on Silurian terrain ; WIND is onDevonian-Silurian terrain. Or perhaps the
weaker signal is more sensitive to geologic
and other influences than the stronger one.
Cloos14 observed a similar relationship
near Baltimore, Md. Of the four broad-
cast stations then in the Baltimore area,
only WCAO (600 kc, 250 watts) showedclearly what he called "dead spots." Theother three stations, WBAL (1060 kc,
17 Weller, Stuart, The geology of Hardin County: Illi-
nois Geol. Survey Bull. 41, 1920.
dome Devonian limestone (thought to be
Onondaga in age) crops out, and is encircled
by successively younger beds, the outermost
of which are Pennsylvanian in age. Weller18
postulated igneous intrusion as the cause
of structural deformation. Although the
dome is analogous in many ways to the
Omaha dome in Gallatin County, 111.,
which is known to be intruded, 19 surface
examinations and drilling to date have failed
to encounter any igneous material. Hicks
dome is of interest for this type of study,
in preference to the Omaha dome, because
of the fewer hazards to radio fields and the
more varied surface lithologic contrasts.
The dome is cut in places by faults, and
faulting is common in the surrounding area.
Field strength surveys were made across
the dome to explore the feasibility of geo-
« Idem.1;> English, R. M., and Grogan, R. M., Omaha pool and
mica-peridotite intrusives, Gallatin County, Illinois: Illi-
nois Geol. Survey Rept. Inv. 130, 1948.
54 RADIO WAVE TRANSMISSION
logic mapping by signal intensity measure-
ments.
The area is part of the driftless section
of southern Illinois, lying south of the
margin of farthest Illinoian ice advance.
Topographic relief along the traverse over
the dome (fig. 31) is 225 feet.
The core of Hicks dome (Devonian) is
in sec. 30, T. 11 S., R. 8 E. Successively
younger beds are encountered in all direc-
tions away from the core of the dome. Penn-
sylvanian strata occur about five miles north
of the core. In that distance, along the
north flank of the dome, the stratigraphic
section ranges from Devonian limestone to
Caseyville sandstone (Pennsylvanian). Acable tool well was drilled to a depth of
2345 feet in the southeast corner of sec.
30, T. 11 S., R. 8 E., in 1935. The hole
started in the Chattanooga-New Albany
formation and penetrated 1675 feet of De-
vonian and Silurian strata and 570 feet of
Ordovician beds. In 1944 the hole was
deepened to a total depth of 3295 feet, pene-
trating Ordovician strata still farther. Thegeologic map and cross section (fig. 32)
show the attitude of the formations near the
core of the dome. This map covers the
same area and is drawn to the same scale
as the topographic map (fig. 30).
Field Hazards
The only wires along the traverse are
two-strand REA service on poles running
along the road between Hicks and Hicks
school (fig. 33). There is considerable
difference in the curve recorded alongside
the wires and in the curve where there were
no wires. Its amplitude is greatly increased
by the effect of grounded REA poles (fig.
33). Also, signal intensity reaches its low-
est level for the entire traverse near these
wires, which have an attenuating effect.
Topographic relief of 225 feet may pos-
sibly influence signal intensity in some small
way, but its effect is nowhere evident. Me-teorologic conditions were constant for the
30 minutes it took to complete the traverse.
A real field hazard was the opportunity for
error in maintaining the shielded loop an-
tenna of the RCA 308-B (field intensity
Fig. 33.—Signal intensity curve recorded across
Hicks dome, Hardin County, Illinois. Intensity
decrease (between Hicks and corner 506) is
attributed to older strata at the center of
the dome.
GEOLOGIC FEATURES 55
meter) in a maximum signal orientation
over the winding traverse. However, extra
precaution was taken to assure proper loop
orientation, and intensity anomalies because
of misorientation are small and do not affect
the overall intensity curve. This was dem-
onstrated by repeating the traverse manytimes and essentially duplicating the re-
corded curve each time. The curve shown
in figure 33 was selected as representative of
approximately 30 curves recorded during
three days of field investigation of Hicks
dome.
Field Intensity Measurements
The signal from station WEBQ, Harris-
burg, 111. (1240 kc, 250 watts), 15 miles
northwest, was used for the traverse. Thetraverse starts at station 634 (fig. 31), con-
tinues along the indicated route to Hicks,
Hicks school, B.M. 434, corner 537, corner
506, and ends at Hubbards store. Thegeological map and cross section (fig. 32)
show where successive formations were
crossed to reach the Devonian core of the
dome and where they were recrossed going
down the flank of the dome.
The signal intensity curve (fig. 33) shows
lower intensity associated with the older
beds and higher with younger beds. Thelowest signal intensity, between Hicks and
corner 506, is found over Warsaw, Osage,
and Devonian terrains. The highest occurs
farther down the flanks of the dome (geo-
logically, not topographically) over St.
Louis and younger beds.
The irregular and step-like character of
the curve over the north flank of the dome(station 634 to Hicks) is interpreted to
correspond to the characteristic conductivi-
ties and dielectric constants of the Chester
and lower Mississippian strata. Kerwin20
demonstrated a relationship of high field
intensity associated with high resistivities
and lower intensities with lower resistivities
of earth materials. A Schlumberger elec-
tric log of a nearby drill hole (Ashland,
No. 1 Lackey, sec. 1 1, T. 11 S., R. 9 E.),
which penetrates the strata from the
Vienna limestone to the St. Louis lime-
stone, shows that the apparent resistivities
of the formations differ considerably. Thelimestones are generally high (200 to 1400
ohm meters), the sandstones lower (80 to
190 ohm meters), and the shales lowest of
all (10 to 40 ohm meters). A detailed
field intensity survey on a detailed chart
scale, tied in to formation boundaries and
widths along the traverse, would show the
relationship between the step-like character
of the curve and the various rock strata.
There is a small unexplained signal anomaly
near B.M. 434 (indicated on the chart with
a question mark).
The transmitting site at WEBQ is
underlain by Pennsylvanian strata. AsHicks dome is traversed and successive strata
crossed (from younger to older beds), sig-
nal intensity decreases. This, again, wouldappear to indicate that part of the energy
may be propagated through or along strata
energized beneath the transmitting antenna,
for as successively older beds are crossed
(farther removed from Pennsylvanian
strata), signal intensity becomes lower.
ORE BODIES
Several hundred miles of radio field in-
tensity traverses were run during two suc-
cessive field seasons in the Galena lead and
zinc area of northwestern Illinois in order
to investigate the possible influence of ore
on signal strength.
Geologic Setting
The Galena area lies almost entirely with-
in the driftless region of northwestern Illi-
nois. Surface materials consist chiefly of
stream deposits, dune sand, loess, and glacial
outwash deposits.21 Topographic relief in
the area is about 500 feet. Outcropping
strata are Silurian dolomites, and Ordo-
vician Maquoketa shale, Galena dolomite,
Decorah dolomite, limestone, and shale, and
Platteville limestone, dolomite, and shale.22
These strata are more or less horizontal and
parallel. Structure contours on top of the
20 Kerwin, op. cit. 412.
21 Trowbridge, A. C., and Shaw, E. W., Geology andgeography of the Galena and Elizabeth quadrangles: Illinois
Geol. Survey Bull. 26, pi. IV, 1916.22 Idem.
56 RADIO WAVE TRANSMISSION
Galena dolomite 23 indicate that the surface
dips northeast at approximately 17 feet per
mile. Structure contours on top of the Oil-
rock (Guttenberg member of the Decorah
formation) show this surface folded in
places forming gently dipping anticlines and
synclines.24
Ore Deposits25
The lead and zinc ore deposits of the
Galena area are in the Galena, Decorah,
and Platteville formations, in a zone about
140 feet thick. The mineralized zones range
in depth from 100 to 650 feet but are com-
monly between 250 and 350 feet. The ore
deposits may be curved (arcuate) or long
and relatively straight. The minable de-
posits are usually 25 to 300 feet wide, thick-
nesses are commonly up to 40 feet with a
maximum of 125 feet, and length may be
several thousand feet. The major zinc-lead
deposits (lower-run deposits) are in "flats"
(nearly horizontal sheets between or paral-
lel to bedding planes) and in "pitches"
(sheets cutting across bedding planes).
The zinc mineral is largely sphalerite
(zinc sulfide). Above water level the sul-
fide becomes partially or entirely oxidized
to carbonate to form the zinc carbonate min-
eral smithsonite. The ore grade ranges
from 3 to 20 percent zinc. The lower range
of 3 to 5 percent is considered minable de-
pending upon economic conditions. Pyrite
and marcasite (iron sulfide) are associated
with the sphalerite. Metallic iron ranges
from 5 to 20 percent of the zinc ore. Themineral galena (lead sulfide) is usually
less than 1 percent of the zinc ore but is
found locally in rich pockets. The main
gangue mineral is calcite (calcium car-
bonate).
Most top-run deposits are about 100 feet
above the lower-run deposits in solution
channels in the dolomite. The ore is usually
entirely galena but grades laterally into
™ Idem."Willman, H. B., and Reynolds, R. R., Geological struc-
ture of the zinc-lead district of northwestern Illinois: Illi-
nois Geol. Survey Rept. Inv. 124, pi. 7, 1947.25 The geology in the following paragraphs is based on:
Willman, H. B., Reynolds, R. R., and Herbert, Paul, Jr.,
Geological aspects of prospecting and areas for prospecting
in the zinc-lead district of northwestern Illinois: Illinois
Geol. Survey Rept. Inv. 116, 1946.
Willman, H. B. and Reynolds, R. R., Geological structure
of the zinc-lead district of northwestern Illinois: Illinois
Geol. Survey Rept. Inv. 124, 1947.
zinc and iron. The ore deposits are usually
less than 25 feet wide, from 5 to 20 feet
thick, and up to several hundred feet long.
Between the top-run and lower-run deposits
there are middle-run deposits which com-bine features of both. The middle-run de-
posits are likely to be high in iron.
AREAS OF WORKING AND ABANDONED MINES
In areas of working and abandoned mines,
field hazards are concentrated in the under-
ground car tracks, machinery, electric mo-tors and pumps, mine wires and cables, and
electric and telephone service wires. Be-
cause of them, signal strength anomalies
caused by ore deposits are nowhere clearly
separable from those caused by field hazard
influences. Field intensity surveys were run
over the following mining areas: Bautsch,
Gray, Pittsburg, Blewett, Ginte, Graham,Graham-Schneider, Vinegar Hill, North and
South Unity, and Northwestern.
An interesting observation of possible sig-
nificance was made on a traverse over the
Bautsch ore body before mining was started.
The traverse was run across the south end of
the ore deposit at the time a shaft was being
dug approximately 200 feet north. Theonly nearby wires were three strands of elec-
tric service coming in from the north. Therecorded curves, run from southeast to
northwest, decreased in signal strength near
the ore body, and orientation of the maxi-
mum signal direction shifted south approxi-
mately 45 degrees. Similar changes in ori-
entation were observed over other ore de-
posits, but because of the structure, ma-chinery, cables, and guy wires associated
with the shafts, no positive significance is
attached to these observations. Various
other changes in signal strength over operat-
ing or developed properties are not attribu-
table solely to ore influence because of at-
tendant field hazards.
PROSPECTIVE ORE-BEARING AREAS
Many miles of traverse were run, away
from known ore deposits but within the
boundaries of the principal mineralized
areas,26 and numerous changes in signal
26 Willman, Reynolds, and Herbert, op. cit., fig. 1.
GEOLOGIC FEATURES 57
strength were observed. However, most
of these changes are relatively small or so
near wires and other field hazards that
correlation between them and ore-deposit
influence is uncertain. Several exceptions,
one a strong intensity anomaly, merit
mention.
On an east-west traverse along the south
edge of sec. 1, T. 28 N., R. 1 E., signal
strength (station WKBB, Dubuque, Iowa,
16 miles northwest) decreases significantly
and orientation of the maximum signal path
shifts approximately 45 degrees near sta-
tion 360 (fig. 34). Such a signal strength
decrease is common in the presence of inter-
mittent overhead wires; here, wire condi-
tions (12 strands of telephone line) remain
constant for the entire traverse, thus some
other explanation for the anomaly is re-
quired. It seemed possible that the anomaly
might be caused by deposits of conductive
ore. The mining company owning the lease
drilled a test hole near station 360 (Fur-
long lease) on the basis of the signal strength
anomaly (fig. 34). Test drilling confirmed
the presence of conductive minerals in the
bedrock. Field examination of the well
cuttings revealed abundant pyrite between
50 and 100 feet deep, some cuttings run-
ning as high as an estimated 50 percent iron
content. Some zinc was encountered just
below 100 feet, but only small amounts of
ore minerals were found between the zinc
level and the bottom of the hole. The test
hole failed to find ore in commercial quan-
tities, but the pyrite-rich strata above 100
feet were uncommonly thick and rich for
the area. It is possible that this shallow
iron deposit is the direct cause of the record-
ed attenuation of signal strength, or that
associated ore deposits, as yet undiscovered,
may exist in this vicinity.
A sharp decrease in signal intensity was
observed in a north-south traverse along
the east edge of sec. 6, T. 28 N., R. 2 E.
The decrease occurs approximately ]/g mile
north of the southeast corner of sec. 6,
and cannot definitely be accounted for by the
associated field hazards. A similar sharp
signal strength anomaly (increase) was ob-
served in the NE J4 sec. 24, T. 28 N., R.
ILLINOIS STATE GEOLOGICAL SURVEY
Fig. 34.—Signal intensity curve recorded in theGalena, Illinois, area. The signal decrease, cen-tered at station number 360, is attributed to arich concentration of iron sulphide from 50
to 100 feet deep.
1 E. This too cannot be definitely accounted
for by associated field hazards.
AREAS OF NEWLY DISCOVERED ORE BODIES
To investigate further the relationship
between signal intensity and ore deposits,
traverses were made over proved ore re-
serves where there were few cultural field
hazards in the Shullburg, Wis., area. Ex-
tensive traverses were made along secon-
dary roads and in the fields and meadowsaway from obvious field hazards. Access
to the land containing the ore deposits wasfacilitated and information on their location
and geologic settings was kindly furnished
by R. R. Reynolds, 27 who accompanied the
field party and aided in making many of
the traverses.
27 Geologist, The Calumet and Hecla Company, Shullburg,
Wis.
58 RADIO WAVE TRANSMISSION
Most of the ore deposits traversed are in
or near synclinal axes and trend generally
east-west. Three of the six ore deposits
crossed have up to 140 feet of Maquoketa
shale cover, two have thin Maquoketa shale
cover (10 to 40 feet), and one, the Kittoe
deposit, has no Maquoketa shale cover.
The only clear signal strength anomaly
was observed on the Kittoe property where
signal strength decreases as the ore deposit
is crossed (figs. 35, 36). A small stream,
running approximately parallel to the trend
of the ore, prevented crossing the ore de-
posit completely and might be the cause
of the observed anomaly. The Kittoe ore
deposit contains rich amounts of galena
and pyrite associated with and above the
sphalerite. The recorded signal anomaly
over the ore may be at least partly caused
by lead and iron minerals.
Other ore deposits, Hendrickson and
Gensler, contain small to large percentages
of lead and iron with zinc ore, but no
changes in signal strength were observed
in traverses across them. The Maquoketa
shale has low electrical resistivity (where
seen in electric logs of drill holes), is a
relatively good conductor, and probably
attenuates radio fields greatly. Perhaps the
shale lowers the energy sufficiently so that it
does not penetrate to the strata below. This
factor might account for the anomaly on
the Kittoe (with no Maquoketa shale cover)
and the absence of anomalies on the other
five ore deposits overlain by various thick-
nesses of the shale. Many detailed meas-
urements were made over these ore deposits
using stations with different frequencies,
powers, distances and directions of signal
path, but strength curves were essentially
similar.
Summary
Field intensity measurements in the Ga-
lena area were made over ore deposits rang-
ing from 100 to 600 feet in depth. Most of
the known deposits traversed are chiefly
sphalerite (poorly conductive zinc sulfide)
with minor amounts of associated conduc-
tive ore in the form of lead and iron sul-
fides. No signal strength anomalies were
ILLINOIS STATE GEOLOGICAL SURVEY
Fig. 35.—Signal intensity curve of WMAQ re-
corded south of Shullberg, Wisconsin. Decreasein signal intensity may be due in part to the in-
fluence of the Kittoe ore deposit.
observed which could be attributed solely
to deposits of the ore mineral sphalerite.
Signal strength anomalies recorded near
working or abandoned mines were usually
accompanied by cultural field hazards so
that their significance is doubtful. In pros-
pective ore-bearing areas away from knowndeposits several interesting anomalies were
observed. One such anomaly appears to be
accounted for, in part at least, by a rich
concentration of conductive iron sulfide at
shallow depths. On traverses over newly
discovered and unmined ore deposits, only
at Kittoe is there a signal anomaly.
From observations of signal strength be-
havior in air in the presence of linear metal
conductors, such as wires and railroad
tracks, it seems probable that linear or tab-
GEOLOGIC FEATURES 59
ILLINOIS STATE GEOLOGICAL SURVEY
Fig. 36.—Signal intensity curve of CHI recordedsouth of Shullberg, Wisconsin. Decrease in sig-
nal intensity may be due in part to influence of
the Kittoe ore deposit.
ising where there are shallow conductive
ores not covered by Maquoketa shale.
On the basis of observations by Cloos 28in
the Baltimore, Md., area, steeply dipping
bedrock contacts greatly reduce signal
strength or even eliminate it. Thus an es-
sentially nonmetallic tabular ore body might
be recognized through field intensity meas-
urements if the ore was steeply dipping
or in an almost vertical position. In the
Galena area, steeply dipping, poorly conduc-
tive tabular ore bodies in pitches are usually
associated with the lower- and sometimes
with the middle-run ore deposits. No ob-
served signal strength anomalies can be defi-
nitely attributed to such structures. How-ever, it is possible that if the steeply dipping
tabular ore deposits were of larger dimen-
sions or came closer to the surface, field
intensity measurements might reveal their
presence.
UNDERGROUND MINED-OUTAREAS
Investigation of the influence of under-
ground mined-out areas on signal strength
was neither planned nor anticipated. It
resulted from ordinary observation and co-
incidence. Traverses were run looking for
signal anomalies from the southern exten-
28 Cloos. op. cit.
ular conductive ore deposits underground
might exert similar influence. Most metal
conductors in a radio field reduce the signal
strength considerably, but occasionally they
increase it, possibly through reradiation. It
appears that in the absence of field hazards,
or with recognition of their effects if pres-
ent, abnormally low signal strength (or
more rarely abnormally high strength)
might be indicative of conductive ore in the
bedrock. This is assuming that the radio
field penetrates to the ore deposit. In the
Galena area, the low-resistant Maquoketa
shale appears to act as an electrical shield
preventing appreciable amounts of radio
fields from reaching underlying conductive
ore deposits. Apparently here ore detection
by the field intensity method is only prom-
ILLINOIS STATE GEOLOGICAL SURVEY
t
Fig. 37.—Map showing route of traverse (sta.
208—261—262) over mined-out area along Illinois
Highway 13, Gallatin County. Contours are
topographic, fault is extension of Ridgeway fault,
and outcrops are of No. 6 and No. 5 coal beds.
60 RADIO WAVE TRANSMISSION
sion of the Ridgeway fault in Gallatin
County, 111. Along Illinois Highway 13,
between Equality and Shawneetown, a sig-
nal intensity high was repeated near the
B. & W. coal mine, sec. 13, T. 9 S., R. 8 E.
(fig. 37). The mine superintendent kindly
permitted access to an up-to-date mine mapwhich showed the extent of the mined-out
area. This area corresponded almost pre-
cisely with the field-intensity high. TheRidgeway fault had not been encountered
in the mine. Therefore, inference was made(erroneously) postulating a cause-and-effect
relationship between the mined-out area
and the signal anomaly.
Geologic Setting of the B. & W. CoalMine
The Harrisburg (No. 5) coal was being
mined at a depth of 95 feet, 275 feet above
sea level. Fifty-five to 65 feet of interbedded
shale and siltstone and shaly siltstone lie
above the coal bed, and 30 to 40 feet of
cover overlies the bedrock surface. No. 6
coal crops out north of the mine and No. 5
crops out south (fig. 37). The mined-out
area was "dry" and offered a geologic dis-
continuity, some 95 feet below the surface,
between bedrock and the air-filled mined-
out area. At that time, early in the field
work (June 1947), it was postulated that
because the air in the mine was probably a
better medium for radio wave propagation
and transmission than the surrounding rocks,
signal strength increased. This led to in-
vestigation of other mined-out areas.
Truax-Traer Coal Mines
Through the courtesy of Walter Roe,
engineer for Truax-Traer Coal Company,
field investigations were made over a large,
abandoned, watered mine at Hollidayboro,
Jackson County, 111. The depth to the coal
(No. 6) ranges from about 70 to 130 feet.
A caprock (Herrin limestone) up to 6 feet
thick overlies the coal bed. The limestone
is not continuous because of solution along
jointing planes. Traverses run over the
area used signals differing in power, fre-
quency, distance, and direction of signal
path, but no significant intensity anomalies
were obtained. Radio transmitters, con-
structed in the Illinois Geological Surveylaboratory, were used first over the mined-out area, then off the mined-out area, but
precise measurements showed no significant
anomalies.
The Hollidayboro and the B. & W. minesdiffer chiefly in conditions within the mined-out areas and in the immediate caprock.
The mined-out area at the B. & W. mineis "dry," the caprock is interbedded shale
and siltstone ; at Hollidayboro the mined-out
area is filled with water, the caprock is lime-
stone. The difference in effect on signal
strength between the B. & W. mine and the
Hollidayboro mine was tentatively explained
by the differing conditions of the mined-out
areas. It was thought that perhaps the
electrical discontinuity between bedrock andHollidayboro mine water (an electrolyte)
was not as great as that between bedrock
and air (assuming radio fields were pene-
trating to these depths). However, in elec-
tric logs of nearby drill holes, the shales
above the coal have low electrical resistivi-
ties and therefore could be acting as a
shield to prevent an appreciable amount of a
radio field from reaching the mine-out area.
M. B. Buhle, Illinois State Geological
Survey geologist, made collateral earth re-
sistivity measurements in the Hollidayboro
area. These measurements are made by in-
serting four metal stakes into the ground
(at various spacings to achieve various
depths of penetration) along a line of trav-
erse. From 10 to 200 volts at 18 cycles
per second, at 10 to 200 milliamperes, are
applied to the two outer stakes. Potential
difference is measured between the twoinner stakes and, from these readings, ap-
parent resistivity in ohm-centimeters is cal-
culated using the Wenner formula. 29
Measurements were taken for depths from
10 to 150 feet (maximum depth of coal
130 feet), at five- or ten-foot intervals. Re-
sistivity values in ohm-centimeters at depths
of 50 feet average about 4000, at 75 feet
about 6000, at 100 feet about 7000, and
at 150 feet about 5000. These values are
relatively low and for the most part result
from the high conductivities of the large
29 Wenner, Frank, A method of measuring earth resistivity:
Bur. Standards Sci. Paper 258, July 15, 1914.
GEOLOGIC FEATURES 61
amount of shale in the geologic section. If
these shales act as a shield to radio fields
preventing them from penetrating to the
geologic discontinuity below, then of course
the discontinuity cannot affect signal
strength measured at the surface.
Additional traverses were run over coal
mines in Franklin and Williamson counties.
No signal strength anomalies were recorded
over these mines except in a few question-
able instances where field hazards must be
taken into consideration. Why a signal
anomaly should be present over the B. & W.mined-out area and not over other mined-
out areas needed to be explained. There-
fore the B. & W. coal mine was re-examined.
Re-examination of B. & W. Mine
In the meantime, much had been learned
about field hazards, and close examination
of wire conditions along the traverse pro-
vided a reasonable explanation, other than
geologic, for the intensity anomaly.
Examination of the field intensity chart
recorded between stations 208 and 262 (figs.
37, 38) reveals a good intensity high over
the mined-out area (labeled mine). Signal
strength decreases to the west (toward sta-
tion 208) and to the east (toward station
261), but increases farther east (toward
station 262). Inspection of the wire condi-
tions (noted to the left on the chart) reveals
that four strands of REA wires south of the
road and ten strands of telephone wires
north of the road run along the entire
traverse. Apparently the effect of the wires
on the signal from WSON, Henderson, Ky.,
38 miles east, is a general reduction in in-
tensity, because at the two places where the
wires bend away from the road, signal in-
tensity increases noticeably. The wires, al-
though they are constant for the entire
length of the traverse, bend away from the
road at the mine (increasing signal
strength), and the significance of their tem-
porary bending away from the road was
not previously realized. The probable south-
ern extension of the Ridgeway fault trends
along the east edge of the mine (this
is known from B. & W. mine test holes),
ILLINOIS STATE GEOLOGICAL SURVEY
Fig. 38.—Signal intensity curve run over mined-out area along Illinois Highway 13, Gallatin
County. Mined-out area labeled mine, andplaces where wires bend away from the road
are indicated.
but it could not be confirmed by field inten-
sity measurements because of the strong in-
fluence of the wires.
Because of the premature incorrect cor-
relation between the mine and signal in-
tensity, later anomalies of all types were
carefully analyzed for influence of field
hazards before the cause was attributed to
geologic influence. At the B. & W. mine
a comparatively small mined-out air-filled
area, covered by 95 feet of bedrock and
alluvium, has no recognizable influence on
signal strength measured at the surface. It
is conjecture whether the absence of a sig-
nal anomaly results from the mined-out
area's insignificant influence or on insuffi-
cient depth penetration of the radio field.
62 RADIO WAVE TRANSMISSION
/i
Mahomet (Teays]
bedrock valley
Springfield
SANGA
Middletown bedrock valley
MON I
_l"~
i
m ILLINOIS STATE GEOLOGICAL SURVEY
10 20 30 miles
Fig. 39.—Location of 40-mile traverse along Illinois Highway 54 between Clinton
and Springfield, Illinois. Bedrock valleys are after Horberg, Leland, Bedrocktopography of Illinois: Illinois Geol. Survey Bull. 73, 1950.
SOILS
The Federal Communications Commis-
sion regulations require that standard broad-
cast transmitter locations comply with good
engineering practice. The general require-
ments include the following: 30
A map clearly showing:1. Proposed location.
2. Surrounding business, industrial, residen-
tial, and unpopulated areas.
3. Density and distribution of population.
4. Heights of all tall buildings and other
structures.
5. Location of airports, airways, and other
radio stations.
6. The terrain and types of soil.
30 Standards of good engineering practice concerning stand-
ard broadcast stations 550-1600 kw.: Federal Communica-tions Commission, U. S. Govt. Printing Office, Washington,D.C., pp. 29-30, 1940.
Concerning types of soils the Commis-
sion says:31
The type and condition of the soil or earth
immediately around a site is very important. Im-portant, to an equal extent, is the soil or earth
between the site and the principal area to be
served. Sandy soil is considered the worst type,
with glacial deposits and mineral-ore areas
next. Alluvial, marshy areas, and salt-water
bogs have been found to have the least absorption
of the signal.
In the past, soils have been considered
of prime importance in controlling the value
of conductivity and dielectric constant of
the earth along a signal path. In recent
years, the amount of depth penetration of
radio waves has been revised downward to
^Idem., p. 33.
GEOLOGIC FEATURES 63
include not only the soils but earth material
below.
Terman says:32
The value of conductivity and dielectric con-
stant that is effective for radio waves represents
the average value for a distance below the sur-
face of the earth determined by the depth to
which ground currents of appreciable amplitudeexist. This depth of penetration is commonly onthe order of 5 to 10 feet at frequencies used in
short-wave communication, and 50 or more feet
at broadcast and lower frequencies. As a result,
the earth constants are not particularly sensitive
to conditions existing at the very surface of the
earth, as, for example, recent rainfall.
If conditions, such as recent rainfall, at
the very surface of the earth do not appre-
ciably change the value of conductivity and
dielectric constant, then soils, the thickness
of which in temperate latitudes ranges from
a few inches to several feet, should also
cause little appreciable change.
Soil Influence on Signal Strength
Forty-mile traverses were run between
Clinton and Springfield, 111., along Fed-
eral Highway 54. Soil survey maps 33 are
available for the three counties crossed by
the traverse. The first traverse was run
along a radial using the signal from WCVS,Springfield ; the second, approximately along
an arc using WSIV, Pekin (fig. 39).
More than 20 soil types, including sandy
soils, are crossed and recrossed along the
40-mile traverses, but at no place is there
an indication of a signal anomaly that can
be construed to be related to the various
soil types. Part of a recorded curve, chosen
because it crosses several soil type bound-
aries in a short distance and because no
wires or other field hazards are recognized,
shows an almost constant signal intensity
(fig. 40). This curve, representing a dis-
tance of 1 mile, runs 4 to 3 miles south-
west of Kenny, DeWitt County, and is a
segment of the continuous curve for 40
miles. The specific soil types traversed are
indicated by patterns at the side of the
chart.
From the soil report of DeWitt County, 34
32 Terman. op. cit., p. 709.33 Soil reports of DeWitt, Logan, and Sangamon counties
:
Univ. of Illinois Agr. Expt. Sta., Urbana. Illinois.34 Smith, G. D., and Smith, L. H., DeWitt County soils:
Saline valley in Saline County, 111. Somesignal anomalies were recorded near the po-
sition of the bedrock valley and its tribu-
taries, but present drainage, geologic struc-
tures, and field hazards nearly coincide with
the bedrock valleys and leave the true source
of the anomalies uncertain.
Additional investigation is needed to de-
termine the effect on signal intensity of thick-
ness of cover over bedrock. A possible ap-
proach might be to energize electromag-
netically a selected bedrock stratum and
then measure the signal intensity over the
energized area to find out if there are differ-
ences in signal strength caused by differences
in thickness of the overburden.
CHAPTER 9— SUMMARY AND CONCLUSIONS
This is a report on a preliminary investi-
gation of features that affect radio field
intensity in the ground-wave area at stand-
ard broadcast frequencies. Theoretical con-
siderations of field intensity behavior have
been treated only superficially, and pri-
mary attention has been given to sig-
nal strength behavior in the field. Hun-dreds of miles of traverses were run in Illi-
nois and immediately adjacent areas, meas-
uring and automatically recording signal in-
tensity. These traverses were run chiefly
in areas of known field hazard and geologic
conditions. Experimental data were gath-
ered on field strength behavior in the pres-
ence of cultural and natural features.
These data were examined and evaluated for
a cause-and-effect relationship between cul-
tural and natural features and signal in-
tensity anomalies.
The conclusions may be summarized as
follows
:
1. From the present and previous work
it appears that radio waves penetrate bed-
rock. Numerous instances of penetration
up to 1000 feet have been reported, and in
one instance 6000 feet of quartzite was re-
ported to have been penetrated by a signal
from a 10-watt transmitter between 100 and
300 kc.
2. Satisfactory reconnaissance field in-
tensity surveys can be made using battery
portable and automobile radios by meas-
uring variations of the intermediate fre-
quency voltage.
3. Portable field equipment, capable of
reliable detailed field intensity measure-
ments, was developed for this investigation
and proved satisfactory. It consists of an
RCA 308-B field intensity meter with a
bidirectional shielded loop antenna, a vibra-
tor power supply for the 308-B meter, and
an Esterline-Angus model A-W graphic re-
corder, driven by a Clark cable drive from
a tee in the speedometer cable of the trans-
porting vehicle. This equipment, suitably
shock-mounted in a wooden-bodied station
wagon, withstands rough field treatment.
An improvement in this instrumentation
would be incorporation of a device that
automatically orients the shielded loop an-
tenna in the direction of maximum signal
intensity.
4. Continuous signal intensity measure-
ments in the field have shown that spot read-
ings, taken at large intervals along a trav-
erse and without regard for field hazards,
can be misleading.
5. The laboratory attenuation tests on
diamond drill cores, although possibly indic-
ative of electromagnetic conductivities of
rocks, are not conclusive because of the
great difference between laboratory and field
conditions.
6. In field measurements, relative signal
intensity curves, which are similar to ac-
tual field intensity curves, were used
throughout most of the investigation be-
cause they require less calibration and set-
up time and thus make possible the survey-
ing of greater areas more rapidly.
7. Field notes are best kept on the paper
chart of the recorder so that all the perti-
nent data are in one convenient place. Field
notes should include date, time, weather,
station used (frequency, power, direction,
and distance from traverse), notes on geo-
graphical orientation, on associated field
hazards, and on signal anomalies, whether
caused by obvious field hazards or by un-
known features.
8. Signals to be measured should be se-
lected well within their ground-wave areas.
A weak (250 to 1000 watt) signal from
nearby (5 to 50 miles, depending upon fre-
quency) is to be preferred to a strong (5000
to 50,000 watt) signal because the weaker
signal is more affected by a geologic discon-
tinuity than a strong signal, which tends to
overcome the discontinuity and minimize the
signal anomaly.
9. The most common field hazards in
Illinois are wires; overhead electric (REA)and telephone wires almost invariably cause
[67]
68 RADIO WAVE TRANSMISSION
strong signal anomalies. These anomalies
are usually sharp decreases in intensity, but
rarely they are sharp increases. Wires paral-
lel to a traverse commonly decrease the
general signal intensity level along the en-
tire traverse. Other field hazards that affect
signal intensity similarly are bridges, rail-
road tracks, metal structures (towers and
buildings), fences, and pipelines.
Anomalies caused by streams are usually
sharp (either increase or decrease), but of
relatively small magnitude.
Individual trees have little if any effect
on signal intensity at broadcast frequencies.
Wooded areas, if large enough, some-
times cause shadow effects, and signal level
decreases when the woods lie between the
radio station and the point of measurement
if the point of measurement is within 100
feet of the woods. Woods affect high fre-
quency signals more than signals at low
frequencies.
Topography as a field hazard in Illinois
can be almost disregarded. Large hills are
the only important topographic features
that influence signal intensity. This influ-
ence is observed only when the hill is inter-
posed directly between the radio station
and the point of measurement, and if the
point of measurement is within a few tens
of feet from the hill.
Many field hazards that can seriously
affect field intensity measurements may be
recognized, therefore making it possible to
evaluate the amount of geologic influence.
10. For any period up to six hours during
the daytime, under relatively constant
weather conditions, meteorological effects
on ground-wave signal intensity appear to
be negligible.
11. The Shawneetown - Rough Creek
fault in Illinois and Kentucky and the In-
man East fault in Illinois are apparently
responsible for signal strength anomalies on
traverses across them. Lithologic discon-
tinuity probably causes a discontinuity in
electromagnetic waves and is reflected in
signal strength behavior. It would therefore
appear feasible to map similar features by
this technique.
12. Signal strength is affected near the
Kentland quarries in the cryptovolcanic
structure in northwestern Indiana. It in-
creases for signals originating on Ordovi-
cian, Silurian, or Devonian terrain, but does
not change for signals originating on Penn-
sylvanian terrain.
13. Signal intensity decreases over the
core of Hicks dome in Hardin County, 111.
The signal, transmitted from Pennsylvanian
terrain, decreased in strength as the dip-
ping rocks were traversed from younger
to older towards the core. It is expected
that similar lithologic contrasts elsewhere
can be mapped by this method.
14. Data from the traverses across
known geologic features (11, 12, 13) sug-
gest that part of a radio field may be trans-
mitted or propagated by or along bedrock
strata. Signal intensity is high over the
Inman East fault. Here, the West Frank-
lin limestone may be carrying some of the
radio field from Evansville, Ind.
In the Kentland area in Indiana, part
of the radio field appears to enter the
cryptovolcanic structure along Ordovician,
Silurian, and Devonian bedrock, thus in-
creasing signal intensity measurably over
the regional level.
At Hicks dome, signal intensity decreases
over the older beds across the core of the
dome. A signal, originating on Pennsjl-
vanian terrain, was stronger over Pennsyl-
vanian rocks around the flanks of the dome
than it was over the Devonian and Mis-
sissippian rocks across the dome.
Signal strength behavior becomes more
understandable if, in addition to atmos-
pheric propagation, transmission along bed-
rock is postulated. Apparently limestone
with high electrical resistivity offers a path
for radio energy along which attenuation is
less than it is along shales, siltstones, or
sandstones. It seems probable that certain
bedrock strata may act as wave-guides.
15. In the Galena area in Illinois no sig-
nal anomalies can be attributed solely to the
influence of the poorly conductive zinc ore
mineral sphalerite. A rich concentration of
pyrite and marcasite at shallow depths
caused at least one strong signal anomaly
(decrease in strength). Signal anomalies
over the Kittoe ore body are attributed at
least in part to the conductive minerals
SUMMARY AND CONCLUSIONS 69
iiipillt^
^ '->";•<»> ^"i m
^W^Vs:
ililiiiiiMll
70 RADIO WAVE TRANSMISSION
associated with the ore at shallow depths.
The Maquoketa shale in the Galena area
and some Pennsylvanian shales in southern
Illinois appear to act as shields to radio
fields, thereby preventing penetration to the
strata beneath the shales.
16. Soils developed on glacial till, or on
loess overlying glacial till, appear to have
little if any influence on signal intensity.
17. Depth to bedrock may influence sig-
nal strength in some places, but the kind
and amount of influence has not yet been
satisfactorily determined. Several traverses
crossed bedrock valleys where depth to bed-
rock is known to be variable, but the signal
anomalies cannot be attributed solely to
changes in depth to bedrock.
The same is true of sand and gravel de-
posits in glacial drift ; traverses run over
known deposits sometimes produce signal
anomalies but cannot be attributed solely
to the influence of the deposits on signal in-
tensity.
18. Where the geology offers discontinu-
ities to electromagnetic waves, and field
hazards are few, radio field intensity sur-
veying offers promise of a rapid and eco-
nomical means of getting data to construct
reconnaissance geological maps. The step-
like character of the intensity curve record-
ed across the flank of Hicks Dome is an
example, and this kind of surveying should
be applicable in any area where bedrock
is within 50-100 feet of the surface and
field hazards are few. If overwhelming field
hazards along roads are unavoidable, the
method could be tried by boat down rivers
and streams. Intensity surveying from a
slow, low-flying aircraft, above field haz-
ards, could be tried.
19. In general, when transmitting and
receiving antennas are on (or close to) the
same rock strata, reception is best.
20. Direct electromagnetic energization
of highly electrically resistant strata might
be attempted. A section thus energized
might be traced (in drill holes if necessary)
to determine areal extent, structure, con-
ductive ore deposits, and lithologic changes
such as reefs. It is possible that a system
of underground communication could be es-
tablished which would prove practical under
special circumstances.
21. Knowledge of the behavior of radio
waves over, along, and through bedrock can
aid in the selection of good locations for
various types of radio communication equip-
ment.
22. Further study of radio wave inten-
sity and polarization, related to geologic
structure, is needed to help resolve the
method.
APPENDIX A
FCC GROUND CONDUCTIVITY MAP OF THE U.S.
A ground conductivity map 1 prepared
in 1938 by the Broadcast Division of the
Bureau of Engineering of the Federal Com-munications Commission, agrees remarkably
well with the geological map of the United
States (fig. 41). This agreement led to
conjecture about the relationship between
geology and radio wave transmission and
was the starting point of the present work.
Communication with T. J. Slowie 2re-
vealed how the map was made. Field in-
tensity measurements, taken by major broad-
casting companies, individual stations, and
the FCC staff, were examined for their asso-
ciation with soil types, geologic formations,
topography, and vegetation. At that time
there were comparatively few measurements,
particularly over large distances, and ground
conductivities for such areas were approxi-
mated from the values that soil types, geo-
logic formations, topography, and vegeta-
tion exhibited in other areas where conduc-
tivities were known by actual measurement.
In the preparation of the map, reference wasmade to the U. S. Geological Survey's
Geologic Map of the United States and
several "Soil Regions" maps of the U. S.
Department of Agriculture.
The FCC has found discrepancies in cer-
tain areas. The most significant errors have
been where conductivity estimates were
1 Standards of good engineering practice, op. cit., Fig. 3.2 Slowie, T. J., Secretary of the FCC, Washington, D.C.,
1949.
made for restricted areas. Thus, conduc-
tivity along ridges in a mountainous region
may be considerably less than estimated on
the map; along the axes of valleys conduc-
tivity may be far greater than estimated. In
general the map has been accurate, and the
abundant conductivity data collected be-
tween 1938-1949 has not required any ma-
jor revision.
Analysis of Map
Ground conductivity is expressed in elec-
tromagnetic units (emu) ; 1 X 10"14 emurepresents poor conductivity and 30 X 10~14
emu, good conductivity. Analysis of the
ground conductivity areas of the map was
made for the age of rocks outcropping in
them.
Ground conductivity values for rocks of
all ages were tabulated by outcrop areas,
and an average conductivity value was esti-
mated for each geological period. For pre-
Cambrian and intrusive rocks, conductivity
is low (3 X 10"14 emu) ; conductivity in-
creases through the successive periods of the
Paleozoic reaching a high of 15 X 10"14 emuin Permian outcrop areas ; averages 7 X 10~14
emu for Triassic and Jurassic rocks ; is 10 X10 14 emu for Lower Cretaceous and reaches
a high of 20 X 10 14 emu for Upper Cretace-
ous rocks; Eocene rocks average 14 X 10"14
emu, Oligocene 5 X 10 14 emu, and Miocene
and Pliocene average 7 X 10"14 emu in their
outcrop areas.
[71]
APPENDIX B
GLOSSARY OF RADIO TERMS
Absorption—The loss of energy from a wave bydissipation in propagation through or adja-cent to a dissipative medium.
Atmospheric noise—Noise caused by natural elec-
trical discharges in the atmosphere (also called
"static").
Attenuation—Of a wave, the decrease in dis-
placement with distance in the direction of
propagation. If the attenuation varies withfrequency, it is defined for a sinusoidal waveof a certain frequency and of constant ampli-tude at any point. The attenuation of a wavemay be defined relative to the attenuation in
some ideal conditions such as in free spaceor over a perfectly conducting plane.
Conduction of current— 1. Metallic: conductiondue to the movement of free electrons. 2.
Electrolytic: conduction from the transport
of ions in electrolytes. 3. Dielectric: no free
electrons available.
Conductivity of earth materials—Good, 10 x10"14 emu and above; intermediate, about 5 x
10 14 emu; poor, 1.0 x 10"14 emu. Specific rocks
and minerals may be divided into three groupsas to resistivity: Good conductivity, 10"6 to
10 ohm-centimeters; intermediate, 10 2 to 10°
ohm-centimeters; poor, 1010 to 1017 ohm-centi-
meters.
db.—Zero decibel is the threshold of hearing, 60
db. is the level of ordinary conversation, and120 db. is the level of thunder.
Dielectric—Nonconducting for direct current, aninsulating medium such as air, glass, oil, ormica, but will conduct alternating current.
Dielectric constant—The presence of a dielectric
other than a vacuum raises the capacity of a
condenser in comparison to its capacity in the
absence of the dielectric by a factor known as
the dielectric constant. The dielectric constant
of air is 1 and sea water is 81.
Displacement—A change in a medium, propor-tional to the square root of the stored energyof a certain kind. It is exemplified by compres-sion in a sound wave and by electric or mag-netic flux density in an electromagnetic wave.
Electromagnetic wave—A wave in which there
are both electric and magnetic displacements.Electromagnetic waves are known as radiowaves, heat rays, light, X-rays, etc., dependingon the frequency.
emu—Electromagnetic cgs units. The electro-
magnetic system of cgs units (abbreviatedemu) results if one uses centimeters, grams,and seconds, and then arbitrarily assumes that
the magnetic permeance of a centimeter cubein a vacuum is unity.
Fading—The variation of radio field intensity
caused by changes in the transmission medium.
Field—Open country, woods, swamps, hills,
rolling land, place of outdoor operations in
geologic and geophysical investigations.
Field—A portion of space controlled or affected
by a force.
Ground reflected wave—The component of theground-wave that is reflected from the ground.
Ground-wave—A radio wave that is propagatedover the earth and is ordinarily affected by thepresence of the ground. The ground-wave in-
cludes all components of a radio wave overthe earth except ionospheric waves and trop-
ospheric waves. The ground-wave is some-what refracted by the normal gradient of thedielectric constant of the lower atmosphere.
Guided wave—A wave whose propagation is
concentrated in certain directions within ornear boundaries between materials of different
properties located in a path between twoplaces.
I.F.—Intermediate frequency.
Ionosphere—That part of the earth's atmosphereabove the lowest level at which the ionization
is large compared with that at the ground, so
that it affects the transmission of radio waves.(Experiments indicate that this lowest level
is about 50 kilometers above the earth's sur-
face.)
Ionospheric wave (sky-wave)—A radio wavethat is propagated by reflection from the
ionosphere ; sometimes called a sky-wave.
Noise—Rushing, crackling, popping sound heardin a receiver.
Noise level—Amount of noise with relation to the
signal being received ; signal to noise ratio.
Plane-earth attenuation—The attenuation overan imperfectly conducting plane-earth in ex-
cess of that over a perfectly conducting plane.
Radio field—Wave energy from an antenna withthe following properties measurable: The po-
tential of the field, the potential gradient or
intensity of the field, and the direction andpolarization of the field.
Radio field intensity, radio wave intensity, field
strength, signal strength—The electric or mag-netic field intensity at a given location resulting
from the passage of radio waves. It is com-monly expressed in terms of the electric field
intensity. Unless otherwise stated, it is taken
in the direction of maximum field intensity.
Radio frequency—A frequency at which electro-
magnetic radiation of energy is useful for
communication purposes. (The present useful
limits of radio frequencies are roughly 10 kilo-
cycles to 10,000 megacycles.)
[72]
APPENDIX B 73
Radio interference—An undesired disturbance in
reception, or that which causes the disturbance.
It may be a disturbance in the radio trans-
mitter, the transmission medium, or the radio
receiver. Examples are: Background inter-
ference in the transmitter, undesired electro-
magnetic disturbance in the transmission me-dium as by lightning or undesired radio waves,and hum or thermal agitation in the receiver.
Radio wave propagation—The transfer of energy
by electromagnetic radiation at radio frequen-
cies.
Reflected wave—The wave caused by the reflec-
tion of part of an incident wave back into the
first medium.
Refracted wave—The wave caused by the re-
fraction of the part of an incident wave whichtravels into the second medium.
Resistance—The opposition to a steady electron
flow.
Secondary fields—Eddy currents.
Sinusoidal wave—A wave whose displacementis the sine (or cosine) of an angle propor-tional to time or distance or both.
Spherical-earth attenuation—The attenuation
over a perfectly conducting spherical-earth in
excess of that over a perfectly conductingplane.
Transverse electromagnetic wave—An electro-
magnetic wave in which both electric and mag-netic displacements are transverse to the direc-
tion of propagation; called a TEM wave.
Troposphere—That part of the earth's atmos-phere in which temperature generally de-
creases with altitude, clouds form, and con-vection is active. (Experiments indicate that
the troposphere occupies the space above the
earth's surface to a height of about 10 kilo-
meters.)
Tropospheric wave—A radio wave that is prop-agated by reflection from a place of abruptchange in the dielectric constant or its gradientwith position in the troposphere.
Wave—A disturbance propagated through a
medium. Also, the graphical representation of
a wave or of any periodic variation.
Wave duct—A wave guide with tabular bound-aries capable of concentrating the propagationof waves within its boundaries.
Wave-guide—A system of material boundariescapable of guiding waves.
Wave length—In a periodic wave, the distance
between corresponding phases of two consecu-
tive cycles. It is equal to the quotient of phasevelocity by frequency.


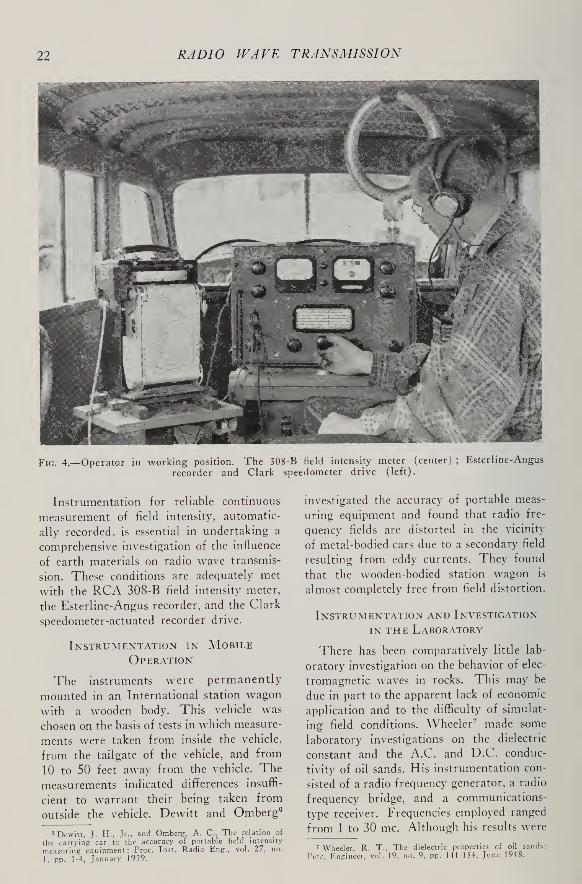


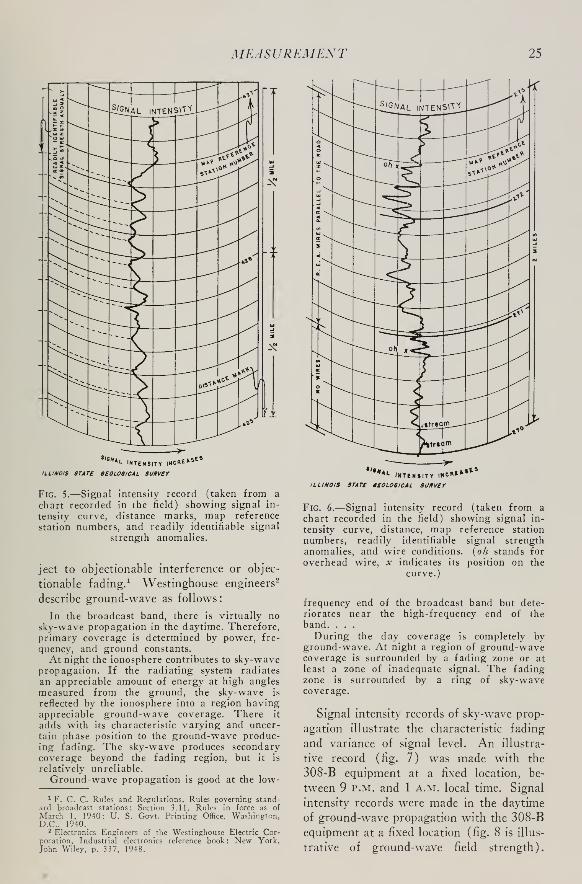
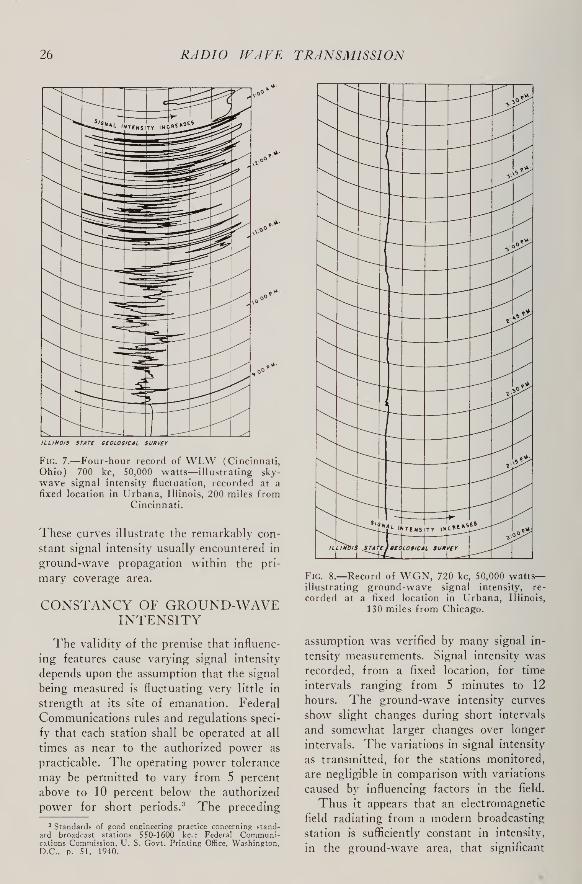


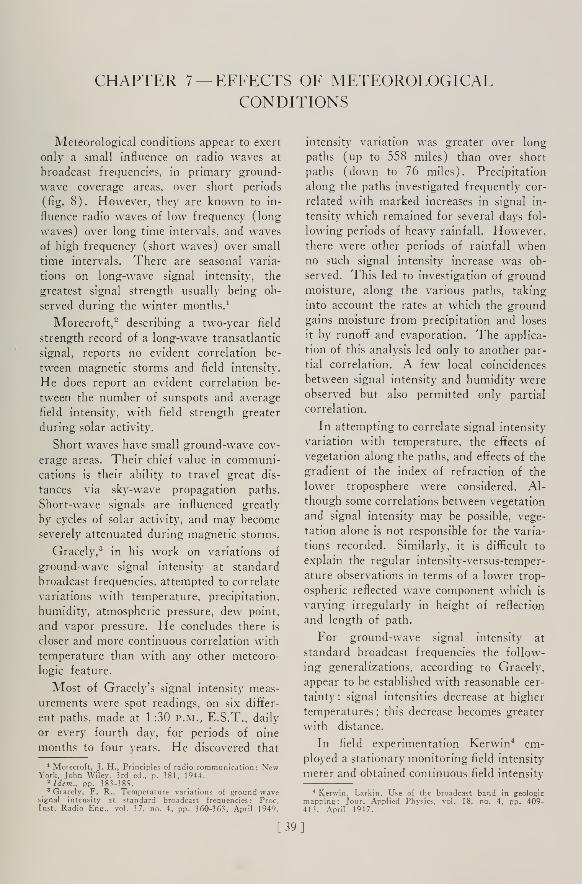

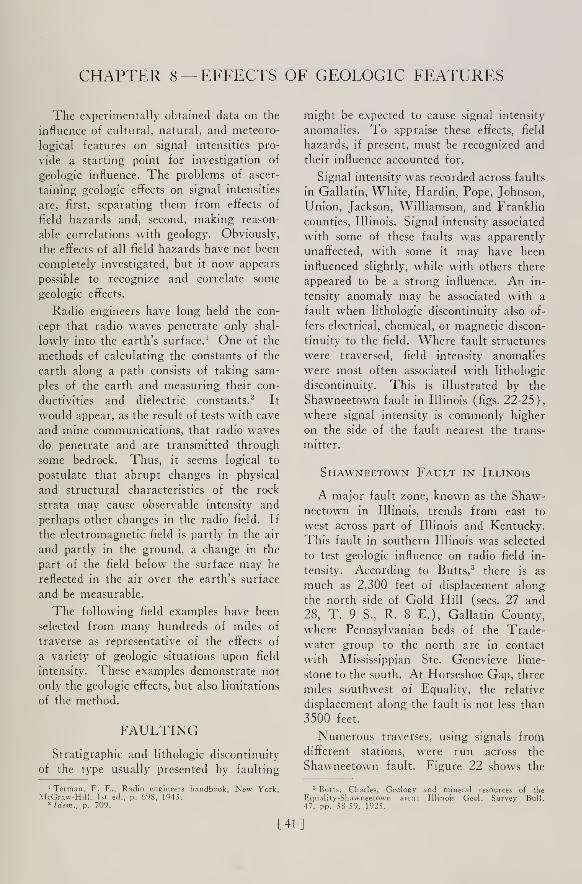


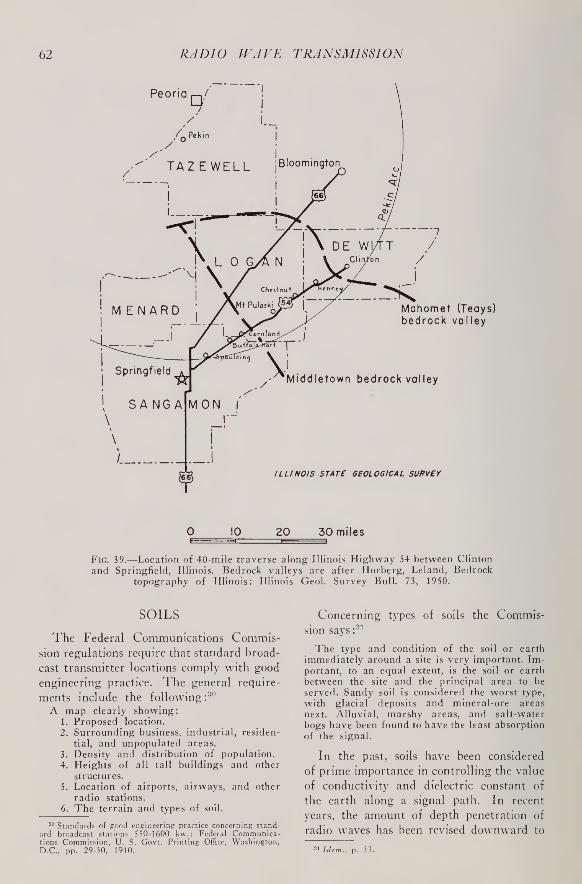


![RADIAL-FLOW WAVE ROTOR CONCEPTS, UNCONVENTIONAL …...rotor prototypes for propulsion applications [12, 13]. Mathematical Science Northwest (MSNW) also studied various aspects of wave](https://static.documents.pub/doc/80x56/5e7eeb9e4379aa3531764378/radial-flow-wave-rotor-concepts-unconventional-rotor-prototypes-for-propulsion.jpg)


