doi: 10.1130/2012.2489(03) 2012;489;49-72Geological Society of America Special Papers
Carol M. Dehler, Susannah M. Porter and J. Michael Timmons CanyonThe Neoproterozoic Earth system revealed from the Chuar Group of Grand
Email alerting servicescite this article
to receive free e-mail alerts when new articleswww.gsapubs.org/cgi/alertsclick
SubscribeAmerica Special Papers
to subscribe to Geological Society ofwww.gsapubs.org/subscriptions/click
Permission request to contact GSAhttp://www.geosociety.org/pubs/copyrt.htm#gsaclick
viewpoint. Opinions presented in this publication do not reflect official positions of the Society.positions by scientists worldwide, regardless of their race, citizenship, gender, religion, or politicalarticle's full citation. GSA provides this and other forums for the presentation of diverse opinions and articles on their own or their organization's Web site providing the posting includes a reference to thescience. This file may not be posted to any Web site, but authors may post the abstracts only of their unlimited copies of items in GSA's journals for noncommercial use in classrooms to further education andto use a single figure, a single table, and/or a brief paragraph of text in subsequent works and to make
GSA,employment. Individual scientists are hereby granted permission, without fees or further requests to Copyright not claimed on content prepared wholly by U.S. government employees within scope of their
The Chuar Group is known today for its beautiful patterns of Martian-like colors, most commonly seen from the air or the canyon rims. Now far inboard from the ocean and framed within the eastern Grand Canyon, it is hard to imagine that these strata represent part of a calm ocean inlet near the equator during Neo-proterozoic time. Field geologic data indicate that the Chuar sea was affected by tides and waves and was in a seismically active basin. The repetitions in stratigraphic patterns indicate that sea level slowly rose and fell in tempo with global changes in cli-mate. Although animals would not appear for another ~200 mil-lion years (m.y.) and land plants for another ~300 m.y., fossil data show that these shallow ocean waters were teeming with single-celled life, most of it microscopic. This is the scenario, ca. 750 Ma (mega-annum, or millions of years ago), that is revealed from recent research on the striking strata of the Chuar Group in eastern Grand Canyon.
Ongoing and recent research on Chuar Group rocks not only provides insight about the Chuar basin, but it also contributes to our understanding of the greater Earth system during mid- Neoproterozoic time. Tectonic, stratigraphic, sedimentologic, geochemical, and paleontologic studies of the Chuar Group cor-
roborate data from rock units around the world, suggesting that at this time the supercontinent Rodinia was breaking up, Earth’s cli-mate was undergoing glacial and interglacial cycles, there were massive perturbations to the global carbon cycle, and single-celled protists were diversifying. Its rich, well-preserved record is one of the few well-dated successions of this time period, mak-ing the Chuar Group a world-class “type section” for this pivotal interval in Earth system history (Karlstrom et al., 2000). Here we present an overview of current knowledge on the environmental, climatic, biological, and tectonic context of the Chuar landscape as it was ~800–740 m.y. ago and discuss how the Chuar Group rock record has implications for global change during this time.
GEOLOGIC BACKGROUND
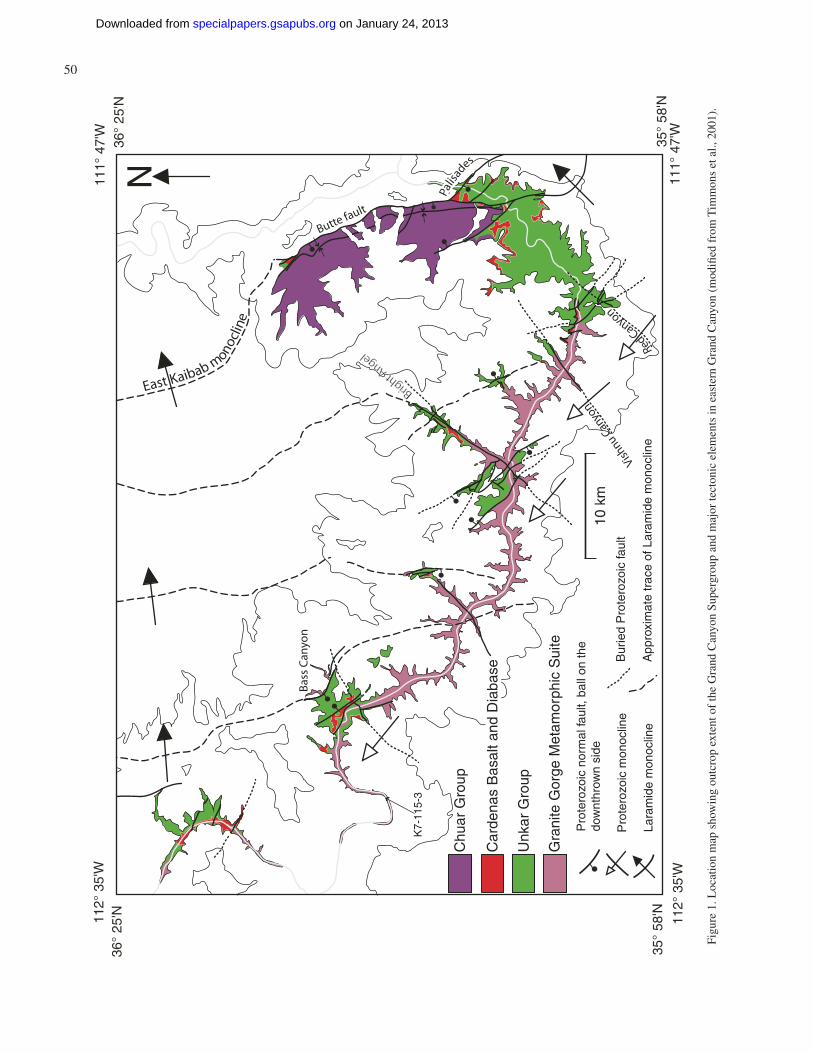
The Chuar Group is exposed exclusively in several right-bank, east-fl owing tributaries to the Colorado River in eastern Grand Canyon, Arizona, USA (Fig. 1; Sheet 1, map on inserts accompanying this volume1). This exposure is bounded on the east by the Butte fault zone (East Kaibab monocline system), and on all other sides by the “Great Unconformity” marked by the overlying Cambrian Tapeats Sandstone (Fig. 2). Locally, the Chuar Group is overlain by the Neoproterozoic Sixtymile
1Geologic Map of Eastern Grand Canyon, Arizona is also available as GSA Data Repository Item 2012287, online at www.geosociety.org/pubs/ft2012.htm, or on request from [email protected] or Documents Secretary, GSA, P.O. Box 9140, Boulder, CO 80301-9140, USA.
on January 24, 2013specialpapers.gsapubs.orgDownloaded from
interbedded sandstone and(or) siltstone beds <1 m thick
dolomite and (or) silty dolomitebeds typically <1 m thick
unconformity
large mudcrack
large cross-beds
denotes diagnostic tidal feature
paleochannel
prolonged subaerial exposure
acritarch
*
variegated and black mudrocks
basal red sandstone
C
742±6 Ma
200
100
0
met
ers
NANKOWEAPFORMATION
1070±70 Ma
?
Neo
x x x
Stratifera/Inzeria
Tanner dolomite
Baicalia
polygonal marker bed
white sandstone
flaky dolomite
upper dolomite coupletlower dolomite couplet
karsted dolomite?
CH
UA
R G
RO
UP
UN
KA
R G
RO
UP
GR
AN
D C
AN
YO
N S
UP
ER
GR
OU
Pcr
ysta
llin
eb
asem
ent
Nko
. F
mS
ix.
Fm
.
400
m
TontoGp.
mr-varmr-darkss-lam
d-crse
Inzeria
mr-varmr-darkss-lamdol-masdol-lam
Baic
mr-varmr-darkss-lam
mr-varmr-darkss-1dol-masdol-lam
ss-1&2
mr-varss-1
mr-varss-1dol-masdol-lamBa-Box
mr-dark
flakydol.
mr-darkdol-masdol-lampis/ooid
FA
CIE
S
dis
tal s
ub
tid
al
pro
xim
al s
ub
tid
al
inte
rtid
alsu
pra
tid
al
PALEO-ENVIRONMENT
Sixtymile Fm
Wal
cott
Mem
ber
Aw
atu
bi
Mem
ber
Kw
agu
nt
Fo
rmat
ion
Car
bo
n B
utt
e M
br Baicalia-Boxonia
Du
pp
aM
emb
erC
arb
on
Can
yon
Mem
ber
GA
LE
RO
S F
OR
MA
TIO
NCH
UA
R G
RO
UP
Mid
dle
Neo
pro
tero
zoic
Jup
iter
Mem
ber
Tan
ner
Mem
ber
(U
PP
ER
)C
AR
DE
NA
S B
AS
AL
T
UN
KA
RG
RO
UP
Mes
op
rote
rozo
ic
*
*
*
**
(Basal) TapeatsSandstone
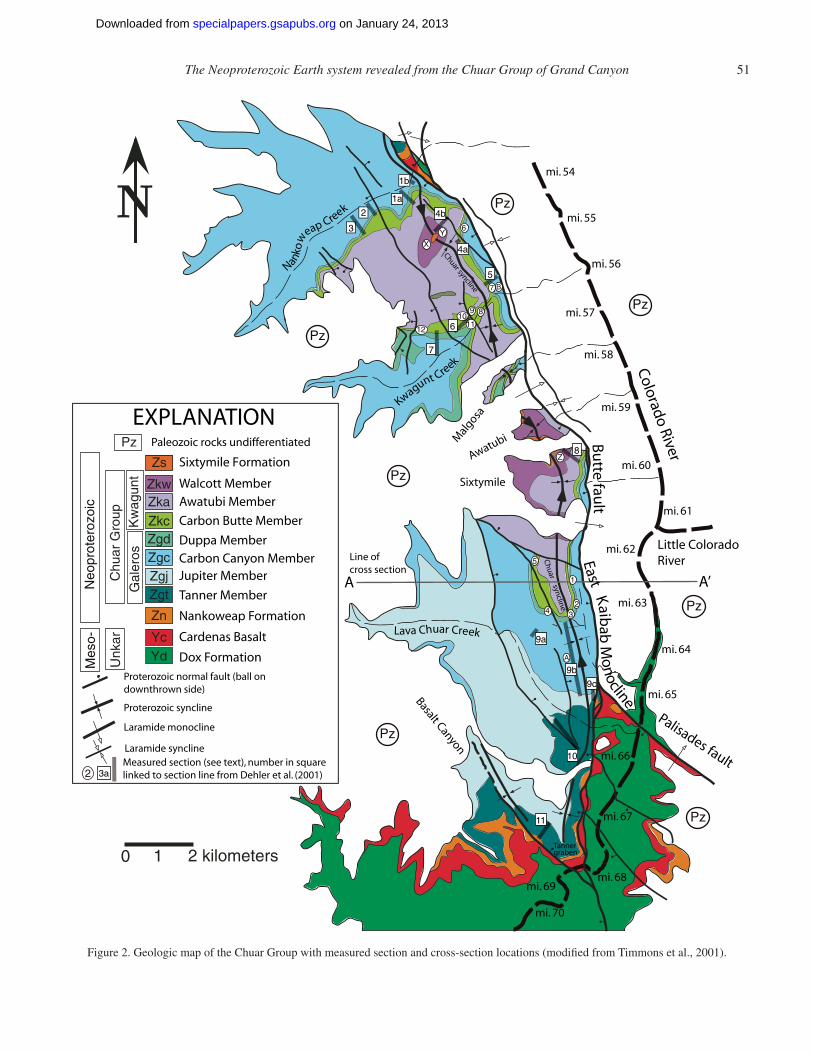
Figure 3. Generalized stratigraphic column (on left) of the Chuar Group, showing relationships with underlying and overlying units. To right, composite measured section of the Chuar Group, including facies interpretations from Dehler et al. (2001).
on January 24, 2013specialpapers.gsapubs.orgDownloaded from
The Neoproterozoic Earth system revealed from the Chuar Group of Grand Canyon 53
Formation and rests upon the Nankoweap Formation (Figs. 2 and 3). These strata are gently folded by the north-trending Chuar syncline, which parallels the trace of the Butte fault (Figs. 1 and 2). The Chuar Group is also present in the subsurface along the Arizona-Utah border where three wells have penetrated as much as 700 m of Chuaria-bearing mudrock interbedded with dolomite and sandstone (Rauzi, 1990; Wiley et al., 1998). Chuar strata equivalents are found regionally in northern Utah (Uinta Mountain Group and Big Cottonwood Formation), in Death Val-ley, California (middle Pahrump Group), and in northern Canada (Little Dal and Coates Lake Groups; Link et al., 1993; Dehler et al., 2001, 2010; Dehler, 2008). Strata of Chuar age are found on most continents; the Australian equivalents may be closely related to the Chuar Group, as these two continents may have been juxtaposed during deposition (Karlstrom et al., 1999).
The Chuar Group is a 1600-m-thick, apparently conform-able, fossiliferous, unmetamorphosed succession composed of ~85% mudrock, with interbedded meter-thick sandstone and dolomite beds (Fig. 3). It makes up most of the upper Grand Can-yon Supergroup and is subdivided into the Galeros Formation (lower) and the Kwagunt Formation (upper), with the contact at the base of the prominent, thick sandstone unit of the Carbon Butte Member (Ford and Breed, 1973a) (Fig. 3). The Galeros Formation is further divided into the Tanner, Jupiter, Carbon Canyon, and Duppa Members; the Kwagunt Formation is divided into the Carbon Butte, Awatubi, and Walcott Members (Ford and Breed, 1973a).
Multiple data sets collectively indicate that the Chuar Group is mid-Neoproterozoic in age (ca. 800–742 Ma). The age of the basal Chuar Group is constrained by preliminary U-Pb analyses of diagenetic monazite in the Tanner Member that indicate that the base of the Chuar Group is ca. 800 Ma (Williams et al., 2003). A direct age for the top of the Chuar Group comes from a U-Pb zir-con date from an ash bed of 742 ± 6 Ma (Karlstrom et al., 2000). Chuar Group paleomagnetic data, which record the original mag-netization of the rocks acquired during their deposition and thus their latitude at that time, correlate with other Neoproterozoic successions from North America, indicating that Chuar deposi-tion occurred between ca. 850 and ca. 740 Ma at paleolatitudes of 5°–20° north of the equator (Weil et al., 2004). These constraints are consistent with Chuar stromatolites and microfossils, which correlate with middle Neoproterozoic fossiliferous successions elsewhere (Vidal and Knoll, 1983; Vidal and Ford, 1985; Porter and Knoll, 2000; Nagy et al., 2009). Microfossils and carbon-isotope composition suggest robust correlation with the Red Pine Shale, Uinta Mountain Group, Utah, which is known to be no older than 770 Ma on the basis of detrital zircons in an informal formation lower in the group (Dehler et al., 2007, 2010).
THE CHUAR SEA
Research on the Chuar Group strata started in the late 1800s and continues today. Charles D. Walcott was the fi rst to study the stratigraphy and paleontology of the Chuar Group, in the 1880s
and 1890s. He described the Chuar “terrane,” discovered and named the microfossil Chuaria circularis, and noted the pres-ence of stromatolites (Walcott, 1894, 1899). A more recent com-prehensive study of the Chuar Group strata was conducted in the late 1960s and early 1970s (Ford and Breed, 1973b and refer-ences therein), yielding information on the general stratigraphic, sedimentologic, and paleontologic characteristics. These workers and most others have interpreted all or part of the Chuar Group to represent a nearshore protected marine setting (Cook, 1991; Dehler et al., 2001; Ford and Dehler, 2003; Vogel et al., 2005).
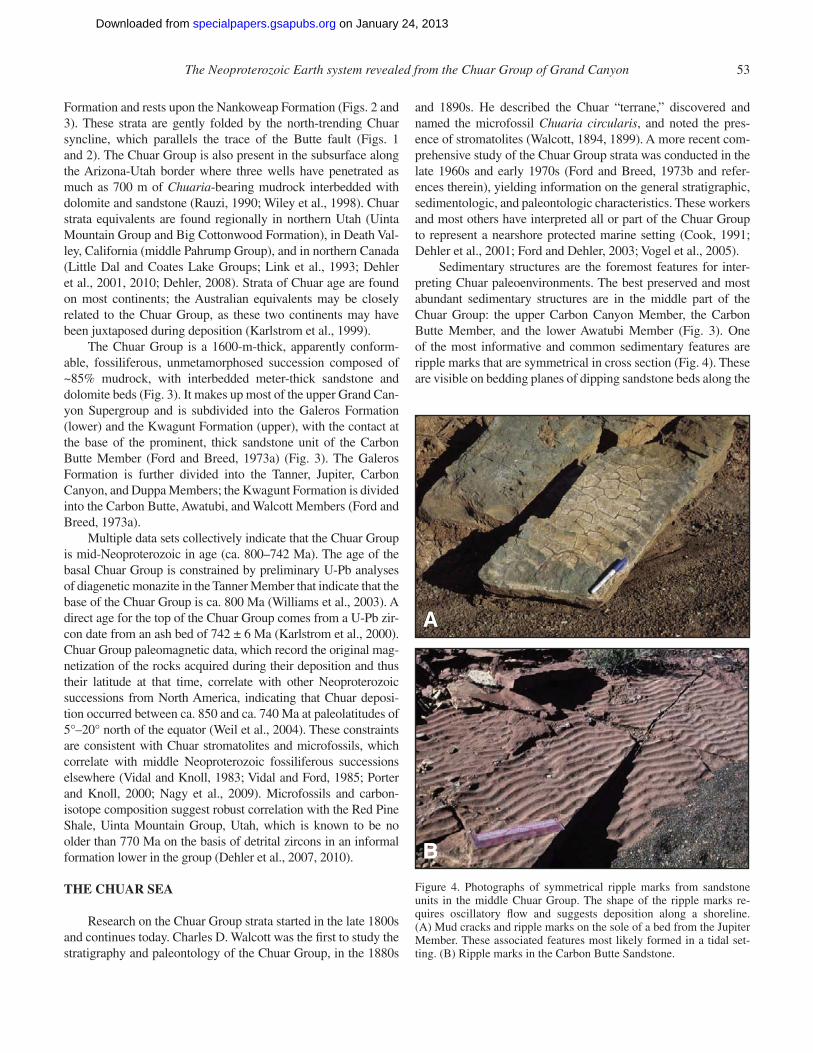
Sedimentary structures are the foremost features for inter-preting Chuar paleoenvironments. The best preserved and most abundant sedimentary structures are in the middle part of the Chuar Group: the upper Carbon Canyon Member, the Carbon Butte Member, and the lower Awatubi Member (Fig. 3). One of the most informative and common sedimentary features are ripple marks that are symmetrical in cross section (Fig. 4). These are visible on bedding planes of dipping sandstone beds along the
AA
B
A
B
Figure 4. Photographs of symmetrical ripple marks from sandstone units in the middle Chuar Group. The shape of the ripple marks re-quires oscillatory fl ow and suggests deposition along a shoreline. (A) Mud cracks and ripple marks on the sole of a bed from the Jupiter Member. These associated features most likely formed in a tidal set-ting. (B) Ripple marks in the Carbon Butte Sandstone.
on January 24, 2013specialpapers.gsapubs.orgDownloaded from
Butte fault, especially between Carbon and Lava Chuar Canyons. The symmetrical shape of these ripple marks requires a back-and-forth fl ow of water. Therefore, we know these sediments (silt and sand) were subjected to oscillatory currents within the wave zone along a shoreline. Waves can form in lakes, oceans, and even rivers, so these features alone do not help to pinpoint a specifi c paleoenvironment, yet they do indicate a shoreline set-ting of some sort. However, Chuar ripple marks are commonly draped with a thin veneer of mudstone with mud cracks (Fig. 4). Mud cracks require a wet environment to deposit the mud and a dry environment to dry out and crack the mud. This combination of sedimentary features—ripple marks with mud-cracked mud drapes—requires a continuum of changing physical conditions. The rippled sands require a fast oscillatory current (e.g., fl ood fl ow) that then must be followed by a slow current (e.g., slack water) to deposit the mud. The entire mud-armored ripple mark must then dry out for mud cracks to form (e.g., low tide). By far, the easiest place for this combination of sedimentary features to form, and be preserved in the rock record, is along a tidally infl u-enced (marine) shoreline.
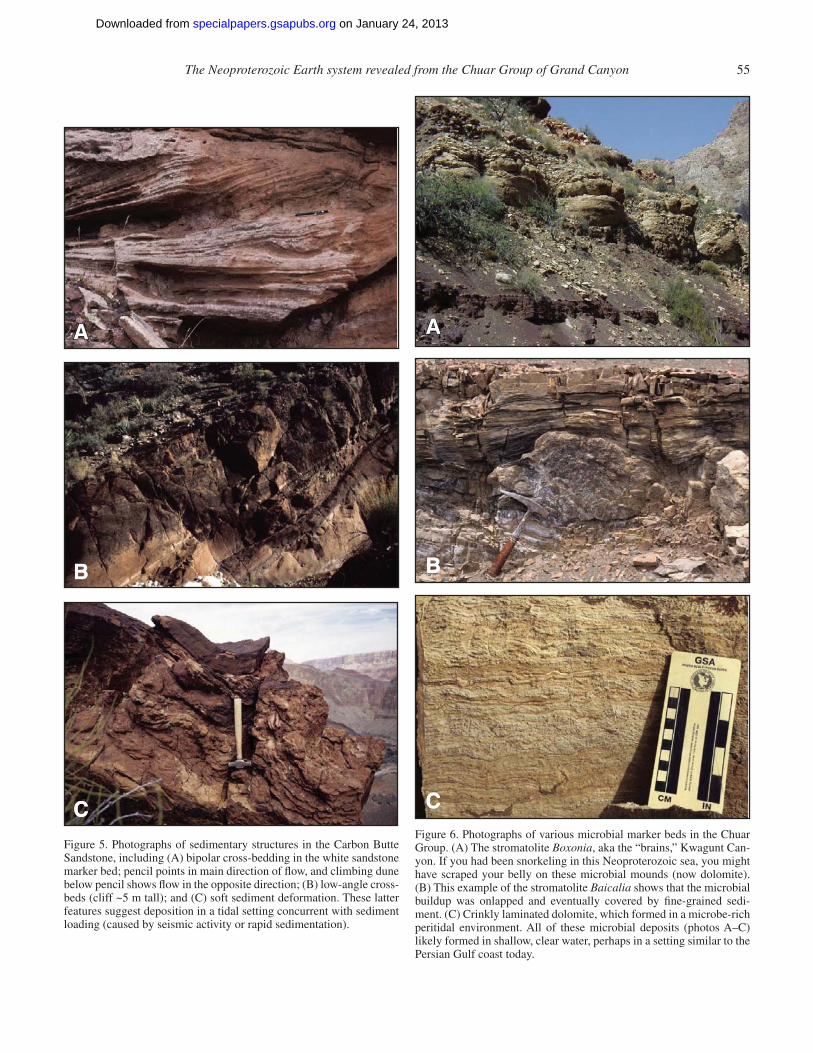
The Carbon Butte Member, marked at the base by a big red cliff of sandstone, preserves other sedimentary features that also suggest a tide- and wave-infl uenced environment (Fig. 5; Dehler et al., 2001). Cross-bedding in these sandstones shows opposing directions of paleofl ow, indicating that underwater dunes were moving in opposite directions, again a diagnostic tidal feature (Fig. 5A). Associated with these decimeter-scale cross-beds are several meter-scale, very low angle cross-bed sets (Fig. 5B); these are likely the sides of shifting tidal channels. The Carbon Butte Member also hosts soft-sediment deformation features, indica-tive of either very fast deposition of sediment or seismic shak-ing. The best place to see these features is in Kwagunt Canyon, either right along the Butte fault or west of the Butte fault where Kwagunt Creek fl ows over the lower cliff-forming red sandstone (Fig. 5C).
Stromatolites are a persistent sedimentary feature in the Chuar dolomites and are found in most members (Figs. 3 and 6). The laminations refl ect the episodic growth of these structures, and their overall shapes are strongly infl uenced by the physical conditions of the environment in which they formed. Stromato-lites are much rarer today than they were during Chuar time, per-haps because of destructive grazing by animals (Garrett, 1970; Awramik, 1971), but modern examples can be found in Shark Bay, Western Australia, and in the Gulf of California, off the Baja Peninsula.
There are at least six different types of stromatolites in the Chuar Group (see Ford and Breed, 1973a, and Cook, 1991; Dehler et al., 2001), some more recognizable and accessible than others (Fig. 6). Most Chuar stromatolites appear only once in the 1600-m-thick succession, making them unique stratigraphic markers (Fig. 3). Probably the best known of the Chuar Group stromatolites is Boxonia, a specimen that looks like a giant brain (Fig. 6A) and can most easily be seen on a stroll up Kwagunt Canyon in the low hillsides past the Butte fault. (A spectacular
and oft-visited single “brain” at the top of the Carbon Canyon slot canyon was washed away in a recent fl ash fl ood; however, smaller blocks from the same unit are still scattered in the streambed.)
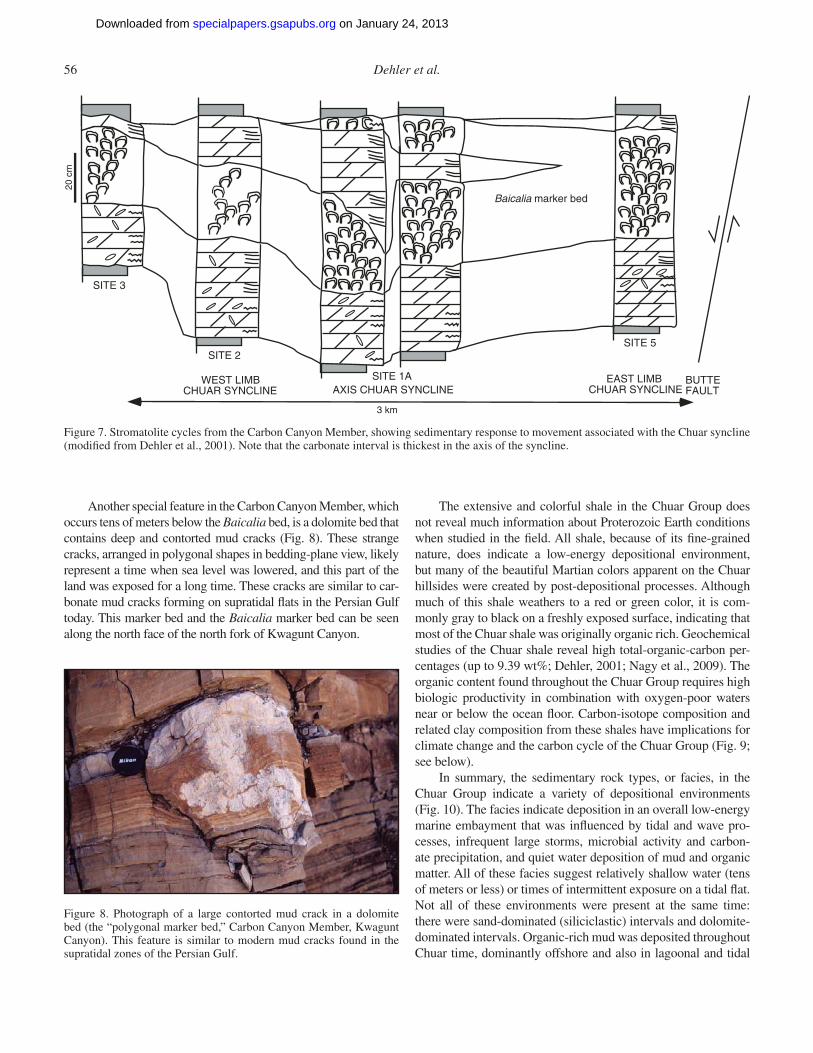
Another spectacular and prominent stromatolite, Baicalia, appears in the Carbon Canyon Member (Ford and Breed, 1973a). Although typically <0.5 m in all dimensions, this stromatolite is not only important for paleoenvironmental information (dis-cussed below), it is a useful marker bed for mapping and inter-preting tectonically controlled thickness changes in Chuar strata (Figs. 6B and 7). When viewed from the top (on rare bedding-plane exposures), Baicalia buildups look like a forest of large broccoli heads. In many places the Baicalia heads are broken up and in chaotic orientations, indicating reworking by storm waves.
A more subtle but unnoticed stromatolite interval is present at the base of the Jupiter Member and is prominently exposed as a white cliff (or a waterfall on rainy days) along the Lava Chuar–Carbon Canyon loop hike in Lava-Chuar Canyon. This stromato-lite interval has a complex assemblage of stromatolites, ranging from marble-sized (centimeters in diameter) to river-raft–sized (meters in diameter). Two species have been identifi ed in this interval, Inzeria and Stratifera (Ford and Breed, 1973a). Typi-cally, the forms are arranged within one another—domes within domes within domes. There are also pockets of broken stromato-lites within this interval, indicating again the occurrence of infre-quent large storms.
These microbial reefs or mounds are useful indicators of water depth—and thus paleoenvironment—because they only grow when submerged. Thus we can constrain minimum water depth to be at least as deep as the height of a mound (if the micro-bial laminae continue to the base of the mound). For example, because the “brain” stromatolites can be 2 m (6.56 ft) tall, we can infer that water depth had to be at least 2 m. Another environmen-tal condition required by stromatolites is that they receive enough light for microbes to photosynthesize. Thus water depth could not have been too great—less than ~100 m at an absolute maxi-mum (328 ft), the lower boundary of the photic zone today, or even shallower in Proterozoic time owing to lower solar luminos-ity (Sagan and Mullen, 1972). The water also must not have been too cloudy with sediment, because photosynthetic organisms need relatively clear water to receive sunlight. This latter factor has implications for the climatic conditions present when these microbial communities were living (i.e., low clastic sedimenta-tion rates, and hence more arid during deposition of carbonates). The fact that Chuar stromatolite taxa have been found in marine deposits of Proterozoic age worldwide suggests a marine origin for Chuar Group stromatolites (Dehler et al., 2001).
In addition to stromatolites, there is evidence for other microbially infl uenced carbonate precipitation throughout the Chuar Group. These sedimentary structures are common in the Chuar dolomite beds and show horizontal laminations that are crinkly, not smooth, in appearance (Fig. 6C). The fl at, crinkly laminations are interpreted to represent broad, fl at microbial mats that formed in the shallow subtidal, intertidal, and supra-tidal areas (Dehler et al., 2001).
on January 24, 2013specialpapers.gsapubs.orgDownloaded from
The Neoproterozoic Earth system revealed from the Chuar Group of Grand Canyon 55
AA
B
C
A
B
CFigure 5. Photographs of sedimentary structures in the Carbon Butte Sandstone, including (A) bipolar cross-bedding in the white sandstone marker bed; pencil points in main direction of fl ow, and climbing dune below pencil shows fl ow in the opposite direction; (B) low-angle cross-beds (cliff ~5 m tall); and (C) soft sediment deformation. These latter features suggest deposition in a tidal setting concurrent with sediment loading (caused by seismic activity or rapid sedimentation).
AA
B
C
A
B
CFigure 6. Photographs of various microbial marker beds in the Chuar Group. (A) The stromatolite Boxonia, aka the “brains,” Kwagunt Can-yon. If you had been snorkeling in this Neoproterozoic sea, you might have scraped your belly on these microbial mounds (now dolomite). (B) This example of the stromatolite Baicalia shows that the microbial buildup was onlapped and eventually covered by fi ne-grained sedi-ment. (C) Crinkly laminated dolomite, which formed in a microbe-rich peritidal environment. All of these microbial deposits (photos A–C) likely formed in shallow, clear water, perhaps in a setting similar to the Persian Gulf coast today.
on January 24, 2013specialpapers.gsapubs.orgDownloaded from
Another special feature in the Carbon Canyon Member, which occurs tens of meters below the Baicalia bed, is a dolomite bed that contains deep and contorted mud cracks (Fig. 8). These strange cracks, arranged in polygonal shapes in bedding-plane view, likely represent a time when sea level was lowered, and this part of the land was exposed for a long time. These cracks are similar to car-bonate mud cracks forming on supratidal fl ats in the Persian Gulf today. This marker bed and the Baicalia marker bed can be seen along the north face of the north fork of Kwagunt Canyon.
EAST LIMBCHUAR SYNCLINE
WEST LIMBCHUAR SYNCLINE AXIS CHUAR SYNCLINE
3 km
SITE 3
SITE 2
SITE 1A
SITE 5
20 c
m
Baicalia marker bed
BUTTEFAULT
Figure 7. Stromatolite cycles from the Carbon Canyon Member, showing sedimentary response to movement associated with the Chuar syncline (modifi ed from Dehler et al., 2001). Note that the carbonate interval is thickest in the axis of the syncline.
Figure 8. Photograph of a large contorted mud crack in a dolomite bed (the “polygonal marker bed,” Carbon Canyon Member, Kwagunt Canyon). This feature is similar to modern mud cracks found in the supratidal zones of the Persian Gulf.
The extensive and colorful shale in the Chuar Group does not reveal much information about Proterozoic Earth conditions when studied in the fi eld. All shale, because of its fi ne-grained nature, does indicate a low-energy depositional environment, but many of the beautiful Martian colors apparent on the Chuar hillsides were created by post-depositional processes. Although much of this shale weathers to a red or green color, it is com-monly gray to black on a freshly exposed surface, indicating that most of the Chuar shale was originally organic rich. Geochemical studies of the Chuar shale reveal high total-organic-carbon per-centages (up to 9.39 wt%; Dehler, 2001; Nagy et al., 2009). The organic content found throughout the Chuar Group requires high biologic productivity in combination with oxygen-poor waters near or below the ocean fl oor. Carbon-isotope composition and related clay composition from these shales have implications for climate change and the carbon cycle of the Chuar Group (Fig. 9; see below).
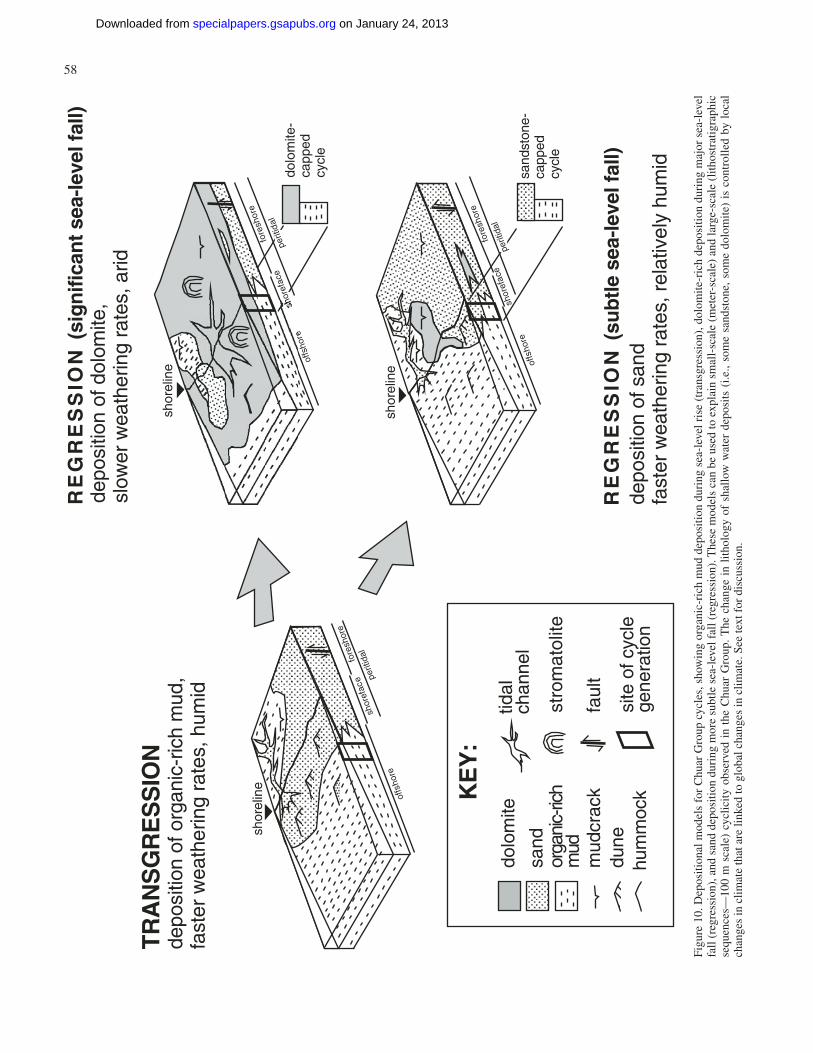
In summary, the sedimentary rock types, or facies, in the Chuar Group indicate a variety of depositional environments (Fig. 10). The facies indicate deposition in an overall low-energy marine embayment that was infl uenced by tidal and wave pro-cesses, infrequent large storms, microbial activity and carbon-ate precipitation, and quiet water deposition of mud and organic matter. All of these facies suggest relatively shallow water (tens of meters or less) or times of intermittent exposure on a tidal fl at. Not all of these environments were present at the same time: there were sand-dominated (siliciclastic) intervals and dolomite-dominated intervals. Organic-rich mud was deposited throughout Chuar time, dominantly offshore and also in lagoonal and tidal
on January 24, 2013specialpapers.gsapubs.orgDownloaded from
The Neoproterozoic Earth system revealed from the Chuar Group of Grand Canyon 59
fl at areas. Understanding the relationship among these paleoen-vironments involves looking closely at how the different sedi-mentary facies are vertically and laterally related to one another in the rock record (stratigraphy). This will be addressed in the next section.
CHUAR SEA LEVEL AND CLIMATE
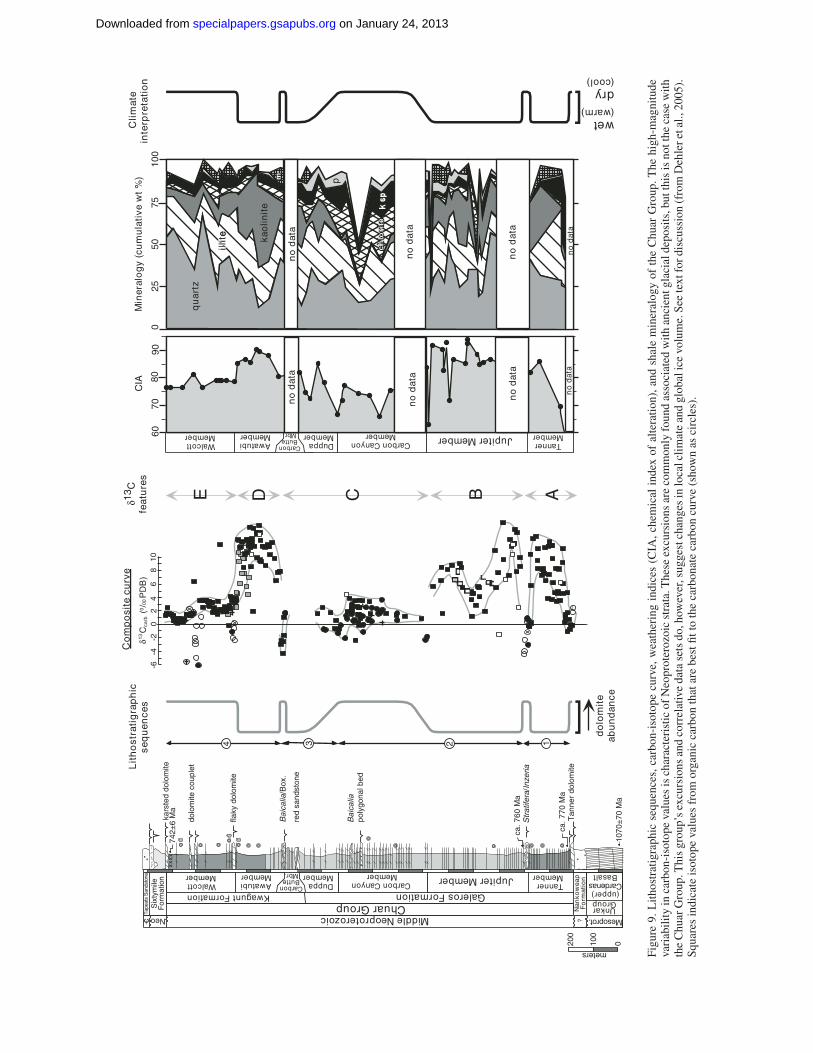
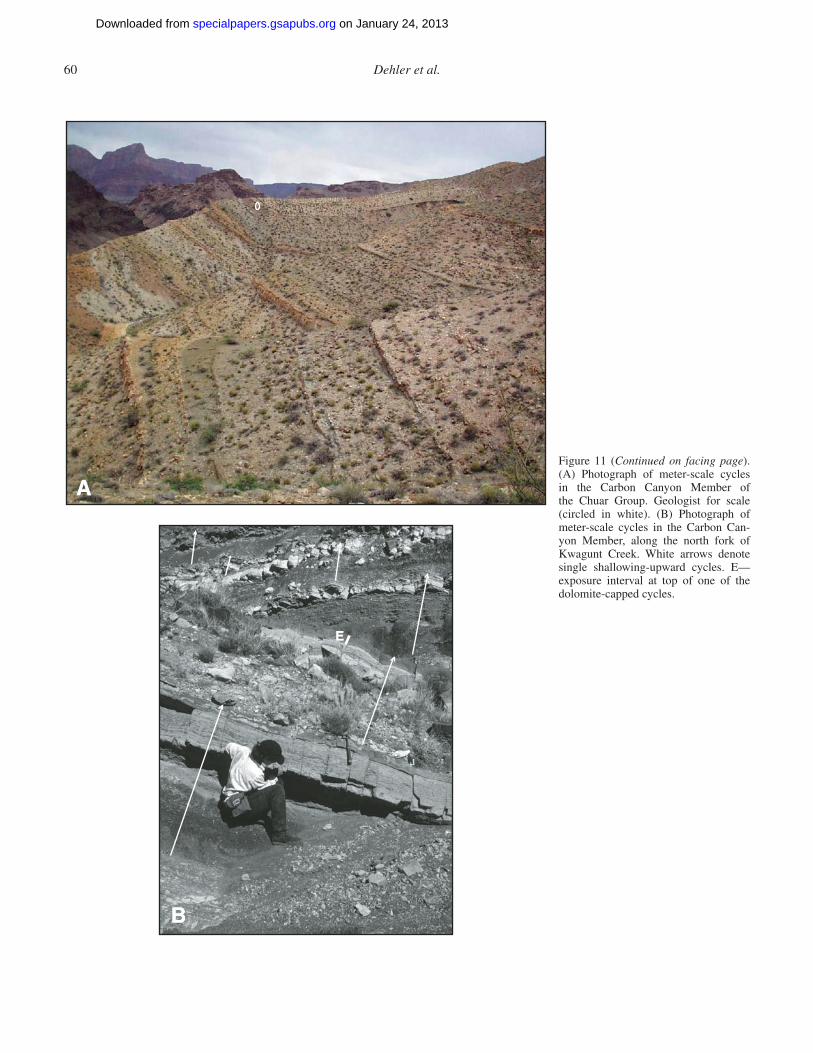
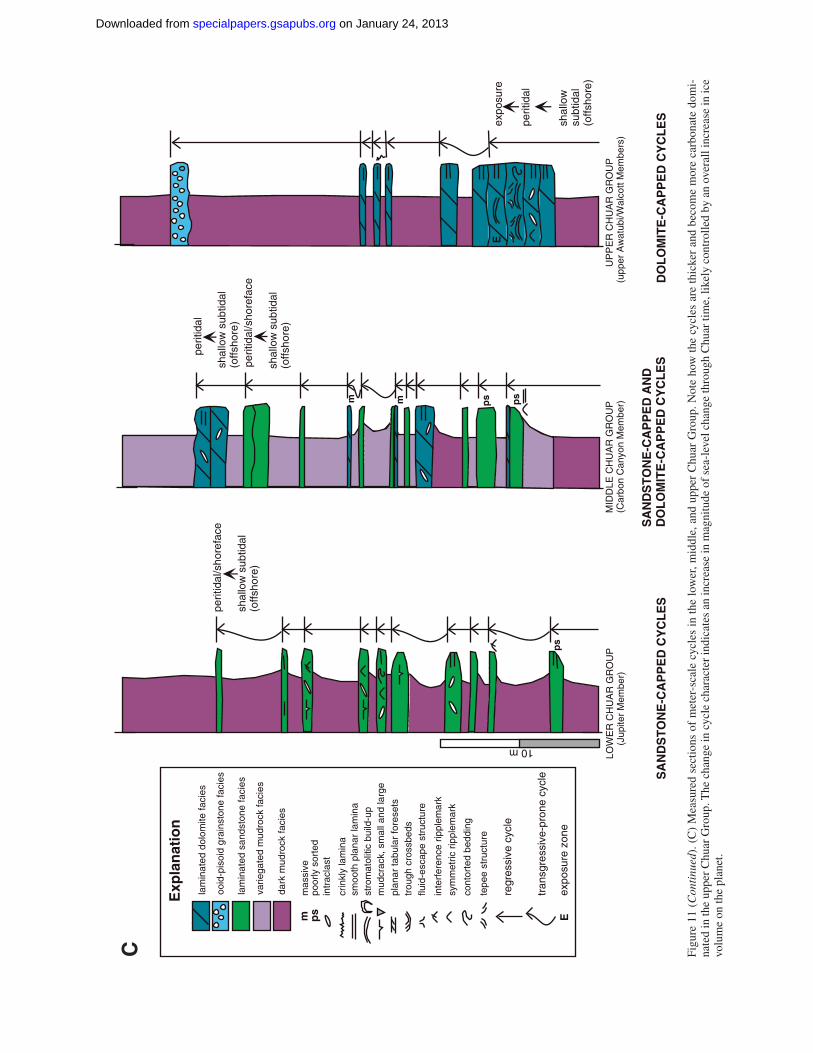
The stacking of different facies, or stratigraphy, in the Chuar Group reveals information about how the different deposi-tional environments were related, and how sea level and climate changed through Chuar time. The Chuar strata are markedly cyclic, meaning that there are many repetitions of stacked facies, and therefore repetitions of environmental change (Figs. 3, 9, 11A). Most Chuar cycles consist of shale overlain by dolomite or sandstone, and are meters to tens of meters thick (Fig. 11B). The shale was originally deposited offshore as mud, and the sand-stone or dolomite was originally deposited near the shoreline as sand or precipitated as carbonate, respectively. The changes in facies indicate changes in water depth; because Chuar strata are laterally continuous across the region (in the subsurface), these water-depth changes likely refl ect sea-level oscillations (Figs. 3 and 9). More specifi cally, the sandstone cycle tops represent more subtle sea-level changes, whereas some dolomite cycle caps indicate times of signifi cant exposure (Figs. 6 and 11B) and therefore greater drops in sea level.
These cycles are similar to those in younger strata (Pha-nerozoic, less than 543 m.y. ago) that are caused by Milankov-ich cycles (e.g., Beach and Ginsburg, 1978; Goldhammer et al., 1987; Sageman et al., 1997). Milankovich orbital cycles include the variations in the shape of the Earth’s orbit (eccentricity) and the tilt and wobble of the Earth’s axis (obliquity and preces-sion, respectively), each complete orbital cycle taking between 10 k.y. and 100 k.y. (Milanković, 1941). The interactions among these orbital parameters cause changes in the amount of solar radiation received by the Earth, hence infl uencing Earth’s cli-mate and, more specifi cally, causing changes in the ice volume in polar regions. There are >300 m-scale cycles (hypothesized to refl ect orbital changes) in the Chuar Group, each cycle repre-senting durations on the order of 40,000–100,000 yr (Dehler et al., 2001). This would suggest that the Chuar Group represents ~30 m.y. of geologic time, consistent with other age estimates for the Chuar Group (see Geologic Background, above). There are fewer thicker cycles in the upper Chuar Group, and these cycles are all capped with dolomite; these features indicate relatively higher magnitude sea-level change (Fig. 11C). Greater sea-level change corresponds to melting and freezing of more glacial ice. Therefore, the Chuar Group cycles indicate the presence of global ice throughout Chuar time, and an increase in global ice volume and a lowering of global temperatures in late Chuar time (Kwagunt Formation).
The Chuar Group cycles can be grouped into four strati-graphic sequences (Fig. 9). Each sequence shows a bundling of sandstone-rich cycles, followed by a bundling of dolomite-rich
cycles. We view these sequences as larger-scale versions of the Chuar meter-scale cycles and hypothesize that they represent similar (but longer duration) sea-level fl uctuations whereby the sandstone-rich intervals indicate higher sea level and the dolomite-rich intervals indicate lower sea level (Fig. 9). These sequences track the carbon-isotope signatures and shale compo-sition remarkably well and will be discussed below.
Chuar strata also provide information about the carbon cycle, which in turn can be used to infer both climatic and biotic changes (e.g., glaciations and extinction events). The carbon cycle is approximated by measuring the ratio between the two stable isotopes of carbon (12C, the lighter and most abundant one, and 13C, the heavier one) preserved in carbonate rocks and organic matter in shale. A carbon-cycle curve is constructed by plotting the measured ratios through time. The curve expresses changes in the rate of organic-carbon burial, which refl ects rela-tive rates of primary productivity, sedimentation, and organic-matter decomposition (e.g., DesMarais, 1997). Where the curve shows more positive values (expressed in parts per thousand, ‰), it indicates an increase in primary productivity and/or organic-carbon burial; more negative values can indicate lower rates of primary productivity and/or organic carbon burial. The Chuar carbon-isotope curve exhibits four major excursions (i.e., rises and falls), one of which is among the largest ever recorded in Earth history (cf. Melezhik et al., 1999). This positive excursion (15‰; Fig. 9), recorded in the lower Awatubi Member, has been interpreted to indicate high rates of organic-carbon burial, refl ect-ing high primary productivity and high rates of sedimentation (Dehler et al., 2005). This interpretation is supported by the shale mineralogy (see below).
The mineral composition of well-preserved shale provides a view of relative weathering rates in the source area through Chuar time. Shale rich in the mineral kaolinite (the weathering product of other unstable minerals, such as feldspar) indicates relatively high weathering rates, whereas shale rich in the min-eral feldspar indicate relatively low weathering rates, because feldspar is unstable at Earth’s surface conditions. A weathering “index” or chemical index of alteration (CIA) can be calculated for shale on the basis of the elements it contains (see discussion in Chapter 2 [Timmons et al., this volume], and in Nesbitt and Young, 1982). Shale with a high CIA (>80%) indicates increased weathering rates, and shale with a lower CIA indicates decreased weathering rates (Fig. 9). Because rates of weathering are strongly determined by rainfall, these indices can be used to infer times of relative aridity and humidity in the area where the Chuar sediment was weathered from its parent rock (the “source area”). Shale mineral compositions indicate that weathering rates, and thus relative humidity, varied signifi cantly during Chuar time, with less weathering during dolomite-rich times (lower sea level) and more intense weathering during sandstone-rich times (higher sea level; Fig. 9; Dehler et al., 2005).
Combining the stratigraphic data with the carbon-isotope curve and the shale mineralogy has resulted in a compelling cli-mate story (Fig. 9). Sandstone-rich intervals correlate with higher
on January 24, 2013specialpapers.gsapubs.orgDownloaded from
Figure 11 (Continued on facing page). (A) Photograph of meter-scale cycles in the Carbon Canyon Member of the Chuar Group. Geologist for scale (circled in white). (B) Photograph of meter-scale cycles in the Carbon Can-yon Member, along the north fork of Kwagunt Creek. White arrows denote single shallowing-upward cycles. E—exposure interval at top of one of the dolomite-capped cycles.
on January 24, 2013specialpapers.gsapubs.orgDownloaded from
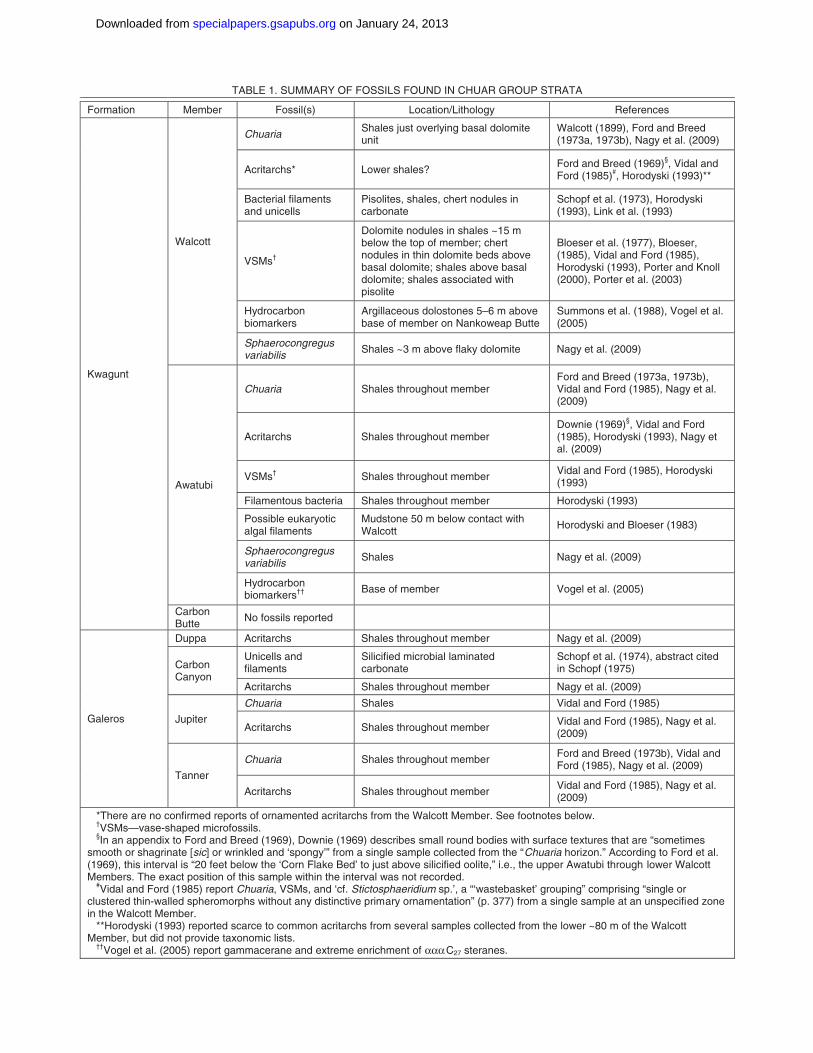
TABLE 1. SUMMARY OF FOSSILS FOUND IN CHUAR GROUP STRATA
Formation Member Fossil(s) Loc secnerefeR ygolohtiL/noita
Kwagunt
Walcott
Chuaria Shales just overlying basal dolomite unit
Walcott (1899), Ford and Breed (1973a, 1973b), Nagy et al. (2009)
Acritarchs* Lower shales? Ford and Breed (1969)§, Vidal and Ford (1985)#, Horodyski (1993)**
Bacterial filaments and unicells
Pisolites, shales, chert nodules in carbonate
Schopf et al. (1973), Horodyski (1993), Link et al. (1993)
VSMs†
Dolomite nodules in shales ~15 m below the top of member; chert nodules in thin dolomite beds above basal dolomite; shales above basal dolomite; shales associated with pisolite
Bloeser et al. (1977), Bloeser, (1985), Vidal and Ford (1985), Horodyski (1993), Porter and Knoll (2000), Porter et al. (2003)
Hydrocarbon biomarkers
Argillaceous dolostones 5–6 m above base of member on Nankoweap Butte
Summons et al. (1988), Vogel et al. (2005)
Sphaerocongregus variabilis
Shales ~3 m above flaky dolomite Nagy et al. (2009)
Awatubi
Chuaria Shales throughout member Ford and Breed (1973a, 1973b), Vidal and Ford (1985), Nagy et al. (2009)
Acritarchs Shales throughout member Downie (1969)§, Vidal and Ford (1985), Horodyski (1993), Nagy et al. (2009)
VSMs† Shales throughout member Vidal and Ford (1985), Horodyski (1993)
Filamentous bacteria Shales throughout member Horodyski (1993)
Possible eukaryotic algal filaments
Mudstone 50 m below contact with Walcott
Horodyski and Bloeser (1983)
Sphaerocongregus variabilis
)9002( .la te ygaN selahS
Hydrocarbon biomarkers††
)5002( .la te legoV rebmem fo esaB
Carbon Butte detroper slissof oN
Galeros
Duppa Acritarchs Shales throughout member Nagy et al. (2009)
Carbon Canyon
Unicells and filaments
Silicified microbial laminated carbonate
Schopf et al. (1974), abstract cited in Schopf (1975)
Acritarchs Shales throughout member Nagy et al. (2009)
Jupiter
Chuaria )5891( droF dna ladiV selahS
Acritarchs Shales throughout member Vidal and Ford (1985), Nagy et al. (2009)
Tanner
Chuaria Shales throughout member Ford and Breed (1973b), Vidal and Ford (1985), Nagy et al. (2009)
Acritarchs Shales throughout member Vidal and Ford (1985), Nagy et al. (2009)
*There are no confirmed reports of ornamented acritarchs from the Walcott Member. See footnotes below. †VSMs—vase-shaped microfossils. §In an appendix to Ford and Breed (1969), Downie (1969) describes small round bodies with surface textures that are “sometimes smooth or shagrinate [sic] or wrinkled and ‘spongy’” from a single sample collected from the “Chuaria horizon.” According to Ford et al. (1969), this interval is “20 feet below the ‘Corn Flake Bed’ to just above silicified oolite,” i.e., the upper Awatubi through lower Walcott Members. The exact position of this sample within the interval was not recorded. #Vidal and Ford (1985) report Chuaria, VSMs, and ‘cf. Stictosphaeridium sp.’, a “‘wastebasket’ grouping” comprising “single or clustered thin-walled spheromorphs without any distinctive primary ornamentation” (p. 377) from a single sample at an unspecified zone in the Walcott Member. **Horodyski (1993) reported scarce to common acritarchs from several samples collected from the lower ~80 m of the Walcott Member, but did not provide taxonomic lists. ††Vogel et al. (2005) report gammacerane and extreme enrichment of ααα C27 steranes.
on January 24, 2013specialpapers.gsapubs.orgDownloaded from
The Neoproterozoic Earth system revealed from the Chuar Group of Grand Canyon 63
(more positive) carbon-isotope values and kaolinite-rich shale, and dolomite-rich intervals correlate with lower (more negative) carbon-isotope values and feldspar-rich shale. We hypothesize, therefore, that the sandstone-rich intervals indicate deposition during locally wetter times, when more clastic sediment was delivered to the Chuar basin at faster rates, and during globally warmer times, when sea level was higher and there was less gla-cial ice. The dolomite-rich intervals indicate increased carbonate precipitation during locally drier times, when less sediment was delivered to the basin (as silt and sand), and during globally cooler times, when sea level was lower and there was more glacial ice.
In the past decade, much attention has been paid to Neopro-terozoic glacial deposits, some of which are about the same age as the Chuar Group (see Hoffman and Li, 2009, for a summary of age constraints). These deposits are anomalous for many reasons, most notably the fact that many were deposited at sea level in equatorial regions and are associated with extreme variability in the carbon-isotope curve (Hoffman et al., 1998a; Evans, 2000). There is an array of hypotheses to explain these relationships (see Hoffman and Schrag, 2002, for a review of these hypotheses); the best known is the “snowball Earth” hypothesis (originally suggested by Harland, 1964, extended by Kirschvink, 1992, and revived by Hoffman et al., 1998b), which suggests that Earth’s oceans were completely frozen over for at least 10 m.y. at a time and that these special conditions explain the large variability in the carbon cycle. It has been hypothesized that all extreme carbon-isotope excursions in the Neoproterozoic—even those not stratigraphically tied to glacial deposits—may indicate gla-ciation (Kaufman et al., 1997). The Chuar Group has such excur-sions, and although it lacks glacial deposits, its stratigraphic data sets (Figs. 9 and 11C) independently suggest that glaciers were on the planet (Dehler et al., 2001). Importantly, the Chuar Group indicates that there was ice on the planet between 800 and 742 Ma (at least at the poles), yet not in lower latitudes as sug-gested by the “snowball Earth” hypothesis. These fi ndings not only help to constrain the timing of a “snowball Earth” (if this hypothesis holds), they also support the idea that there is more than one way to get large-scale changes in the Proterozoic car-bon cycle. The variability in the Chuar carbon cycle appears to be ultimately controlled not by “snowball Earth” conditions, but, rather, by concomitant changes in local humidity and global ice volume (Dehler et al., 2005).
LIFE IN CHUAR WATERS
The Chuar fossil record (Table 1) indicates not only that there was a diversity of life in the Chuar sea but also that organ-isms lived in a variety of different habitats, from high-energy shallow waters to low-energy offshore waters, attached to sand grains, grazing on microbial mats, or fl oating in the water col-umn. Although primarily single celled, life by this time was highly diverse, both taxonomically and ecologically.
In the shallow, high-energy, warm-water environments of the Chuar sea lived cyanobacteria attached to carbonate grains.
Chemical byproducts of photosynthesis encouraged precipita-tion of carbonate coatings on the grains; as a result, the grains are made up of concentric rings of carbonate (known as ooids or pisoids, depending on their size). They are preserved today, along with the carbonate grains in cherty oolite and pisolite units, dis-tributed at a number of intervals in the Walcott Member (Schopf et al., 1973; Cook, 1991).
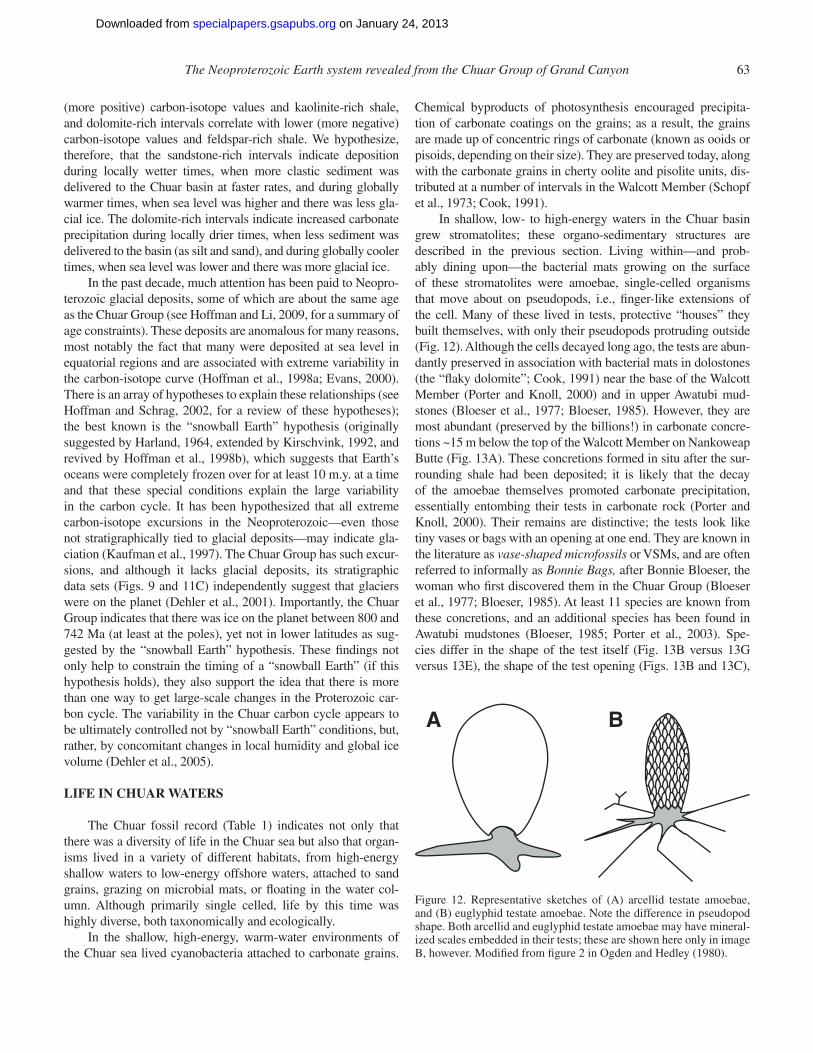
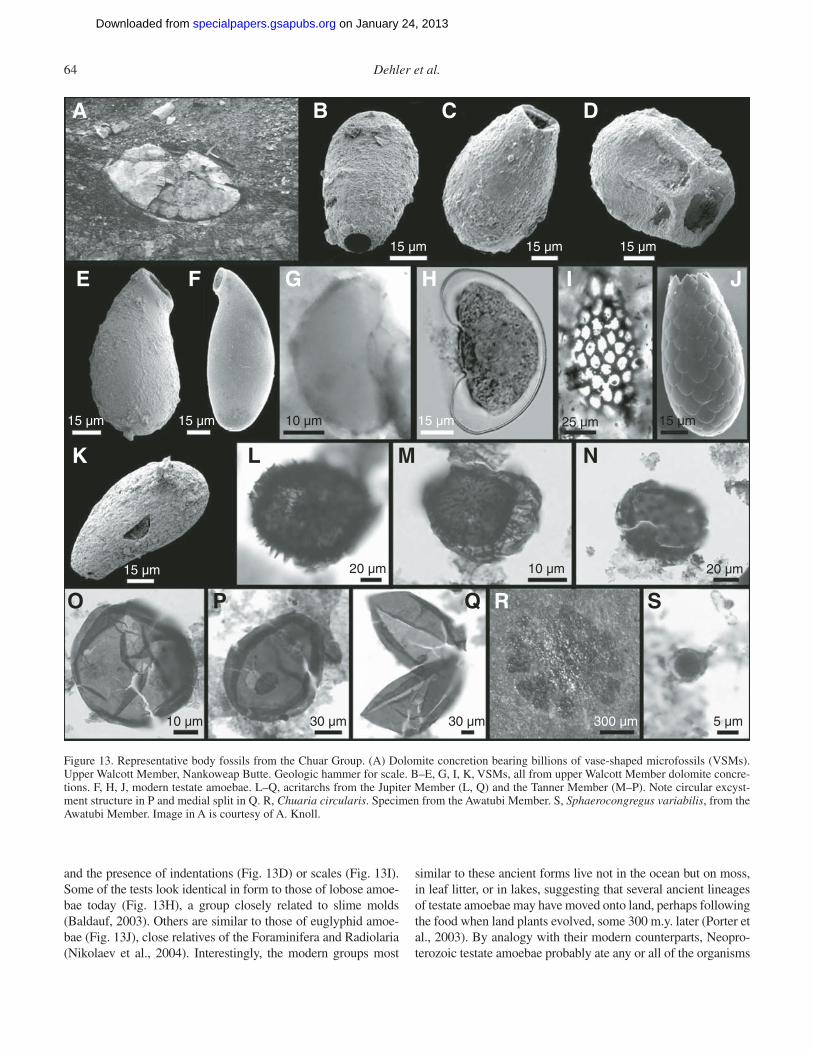
In shallow, low- to high-energy waters in the Chuar basin grew stromatolites; these organo-sedimentary structures are described in the previous section. Living within—and prob-ably dining upon—the bacterial mats growing on the surface of these stromatolites were amoebae, single-celled organisms that move about on pseudopods, i.e., fi nger-like extensions of the cell. Many of these lived in tests, protective “houses” they built themselves, with only their pseudopods protruding outside (Fig. 12). Although the cells decayed long ago, the tests are abun-dantly preserved in association with bacterial mats in dolostones (the “fl aky dolomite”; Cook, 1991) near the base of the Walcott Member (Porter and Knoll, 2000) and in upper Awatubi mud-stones (Bloeser et al., 1977; Bloeser, 1985). However, they are most abundant (preserved by the billions!) in carbonate concre-tions ~15 m below the top of the Walcott Member on Nankoweap Butte (Fig. 13A). These concretions formed in situ after the sur-rounding shale had been deposited; it is likely that the decay of the amoebae themselves promoted carbonate precipitation, essentially entombing their tests in carbonate rock (Porter and Knoll, 2000). Their remains are distinctive; the tests look like tiny vases or bags with an opening at one end. They are known in the literature as vase-shaped microfossils or VSMs, and are often referred to informally as Bonnie Bags, after Bonnie Bloeser, the woman who fi rst discovered them in the Chuar Group (Bloeser et al., 1977; Bloeser, 1985). At least 11 species are known from these concretions, and an additional species has been found in Awatubi mudstones (Bloeser, 1985; Porter et al., 2003). Spe-cies differ in the shape of the test itself (Fig. 13B versus 13G versus 13E), the shape of the test opening (Figs. 13B and 13C),
BA
Figure 12. Representative sketches of (A) arcellid testate amoebae, and (B) euglyphid testate amoebae. Note the difference in pseudopod shape. Both arcellid and euglyphid testate amoebae may have mineral-ized scales embedded in their tests; these are shown here only in image B, however. Modifi ed from fi gure 2 in Ogden and Hedley (1980).
on January 24, 2013specialpapers.gsapubs.orgDownloaded from
and the presence of indentations (Fig. 13D) or scales (Fig. 13I). Some of the tests look identical in form to those of lobose amoe-bae today (Fig. 13H), a group closely related to slime molds (Baldauf, 2003). Others are similar to those of euglyphid amoe-bae (Fig. 13J), close relatives of the Foraminifera and Radiolaria (Nikolaev et al., 2004). Interestingly, the modern groups most
similar to these ancient forms live not in the ocean but on moss, in leaf litter, or in lakes, suggesting that several ancient lineages of testate amoebae may have moved onto land, perhaps following the food when land plants evolved, some 300 m.y. later (Porter et al., 2003). By analogy with their modern counterparts, Neopro-terozoic testate amoebae probably ate any or all of the organisms
A B C D
E F G H I J
K
R
L M N
O P Q S
15 µm
15 µm
15 µm
15 µm 10 µm 25 µm 15 µm
20 µm20 µm 10 µm
10 µm 30 µm 30 µm 300 µm 5 µm
15 µm
15 µm 15 µm
Figure 13. Representative body fossils from the Chuar Group. (A) Dolomite concretion bearing billions of vase-shaped microfossils (VSMs). Upper Walcott Member, Nankoweap Butte. Geologic hammer for scale. B–E, G, I, K, VSMs, all from upper Walcott Member dolomite concre-tions. F, H, J, modern testate amoebae. L–Q, acritarchs from the Jupiter Member (L, Q) and the Tanner Member (M–P). Note circular excyst-ment structure in P and medial split in Q. R, Chuaria circularis. Specimen from the Awatubi Member. S, Sphaerocongregus variabilis, from the Awatubi Member. Image in A is courtesy of A. Knoll.
on January 24, 2013specialpapers.gsapubs.orgDownloaded from
The Neoproterozoic Earth system revealed from the Chuar Group of Grand Canyon 65
in Chuar waters. They may have eaten each other, as well, as some amoebae do today. Evidence that some testate amoebae may have been preyed upon comes from semicircular holes in the test walls of many specimens (Fig. 13K), although it is not clear who may have made these or how (Porter et al., 2003). In any case, VSMs provide some of the earliest evidence for preda-tors in the fossil record, indicating that relatively complex food webs were in place ~740 m.y. ago.
Farther offshore lived a diversity of planktonic microor-ganisms. These likely included ciliates, voracious single-celled micropredators covered in hair-like projections called cilia. These particular species likely lived in low-oxygen waters or at the boundary between oxygen-rich and oxygen-depleted waters, dining on bacteria that thrived in the low-oxygen environment. Evidence for this comes from the presence of gammacerane, a hydrocarbon molecule preserved in lower Walcott dolostones (Summons et al., 1988; Vogel et al., 2005). Gammacerane is the geologically stable form of tetrahymenol, a lipid produced pri-marily by ciliates that consume signifi cant quantities of bacteria and live in or close to anoxic environments (Sinninghe Damsté et al., 1995). Dinofl agellates, a group comprising both photosyn-thetic and heterotrophic protists, may also have been present in the Chuar sea, as suggested by the presence of dinosterane bio-markers in Walcott samples (Vogel et al., 2005). (Dinosteranes are the geologically stable form of dinosterols, which today are almost exclusively formed by dinofl agellates [Volkman et al., 1993].) Additional hydrocarbon molecules preserved in both basal Walcott and basal Awatubi strata are consistent with the presence of chemoautotrophic bacteria (i.e., bacteria that fi x their own carbon and get energy from chemical reactions rather than from the sun) and of abundant red and/or golden-brown algae (Summons et al., 1988; Vogel et al., 2005).
Additional microorganisms are represented in Chuar strata by beautifully ornamented organic-walled microfossils known as acritarchs. Acritarchs form the bulk of the Proterozoic fossil record and are found throughout the Chuar Group in shale and mudstone. Although it is likely that these ornamented forms are eukaryotic (Javaux et al., 2003), paleontologists aren’t exactly sure what kinds of eukaryotes they represent. It has long been assumed that they are the remains of phytoplankton—tiny algae that fl oat in the water column—but recent discoveries suggest that at least some species may have been fungi (Butterfi eld, 2005), and some may represent animal eggs and embryos (Xiao and Knoll, 2000; Yin et al., 2004). It is also clear that not all fl oated in the water column; some fossils are preserved attached to sand grains, suggesting that they lived on the seafl oor (e.g., Butterfi eld, 1997). Many acritarchs appear to have been cysts, dormant structures formed when a cell is exposed to stressful conditions, such as nutrient depletion or changes in water salinity or temperature. Evidence that some acritarchs are cysts comes from excystment structures, circular “escape hatches” (Fig. 13P) or medial splits (Fig. 13Q) through which the cell exited the cyst once its dormant stage was over. The diversity of orna-mented acritarchs—including species covered with tiny cone-like projections, concentric circular ridges, and intricate wrinkles—and
their abundance in certain beds suggests that protists were impor-tant components of the Chuar ecosystem.
One organism living in the Chuar sea appears to have been a giant relative to the rest: the ~1–3-mm-diameter Chuaria cir-cularis (Fig. 13R). Although its remains are now found as fl at discs on shale bedding planes, Chuaria was originally a smooth, featureless, probably planktonic sphere. The discovery in early Neoproterozoic strata from India of probable Chuaria speci-mens attached to the end of another cm-sized ribbon-like fos-sil, Tawuia, suggests that Chuaria may represent a reproductive stage in the life cycle of a seaweed (Kumar, 2001). Holdfast-like structures on some Tawuia specimens suggest that the seaweed lived attached to the sediment; once mature, Chuaria would have become detached from its parent seaweed and dispersed plank-tonically (Kumar, 2001). This may explain why Chuaria is much more widespread in rocks of this age than is Tawuia (Kumar, 2001). Although Chuaria occurs in both shallow and deeper water environments preserved in the Chuar Group, Tawuia has never been found in the Chuar Group.
Upper Chuar shales preserve ~5–20 µm aggregates of even tinier (<1 µm) organic-walled spheres, sometimes surrounded by a membrane (Fig. 13S; Moorman, 1974; Cloud et al., 1975; Nagy et al., 2009). These structures, similar to those described under the names Sphaerocongregus variabilis and Bavlinella faveolata, are thought to be the remains of bacteria, although an origin from framboidal pyrite cannot be ruled out (Nagy et al., 2009). Sphaerocongregus variabilis (= Bavlinella faveolata) has an unusual distribution: It is extremely rare in diverse acri-tarch assemblages, but it occurs sporadically in high concentra-tions commonly by itself in rocks characteristic of low- oxygen environments and/or interbedded with glacial diamictites (Knoll et al., 1981; Vidal and Nystuen, 1990). Its occurrence in the Chuar Group is consistent with this pattern; S. variabilis is absent from the high-diversity acritarch assemblages found in lower Chuar strata, but it is recovered in high numbers from upper Awatubi and lower Walcott mudstones that are otherwise devoid of diverse acritarch assemblages (Table 1; Nagy et al., 2009). Two taxonomic interpretations have been suggested for S. variabilis. The fi rst view is that it was a cyanobacterium that bloomed under high-nutrient (eutrophic) conditions, living in a thin layer of oxygenated surface waters above an anoxic water column (e.g., Moorman, 1974; Cloud et al., 1975; Knoll et al., 1981; Mansuy and Vidal, 1983). The second view is that it was an anoxygenic (non-oxygen producing) photosynthetic bacte-rium that thrived in anoxic waters much like sulfur bacteria in stratifi ed lakes today (Repeta et al., 1989; Vidal and Nystuen, 1990). In either case, its presence in the upper Chuar Group suggests a transition to eutrophic and anoxic conditions dur-ing late Chuar time, an inference corroborated by the presence of gammacerane, a biomarker indicative of anoxic waters, in upper Chuar rocks, and by recent iron speciation and sulfur iso-tope analyses (see above and Table 1; Summons et al., 1988; Sinninghe Damsté et al., 1995; Vogel et al., 2005; Johnston et al., 2010).
on January 24, 2013specialpapers.gsapubs.orgDownloaded from
In Chapter 2 (Timmons et al., this volume) the history of Unkar Group sedimentation and deformation was described, pro-viding a framework for understanding the relative importance and timing of the subsequent Chuar-age basin formation. We now know that late Unkar Group deformation predated Nankoweap and Chuar Group deposition and was different in deformational style from Chuar-related faulting and syncline development. Unkar Group rocks were faulted and tilted along NW-trending fault systems like the Palisades fault (Fig. 2). In contrast, Chuar rocks were folded by the Chuar syncline, paralleling the north-trending Butte fault. The different styles of deformation and fi eld observations suggest that the Unkar and Chuar Groups record two separate deformational events in the middle to late Protero-zoic. The remainder of this section will further describe the style and relative timing of Chuar Group deformation and its impor-tance for understanding the tectonic history of the western United States in late Proterozoic time.
The relative importance of Chuar Group deformation, including movement of the Butte fault, development of the Chuar syncline, and formation of intraformational faults was docu-mented by Timmons et al. (2001). In the absence of absolute age determinations from the Chuar Group, early workers lumped the faulting and tilting of the Unkar Group (described in Chapter 2 [Timmons et al., this volume]) and faulting and folding in the Chuar Group into a single tectonic episode that affected much of western North America (Noble, 1914). This tectonic episode propagated through the geologic literature as the Grand Canyon “Revolution” (Maxson, 1961), “Disturbance” (Wilson, 1962; Elston and McKee, 1982), and “orogeny” (Elston, 1979). The common model envisioned for this tectonic event was broadly analogous with Basin and Range deformation seen in the mod-ern landscape in the western United States. All these early work-ers placed the timing of this deformational event in latest Chuar Group and Sixtymile Formation time. More recently, workers have come to realize through a combination of better geochronol-ogy, more detailed geologic mapping, and sedimentary-tectonic interpretation that the Unkar and Chuar Groups record distinct tectonic and sedimentary events separated by more than 200 m.y. of time (Timmons et al., 2001, 2005).
The Butte fault is a major north-trending normal fault that records west-side-down Neoproterozoic displacement (see Chapter 2 [Timmons et al., this volume] for description of common fault types). The amount of displacement across the Butte fault is large by Colorado Plateau standards and varies along the trace of the fault. The maximum amount of Proterozoic displacement is esti-mated at 1800 m; however, the actual amount of displacement may have been greater. Erosion of the late Proterozoic landscape prior to Cambrian (Tapeats) time precludes an accurate estimation of fault displacement. Subordinate faults within the Chuar basin parallel the trace of the Butte fault and also record normal-sense movement.
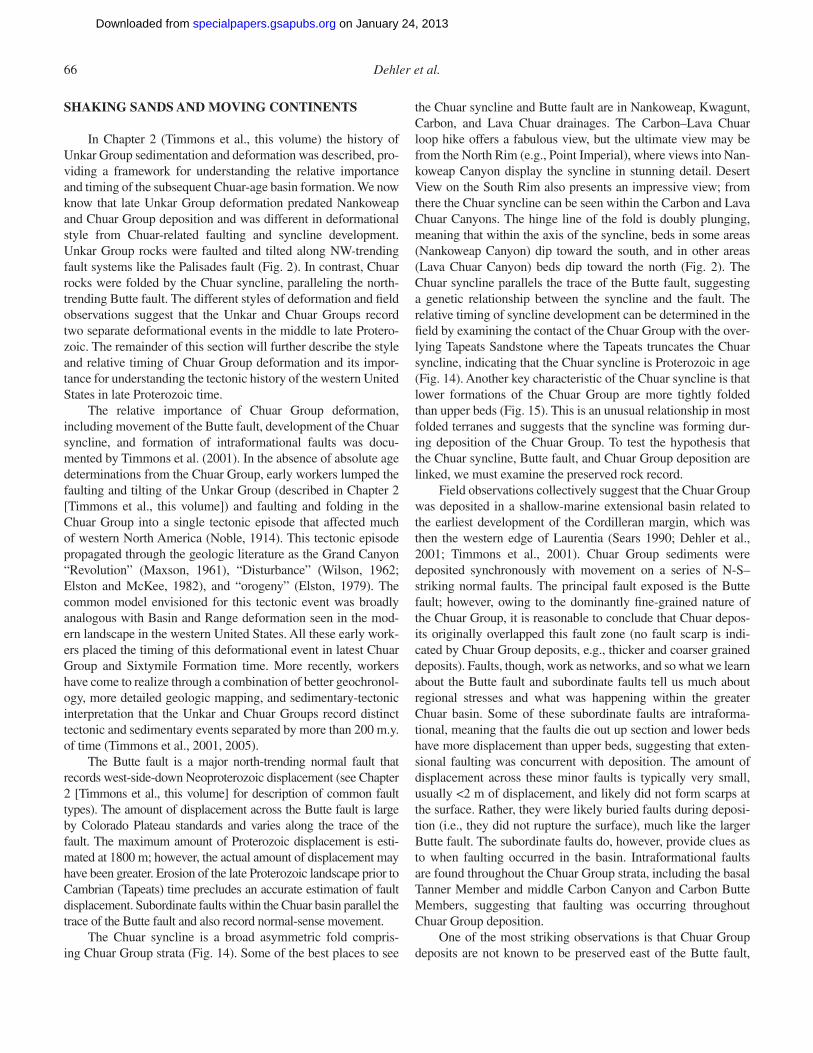
The Chuar syncline is a broad asymmetric fold compris-ing Chuar Group strata (Fig. 14). Some of the best places to see
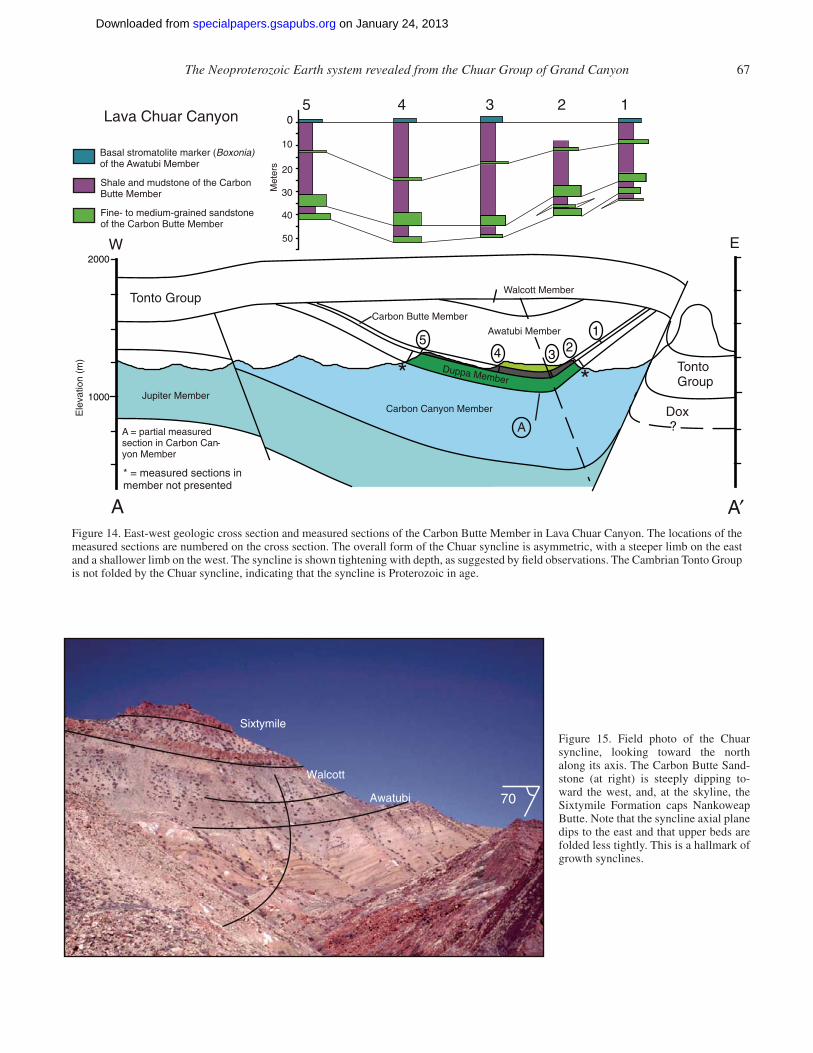
the Chuar syncline and Butte fault are in Nankoweap, Kwagunt, Carbon, and Lava Chuar drainages. The Carbon–Lava Chuar loop hike offers a fabulous view, but the ultimate view may be from the North Rim (e.g., Point Imperial), where views into Nan-koweap Canyon display the syncline in stunning detail. Desert View on the South Rim also presents an impressive view; from there the Chuar syncline can be seen within the Carbon and Lava Chuar Canyons. The hinge line of the fold is doubly plunging, meaning that within the axis of the syncline, beds in some areas (Nankoweap Canyon) dip toward the south, and in other areas (Lava Chuar Canyon) beds dip toward the north (Fig. 2). The Chuar syncline parallels the trace of the Butte fault, suggesting a genetic relationship between the syncline and the fault. The relative timing of syncline development can be determined in the fi eld by examining the contact of the Chuar Group with the over-lying Tapeats Sandstone where the Tapeats truncates the Chuar syncline, indicating that the Chuar syncline is Proterozoic in age (Fig. 14). Another key characteristic of the Chuar syncline is that lower formations of the Chuar Group are more tightly folded than upper beds (Fig. 15). This is an unusual relationship in most folded terranes and suggests that the syncline was forming dur-ing deposition of the Chuar Group. To test the hypothesis that the Chuar syncline, Butte fault, and Chuar Group deposition are linked, we must examine the preserved rock record.
Field observations collectively suggest that the Chuar Group was deposited in a shallow-marine extensional basin related to the earliest development of the Cordilleran margin, which was then the western edge of Laurentia (Sears 1990; Dehler et al., 2001; Timmons et al., 2001). Chuar Group sediments were deposited synchronously with movement on a series of N-S–striking normal faults. The principal fault exposed is the Butte fault; however, owing to the dominantly fi ne-grained nature of the Chuar Group, it is reasonable to conclude that Chuar depos-its originally overlapped this fault zone (no fault scarp is indi-cated by Chuar Group deposits, e.g., thicker and coarser grained deposits). Faults, though, work as networks, and so what we learn about the Butte fault and subordinate faults tell us much about regional stresses and what was happening within the greater Chuar basin. Some of these subordinate faults are intraforma-tional, meaning that the faults die out up section and lower beds have more displacement than upper beds, suggesting that exten-sional faulting was concurrent with deposition. The amount of displacement across these minor faults is typically very small, usually <2 m of displacement, and likely did not form scarps at the surface. Rather, they were likely buried faults during deposi-tion (i.e., they did not rupture the surface), much like the larger Butte fault. The subordinate faults do, however, provide clues as to when faulting occurred in the basin. Intraformational faults are found throughout the Chuar Group strata, including the basal Tanner Member and middle Carbon Canyon and Carbon Butte Members, suggesting that faulting was occurring throughout Chuar Group deposition.
One of the most striking observations is that Chuar Group deposits are not known to be preserved east of the Butte fault,
on January 24, 2013specialpapers.gsapubs.orgDownloaded from
The Neoproterozoic Earth system revealed from the Chuar Group of Grand Canyon 67
0
?
2000
1000
12
345
Lava Chuar Canyon
12345
A
Tonto Group
TontoGroup
Dox
* *
* = measured sections in member not presented
Basal stromatolite marker (Boxonia)
of the Awatubi Member
Shale and mudstone of the CarbonButte Member
Fine- to medium-grained sandstoneof the Carbon Butte Member
Jupiter MemberCarbon Canyon Member
Duppa Member
Carbon Butte Member
Walcott Member
10
20
30
40
50
Met
ers
A
Ele
vatio
n (m
)
A = partial measuredsection in Carbon Can-yon Member
W E
Awatubi Member
A′Figure 14. East-west geologic cross section and measured sections of the Carbon Butte Member in Lava Chuar Canyon. The locations of the measured sections are numbered on the cross section. The overall form of the Chuar syncline is asymmetric, with a steeper limb on the east and a shallower limb on the west. The syncline is shown tightening with depth, as suggested by fi eld observations. The Cambrian Tonto Group is not folded by the Chuar syncline, indicating that the syncline is Proterozoic in age.
70
Sixtymile
Walcott
Awatubi
Figure 15. Field photo of the Chuar syncline, looking toward the north along its axis. The Carbon Butte Sand-stone (at right) is steeply dipping to-ward the west, and, at the skyline, the Sixtymile Formation caps Nankoweap Butte. Note that the syncline axial plane dips to the east and that upper beds are folded less tightly. This is a hallmark of growth synclines.
on January 24, 2013specialpapers.gsapubs.orgDownloaded from
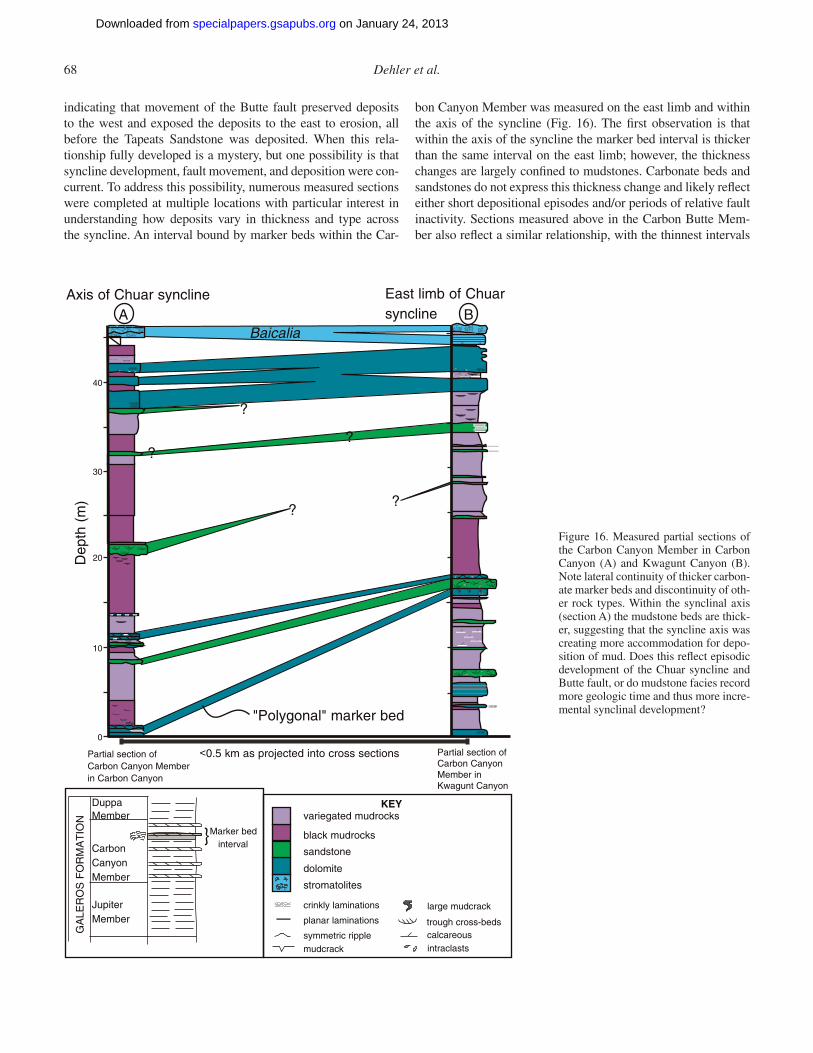
indicating that movement of the Butte fault preserved deposits to the west and exposed the deposits to the east to erosion, all before the Tapeats Sandstone was deposited. When this rela-tionship fully developed is a mystery, but one possibility is that syncline development, fault movement, and deposition were con-current. To address this possibility, numerous measured sections were completed at multiple locations with particular interest in understanding how deposits vary in thickness and type across the syncline. An interval bound by marker beds within the Car-
bon Canyon Member was measured on the east limb and within the axis of the syncline (Fig. 16). The fi rst observation is that within the axis of the syncline the marker bed interval is thicker than the same interval on the east limb; however, the thickness changes are largely confi ned to mudstones. Carbonate beds and sandstones do not express this thickness change and likely refl ect either short depositional episodes and/or periods of relative fault inactivity. Sections measured above in the Carbon Butte Mem-ber also refl ect a similar relationship, with the thinnest intervals
Figure 16. Measured partial sections of the Carbon Canyon Member in Carbon Canyon (A) and Kwagunt Canyon (B). Note lateral continuity of thicker carbon-ate marker beds and discontinuity of oth-er rock types. Within the synclinal axis (section A) the mudstone beds are thick-er, suggesting that the syncline axis was creating more accommodation for depo-sition of mud. Does this refl ect episodic development of the Chuar syncline and Butte fault, or do mudstone facies record more geologic time and thus more incre-mental synclinal development?
on January 24, 2013specialpapers.gsapubs.orgDownloaded from
The Neoproterozoic Earth system revealed from the Chuar Group of Grand Canyon 69
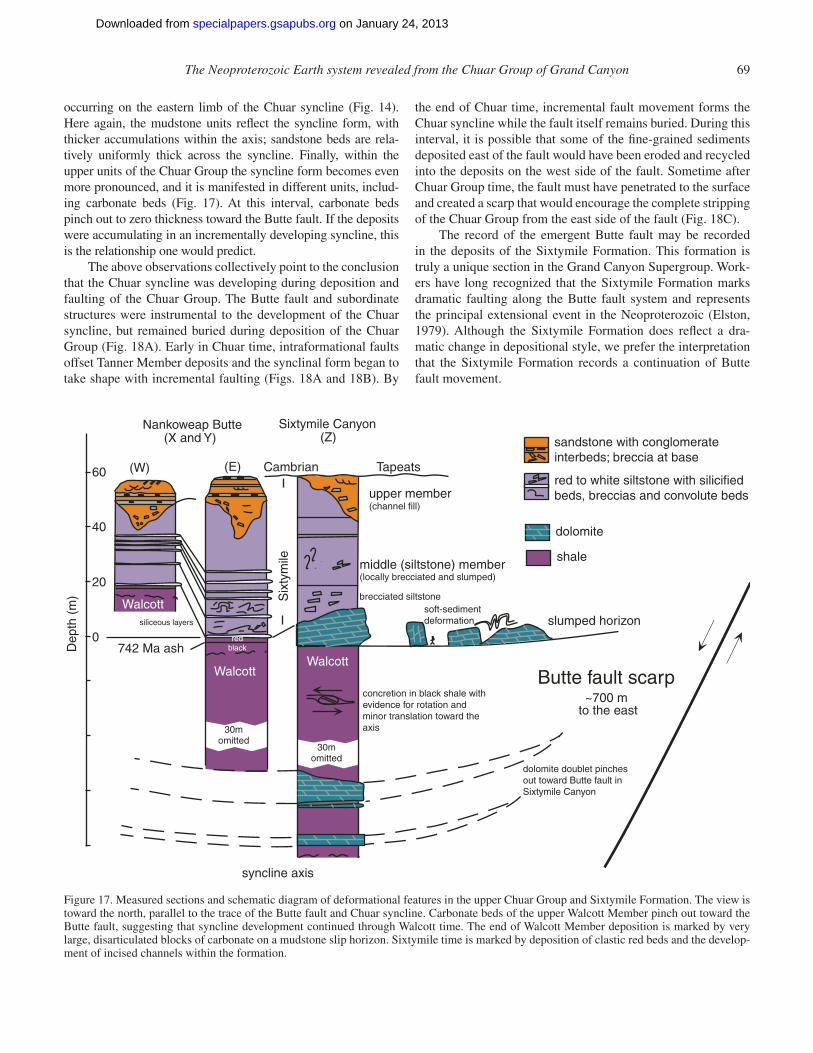
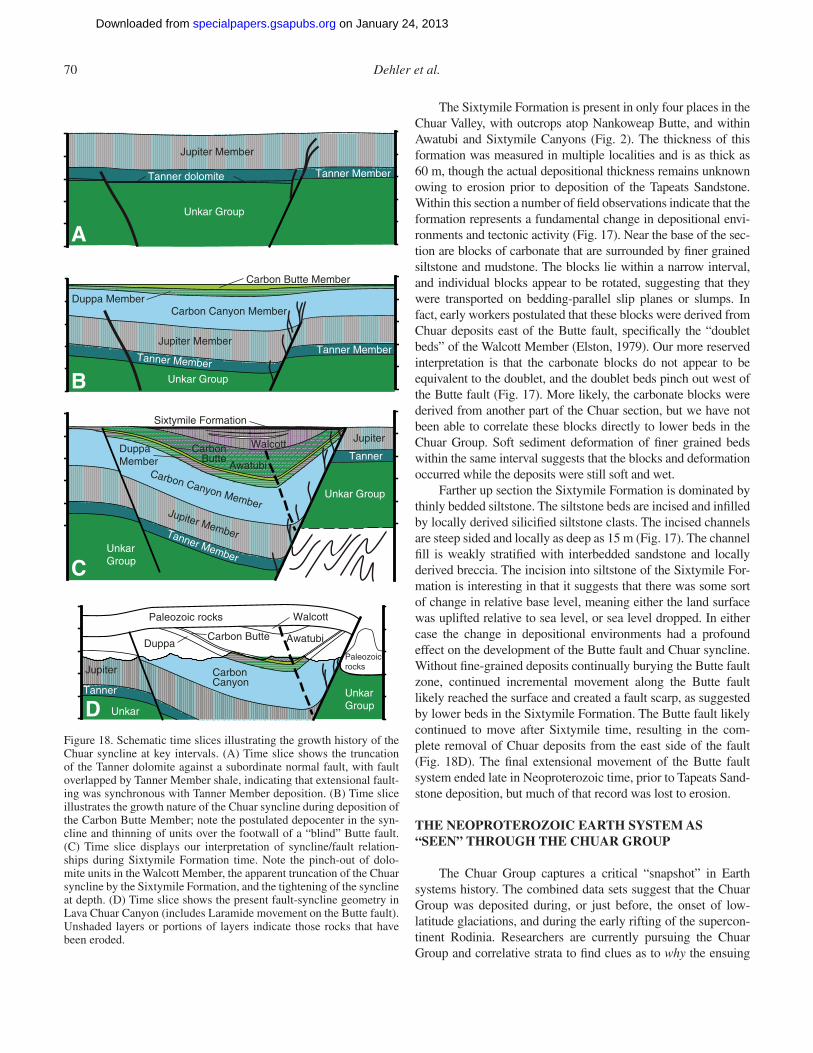
occurring on the eastern limb of the Chuar syncline (Fig. 14). Here again, the mudstone units refl ect the syncline form, with thicker accumulations within the axis; sandstone beds are rela-tively uniformly thick across the syncline. Finally, within the upper units of the Chuar Group the syncline form becomes even more pronounced, and it is manifested in different units, includ-ing carbonate beds (Fig. 17). At this interval, carbonate beds pinch out to zero thickness toward the Butte fault. If the deposits were accumulating in an incrementally developing syncline, this is the relationship one would predict.
The above observations collectively point to the conclusion that the Chuar syncline was developing during deposition and faulting of the Chuar Group. The Butte fault and subordinate structures were instrumental to the development of the Chuar syncline, but remained buried during deposition of the Chuar Group (Fig. 18A). Early in Chuar time, intraformational faults offset Tanner Member deposits and the synclinal form began to take shape with incremental faulting (Figs. 18A and 18B). By
the end of Chuar time, incremental fault movement forms the Chuar syncline while the fault itself remains buried. During this interval, it is possible that some of the fi ne-grained sediments deposited east of the fault would have been eroded and recycled into the deposits on the west side of the fault. Sometime after Chuar Group time, the fault must have penetrated to the surface and created a scarp that would encourage the complete stripping of the Chuar Group from the east side of the fault (Fig. 18C).
The record of the emergent Butte fault may be recorded in the deposits of the Sixtymile Formation. This formation is truly a unique section in the Grand Canyon Supergroup. Work-ers have long recognized that the Sixtymile Formation marks dramatic faulting along the Butte fault system and represents the principal extensional event in the Neoproterozoic (Elston, 1979). Although the Sixtymile Formation does refl ect a dra-matic change in depositional style, we prefer the interpretation that the Sixtymile Formation records a continuation of Butte fault movement.
Walcott
Walcott
blackred
siliceous layers
0
20
40
60
Dep
th (
m)
dolomite
red to white siltstone with silicifiedbeds, breccias and convolute beds
shale
Sixtymile Canyon(Z)
Nankoweap Butte(X and Y)
syncline axis
concretion in black shale withevidence for rotation andminor translation toward theaxis
middle (siltstone) member(locally brecciated and slumped)
Walcott
(W) (E)
brecciated siltstone
Butte fault scarp~700 m
to the east
30momitted
soft-sedimentdeformation
742 Ma ash
Six
tym
ile
Cambrian Tapeats
slumped horizon
30momitted
sandstone with conglomerateinterbeds; breccia at base
Figure 17. Measured sections and schematic diagram of deformational features in the upper Chuar Group and Sixtymile Formation. The view is toward the north, parallel to the trace of the Butte fault and Chuar syncline. Carbonate beds of the upper Walcott Member pinch out toward the Butte fault, suggesting that syncline development continued through Walcott time. The end of Walcott Member deposition is marked by very large, disarticulated blocks of carbonate on a mudstone slip horizon. Sixtymile time is marked by deposition of clastic red beds and the develop-ment of incised channels within the formation.
on January 24, 2013specialpapers.gsapubs.orgDownloaded from
The Sixtymile Formation is present in only four places in the Chuar Valley, with outcrops atop Nankoweap Butte, and within Awatubi and Sixtymile Canyons (Fig. 2). The thickness of this formation was measured in multiple localities and is as thick as 60 m, though the actual depositional thickness remains unknown owing to erosion prior to deposition of the Tapeats Sandstone. Within this section a number of fi eld observations indicate that the formation represents a fundamental change in depositional envi-ronments and tectonic activity (Fig. 17). Near the base of the sec-tion are blocks of carbonate that are surrounded by fi ner grained siltstone and mudstone. The blocks lie within a narrow interval, and individual blocks appear to be rotated, suggesting that they were transported on bedding-parallel slip planes or slumps. In fact, early workers postulated that these blocks were derived from Chuar deposits east of the Butte fault, specifi cally the “doublet beds” of the Walcott Member (Elston, 1979). Our more reserved interpretation is that the carbonate blocks do not appear to be equivalent to the doublet, and the doublet beds pinch out west of the Butte fault (Fig. 17). More likely, the carbonate blocks were derived from another part of the Chuar section, but we have not been able to correlate these blocks directly to lower beds in the Chuar Group. Soft sediment deformation of fi ner grained beds within the same interval suggests that the blocks and deformation occurred while the deposits were still soft and wet.
Farther up section the Sixtymile Formation is dominated by thinly bedded siltstone. The siltstone beds are incised and infi lled by locally derived silicifi ed siltstone clasts. The incised channels are steep sided and locally as deep as 15 m (Fig. 17). The channel fi ll is weakly stratifi ed with interbedded sandstone and locally derived breccia. The incision into siltstone of the Sixtymile For-mation is interesting in that it suggests that there was some sort of change in relative base level, meaning either the land surface was uplifted relative to sea level, or sea level dropped. In either case the change in depositional environments had a profound effect on the development of the Butte fault and Chuar syncline. Without fi ne-grained deposits continually burying the Butte fault zone, continued incremental movement along the Butte fault likely reached the surface and created a fault scarp, as suggested by lower beds in the Sixtymile Formation. The Butte fault likely continued to move after Sixtymile time, resulting in the com-plete removal of Chuar deposits from the east side of the fault (Fig. 18D). The fi nal extensional movement of the Butte fault system ended late in Neoproterozoic time, prior to Tapeats Sand-stone deposition, but much of that record was lost to erosion.
THE NEOPROTEROZOIC EARTH SYSTEM AS “SEEN” THROUGH THE CHUAR GROUP
The Chuar Group captures a critical “snapshot” in Earth systems history. The combined data sets suggest that the Chuar Group was deposited during, or just before, the onset of low-latitude glaciations, and during the early rifting of the supercon-tinent Rodinia. Researchers are currently pursuing the Chuar Group and correlative strata to fi nd clues as to why the ensuing
A
B
C
D
Paleozoicrocks
UnkarGroup
Paleozoic rocks
Unkar
Tanner
Jupiter CarbonCanyon
DuppaCarbon Butte Awatubi
Walcott
Tanner
Jupiter
Unkar Group
Walcott
Sixtymile Formation
Awatubi
CarbonButte
DuppaMember
Carbon Canyon MemberJupiter MemberTanner Member
UnkarGroup
Carbon Butte Member
Duppa MemberCarbon Canyon Member
Jupiter MemberTanner Member
Jupiter Member
Tanner dolomite
Unkar Group
Tanner Member
Unkar Group
Tanner Member
Figure 18. Schematic time slices illustrating the growth history of the Chuar syncline at key intervals. (A) Time slice shows the truncation of the Tanner dolomite against a subordinate normal fault, with fault overlapped by Tanner Member shale, indicating that extensional fault-ing was synchronous with Tanner Member deposition. (B) Time slice illustrates the growth nature of the Chuar syncline during deposition of the Carbon Butte Member; note the postulated depocenter in the syn-cline and thinning of units over the footwall of a “blind” Butte fault. (C) Time slice displays our interpretation of syncline/fault relation-ships during Sixtymile Formation time. Note the pinch-out of dolo-mite units in the Walcott Member, the apparent truncation of the Chuar syncline by the Sixtymile Formation, and the tightening of the syncline at depth. (D) Time slice shows the present fault-syncline geometry in Lava Chuar Canyon (includes Laramide movement on the Butte fault). Unshaded layers or portions of layers indicate those rocks that have been eroded.
on January 24, 2013specialpapers.gsapubs.orgDownloaded from
The Neoproterozoic Earth system revealed from the Chuar Group of Grand Canyon 71
large-scale (possibly snowball-Earth-style) glaciations occurred and how these changes affected biotic evolution. Understanding the timing and tectonic style of the Chuar basin provides geolo-gists with more documentation on the complex disassembly of Rodinia, a problematic question owing to the long duration (200 m.y.) between initial rifting and the development of the Cor-dilleran miogeocline (e.g., Bond and Komintz, 1984; Timmons et al., 2001; Colpron et al., 2002).
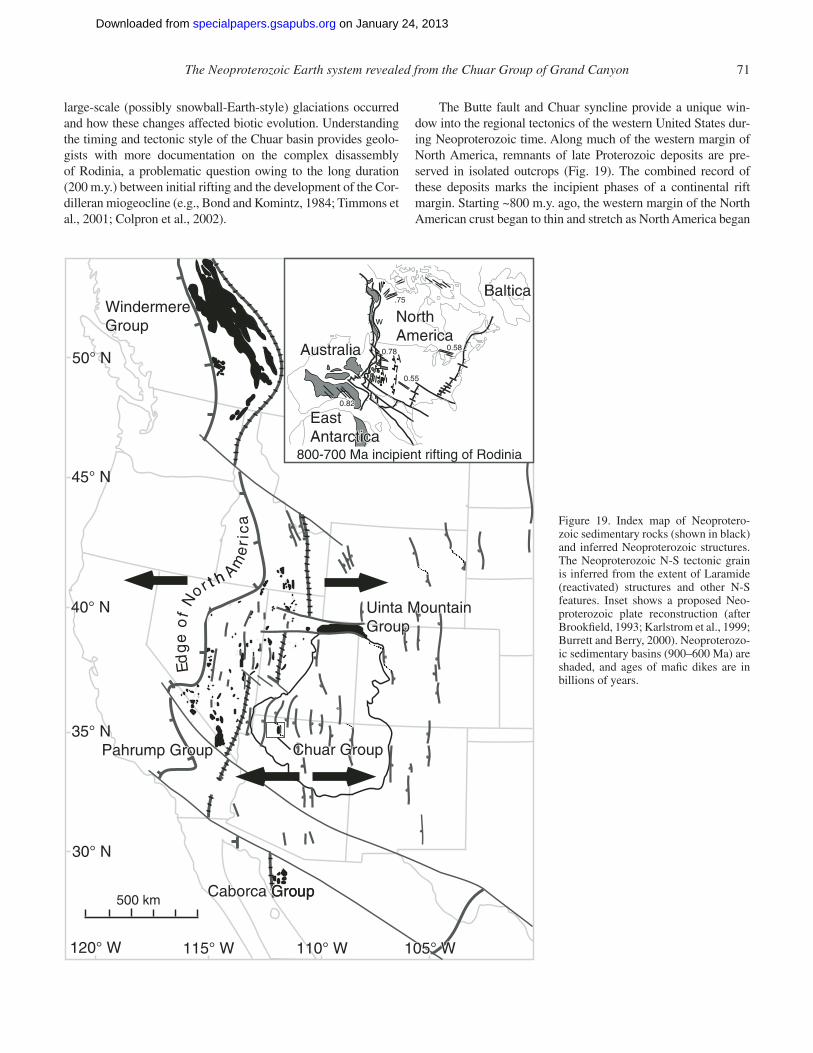
The Butte fault and Chuar syncline provide a unique win-dow into the regional tectonics of the western United States dur-ing Neoproterozoic time. Along much of the western margin of North America, remnants of late Proterozoic deposits are pre-served in isolated outcrops (Fig. 19). The combined record of these deposits marks the incipient phases of a continental rift margin. Starting ~800 m.y. ago, the western margin of the North American crust began to thin and stretch as North America began
Figure 19. Index map of Neoprotero-zoic sedimentary rocks (shown in black) and inferred Neoproterozoic structures. The Neoproterozoic N-S tectonic grain is inferred from the extent of Laramide (reactivated) structures and other N-S features. Inset shows a proposed Neo-proterozoic plate reconstruction (after Brookfi eld, 1993; Karlstrom et al., 1999; Burrett and Berry, 2000). Neoproterozo-ic sedimentary basins (900–600 Ma) are shaded, and ages of mafi c dikes are in billions of years.
on January 24, 2013specialpapers.gsapubs.orgDownloaded from
to rift away from other continental blocks. Within the Winder-mere Group of British Columbia, the Pahrump Group of Death Valley, and the Uinta Mountain Group of Utah, workers have identifi ed syn-extensional deposits, much like the Chuar Group (Link et al., 1993; Prave, 1999; Rybczynski, 2009; Dehler et al., 2010). The combined studies point to a major continental-scale rifting event that affected much of western North America, and is a proxy for what was going on worldwide at ca. 750 Ma.
The carbon-isotope excursions in the Chuar Group are of similar magnitude and age to strata in other places in the world, and indicate that the Chuar curve may represent a global-scale carbon cycle signature (Dehler et al., 2005). The cyclicity in the Chuar Group strata also refl ects a global phenomenon: fl uctua-tions in global sea level and ice volume throughout the history of the basins, with increasing ice volume by 750 Ma (Dehler et al., 2001). On a more local scale, changes in the shale geochem-istry suggest changing rainfall patterns throughout Chuar time. These data sets all point to a climate-regulated carbon cycle. One possible scenario is that many Chuar-type intracratonic rift basins formed in low-mid latitudes as the supercontinent was breaking up. The basins acted as sediment traps and, in concert with changing sea level and local rainfall patterns, buried enough carbon to cause the radical shifts in the carbon curve as seen, for example, in the upper Chuar Group. When enough carbon was removed from the atmosphere and buried in sediments, this could have caused a global CO
2 drawdown from the atmosphere,
potentially signifi cant enough to bring glaciers to lower latitudes and elevations.
The paleontological record of the Chuar Group provides indirect evidence for the onset of low-latitude glaciation as well. The lower Chuar Group documents a diverse commu-
nity of ornamented acritarchs (Nagy et al., 2009), consistent with other evidence that suggests that eukaryotes were diver-sifying during this time (Porter, 2004). In the upper Awatubi Member, however, ornamented acritarchs disappear, replaced in both shallow- and deeper water environments by blooms of the bacterium Sphaerocongregus variabilis. This fossil is typi-cally associated worldwide with “snowball Earth” glaciations; indeed, blooms of S. variabilis have been recovered from syn-glacial deposits (sediments deposited during glaciations) (Knoll et al., 1981). The appearance of bacterial blooms in the Chuar Group coincides with evidence for increased ice volume on the globe (inferred from stratigraphic cycles; see above), as well as biomarker evidence that the Chuar sea may have become eux-inic (anoxic and sulfi dic) at this time. Interestingly, this shift also coincides with the fi rst appearance of VSMs—fossils of heterotrophic protists that may have proliferated because of the organic-rich environment.
Research continues on the Chuar Group, and perhaps in the future there will be more concrete answers as to what caused the unusual changes recorded in these strata. If you are lucky enough to see the Chuar Group from one of the canyon rims, from the air, or on a hike, think of these strata not only as the gorgeous painted rocks of the Grand Canyon desert but as a “snapshot” in time, ~750 m.y. ago. Along this ancient, warm, quiet shoreline, shallow seas came in and out as glaciers waxed and waned in other nearby latitudes, diverse protists and bacteria fl oated in the water or grew on the surface of carbonate sands, and the ground occasionally shook from movement on the nearby Butte fault.
MANUSCRIPT ACCEPTED BY THE SOCIETY 6 JANUARY 2012
Printed in the USA
on January 24, 2013specialpapers.gsapubs.orgDownloaded from