Geology and Water Resources of the Bitterroot Valley, Southwestern Montana GEOLOGICAL SURVEY WATER-SUPPLY PAPER 1889 Prepared in cooperation with the Montana Bureau of Mines and Geology, Butte, Montana
Transcript
Geology and Water Resources of the Bitterroot Valley, Southwestern Montana
GEOLOGICAL SURVEY WATER-SUPPLY PAPER 1889
Prepared in cooperation with the Montana Bureau of Mines and Geology, Butte, Montana
Geology and Water Resources of the Bitterroot Valley, Southwestern MontanaBy R. G. McMURTREY, R. L. KONIZESKI, M. V. JOHNSON, and J. H. BARTELLS
With a section on CHEMICAL QUALITY OF WATER
By H. A. SWENSON
GEOLOGICAL SURVEY WATER-SUPPLY PAPER 1889
Prepared in cooperation with the Montana Bureau of Mines and Geology, Butte, Montana
A detailed study of the availability of water for future development in the Bitterroot Valley
U. 8, «. S.WATER RESOURCES DIVISION
ROLL A. MO.RECEIVED
APR 6 1972AM
UNITED STATES GOVERNMENT PRINTING OFFICE, WASHINGTON : 1972
I
UNITED STATES DEPARTMENT OF THE INTERIOR
ROGERS C. B. MORTON, Secretary
GEOLOGICAL SURVEY
W. A. Radlinski, Acting
Library of Congress catalog-card No. 74-180862
For sale by the Superintendent of Documents, U.S. Government Printing OfficeWashington, D.G. 20402 - (paper cover)
PLATE 1. Geohydrologic maps of Bitterroot Valley, southwesternMontana___________________________________ In pocket
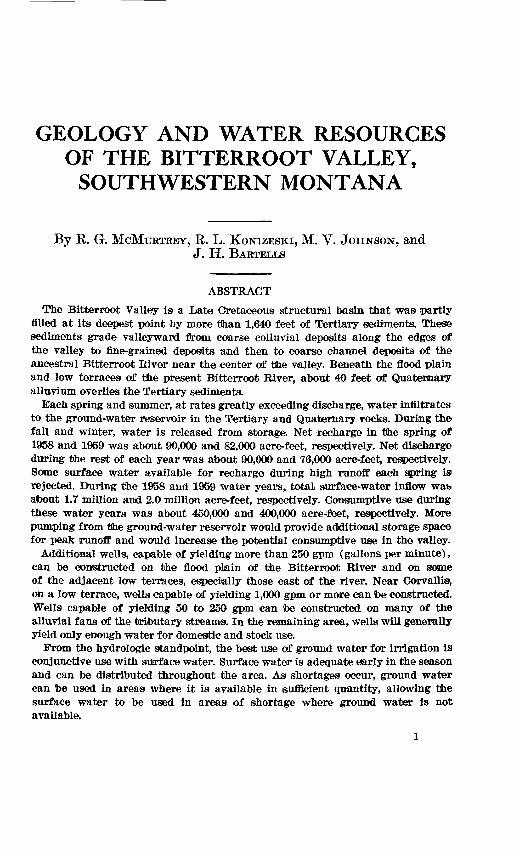
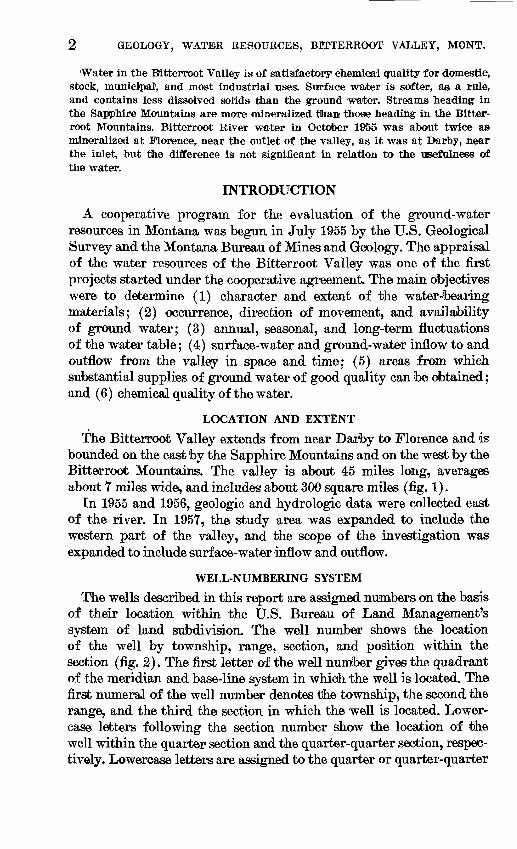
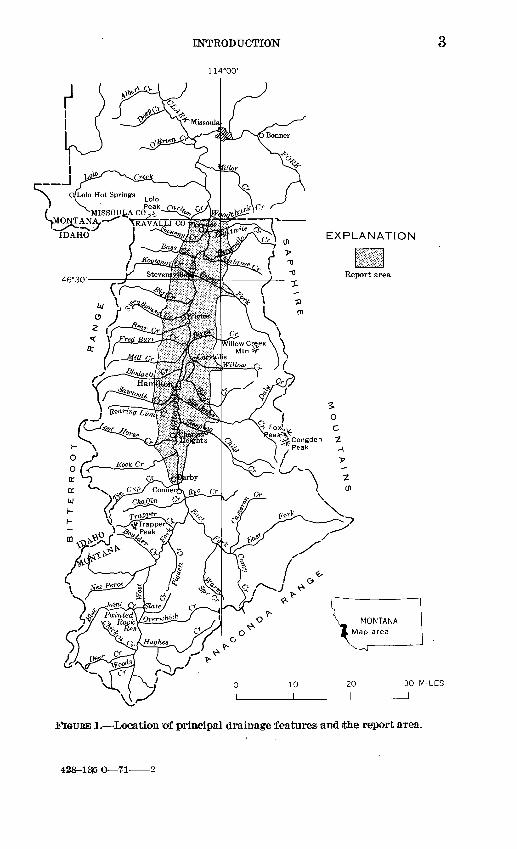
FIGURE 1. Map showing location of principal drainage features andthe report area.-___________-__-__---__--------__- 3
2. Sketch illustrating well-numbering system_______.-___- 43. Graphs showing average monthly precipitation and tem
perature at Stevensville.___---_______-__-_-_-_-_-- 64. Photograph showing eastern front of the Bitterroot
Mountains_ ___--___-_-_---__-_____-_--__---__-- 95. Diagrammatic north-south profile across Kootenai
Creek, showing glaciated canyon modified by post glacial (interlacustrine) stream erosion ______________ 10
6. Diagrammatic profile across eastern front of Bitterroot Mountains, showing high-level pediment between Bass and Sweeney Creeks, and remnants of a wave-cut bench.__________________________________________ 10
7. Physiographic diagram of terraces north of Burnt Forkand Big Greek.__________________________________ 11
8. Diagrammatic section across east side of Bitterroot Valley, showing east-west distribution of Tertiary sediments-_--_-_---_--_____--___--__---------- __ 16
9. Sketch map showing distribution of Tertiary detritus infront of tributary canyon._________-_--__--_-__-___ 17
10. Sketch showing gradational distribution of Quaternaryalluvium in Burnt Pork area.______________________ 24
11. Photograph showing deltaic deposits of glacial LakeMissoula, sec. 1, T. 9 N., R. 20 W ~ - 25
12. Photograph showing stratiform border-zone gneiss nearmouth of Blodgett Creek canyon__________---_- 28
CONTENTS V
Page FIGURE 13. Sketch map showing structures marginal to Bitterroot
Valley__-___-____-__________-__-__________...._._ 2914. Diagrammatic section across Bitterroot Valley south of
15. Typical Bitterroot River tributaries, 1958 wateryear_ _ _________________________________ 35
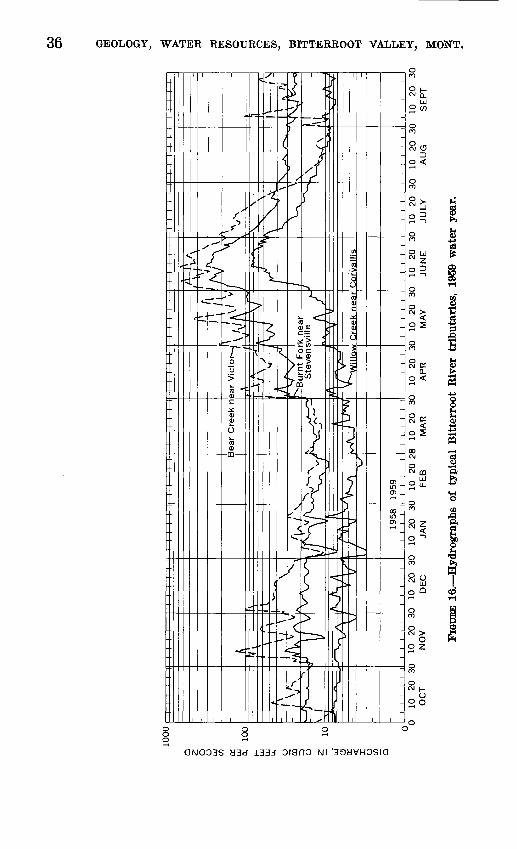
16. Typical Bitterroot River tributaries, 1959 wateryear.______ _________________________ 36
17. Bitterroot River near Florence and near Darby,Mont., 1958 water year__________________ 37
18. Bitterroot River near Florence and near Darby,Mont., 1959 water year.___________________ 38
19. Map showing subareas of Bitterroot River basin andlocation of stream-gaging stations.-__________________ 39
20. Hydrographs showing yearly inflow to, and outflow fromstudy area.______________________________________ 40
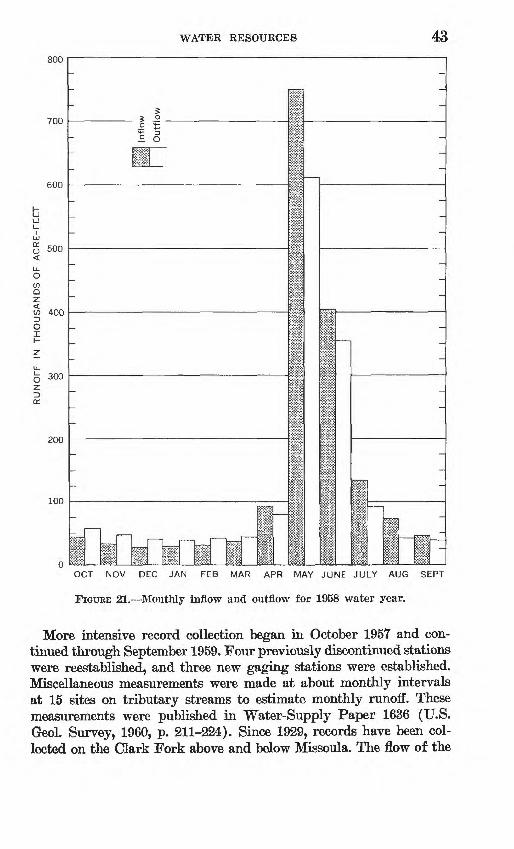
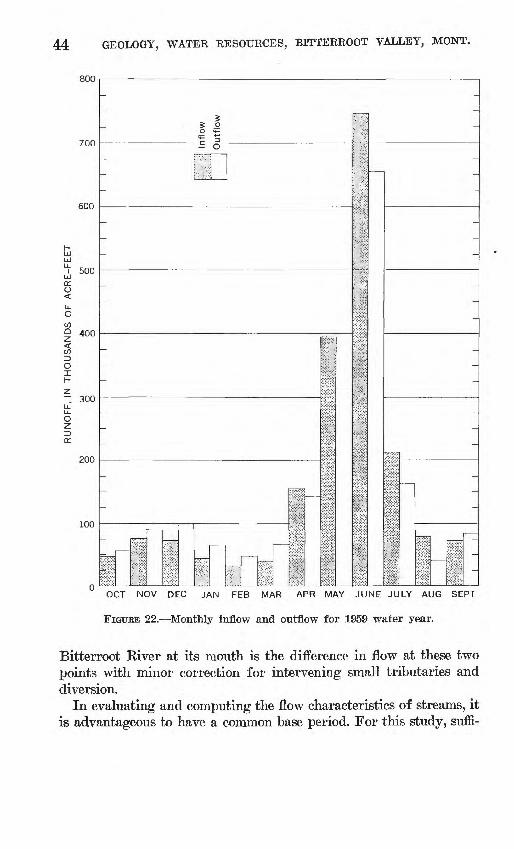
21-23. Graphs:21. Monthly inflow and outflow for 1958 water year_ 4322. Monthly inflow and outflow for 1959 water year_ 4423. Average monthly inflow and outflow, 1938-59. _ 45
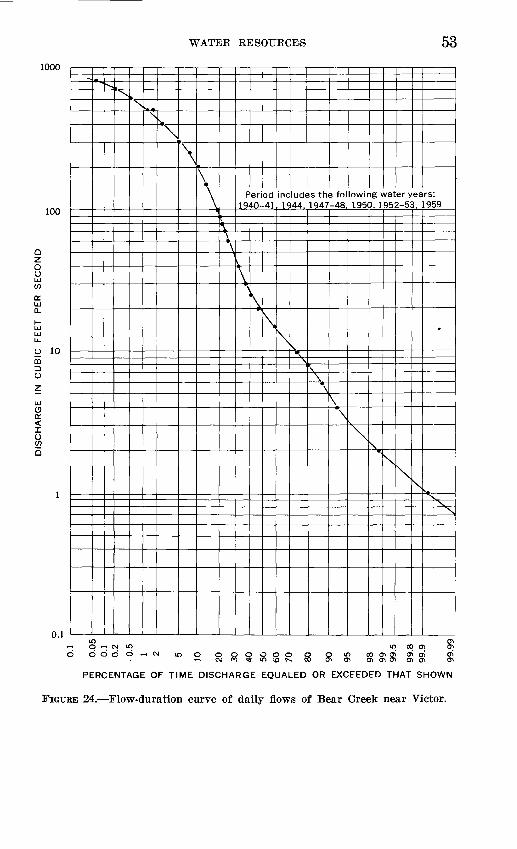
24. Flow-duration curve of daily flows of Bear Creek nearVictor___________________________________ 53
25. Flow-duration curve of monthly flows of Bitterroot Rivernear Florence.___________________________________ 54
26. Frequency of annual floods for some typical BitterrootRiver tributaries and for Bitterroot River____________ 55
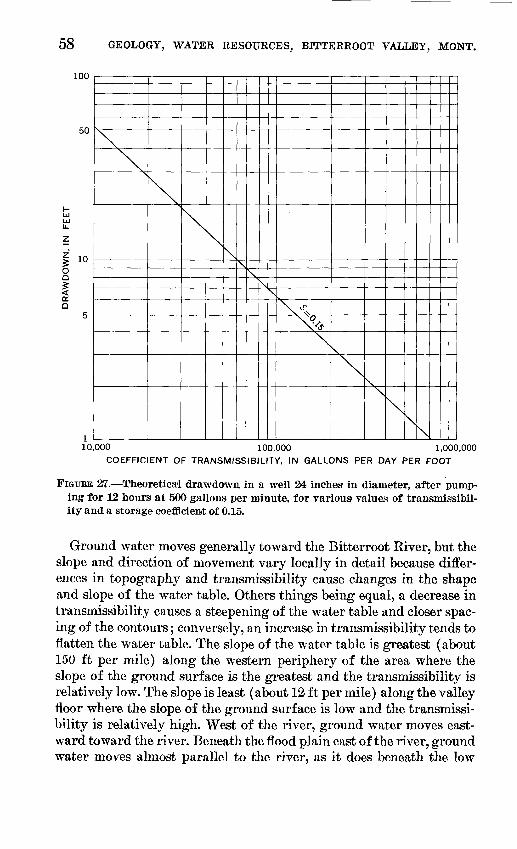
27-32. Graphs:27. Theoretical drawdown in a well 24 inches in
diameter, after pumpiug for 12 hours at 500 gallons per minute, for various values of transmissibility and a storage coefficient of 0.15----__- _____________________________ 58
28. Daily water-level fluctuations in well B9-20-26ba-___-________________________ 60
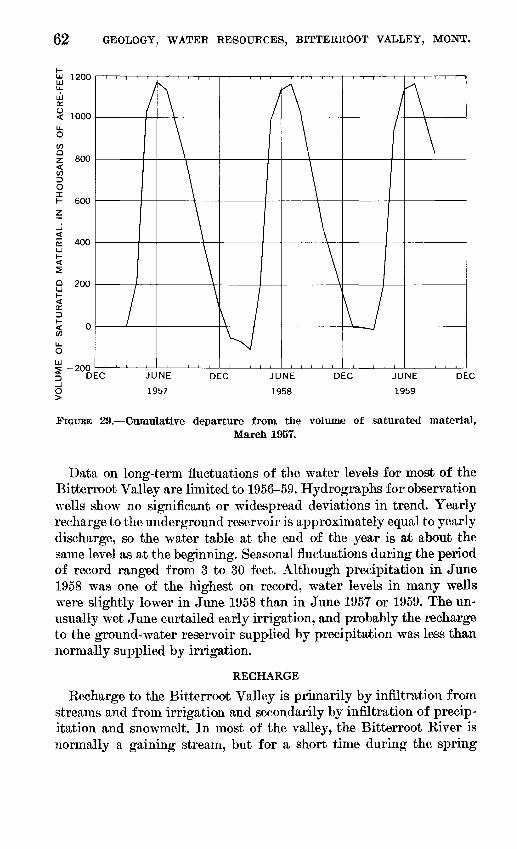
29. Cumulative departure from the volume ofsaturated material at the end of March 1957. _ 62
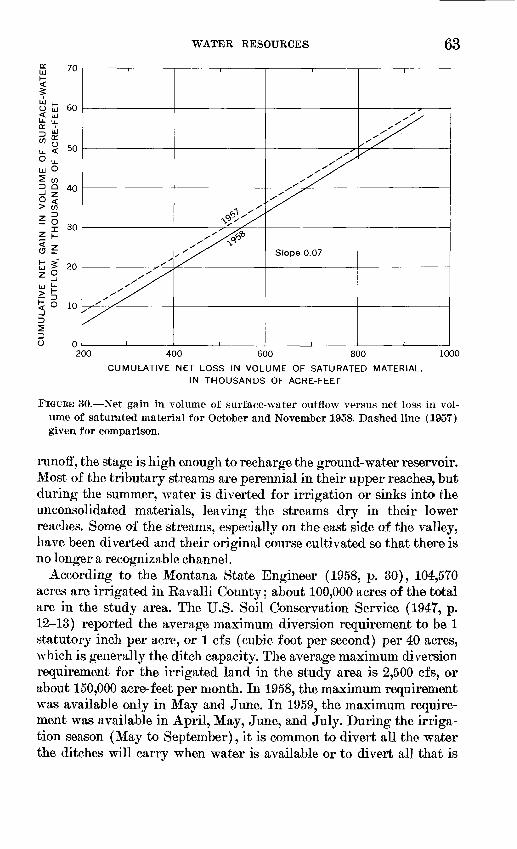
30. Net gain in volume of surface-water outflow versus net loss in volume of saturated material for October and November 1958__________ 63
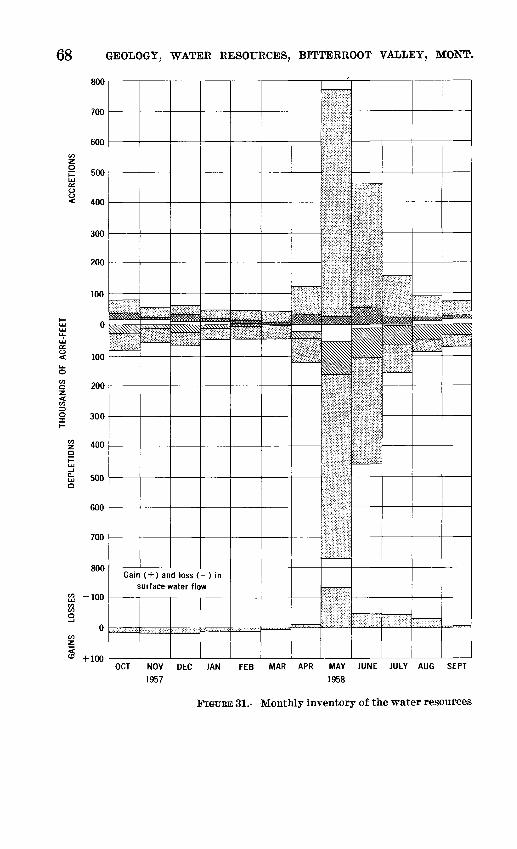
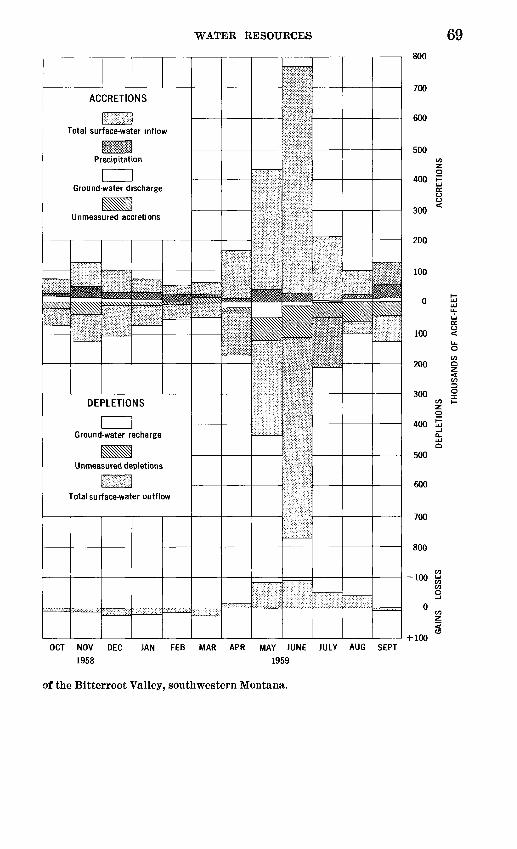
31. Monthly inventory of the water resources of theBitterroot Valley, southwestern Montana-___ 68
32. Hardness of waters from Darby to Florence. _ _ _ 76
VI CONTENTS
TABLES
Page TABLE 1. Water-bearing properties of rocks in the Bitterroot
Valley_-___-____-_____--__-____-------_-__-__-__- 132. Chemical analyses of Tertiary clay from the Bitterroot
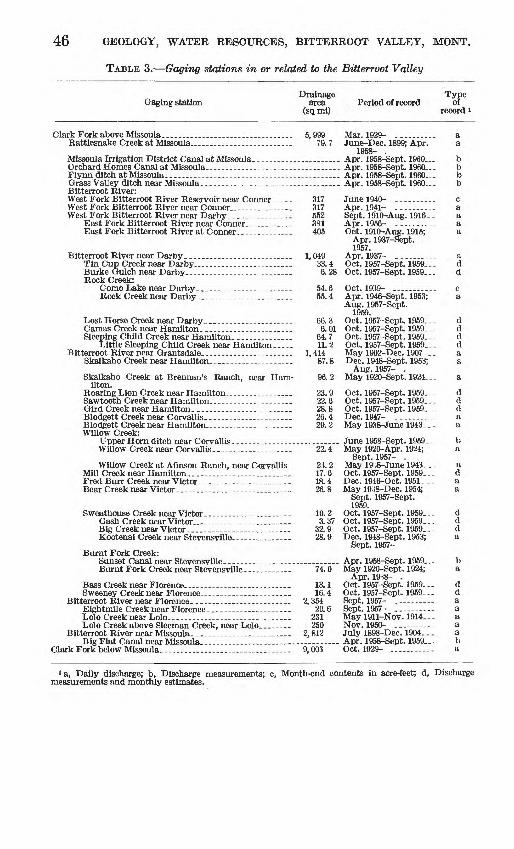
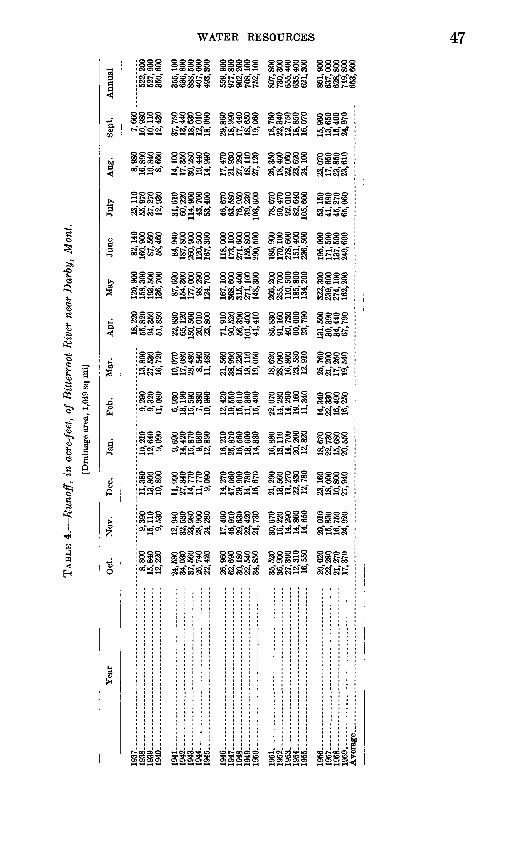
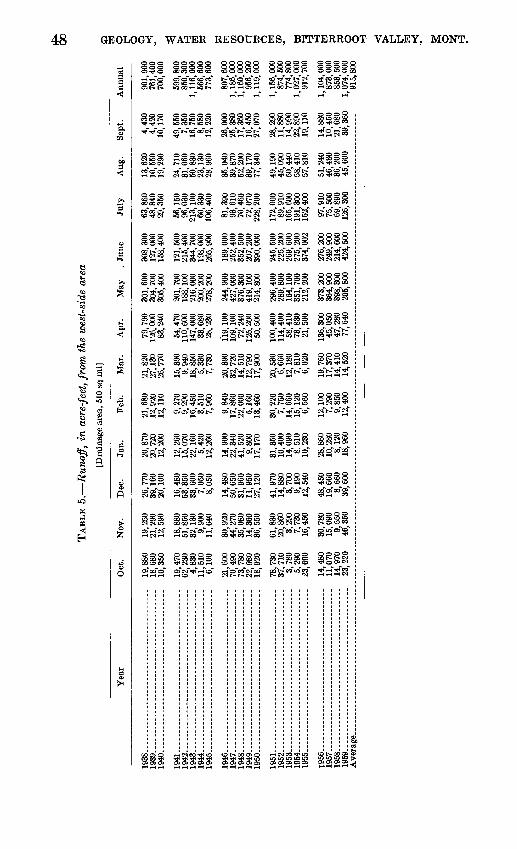
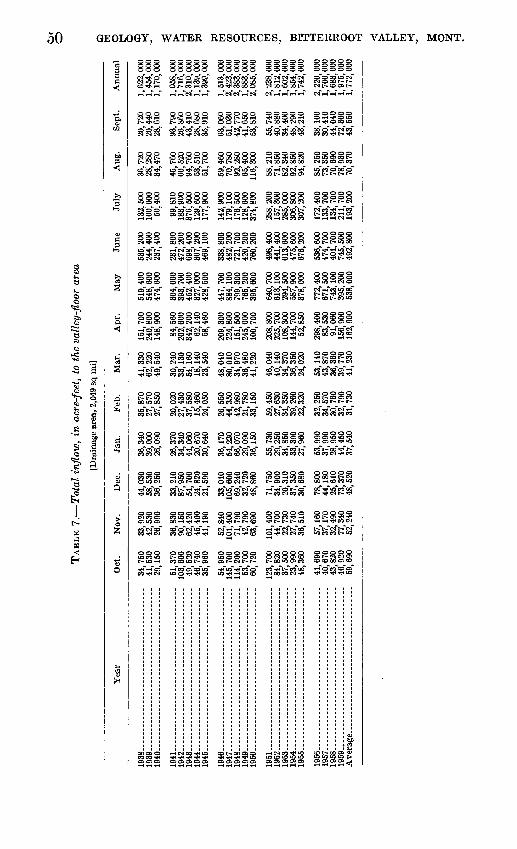
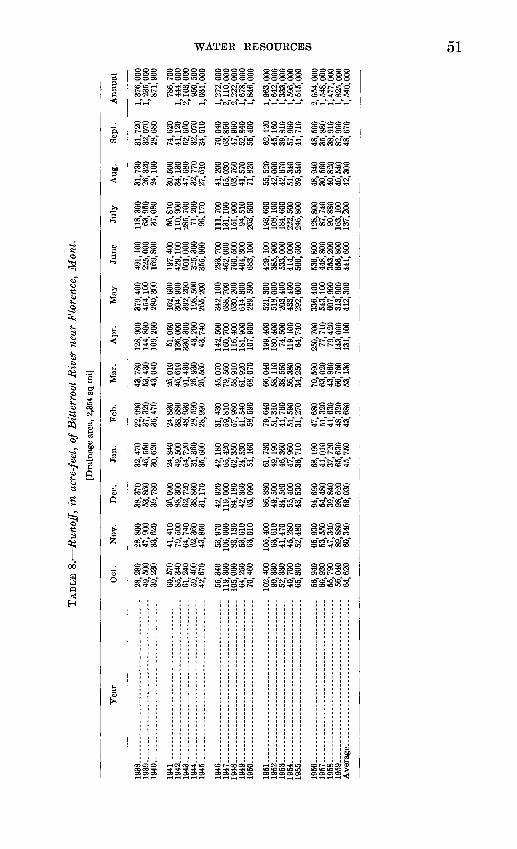
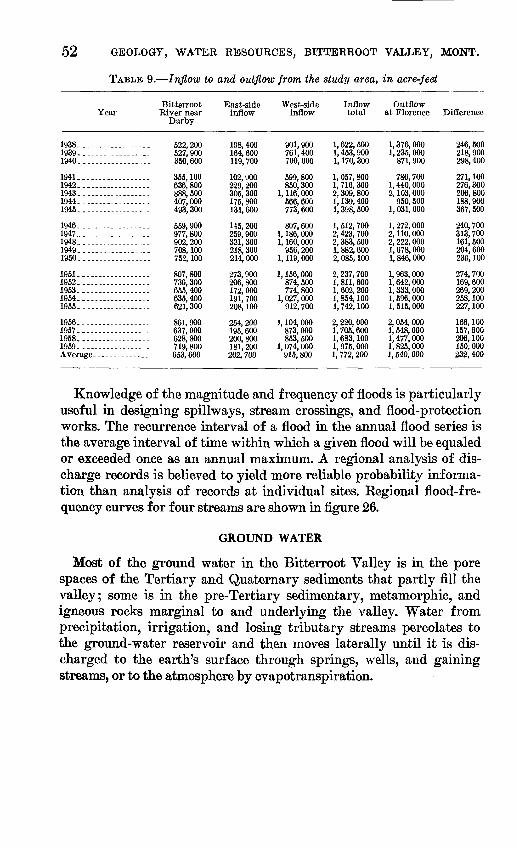
Valley____ _______ ________________________________ 183. Gaging stations in or related to the Bitterroot Valley _____ 464. Runoff of Bitterroot River near Darby, Mont_ __________ 475. Runoff from the west-side area______________________ 486. Runoff from the east-side area. _______________________ 497. Total inflow to the valley-floor area____-------__--_--__ 508. Runoff of Bitterroot River near Florence, Mont _________ 519. Inflow to and outflow from the study area- _____-___-___- 52
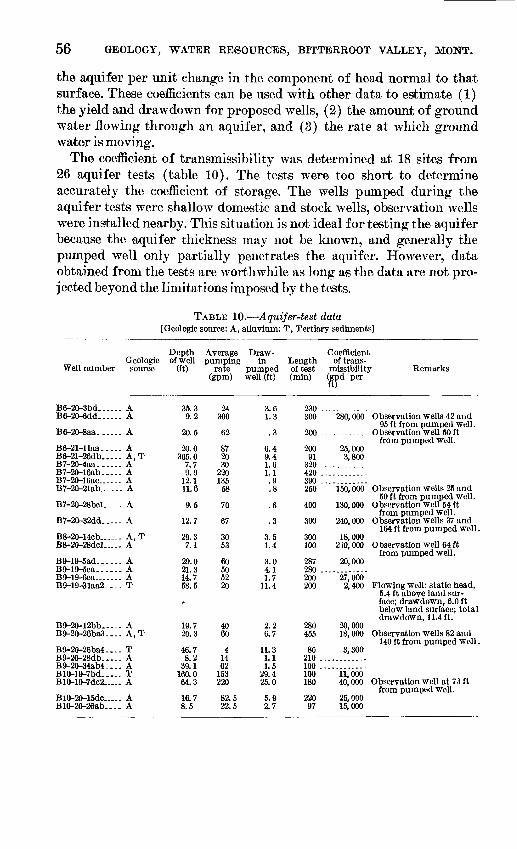
10. Aquifer-test data______________--___--__--_--__---_- 5611. Monthly change in volume of saturated material, cu
mulative monthly change in volume of saturated ma terial, and monthly change in volume of ground water in storage in the Bitterroot Valley _ __________________ 64
12. Monthly and annual changes in the water supply of theBitterroot Valley, water years 1958 and 1959_ _________ 70
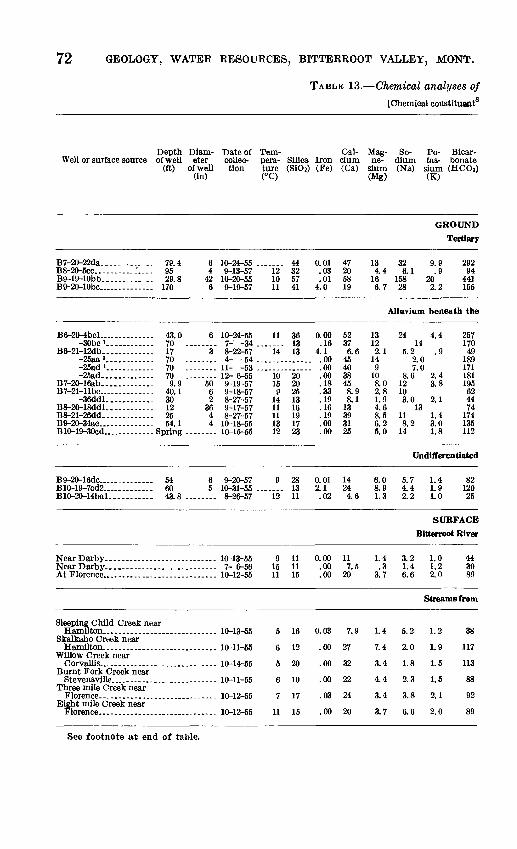
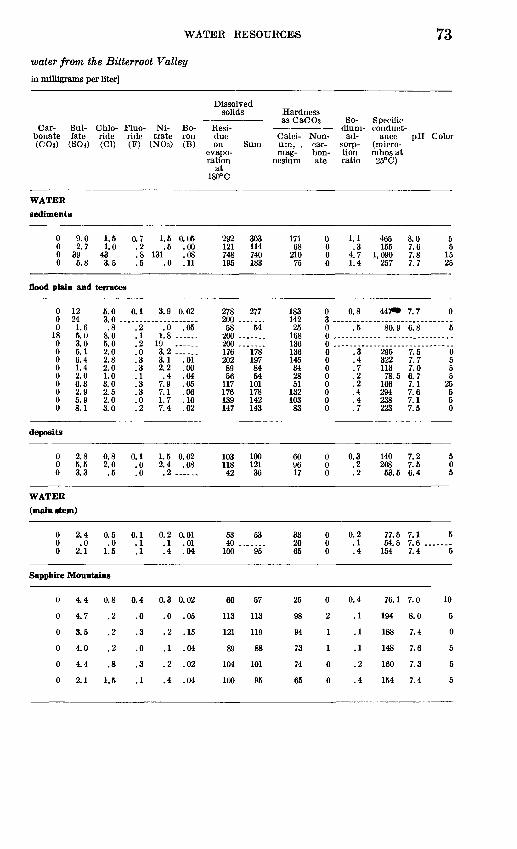
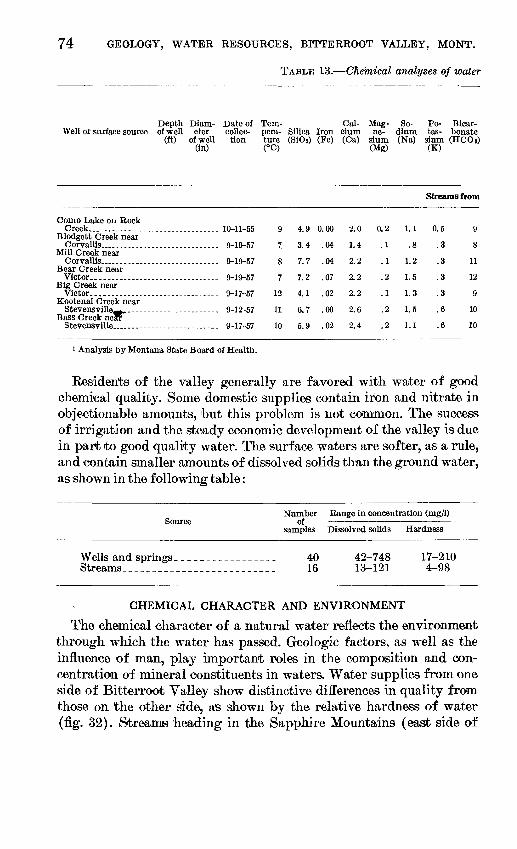
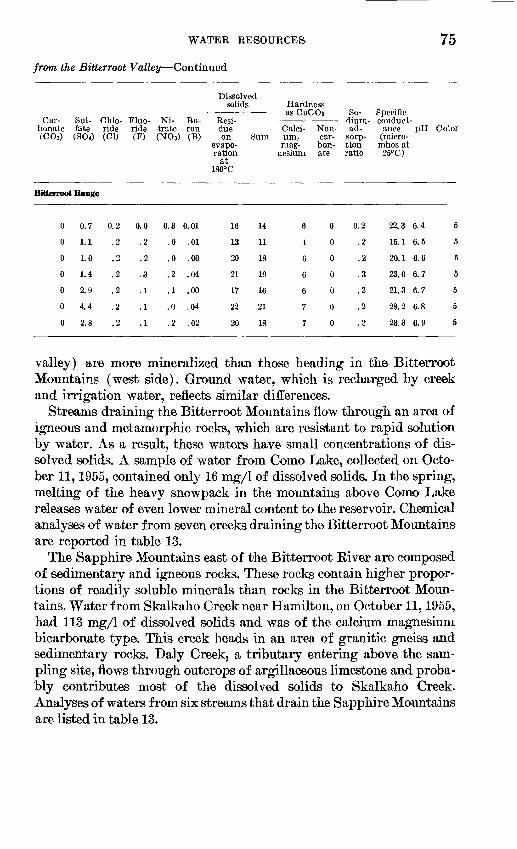
13. Chemicalan alyses of water from the Bitterroot Valley-- 72
GEOLOGY AND WATER RESOURCESOF THE BITTERROOT VALLEY,
SOUTHWESTERN MONTANA
By E. G. McMuRTEEY, K. L. KONIZESKI, M. V. JOHNSON, and J. H. BARTELLS
ABSTRACT
The Bitterroot Valley is a Late Cretaceous structural basin that was partly filled at its deepest point by more than 1,640 feet of Tertiary sediments. These sediments grade valleyward from coarse colluvial deposits along the edges of the valley to fine-grained deposits and then to coarse channel deposits of the ancestral Bitterroot River near the center of the valley. Beneath the flood plain and low terraces of the present Bitterroot River, about 40 feet of Quaternary alluvium overlies the Tertiary sediments.
Each spring and summer, at rates greatly exceeding discharge, water infiltrates to the ground-water reservoir in the Tertiary and Quaternary rocks. During the fall and winter, water is released from storage. Net recharge in tine spring of 1958 and 1959 was about 90,000 and 82,000 acre-feet, respectively. Net discharge during the rest of each year was about 90,000 and 76,000 acre-feet, respectively. Some surface water available for recharge during high runoff each spring is rejected. During the 1958 and 1959 water years* total surface-water inflow was about 1.7 million and 2.0 million acre-feet, respectively. Consumptive use during these water years was about 450,000 and 400,000 acre-feet, respectively. More pumping from the ground-water reservoir would provide additional storage space for peak runoff and would increase the potential consumptive use in the valley.
Additional wells, capable of yielding more than 250 gpm (gallons per minute), can be constructed on the flood plain of tine Bitterroot River and on some of the adjacent low terraces, especially those east of the river. Near Corvallis, on a low terrace, wells capable of yielding 1,000 gpm or more can be constructed. Wells capable of yielding 50 to 250 gpm can be constructed on many of the alluvial fans of the tributary stream®. In the remaining area, wells will generally yield only enough water for domestic and stock use.
From the hydrologic standpoint, the best use of ground water for irrigation is conjunctive use with surface water. Surface water is adequate early in the season and can be distributed throughout the area. As shortages occur, ground water can be used in area® where it is available in sufficient quantity, allowing the surface water to be used in areas of shortage where ground water is not available.
2 GEOLOGY, WATER RESOURCES, BITTERROOT VALLEY, MONT.
'Water in the Bitterroot Valley is of satisfactory chemical quality for domestic, stock, municipal, and most industrial uses. Surface water is softer, as a rule, and contains less dissolved solids than the ground water. Streams heading in the Sapphire Mountains are more mineralized than those heading in the Bitter- root Mountains. Bitterroot River water in October 1955 wasi about twice as mineralized at Florence, near the outlet of the valley, as it wasi at Darby,, near the inlet, but the difference is not significant in relation to the usefulness of the water.
INTRODUCTION
A cooperative program, for the evaluation of the ground-water resources in Montana was begun in July 1955 by the U.S. Geological Survey and the Montana Bureau of Mines and Geology. The appraisal of the water resources of the Bitterroot Valley was one of the first projects started under the cooperative agreement. The main objectives were to determine (1) character and extent of the water-bearing materials; (2) occurrence, direction of movement, and availability of ground water; (3) annual, seasonal, and long-term fluctuations of the water table; (4) surface-water and ground-water inflow to and outflow from the valley in space and time; (5) areas from which substantial supplies of ground water of good quality can be obtained; and (6) chemical quality of the water.
LOCATION AND EXTENT
The Bitterroot Valley extends from near Darby to Florence and is bounded on the east by the Sapphire Mountains and on the west by the Bitterroot Mountains. The valley is about 45 miles long, averages about 7 miles wide, and includes about 300 square miles (fig. 1).
In 1955 and 1956, geologic and hydrologic data were collected east of the river. In 1957, the study area was expanded to include the western part of the valley, and the scope of the investigation was expanded to include surface-water inflow and outflow.
WELL-NUMBERING SYSTEM
The wells described in this report are assigned numbers on the basis of their location within the U.S. Bureau of Land Management's system of land subdivision. The well number shows the location of the well by township, range, section, and position within the section (fig. 2). The first letter of the well number gives the quadrant of the meridian and base-line system in which the well is located. The first numeral of the well number denotes the township, the second the range, and the third the section in which the well is located. Lower case letters following the section number show the location of the well within the quarter section and the quarter-quarter section, respec tively. Lowercase letters are assigned to the quarter or quarter-quarter
INTRODUCTION
114°00 r
FIGURE 1. Location of principal drainage features and tlhe report area.
428-1315 O 71-
GEOLOGY, WATER RESOURCES, BITTERROOT VALLEY, MONT.
Well 89- 19-10 bb
FIGUBE 2. Well-numbering system.
sections in a counterclockwise order beginning with "a" in the north east quadrant. Suffix serial numbers, assigned in the order that the wells were inventoried, are added to the well numbers when more than one well wag inventoried in a quarter-quarter section. Springs are numbered in the same manner.
PREVIOUS INVESTIGATIONS
Lindgren (1904) gave a generalized geological description of the Bitterroot Valley. Douglass spent considerable time during 1889, 1901, and 1905, searching for vertebrate fossils to date the Tertiary sediments in the valley. His conclusions were published in 1909 and
GEOGRAPHY 5
hav« been cited by most of the later workers as a basis for their own Tertiary correlations. Langton (1935) and Boss (1950) described the regional stratigraphy and the rocks peripheral to the valley. Pardee wrate several papers (1910, 1940, 1942) relating to Lake Missoula of Pleistocene age, and a paper (1950) summarizing the late Cenozoic history of the northern Rocky Mountains and describing parts of the Bitterroot Valley.
The U.S. Soil Conservation Service (1947) prepared a report that furnishes data relating to water use, defines problems of water use and distribution, and predicts problems associated with prospective developments. McMurtrey and Konizeski (1956,1959) reported prog ress on this investigation from September 1955 to September 1956 and summarized geologic and ground-water data collected from September 1955 to August 1958.
ACKNOWLEDGMENTS
Appreciation is expressed to the residents of the valley who gave information about their wells, permitted measurements to be made in their wells, and allowed access to their land. Special thanks are given to those who acted as observers for precipitation stations established for this investigation. Valuable information was furnished by the well drillers in the area.
The cooperation and assistance of the following organizations and officials contributed to the success of the investigation: U.S. Forest Service, U.S. Soil Conservation Service, U.S. Weather Bureau, Uni versity of Montana, Ravalli County Improvement Association, Ravalli County Rural Development Association, Ravalli County Agent, Valley Water Co. at Hamilton, and officials of the towns of Stevensville and Darby.
GEOGRAPHY
CLIMATE
The Bitterroot Valley is characterized by mild winters, cool sum mers, light precipitation, and very little wind. Wide deviations from average precipitation are common. During 1912-59, the annual pre cipitation at Stevensville averaged 12.75 inches and ranged from 7.07 inches (1935) to 20.83 inches (1927). Average monthly precipitation at Stevensville ranges from 0.66 inch in August to 1.74 inches in June (fig. 3). More than 25 percent of the yearly precipitation is generally in May and June. Precipitation is considerably greater in the Bitter- root Mountains than in either the Sapphire Mountains or the valley.
Large daily and seasonal fluctuations in temperature are common. Average monthly temperatures at Stevensville range from a high of 65.8°F in July to a low of 23.1°F in January (fig. 3). The average
6 GEOLOGY, WATER RESOURCES, BITTERROOT VALLEY, MONT.
PRECIPITATION
110
TEMPERATURE
FIGURE 3. Average monthly precipitation and temperature at Stevensville.
GEOGRAPHY 7
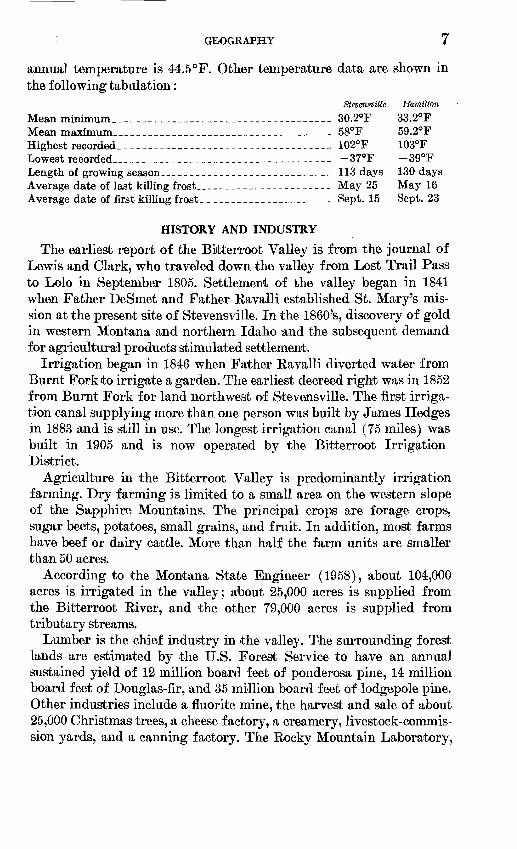
annual temperature is 44.5°F. Other temperature data are shown in the following tabulation:
Stevensville Hamilton
Meanminimum_________..________________-_-____---- 30.2°F 33.2°FMeanmaximum.___________________________ 58°F 59.2°FHighest recorded_________-____-__________-_-_-_--__- 102°F 103°FLowest recorded_--___-___--___---_______--_----_--_- -37°F -39°FLength of growing season___________________________ 113 days 130 daysAverage date of last killing frost_____________________ May 25 May 16Average date of first killing frost._____________________ Sept. 15 Sept. 23
HISTORY AND INDUSTRY
The earliest report of the Bitterroot Valley is from the journal of Lewis and Clark, who traveled down the valley from Lost Trail Pass to Lolo in September 1805. Settlement of the valley began in 1841 when Father DeSmet and Father Eavalli established St. Mary's mis sion at the present site of Stevensville. In the 1860's, discovery of gold in western Montana and northern Idaho and the subsequent demand for agricultural products stimulated settlement.
Irrigation began in 1846 when Father Eavalli diverted water from Burnt Fork to irrigate a garden. The earliest decreed right was in 1852 from Burnt Fork for land northwest of Stevensville. The first irriga tion canal supplying more than one person was built by James Hedges in 1883 and is still in use. The longest irrigation canal (75 miles) was built in 1905 and is now operated by the Bitterroot Irrigation District.
Agriculture in the Bitterroot Valley is predominantly irrigation farming. Dry farming is limited to a small area on the western slope of the Sapphire Mountains. The principal crops are forage crops, sugar beets, potatoes, small grains, and fruit. In addition, most farms have beef or dairy cattle. More than half the farm units are smaller than 50 acres.
According to the Montana State Engineer (1958), about 104,000 acres is irrigated in the valley; about 25,000 acres is supplied from the Bitterroot Eiver, and the other 79,000 acres is supplied from tributary streams.
Lumber is the chief industry in the valley. The surrounding forest lands are estimated by the U.S. Forest Service to have an annual sustained yield of 12 million board feet of ponderosa pine, 14 million board feet of Douglas-fir, and 35 million board feet of lodgepole pine. Other industries include a fluorite mine, the harvest and sale of about 25,000 Christmas trees, a cheese factory, a creamery, livestock-commis sion yards, and a canning factory. The Eocky Mountain Laboratory,
8 GEOLOGY, WATER RESOURCES, BITTERROOT VALLEY, MONT.
a research unit of the U.S. Department of Public Health, Education, and Welfare, is located at Hamilton. During the summer, the tourist trade is important.
TOPOGRAPHY
The Bitterroot Valley is one of many north-south-trending troughs in the Northern Rocky Mountains physiographic province (Fenne- man, 1931, p. 220). It separates the rugged Bitterroot Mountains on the west from the more subdued Sapphire Mountains on the east. The Bitterroot Mountains are characterized by aretes, cirques, glacial lakes, and other prominent glacial features. The serrated crest of the mountains is about 10 miles west of the valley axis but is 2 to 5 miles east of the drainage divide. Summit altitudes along the crest increase from 9,075 feet at Lolo Peak in the north to 10,131 feet at Trapper Peak in the south.
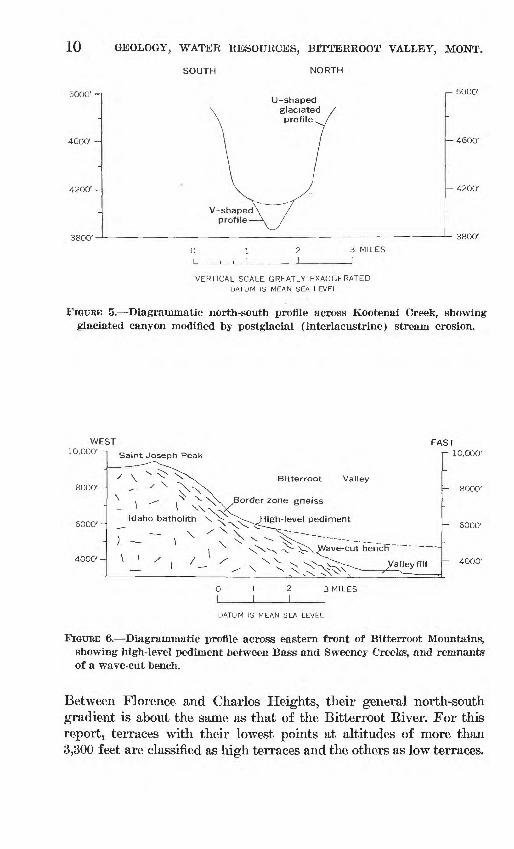
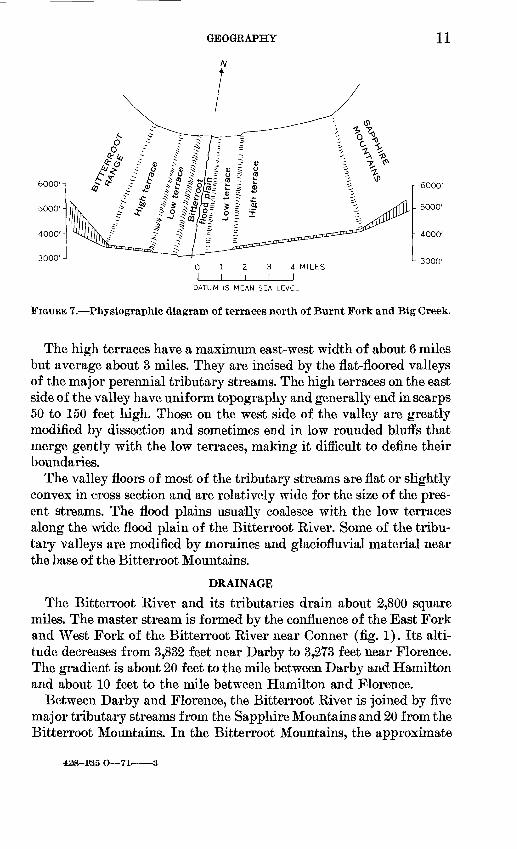
The remarkably uniform front of the Bitterroot Mountains (fig. 4) is a series of triangular spurs separated by narrow steep-walled can yons. These canyons, which are remarkably straight and approsa- mately parallel to each other, head in glacial cirques west of the crest of the mountains. The canyons are U-shaped in cross section, but the northernmost ones have deep V-shaped gorges in their lower courses (fig. 5). The uniformity of the triangular spurs is interrupted by gla cial scour at altitudes above 7,000 feet and by local pediments between 6,000 and 7,000 feet. The surface of a pediment between Bass Creek and Sweeney Creek, if projected eastward, is about 1,500 feet above the central part of the valley (fig. 6). Remnants of a wave-cut bench of ancient glacial Lake Missoula (Pardee, 1910) occur at and below an altitude of 4,200 feet.
The Sapphire Mountains are characterized by moderately rounded profiles. Much of the surface is underlain by thin rocky soil, but bed rock crops out along the steeper slopes. Most of the summits are at alti tudes below 8,500 feet, but Fox and Congdon peaks attain altitudes of 8,788 and 8,870 feet. The front of the mountains is very irregular. It borders the east side of the Bitterroot River from the confluence of the East Fork and West Fork to Skalkaho Creek, then recedes about 3 miles eastward. North of Woodchuck Creek at the Missoula County line, the front borders the river again. Relief is generally abrupt south of Skalkaho Creek and more subdued to the north.
The most striking topographic features within the valley are the great terraces that extend gently downward from the mountains (fig. 7). They have been modified by dissection and aggradation, but they generally slope into the valley at dips ranging from 4° or 5° near the margins of the valley to less than 1° near the center of the valley.
GEOGRAPHY 9
10
4600' -\
4200' -\
GEOLOGY, WATER RESOURCES, BITTERROOT VALLEY, MONT.
SOUTH NORTH
i 5000' U-shaped
glaciated profile
4600'
4200'
V-shaped profile
3800'
3 MILES
VERTICAL SCALE GREATLY EXAGGERATED
DATUM IS MEAN SEA LEVEL
FIGURE 5. Diagrammatic north-south profile across Kootenai Creek, showing glaciated canyon modified by postglacial (interlacustrine) stream erosion.
WEST10,000' -! jnt joseph Peak
8000' -
6000' -
Bitterroot Valley
. ^ - x^x^ ^Border zone gneiss
Idaho batholith \
\ / ^> \ \
4000'-| \ > / t / /
EASTr io,ooo'
\- 8000'
h 6000'
h 4000'
DATUM IS MEAN SEA LEVEL
FIGURE 6. Diagrammatic profile across eastern front of Bitterroot Mountains, showing high-level pediment between Bass and Sweeney Creeks, and remnants of a wave-cut bench.
Between Florence and Charlos Heights, their general north-south gradient is about the same as that of the Bitterroot River. For this report, terraces with their lowest points at altitudes of more than 3,300 feet are classified as high terraces and the others as low terraces.
GEOGRAPHY
A/
11
DATUM IS MEAN SEA LEVEL
FIGURE 7. Physiographic diagram of terraces north of Burnt Fork and Big Creek.
The high terraces have a maximum east-west width of about 6 miles but average about 3 miles. They are incised by the flat-floored valleys of the major perennial tributary streams. The high terraces on the east side of the valley have uniform topography and generally end in scarps 50 to 150 feet high. Those on the west side of the valley are greatly modified by dissection and sometimes end in low rounded bluffs that merge gently with the low terraces, making it difficult to define their boundaries.
The valley floors of most of the tributary streams are flat or slightly convex in cross section and are relatively wide for the size of the pres ent streams. The flood plains usually coalesce with the low terraces along the wide flood plain of the Bitteiroot River. Some of the tribu tary valleys are modified by moraines and glaciofluvial material near the base of the Bitterroot Mountains.
DRAINAGE
The Bitterroot River and its tributaries drain about 2,800 square miles. The master stream is formed by the confluence of the East Fork and West Fork of the Bitterroot River near Conner (fig. 1). Its alti tude decreases from 3,832 feet near Darby to 3,273 feet near Florence. The gradient is about 20 feet to the mile between Darby and Hamilton and about 10 feet to the mile between Hamilton and Florence.
Between Darby and Florence, the Bitterroot River is joined by five major tributary streams from the Sapphire Mountains and 20 from the Bitterroot Mountains. In the Bitterroot Mountains, the approximate
428-1SS O 71 3.
12 GEOLOGY, WATER RESOURCES, BUTTERROOT VALLEY, MONT.
ratio of total length of stream to gradient per unit length of stream decreases from about 10 miles long by 600 feet of drop per mile in the north, to about 15 miles long by 300 feet of drop per mile in the south.
In the mountains, all of the major tributary streams flow on or close to bedrock. In the Bitterroot Valley, they flow over loose, unconsoli- dated sediments, and large volumes of water are lost by seepage. Dur ing the growing season, much of the remaining water is diverted for irrigation, and the lower courses of the streams are dry.
GEOLOGY
STRATIGRAPHY AND HYDROLOGIC CHARACTER OF ROCKS
The Sapphire Mountains are formed mostly of Precambrian sedi mentary rocks and partly of Cretaceous intrusive rocks and associated metamorphic rocks. The Bitterroot Mountains are formed mostly of Cretaceous intrusive rocks and associated masses of metamorphosed Precambrian rocks. Early Tertiary volcanic rocks occur locally along the edge of the mountains and within the valley. Since its Late Creta ceous origin, the valley has been partly filled, at its deepest point, by more than 1,680 feet of sediments derived mostly by weathering and erosion of the mountains and to a lesser extent by accumulation of volcanic ejecta.
Hydrologieally, the Precambrian sediments, the Cretaceous intru- sives and metamorphics, and the early Tertiary volcanicscan be consid ered together because they have similar abilities to store and transmit water. In general, these rocks are hard and dense and yield water only from fractures. An exception seems to be the Newland Limestone (p. 41), which transmits water through solution cavities. Fractures related to structural movement are common in the hard dense rocks, and most wells intersect enough fractures to yield 1 to 10 gpm (gallons per minute) initially. Because the amount of water stored in each frac ture is small, well yields soon diminish unless the fractures are recharged by surface water or by seepage from the overlying unconsoli- dated rocks. Although the average permeability is small, the rocks are exposed over large areas, and their aggregate effect is important. Water released from these rocks sustains the flow of many springs and the base flow of streams.
The hydrologic properties of the Tertiary sediments and of the Quaternary rocks are discussed with the geologic description of these units. Table 1 is a summary of the water-bearing characteristics of the rocks in the Bitterroot Valley. The distribution of the rocks is shown on plate 1.
GEOLOGY 13
TABLE 1. Water-bearing properties of rocks in the Bitterroot Valley
System
Quaternary
Tertiary
Pre-Tertiary
Series
Holocene
Pleistocene
Formation
Alluvium
Qlaciofluvial, glaciolacustrine, talus, and fan deposits.
Colluvium
Flood-plain and channel deposits.
Undifferentiated Precambrian and Cretaceous rocks.
Description
Stream-deposited clay, silt, sand, gravel, and boulders reworked from older Cenozoic deposits.
Unsorted morainal and talus deposits ranging in size from clay to boulders; and stratified to poorly stratified glaciofluvial, glaciolacustrine, and fan deposits.
Poorly sorted coarse angular sand and gravel.
Silt and clay flood-plain deposits, and sand and gravel channel deposits, tuffaceous in places.
Dense, relatively impermea ble sedimentary, meta- morphic, and igneous rocks marginal to and underlying the Bitterroot Valley.
Water-bearing properties
Alluvium is the most produc tive aquifer in area; yield of wells is somewhat variable but adequate for domestic and stock needs; along the Bitterroot River the yield is sufficient for irrigation, municipal, or industrial wells.
Yields of wells are generally adequate for domestic and stock needs but vary with degree of sorting and thickness of water-bearing zones.
Not known to yield water to wells.
Yields small supplies adequate for stock and domestic wells from saturated channel sand and gravel. Fine-grained deposits are not known to yield water to wells.
Small supplies yielded to Wrlls from joints and from weathered surficial material.
PREGAMBRIAN ROCKS
The oldest rocks exposed along the margins of the Bitterroot Valley are Precambrian sedimentary rocks assigned to the Eavalli Group and Newland Limestone of the Belt Supergroup. Kocks of the Kavalli Group crop out over large areas east of the valley between Eight Mile Creek and Birch Creek and in a narrow zone along the west side of the valley from the Eavalli County line south of Sweeney Creek. These rocks are mostly dark-gray quartzites and quartzitic argillites. Rocks of the Newland Limestone crop out over large areas east of the valley between Soft Rock Creek and Gird Creek, as small inliers at Chaffin Butte, and on the west side of the valley near the mouths of Big Creek and Sweathouse Creek. These rocks are mostly dark-bluish- gray argillaceous limestones and limy argillites. Belt rocks also prob ably underlie much of the valley fill.
CRETACEOUS ROCKS
Cretaceous rocks marginal to the Bitterroot Valley are components of either the Idaho batholith, its associated masses, or its border zone. They have been described in detail by Lindgren (1904), Langton (1935), Ross (1936, 1947, 1950), Anderson (1952), Chapman, Gott- fried, and Waring (1955), Larsen and Schmidt (1958), and Larsen and others (1958).
14 GEOLOGY, WATER RESOURCES, BETTERROOT VALLEY, MONT.
IDAHO BATHOLITH AND ASSOCIATED MASSES
The Bitterroot Mountains west of Montana are underlain by gra nitic rocks of the Idaho batholith. These rocks are mostly gray quartz monzonite with small stocks of granodiorite and anorthite. Outlying masses also occur on the mountain slopes east of the Bitterroot Valley between Threemile and Ambrose Creeks and between Willow and Sleeping Child Creeks.
BORDER-ZONE GNEISS
Eoss (1950, p. 153-154, 158) stated that "the border-zone gneiss comprises only the eastern ends of the spurs of the Bitterroot Range * * * and includes only the rock that has a distinctly laminated or stratiform character * * *." The principal minerals are quartz, pot ash feldspar, sodic plagioclase, biotite, other micas, and some myrme- kite. It averages about 2,000 feet thick over its entire north-south extent (S. L. Groff, written comniun., 1954).
Eoss, Andrews, and Witkind, (1955) showed a large mass of border- zone gneiss (injection gneiss of Eoss, 1950, p. 151) east of the Bitter- root Valley between Sleeping Child Creek and Darby. Similar rocks also crop out on the low foothills between Chaffin and Tin Cup Creeks and along many of the high terrace scarps between Chaffin and Eoar- ing Lion Creeks.
TERTIARY ROCKS
VOLCANIC ROCKS
Tertiary volcanic rocks crop out locally on the high terraces near the mouths of the Sweeney Creek and Sweathouse Creek canyons in sec. 16, T. 10 N., E. 20 W., and sec. 33, T. 8 N., E. 21 W., and on both sides of the Bitterroot Eiver between Lost Horse Creek and Chaffin Creek. In some areas, they intrude the border-zone gnesiss and older rocks, and fragments of them are included in the Pliocene strata along Blodgett Creek in isec. 15, T. 6 N., E. 21 W. Their composition ranges from acidic to basic. Welded tuffs near the mouth of Sweeney Creek canyon include angular fragments of Belt and granitic rocks.
SEDIMENTARY ROCKS
Unconsolidated to semiconsolidated Tertiary sedimentary rocks con stitute most of the valley fill. They are referred to in this report as Tertiary strata. The various pre-Tertiary bedrock inliers, the irregu lar eastern margins of the valley, and the drilling data indicate that the Tertiary strata rest on a surface of moderate to high relief formed
GEOLOGY 15
on Precambrian Belt rocks and Cretaceous border-zone rocks. How ever, gravimetric work by M. H. Manghnani (oral commun., 1959) under the supervision of the Department of Geology, University of Montana, indicates a basal cross-valley profile near Florence of very low relief. Except on the high terraces along the east side of the val ley, the Tertiary strata are mostly overlain by Quaternary alluvium (pl.l).
The total thickness of the exposed Tertiary section is apparently rep resented in the Threemile Creek-Ambrose Creek area. The maximum measured thickness is 227 feet in sec. 25, T. 10 N"., R. 19 W. (See strati- graphic section below.) However, a test well drilled in 1922 by the Bitterroot Oil Co. in sec. 6, T. 6 N., E. 20 W., reportedly bottomed in unconsolidated sediments at 1,450 feet (Vine and Erdmann, 1952, p. 6). The top 30 or 40 feet of the well penetrated Quaternary alluvium, the remainder Tertiary strata. Field relationships indicate that strata penetrated by the oil well are lower in the section than exposures in sec. 25, T. 10 N"., R. 19 W., thus, the cumulative thickness of Tertiary strata is at least 1,640 feet. Gravimetric work by M. H. Manghnani in dicates a probable thickness of 2,000 ±200 feet near the center of the valley east of Florence (oral commun., 1959).
Section of Tertiary strata measured along a Huff in sec. 25, T. 10 N., R. 19 W.
FeetSilt and clay, buff; contains much mica; weathers into nodules_______ 17 Sand, buff______________________________________ 10 Sand, buff, arkosic, well-sorted, well-bedded__________________ 8 Sand, buff, arkosic; contains pebbles up to 1 in. in diameter and is ce
mented with clay and some volcanic ash___________________ 5 Sand, buff, arkosic, medium-sorted, well-bedded________________ 10 Covered _________________________________________ 65 Clayey silt, buff, thin-bedded ; weathers into nodules_____________ 5 Ash, gray, thin-bedded________________________________ 6 Sand, buff, arkosic___________________________________ 30 Covered _______________________________________ 20 Clayey silt, buff, thin-bedded; weathers into nodules; contains enough ash
to give beds a pale-gray appearance from the distance. These beds dip from 1° to 5° valleyward and to the north. The dip decreases valleyward and is consistently a little less than that of the terrace__________ 22
Sand, buff, arkosic; contains some ash and poorly sorted pebbles up to *4in. in diameter, cemented by clay and silt___________________ 23
Clayey silt, buff; contains some ash________________________ 6
Total _______________________________________ 227
The Tertiary strata are mostly detritus from the mountains but also contain volcanic ejecta. Coarse colluvial deposits along the base of the mountains grade valleyward into fine-grained alluvial-fan deposits
16 GEOLOGY, WATER RESOURCES, BITTERROOT VALLEY, MONT.
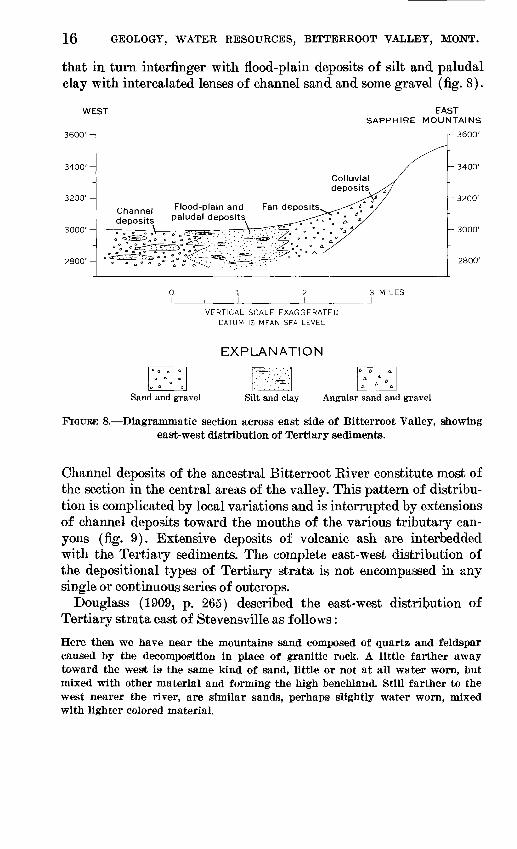
that in turn interfinger with flood-plain deposits of silt and paludal clay with intercalated lenses of channel sand and some gravel (fig. 8).
WEST
3600' -i
3200' -
2800'- .
Flood-plain and P aludal deposits
EAST SAPPHIRE MOUNTAINS
r- 3600'
- 3400'
- 3200'
- 3000'
- 2800'
VERTICAL SCALE EXAGGERATED DATUM IS MEAN SEA LEVEL
EXPLANATION
3 MILESJ
Sand and gravel Silt and clay Angular sand and gravel
FIGURE 8. Diagrammatic section across east side of Bitterroot Valley, showing east-west distribution of Tertiary sediments.
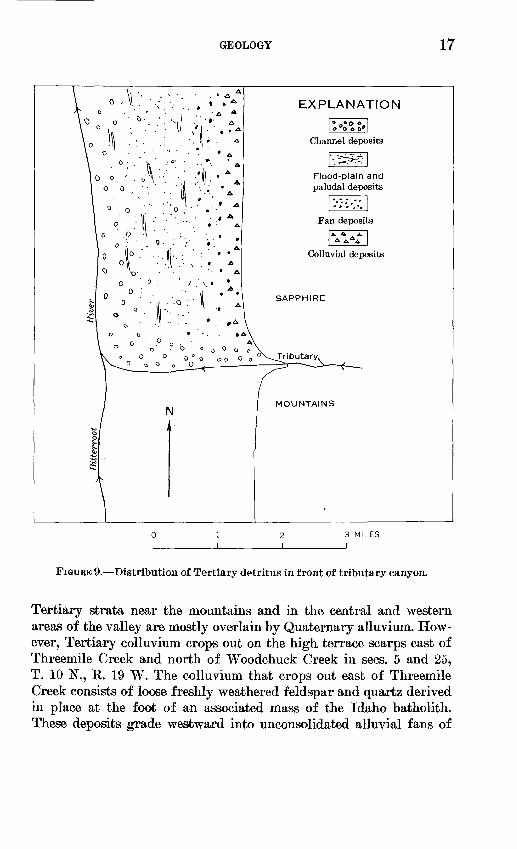
Channel deposits of the ancestral Bitterroot River constitute most of the section in the central areas of the valley. This pattern of distribu tion is complicated by local variations and is interrupted by extensions of channel deposits toward the mouths of the various tributary can yons (fig. 9). Extensive deposits of volcanic ash are interbedded with the Tertiary sediments. The complete east-west distribution of the depositional types of Tertiary strata is not encompassed in any single or continuous series of outcrops.
Douglass (1909, p. 265) described the east-west distribution of Tertiary strata east of Stevensville as follows:
Here then we have near the mountains sand composed of quartz and feldspar caused by the decomposition in place of granitic rock. A little farther away toward the west is the same kind of sand, little or not at all water worn, but mixed with other material and forming the high benchland. Still farther to the west nearer the river, are similar sands, perhaps slightly water worn, mixed with lighter colored material.
GEOLOGY 17
EXPLANATION
Channel deposits
Flood-plain and paludal deposits
3 MILES
FIGURE 9. Distribution of Tertiary detritus in front of tributary canyon.
Tertiary strata near the mountains and in the central and western areas of the valley are mostly overlain by Quaternary alluvium. How ever, Tertiary colluvium crops out on the high terrace scarps east of Threemile Creek and north of Woodchuck Creek in sees. 5 and 25, T. 10 N., K. 19 W. The colluvium that crops out east of Threemile Creek consists of loose freshly weathered feldspar and quartz derived in place at the foot of an associated mass of the Idaho batholith. These deposits grade westward into unconsolidated alluvial fans of
18 GEOLOGY, WATER RESOURCES, B1TTERROOT VALLEY, MONT.
moderately weathered arkosic sand and intercalated beds of volcanic ash. The outcrops near Woodchuck Creek are transitional between locally derived deposits and fan deposits and consist of bedded de posits of angular fragments of quartzitic argillite up to 4 inches in diameter and of quartz and feldspar, cemented by a silty clay matrix.
Most of the exposed Tertiary flood-plain deposits on the east side of the valley consist of semiconsolidated silt with some intercalated lenses of bentonitic clay. Two clay samples (table 2) taken from the Am brose Creek drainage in sec. 16, T. 9 N., K. 19 W. (sample 16), and from the white cliff outcrops in sec. 6, T. 10 N., R. 19 W. (sample 22), had similar chemical characteristics and were relatively high in aluminum.
TABLE 2. Chemical analyses, in percent, of Tertiary clay from the Bitterroot Valley
[Sahinen and others (1958, table 4, p. 37)]
Sample S1O2 A12 O3 Fe CaO MgO NazO KsO TiO2
1622. _
59. 2___________ 60.6
20. 11Q 1
3.42.9
1. 5 0. 51. 4 1. 6
1 6?, 7
2. 72.8
0 415
In a few localities, the flood-plain silt contains angular fragments of locally derived bedrock and a few lime concretions along the bedding planes. The lime was evidently derived from solution of the Newland Limestone east of the valley. Some silt along the west side of the valley near Victor contains monazite. In 1953, the U.S. Bureau of Mines conducted extensive exploratory operations in order to estimate the potential reserves (Holt, 1964).
The Tertiary channel deposits are relatively unconsolidated but form the white cliffs as much as 140 feet high. The channel deposits are typically crossbedded and are well-rounded grains of quartz and fragments of granite, border-zone gneiss, and argillaceous rocks. The average grain size generally decreases from boulders up to 10 inches in diameter near the mouths of the tributary canyons to fine gravel and sand near the center of the valley.
Fifty feet of channel deposits are exposed in borrow pits and gullies on the margins of the high terrace above Skalkaho Creek in sec. 4, T. 5 N., R. 20 W. Some intercalated lenses are slightly cemented with manganese. Because the manganese occurs on the bedding planes, it is believed to be of primary origin. Turbulence of the transporting water may have caused oxidation and precipitation.
At least five beds of volcanic ash are exposed in 16 localities on the east side of the valley. A single bed is exposed on the north bank of Lick Creek on the west side of the valley in sec. 29, T. 4 N., R. 21 W.
GEOLOGY 19
The ash is mostly intercalated with flood-plain silt. It is generally horizontally bedded and was apparently deposited in an aqueous en vironment; however, some ash is crossbedded and may have been windblown. Small concentrically banded pellets of ash, 3 to 6 mm (millimeters) in diameter, occur on some of the bedding planes. Local variations in chemistry and lithology of the ash do not allow intra- valley correlation.
The Tertiary sediments are predominantly brown and gray, but some are black and various shades of yellow, green, and red. The col- luvial deposits and flood-plain silt range from dark brown to light gray. The brown coloration results from weathering of included iron- bearing rock and mineral fragments. The variation from dark to light is a function of the amount of incorporated (iron-free) ash.
The volcanic ash ranges from medium dark gray to light gray, imd the color is related to the size of shards and to the amount of devitrification. Most of the channel sand and gravel is light gray. One exception is the brick-red basal 38 feet of the white cliffs between Woodchuck Creek and Eightmile Creek in sec. 6, T. 10 N., R. 19 W. (See stratigraphic section below.) The color of these sediments is ap parently caused by oxidation of iron by percolating ground water.
The paludal clay ranges from green, to brown, to yellow, to bluish gray, to black. These colors result partly from the proportion of ben- tonite (green to white), to flood-plain silt (brown), to carbon (black). A bluish cast often prevails in moist conditions, and because of this, much of the clay, regardless of its true color, is described in drillers' logs as blue clay.
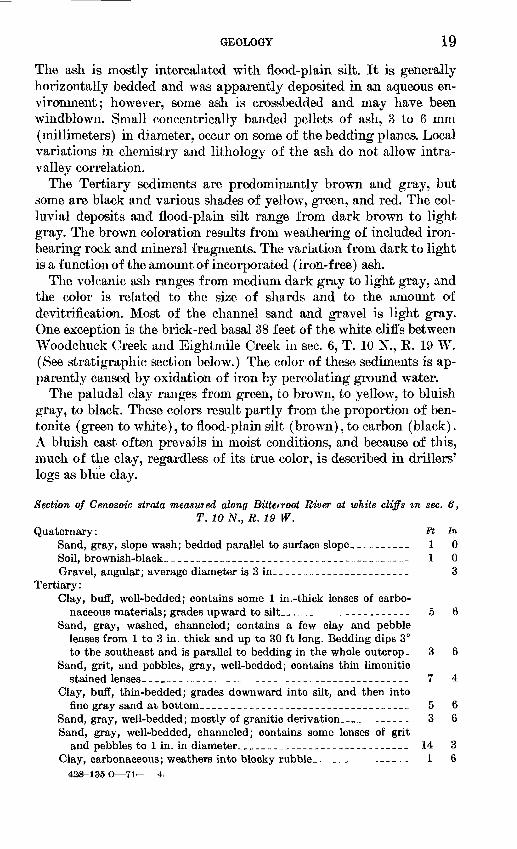
Section of Cenozoic strata measured along Bittetroot River at white cliffs ^n sec. 6,T. 10 N., R. 19 W.
Quaternary: ft inSand, gray, slope wash; bedded parallel to surface si ope __________ 1 0Soil, brownish-black_-_______________________________________ 1 0Gravel, angular; average diameter is 3 in_______________________ 3
Tertiary:Clay, buff, well-bedded; contains some 1 in.-thick lenses of carbo
naceous materials; grades upward to silt_-__-----__----_------ 5 6Sand, gray, washed, channeled; contains a few clay and pebble
lenses from 1 to 3 in. thick and up to 30 ft long. Bedding dips 3° to the southeast and is parallel to bedding in the whole outcrop. 3 6
Clay, buff, thin-bedded; grades downward into silt, and then into fine gray sand at bottom_______-____________-______--_--___ 5 6
Sand, gray, well-bedded; mostly of granitic derivation__________ 3 6Sand, gray, well-bedded, channeled; contains some lenses of grit
and pebbles to 1 in. in diameter_____________________________ 14 3Clay, carbonaceous; weathers into blocky rubble.__________---__ 1 6
428KL3I5' O 71 4.
20 GEOLOGY, WATER RESOURCES, BITTERROOT VALLEY, MONT.
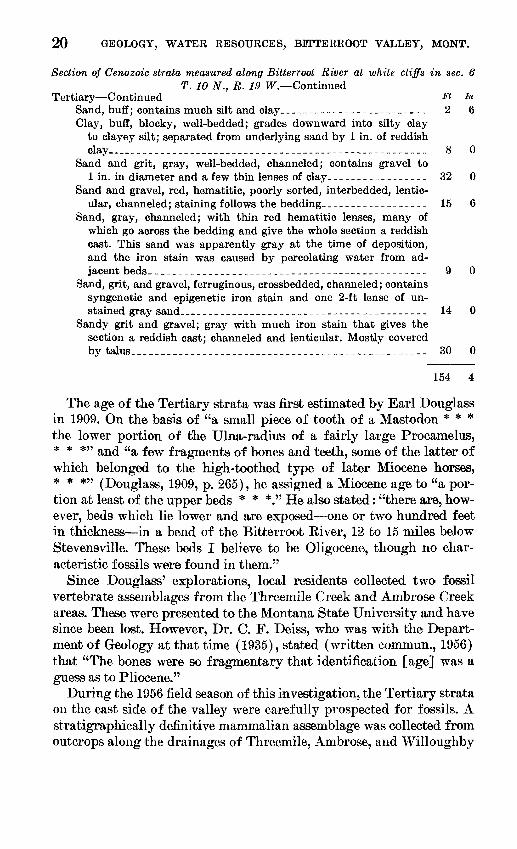
Section of Cenozoic strata measured along Bitterroot River at white cliffs in sec. 6T. 10 N., R. 19 W Continued
Tertiary Continued Ft inSand, buff; contains much silt and clay___-_-_-_---_____-_____ 2 6Clay, buff, blocky, well-bedded; grades downward into silty clay
to clayey silt; separated from underlying sand by 1 in. of reddish clay_____.________________________--___-___.___ 8 0
Sand and grit, gray, well-bedded, channeled; contains gravel to1 in. in diameter and a few thin lenses of clay_____-_-_-_______ 32 0
Sand and gravel, red, hematitic, poorly sorted, interbedded, lentic ular, channeled; staining follows the bedding._________________ 15 6
Sand, gray, channeled; with thin red hematitic lenses, many of which go across the bedding and give the whole section a reddish cast. This sand was apparently gray at the time of deposition, and the iron stain was caused by percolating water from ad jacent beds.______________________________________________ 9 0
Sand, grit, and gravel, ferruginous, crossbedded, channeled; contains syngenetic and epigenetic iron stain and one 2-ft lense of un stained gray sand________________-______--___-_-_-_-___-- 14 0
Sandy grit and gravel; gray with much iron stain that gives the section a reddish cast; channeled and lenticular. Mostly covered by talus____________________________________---__--_-___-_ 30 0
154 4
The age of the Tertiary strata was first estimated by Earl Douglass in 1909. On the basis of "a small piece of tooth of a Mastodon * * * the lower portion of the Ulna-radius of a fairly large Procamelus,* * *" and "a few fragments of bones and teeth, some of the latter of which belonged to the high-toothed type of later Miocene horses,* * *" (Douglass, 1909, p. 265), he assigned a Miocene age to "a por tion at least of the upper beds * * *." He also stated: "there are, how ever, beds which lie lower and are exposed one or two hundred feet in thickness in a bend of the Bitterroot Biver, 12 to 15 miles below Stevensville. These beds I believe to be Oligocene, though no char acteristic fossils were found in them."
Since Douglass' explorations, local residents collected two fossil vertebrate assemblages from the Threemile Creek and Ambrose Creek areas. These were presented to the Montana State University and have since been lost. However, Dr. C. F. Deiss, who was with the Depart ment of Geology at that time (1935), stated (written comniun., 1956) that "The bones were so fragmentary that identification [age] was a guess as to Pliocene."
During the 1956 field season of this investigation, the Tertiary strata on the east side of the valley were carefully prospected for fossils. A stratigraphically definitive mammalian assemblage was collected from outcrops along the drainages of Threemile, Ambrose, and Willoughby
GEOLOGY 21
Creeks, and from a small arroyo immediately north of Willow Creek. It included eight specimens of the following species: Tardontia cf. occidentals, Marmrmt (Pliomastodon) cf. P. matthewi, PHoJiippu& interpolatus, Teleoceras cf. T. fosxiger. On the basis of this assemblage and the regional structure, Konizeski (1958, p. 346) assigned on early Pliocene (Clarendoniaii) age to all of the exposed Tertiary strata on the east side of the Bitterroot Valley.
The lithology (see stratigraphic section below) and structural rela tionships of the exposed Tertiary beds west of the Bitterroot River suggest that they are equivalent to the better known Pliocene strata on the east side of the valley. An abandoned coal mine and two pros pects about 3 miles northwest of Darby in sec. 3, T. 4 N., R. 21 W., were examined in 1958. No fossils were found, but semi-indurated plant beds, probably correlative with the coal mine strata, crop out on the north bank of Lick Creek in sec. 29, T. 4 N. R. 21 W. They are inter- bedded with volcanic ash and underlie semiconsolidated buff-colored silt similar to the Pliocene flood-plain silt exposed on the east side of the Bitterroot Valley. From them were collected specimens of Micrhy- stridium, Botryococcus, Dinofl agellata ? and Selaginella (age indeter minate) ; and Metaseqiwia occidentals (Paleocene to middle Miocene), Glyptostrobus sp. (Lower Cretaceous to Holocene), and Alnus relata (Miocene). On the basis of the stratigraphically ambiguous assem blage and because these beds underlie younger, probably Pliocene, strata, these beds are believed to be of Miocene, or perhaps late Oligo- cene, age.
Section of Tertiary strata measured along north bank of Blodgett Creek in sec. 16,T. 6 N., R. 21 W.
Ft In
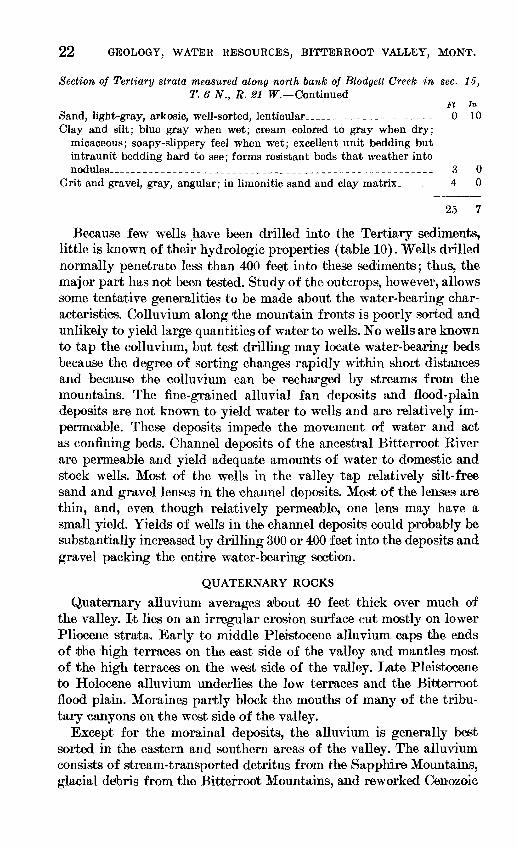
Sand, gray, lenticular.___________________________________________ 1 2Silt, gray; includes thin limonitic lenses.___________________________ 1 2Sand, ferruginous____-__-_-_____________________________________- 0 3Clay, buff but greenish on joint faces, blocky_______________________ 2 0Sand, limonitic, micaceous__--_________-______________-_________.__ 0 3Clay, light-gray, well-bedded; contains greenish lenses______________ 1 6Sand, limonitic, well-sorted, well-bedded, lenticular,_________________ 6 0Sand, gray, silty_______________________________________________ 0 3Sand, limonitic, coarse; grades laterally into grit and gravel_________ 0 6Clay; bluish gray when wet; cream colored to light gray when dry; thin
bedded; forms resistant beds_____________________________-_-_,__ 0 10Sand, limonitic, well-bedded,_____________________________________ 1 2Clay; bluish gray when wet; cream colored to light gray when dry;
22 GEOLOGY, WATER RESOURCES, BITTERROOT VALLEY, MONT.
Section of Tertiary strata measured along north bank of Blodgett Creek in sec. 15, T. 6 N., R. 21 W Continued
Ft In Sand, light-gray, arkosic, well-sorted, lenticular____________________ 0 10Clay and silt; blue gray when wet; cream colored to gray when dry;
micaceous; soapy-slippery feel when wet; excellent unit bedding but intraunit bedding hard to see; forms resistant beds that weather into nodules_____________________________________________________ 3 0
Grit and gravel, gray, angular; in limonitic sand and clay matrix._____ 4 0
25 7
Because few wells have been drilled into the Tertiary sediments, little is known of their hydrologic properties (table 10). Wells drilled normally penetrate less than 400 feet into these sediments; thus, the major part has not been tested. Study of the outcrops, however, allows some tentative generalities to be made about the water-bearing char acteristics. Colluvium along the mountain fronts is poorly sorted and unlikely to yield large quantities of water to wells. No wells are known to tap the colluvium, but test drilling may locate water-bearing beds because the degree of sorting changes rapidly within short distances and because the colluvium can be recharged by streams from the mountains. The fine-grained alluvial fan deposits and flood-plain deposits are not known to yield water to wells and are relatively im permeable. These deposits impede the movement of water and act as confining beds. Channel deposits of the ancestral Bitterroot River are permeable and yield adequate amounts of water to domestic and stock wells. Most of the wells in the valley tap relatively silt-free sand and gravel lenses in the channel deposits. Most of the lenses are thin, and, even though relatively permeable, one lens may have a small yield. Yields of wells in the channel deposit's could probably be substantially increased by drilling 300 or 400 feet into the deposits and gravel packing the entire water-bearing section.
QUATERNARY ROCKS
Quaternary alluvium averages about 40 feet thick over much of the valley. It lies on an irregular erosion surface cut mostly on lower Pliocene strata. Early to middle Pleistocene alluvium caps the ends of the high terraces on the east side of the valley and mantles most of the high terraces on the west side of the valley. Late Pleistocene to Holocene alluvium underlies the low terraces and the Bitterroot flood plain. Moraines partly block the mouths of many of the tribu tary canyons on the west side of the valley.
Except for the morainal deposits, the alluvium is generally best sorted in the eastern and southern areas of the valley. The alluvium consists of stream-transported detritus from the Sapphire Mountains, glacial debris from the Bitterroot Mountains, and reworked Cenozoic
GEOLOGY 23
fill. This material was deposited in a wide variety of rapidly chang ing fluvial, glaciofluvial, and glaciolacustriiie environments. Thus, the various sedimentary types overlap, interfinger, and intergrade both laterally and vertically.
The alluvium beneath high terraces on the east side of the valley is mostly well-rounded gravel, sand, and silt deposited in alluvial and lacustrine environments. The sorting generally increases and grain size decreases with increased distance from the mouths of the major tributary canyons. These relationships are best illustrated in the exposures along the high terrace scarps that border the flood plain of Burnt Fork (fig. 10).
About 40 feet of bedded lacustrine deposits are exposed in readouts on the west end of the high terrace between Eightmile Creek and Threemile Creek in sees. 18, 19, 30, T. 10 N., R. 19 W. The beds dip west at a low angle and pinch out to the east at the contact with Pliocene flood-plain silt. These Quaternary deposits are mostly fine well-sorted sand and some gravel; however, clay and silt also occur in areas immediately adjacent to the Pliocene flood-plain silt. Well- developed foreset beds and other deltaic features are exposed in a gravel pit in sec. 1, T. 9 N., K. 20 W. (fig. 11).
A unique deposit of Quaternary alluvium crops out on the east- west ridge between Dry Creek and Soft Rock Creek where well- rounded granitic boulders 10 feet or more in diameter are set in a gravel matrix. The distribution, lithology, and orientation of the ma terial suggest that it was transported by outwash streams flowing from glaciers on the slopes of Willow Creek Mountain, an outlying mass of the Idaho batholith, 5 miles east of the valley (Alden, 1953, pl.l).
The alluvium beneath most of the high terraces on the west side of the valley was derived from the glacial deposits in the Bitterroot Mountains. Talus occurs in a narrow belt along the heads of the high terraces at the base of the steep mountain slopes.
The Bitterroot River and its tributaries have cut below the level of the high terraces and partly drained the alluvium beneath the terraces. Wells tapping the alluvium yield adequate amounts of water for domestic and stock use. Springs issue along the contact between the alluvium and Tertiary sediments. The most successful wells tap depressions in the surface of the Tertiary sediments where the zone of saturation is thicker than average. Recharge from irrigation keeps the alluvium from becoming completely drained.
Glaciofluvial deposits are mostly outwash fans of angular to well- rounded fragments of granitic rocks and of border-zone gneiss. Grain size ranges from silt to boulders, which may be more than 20 feet in
24 GEOLOGY, WATER RESOURCES, BITTERROOT VALLEY, MONT.
Low
terrace
FIGURE 10. Gradational distribution of Quaternary alluvium in Burnt Fork area. A, heterogeneous mixture of well-rounded to subrounded boulders, cob bles, gravel, sand, silt, and clay; exposed in borrow pit in sec. 9, T. 8 N., R. 19 W. A', lithology similar to A but somewhat better sorted; exposed in sec. 6, T. 8 N., R. 19 W. B, moderately well sorted, well-bedded, and well-rounded gravel, sand, and some silt; exposed in gravel pit in sec. 13, T. 9 N., R. 20 W. B', lithology and distribution as in B; exposed in sec. 2, T. 8 N., R. 20 W. C, well-sorted, well-bedded sand; exposed in pit in sec. 13, T. 9 N., R. 20 W. C', lithology and distribution as in C ; exposed along irrigation ditch in sec. 15, T. 8N..R.20W.
diameter. In general, the material is coarsest near the base of the mountains and finest on the valleyward ends of the high terraces; however, there is much local variation and lateral lensing. The wide
GEOLOGY 25
FIGURE 11. Deltaic deposits of glacial Lake Missoula, sec. 1, T. 9 N., R. 20 W.
range in grain size and lateral lensing cause the water-bearing char acteristics to vary greatly within short distances. In general, however, sorting and permeability are lowest near the base of the mountains and increase valleyward.
Glaciolacustrine deposits are mostly well-sorted well-bedded sand containing small amounts of silt, grit, and pea gravel. Fifty feet of well-sorted lacustrine sand and a few pebbles is exposed in a pit in sec. 36, T. T N., R 21 W. Twenty feet of fine well-sorted lacustrine sand is exposed in sec. 9, T. 7 N., R. 21 W. The predominately fine grained glaciolacustrine deposits are poorly permeable. The deposits are mostly above river level and are generally drained.
The low terraces are developed on about 40 feet of late Pleistocene to Holocene fluvial gravel, sand, and silt. On the east side of the valley, this alluvium is mostly material eroded from the Sapphire Mountains and is partly reworked older Cenozoic fill.
The distribution of alluvium along Eightmile Creek is typical of the east side tributaries. This alluvium is about 40 feet of angular fragments of argillite in a matrix of weathered monzonite and silt. These materials grade north from the creek into sand which includes angular fragments of argillite. South of the creek, the alluvium grades into a rich deep soil of clay and silt.
26 GEOLOGY, WATE.R RESOURCES, BITTERROOT VALLEY, MONT.
The low terraces on the west side of the valley are formed on late Pleistocene to Holocene alluvium. Huge outwash fans head below the mouths of the major tributary canyons, extend down the stream val leys, and generally coalesce below the eastern margins of the inter vening high terraces. These fans are material derived mostly from moraines in the tributary canyons. The constituents grade from boul ders and gravel near the heads of the fans to gravel, coarse sand, silt, and clay at their outer, valleyward margins.
The flood plain of the Bitterroot River is formed on about 40 feet of Quaternary alluvium. The alluvium was derived mostly from the low terraces and is well-rounded gravel and sand which contains a small amount of silt and clay. It is generally better sorted in the southeast and finer grained in the northwest.
The alluvium beneath the low terraces and the flood plain of the Bitterroot River has the greatest water-transmitting and storing capacity of any aquifer in the valley. Properly constructed and de veloped wells in the flood plain are capable of supplying more than 250 gpm. Except near Corvallis, wells located on the low terraces or along the tributaries supply less water because the saturated thickness is slightly less and because the average permeability of the deposits is less. Near Corvallis, permeability is greater than average, and wells are capable of yielding 1,000 gpm or more. Wells on the low terraces and along the tributary streams are adequate for domestic and stock use. Test drilling in these areas might locate places of greater perme ability than average (because of variations in sorting) where wells could produce enough water for supplemental or for limited irriga tion. The alluvium is almost completely saturated and hydraulically connected with the streams. Thus, pumping large quantities of water will cause the streamflow to diminish.
Moraines occur at altitudes ranging from 3,700 feet to 5,200 feet near the mouths of the major tributary canyons south of Big Creek and within the lower canyons of several of the major tributary streams north of Big Creek. The moraines on Roaring Lion Creek are perhaps the best developed in the valley. A lateral moraine extends valleyward from a bedrock spur on the south side of the canyon. From this moraine, five terminal moraines extend northward partly blocking the mouth of the canyon. Roaring Lion Creek is deflected north of these terminal moraines. The relatively undissected nature of most of the moraines indicates a late Pleistocene age.
Till .comprising the moraines contains large amounts of clay and is poorly permeable. No wells are known to obtain water from the till.
Large boulders up to 25 feet in diameter are scattered over the ter races on the west side of the valley and on the east side of the valley
GEOLOGY - 27
south of Spooner Creek. Their locations suggest transportation by ice rafting as well as by streams. No moraines occur on the east side of the valley.
Thin soils mantle most of the valley. Their extremely variable com position reflects the lithology of the underlying and bordering source rocks. Most of the soils on the east side of the valley are derived from Pliocene sediments. Conversely, most of the soils along the Bitterroot flood plain and the west side of the valley are derived from relatively young unweathered Quaternary deposits- Because of these relation ships, the soils on the east side of the valley 'are generally well devel oped and fertile and produce good crops when adequately irrigated, while those on the Bitterroot flood plain and the west side of the valley are generally less well developed and less fertile.
STRUCTURE
REGIONAL
The Bitterroot Valley has been described (Pardee, 1950, p. 389- 390) as part of a system of north-south trending Northern Rocky Mountain structures. Lindgren (1904, p. 48) stated that it "is an ex tremely well marked and probably very deep depression almost coex tensive with the range, and that borings would probably show it to be a structural depression without outlet * * *." Ross (1950, fig. 56) depicted the valley as a structural trough on the flanks of the Idaho batholith.
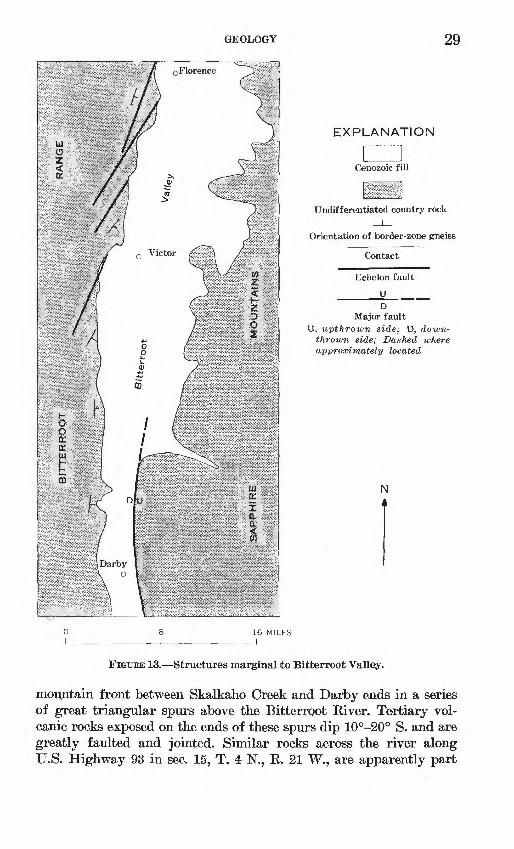
The eastern front of the Bitterroot Mountains (west side of the valley) is uniform in regional aspect but complex in detail. It is a dip slope formed on, and partly transecting, the stratiform structure of the border-zone gneiss (figs. 12,13). The attitude of the gneiss varies locally, but it strikes about N. 15° E. between Darby and Victor, and N. 30° E. between Victor and Florence. In contrast, the eastern front of the mountains strikes about due north from Darby to Victor, and about N- 35° E. between Victor and Florence. The 15°-30° east dip of the mountain front is about equivalent to that of the border-zone gneiss.
The traces of four echelon faults are clearly visible on the mountain front between Florence and Victor. Movement along them was recorded as late as 1898 (Lindgren, 1904, p. 49). The faults strike from about N. 35° E. in the south, to N. 15° E. in the north, and range in dip from about 45° E. to vertical. The shear zone of the fault near Big Creek is more than a quarter of a mile wide. The shear zone near Gash Creek is more than 150 feet wide, and the fault has more than 50 feet of throw. Stream gradients increase where the streams cross the faults. The
42)8-135 O 71 5
28 GEOLOGY, WATER RESOURCES, BITTERROOT VALLEY, MONT.
I
'53
!ig4J02
I
GEOLOGY 29
EXPLANATION
Cenozoic fill
Undifferentiated country rock
Orientation of border-zone gneiss
Contact
Echelon fault
UD
Major faultU, upthrown side; D, down-
thrown side; Dashed where approximately located
16 MILES
FIGURE 13. Structures marginal to Bitterroot Valley.
mountain front between Skalkaho Creek and Darby ends in a series of great triangular spurs above the Bitterroot River. Tertiary vol canic rocks exposed on the ends of these spurs dip 10°-20° S. and are greatly faulted and jointed. Similar rocks across the river along U.S. Highway 93 in sec. 15, T. 4 N., R. 21 W., are apparently part
30 GEOLOGY, WATER RESOURCES, BFTTERROOT VALLEY, MONT.
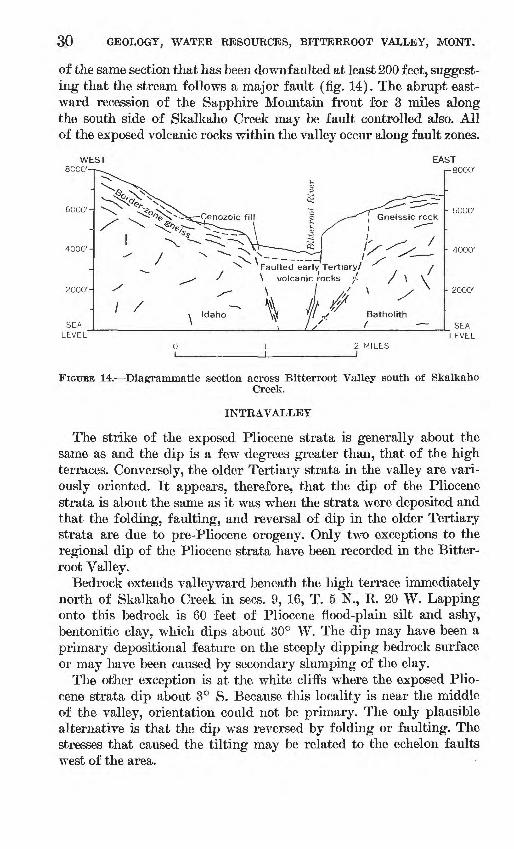
of the same section that has been downf aulted at least 200 feet, suggest ing that the stream follows a major fault (fig. 14). The abrupt east ward recession of the Sapphire Mountain front for 3 miles along the south side of Skalkaho Creek may be fault controlled also. All of the exposed volcanic rocks within the valley occur along fault zones.
FIGURE 14. Diagrammatic section across Bitterroot Valley south of SkalkahoCreek.
INTRAVALLEY
The strike of the exposed Pliocene strata is generally about the same as and the dip is a few degrees greater than, that of the high terraces. Conversely, the older Tertiary strata in the valley are vari ously oriented. It appears, therefore, that the dip of the Pliocene strata is about the same as it was when the strata were deposited and that the folding, faulting, and reversal of dip in the older Tertiary strata are due to pre-Pliocene orogeny. Only two exceptions to the regional dip of the Pliocene strata have been recorded in the Bitter- root Valley.
Bedrock extends valleyward beneath the high terrace immediately north of Skalkaho Creek in sees. 9, 16, T. 5 N., R. 20 W. Lapping onto this bedrock is 60 feet of Pliocene flood-plain silt and ashy, bentonitic clay, which dips about 30° W. The dip may have been a primary depositional feature on the steeply dipping bedrock surface or may have been caused by secondary slumping of the clay.
The other exception is at the white cliffs where the exposed Plio cene strata dip about 3° S. Because this locality is near the middle of the valley, orientation could not be primary. The only plausible alternative is that the dip was reversed by folding or faulting. The stresses that caused the tilting may be related to the echelon faults west of the area.
GEOLOGY 31
SUMMARY OF GEOLOGIC HISTORY
ORIGIN OF BITTERROOT VALLEY
The age of the Idaho batholith has been estimated by lead-alpha methods (Chapman and others, 1955; Larsen and Schmidt, 1958; Larsen and others, 1958). Larsen, Grottfried, Jaffe, and Waring con cluded that it is early Late Cretaceous and that it was intruded in a short time, not more than a few million years. Ross (1950, p. 170) described the huge slab of border-zone gneiss that forms tlie western wall of the valley as "a part of the [Beltian] rocks that were invaded * * * and domed during the intrusion * * *." The structural rela tionships show that the Bitterroot Valley became,a marginal trough during the intrusion. It is equally clear, however, that the valley has been modified by later structural movement and by. erosion. Asdndi- cated by Ross (1950. fig. 56), a considerable thickness of border-zone gneiss and overlying Belt rocks has been eroded from above the batho lith. Also, it is evident that most of the overlying Belt rocks and much of the easily erodable border-zone gneiss must have been stripped from the eastern flanks of the batholith (west wall of the valley).
Anderson (1952, p. 255) concluded that the Idaho batholith was introduced by multiple emplacement. Larsen, Gottfried, Jaffe, and Waring (1958, p. 51) dated the batholith as about 108-109 million years but stated that "within the general areas of the Idaho batholith are bodies of igneous rock that are much younger probably Lara- mide in age." Faults along the eastern margins of the batholith may be related in part to these later intrusions.
The main basin of the Bitterroot Valley is apparently a synclinal warp interrupted on the west by relatively minor fault zones. The rocks south of Skalkaho Creek were faulted perhaps during emplace ment of the Idaho batholith. The faulted Tertiary volcanic rocks along lines of structural weakness marginal to the valley indicate recurrent tectonic activity. However, the undisturbed valley fill shows that either postdepositional (post early Pliocene) movement has been relatively slight or the floor of the valley has moved as a single unit with only minor local variations.
The high-level pediments and stream deposits along the eastern front of the mountains are apparently related to the early Tertiary valley floor. The modern intravalley terraced topography is the result of late Tertiary and Quaternary erosion and deposition.
32 GEOLOGY, WATER RESOURCES, BITTERROOT VALLEY, MONT.
CENOZOIC HISTORY
The Cenozoic history of the Bitterroot Valley may >be summarized as follows:
1. Erosion of Belt rocks and 'border-zone gneiss probably both from within and marginal to the newly formed early Tertiary structural trough (Bitterroot Valley) along the east side of the Idaho Batholith.
2. Deposition of a great but unknown thickness of early-middle Tertiary fill on a valley floor of pre-Tertiary bedrock, accompanied by intermittent local extrusions of lava and volcanic ejecta along marginal zones of structural weakness.
3. Development of one or more pre-Pliocene erosion surfaces cut across early-middle Tertiary sediments and into bedrock marginal to the valley.
4. Deposition of early Pliocene sediments and volcanic ejecta in environments ranging valley ward from colluvial, to fan, to flood plain, to channel.
5. Development of an uneven erosion surface (high terrace) on Pliocene sediments. This surface was similar to the present floor of the valley.
6. Erosion and deposition during the Pleistocene shaped the modern intravalley topography.
TERTIARY HISTORY
The several pre-Tertiary inliers show that much of the original surface of deposition was quite irregular. The abundance of |>edded ash, that may be of Miocene age, exposed along Lick Creek is evi dence of extensive volcanic activity, and the interbedded channel sand and lignitic shale show that the environments of deposition ranged from fluvial to paludal. A floral assemblage suggests a moderately moist, temperate climate.
High pediments on the eastern slopes of the Bitterroot Mountains may be remnants of an 'ancient pre-Pliocene erosion surface. If so, their altitude, more than 1,500 feet above the floor of the valley, indi cates the removal of an equivalent amount of early to middle Tertiary sediments.
At least 227 feet and probably many times that amount of sediments were deposited in the Bitterroot Valley in early Pliocene time. How ever, erosion and deposition were accompanied by fallout of volcanic ejecta and probably by local emplacement of lava in the fault zones.
The predominance of fine-grained early Pliocene sediments indicates low regional relief. However, the coarser colluvium and channel deposits near the mouths of some tributary streams show considerable local relief. The color change from predominantly gray in the Miocene
GEOLOGY 33
strata to mostly buff in the Pliocene probably results from some regional, perhaps climatic, change. The Pliocene biota is not suffi ciently well known to draw significant environmental interpretations from it.
In late Pliocene or early Pleistocene time the ancestral Bitterroot River eroded a broad valley into the Tertiary sediments and formed a base level for the tributaries. Because most of the early Pliocene strata are undisturbed, it appears that the change from a deposi- tional to an erosional cycle was caused by some regional, perhaps climatic, change rather than by structural movement. The relation ship (see "Intravalley") of the beveled Pliocene strata and the over lying Pleistocene alluvium shows that the topography was similar to the present.
QUATERNARY HISTORY
The highlands were deeply weathered at the end of the Tertiary Period; erosion in the Quaternary Period was probably rapid at first and then slower as the weathered material was stripped from the 'bedrock. Glacial debris accumulated in the west part of the valley, stream deposits in the east part.
During the maximum stages of Pleistocene glaciation, the Clark Fork was ponded by lobes of the Oordilleran ice sheets (Bretz and others, 1956, p. 1047), and the Bitterroot Valley became an embay- ment of glacial Lake Missoula. As the waters of the ancient lakes rose, deltas formed at the mouths of the tributary streams. Later, huge moraines developed upstream from the deltaic deposits on the west side of the valley, and the combination of outwash fans and lacustrine deposits subdued the irregular late Pliocene to early Pleisto cene topography.
During a mid-Pleistocene interglacial (interlacustrine) interval, the Bitterroot River and its tributaries eroded their present valleys into the early Pleistocene alluvium and Tertiary fill along the traces of the Pliocene drainage system. During later stages of glaciation, small moraines developed at the mouths of many tributary canyons along the west side of the valley.
The glacial Lake Missoula existed as late as 6,000 years ago (C. Malough, oral commun., 1958). As the lake drained, wave-cut benches were formed during periods of temporary stability (Eakins and Hon- kala, 1952). Deep V-shaped notches were subsequently eroded into the lower courses of many of the U-shaped glaciated canyons on the west side of the valley. The drainage of the lake was followed by emplacement of large outwash fans on the flood plains of the tributary streams.
34 GEOLOGY, WATER RESOURCES, BITTERROOT VALLEY, MONT.
WATER RESOURCES
SURFACE WATERThe surface- and ground-water systems are closely interrelated in
the Bitterroot River basin. After entering the basin as precipitation, water may interchange between systems several times and leave as either streamflow, underflow, or water vapor. Because surface water plays an important part in the economy and life of the basin, the quantity and the distribution in time and space of surface water must be known to properly plan for full development and proper manage ment of the basin's water resources.
Although the streamflow records for most of the area are short, they define some of the characteristics of streams and could be extended by correlation with streams that have long-term records.
The distribution of runoff reflects the pronounced influence of the high, rugged Bitterroot Range. The pattern of runoff is typical of mountain areas where the spring runoff from snowmelt is often aug mented by late spring or early summer rains. About 55 percent of the runoff in the Bitterroot River occurs during May and June. Autumn precipitation often causes an increase in runoff before the low flows of winter. The west-side streams show greater seasonal fluctuations than the east-side streams or the main stem of the Bitterroot River (figs. 15-18). Runoff from the foothills and the valley floor is relatively minor. The valley outflow is modified in quantity and pattern by ex tensive irrigation.
The Bitterroot River basin is subdivided into the following areas (fig. 19): A, upper Bitterroot River; B, west side; C, east side; D, valley floor between the gaging stations near Darby and near Flor ence (the study area); and E, lower Bitterroot River. A comparison of annual inflow and outflow from the areas is shown in figure 20. The total inflow is the sum of the flows of the west-side and east-side trib utaries and the Bitterroot River above Darby; the outflow is the flow of the Bitterroot River near Florence. The location of stream-gaging stations is shown in figure 19.
UPPER BITTERROOT RIVER AREA
The drainage basin of the Bitterroot River above the gaging sta tion near Darby, about 3 miles downstream from the confluence of the West and East Forks, is 1,049 square miles. The average annual runoff for the 22-year period (water years 1938-59) was 11.7 inches (653,600 acre-feet).
The basin of the West Fork Bitterroot River contains 644 square miles and is bounded on the west and south by the Bitterroot Range.
DISCHARGE, IN CUBIC FEET PER SECOND
DISCHARGE, IN CUBIC FEET PER SECOND
tdIo
>-ti5sr
J.KOH'saonnosan'iooioao
WATER RESOURCES 37
QNO03S 133J Nl '3OdVHOSIQ
DISCHARGE, IN CUBIC FEET PER SECOND
5 Eo b c o o c
o
O °
? Hf2 o
^ z o
» <8rt w
1 - 3 o °3 m M
3 co 5* oj
a Ig *i co
I ,-* m °d 00 M
§ 00 3 ^
9 S 0
^ ^ °3 Co
i : S > o
i o
3 w
^ <-^
? 1-
1 COq 0
1 CO* mwa O co^ 0
5 ~^ o14 co
5> o
ogtoo
CO orn"D M-i o
CO
i
-
_-
_
_
_-
-
- en00
- 10~ U3
_
-
_
_
--
-
_
-
-
-
1
1
.*
1
£CD
a>-
oo
2ID
^01 01
D a>cr
I
I
*- ~~,
A .
*
-**y
"*«-.
)
?
^
('
)
-k
i ,
T .
^i
)
- <-*
*?
< "
<
.
1
/'
' >
"
'
)
s<t _
oi
\
^ - -_
4/ 7
-.^ .I'
f">\'-^^
, -^' ^^^/
>^v^
<
/.'
J/
X
S
> ^>
-^\
\* ~~2>- .<f
^s
i
~>>-.. ^.t^:; *»*. *
^>
^-?'
_j_±
o c1
CD
f* 0)
o o*"* 33
0)
^- - - -0)
Q)
.. o""' to
» O (D
x?
1
1
,1
r
--
..--
--
..
..--
--
;;--
--
;:._..
--
--..
-.--"----
..--
--___. ------
WATER RESOURCES 39
114°00'
FIGURE 19. Subareas of Bitterroot River basin and location of stream- gaging stations.
40 GEOLOGY, WATER RESOURCES, BITTERROOT VALLEY, MONT.
2500
2000
1500
1000
500
1935 1940 1945 1950 1955 1960
FIGUBE 20. Yearly inflow to, and outflow from study area.
Drainage basins of its western tributaries are more affected by moist Pacific air masses and have a higher runoff than other streams in the West Fork basin. The area tributary to Painted Rocks Lake has an average annual runoff of about 12.6 inches, and the West Fork basin has about 14.6 inches. Painted Rocks Lake, a reservoir completed in 1940 primarily for storage of irrigation water for the valley, has a capacity of 31,700 acre-feet. Up to the present (1968) , few firm water- purchase contracts have been consummated. Only a small amount of land along the West Fork is irrigable, with diversions for only about 600 acres.
The basin of the East Fork Bitterroot River, which is somewhat smaller than the West Fork basin, contains 405 square miles. It is bounded on the east by the Sapphire Mountains and on the south by the Anaconda Range. For 1937-57, the average annual runoff half a mile above the confluence with the West Fork was 8.6 inches. Trib utary streams flow through narrow canyons of steep gradient in
WATER RESOURCES 41
their upper reaches and then enter mountain valleys with hay meadows and small farms. About 3,000 acres of land upstream from or in the vicinity of Sula is irrigated.
WEST-SIDE AREA
The west-side area contains 510 square miles. The mountains rise sharply from the valley floor, and the streams flow through steep narrow canyons. Heavy precipitation is induced as the moist Pacific air masses rise over the high Bitterroot Mountains. The average an nual runoff in this area during 1938-59 was 33.6 inches (915,000 acre-> feet). Except for the May-June high-water period, nearly all the west-side streamflow is diverted during the irrigation season. High runoff is uniformly distributed throughout the area, except for Bass and Sweeney Creeks, which have a smaller unit runoff that may be caused by precipitation shadows in the lee of mountains to the west.
Lake Como on Eock Creek, with a usable capacity of 34,800 acre- feet, is the only major reservoir in the area. Eunoff during May and June is adequate for annual refill. About 17,400 acres on the east side of the Bitterroot Valley are irrigated from the Bitterroot Eiver Irriga tion District Canal, which carries water from Eock Creek to 8 miles northeast of Stevensville. About 11,400 acre-feet of water (as deter mined by the U.S. Bureau of Eeclamation in 1942) is stored behind low dams at the outlets of several high mountain lakes in the Bitterroot Eange. The water is released in late July and August when runoff is inadequate for downstream demands.
EAST-SIDE AREA
The Sapphire Mountains form the eastern boundary of this area, which contains 490 square miles. The average annual runoff for 1938- 59 was 7.8 inches (202,700 acre-feet). The three principal streams (Sleeping Child Creek, Skalkaho Creek, and Burnt Fork) originate at higher altitudes in the Sapphire Mountains than the other streams. Their basins comprise 46 percent of the east-side drainage, but they contribute more than 70 percent of the runoff, or about 12 inches per year.
Willow and Gird Creeks drainage basins make up 10 percent of the area and contribute about 10 percent of the total runoff. They originate at lower altitudes in the Sapphire Mountains and, in their upper reaches, are underlain by the Newland Limestone. The stream- flow pattern of these two streams differs from the principal streams in that Willow and Gird Creeks have smaller diurnal fluctuations and a more gradual recession from peak flows. This difference is attributable to relatively high permeability of the limestone, in which water may
42 GEOLOGY, WATER RESOURCES, BITTERROOT VALLEY, MONT.
be temporarily stored and eventually discharged into streams. The remaining 44 percent of the east-side area consists of rolling foot hills. The streams are short and ephemeral and contribute about 20 percent of the runoff.
During the irrigation season, the flow of the east-side streams is diverted. A total storage of about 870 acre-feet has been developed in small natural lakes in the basins of Skalkaho Creek, Willow Creek, and Burnt Fork.
VALLEY-FLOOR AREA
The valley-floor area, which contains 305 square miles, is adjacent to the Bitterroot River between the gaging stations near Darby and near Florence. The pervious soils and extensive farming generally pre vent surface runoff, except during storms of high intensity or during snowmelt while the ground is frozen. Seepage losses are high from many of the tributary streams as they enter this area, and canals di vert the remaining flow. Numerous canals supply water to about 100,- 000 acres. During the irrigation season, the flow of the Bitterroot River varies greatly from point to point because of extensive diver sions, entrance of tributary streams, and return flow from irrigation. Critical low flows are confined to the Grantsdale-Victor reach. The Bitterroot River is a gaining stream through the valley-floor area. Graphs of inflow and outflow (figs. 21-23) illustrate the variations in streamflow.
LOWER BITTERROOT RIVER BASIN
The lower part of the basin, from Florence to the mouth, contains 496 square miles. Lolo Creek, entering from the west, is the major tributary. Eightmile and Miller Creeks are the major tributaries from the east and are entirely diverted during the irrigation season. Lolo Creek has a broad flood plain and is subject to seepage loss between the mouth of the canyon and the Bitterroot River. Water is diverted from Clark Fork for irrigation in the lower Bitterroot River basin.
STREAMFLOW RECORDS
Collection of streamflow records in the Bitterroot River basin began in 1898. The records were few and intermittent for many years. A bet ter distributed and sustained collection began in 1938; the periods of record are listed in table 3. The streamflow records are published in Water-Supply Papers 1316 and 1736 (U.S. Geol. Survey, 1955, p. 335-350; 1964, p. 242-256).
WATER RESOURCES 43800
700
600
O 500 <
400
300
200
100
£ O
OCT NOV DEC JAN FEB MAR APR MAY JUNE Jui_Y AUG SEPT
FIGURE 21. Monthly inflow and outflow for 1958 water year.
More intensive record collection began in October 1957 and con tinued through September 1959. Four previously discontinued stations were reestablished, and three new gaging stations were established. Miscellaneous measurements were made at about monthly intervals at 15 sites on tributary streams to estimate monthly runoff. These measurements were published in Water-Supply Paper 1636 (U.S. Geol. Survey, 1960, p. 211-224). Since 1929, records have been col lected on the Clark Fork above and below Missoula. The flow of the
44 GEOLOGY, WATER RESOURCES, BITTERROOT VALLEY, MONT.
800
700
600
500
400
300
200
100
i O
OCT NOV DEC JAN FEB MAR APR MAY JUNE JULY AUG SEPT
FIGURE 22. Monthly inflow and outflow for 1959 water year.
Bitterroot River at its mouth is the difference in flow at these two points with minor correction for intervening small tributaries and diversion.
In evaluating and computing the flow characteristics of streams, it is advantageous to have a common base period. For this study, suffi-
WATER RESOURCES 45
600
500
400
300
200
100
22-year average 1938-59
"""il
OCT NOV DEC JAN FEB MAR APR MAY JUNE JULY AUG SEPT
FIGUBE 23. Average monthly inflow and outflow, 1938-59.
cient data were available to use the period October 1, 1937, to September 30, 1959 (water years 1938-59). Some individual gaging- station records are extended for the full period by statistical correla tion with nearby stations. Monthly inflow by areas, total inflow, and outflow at Florence for the base period are listed in tables 4r-8. A summary of the annual inflow to and outflow from the study area is given in table 9.
Flow-duration curves show the percentage of time that the dis charge of a stream has equaled or exceeded a specified amount. Flow- duration curves were constructed for Bear Creek near Victor using mean daily flows (fig. 24) and for the Bitterroot River near Florence using average monthly flows (fig. 25).
46 GEOLOGY, WATER RESOURCES, BFTTERROOT VALLEY, MONT.
TABLE 3. Gaging stations in or related to the Bitterroot Valley
Gaging station
Clark Fork above Missoula- _ __ ------------Rattlesnake Creek at Mlssoula _ ---------- - _ ..
Mlssoula Irrigation District Canal at Missoula -- _-_--.-Orchard Homes Canal at Missoula __ _. ___ __._ __ -Flynn ditch at Missoula-- _____ . __ . _______ ...Grass Valley ditch near Missoula .-...---- . -...Bitterroot River:West Fork Bitterroot River Reservoir near Conner _ ..West Fork Bitterroot River near Conner ____ ... __West Fork Bitterroot River near Darby _ _ ____..._ _
East Fork Bitterroot River near Conner ______East Fork Bitterroot River at Conner, ________ __
Bitterroot River near Darby. .-_- ........ . . .. __Tin Cup Creek near Darby _ ......... .......
Rock Creek:ComoLake near Darby.. ....__ _.....___..----Rock Creek near Darby..-. ... _....... .....
Lost Horse Creek near Darby- ............. .......
Sleeping Child Creek near Hamilton ._ ___ _ __ Little Sleeping Child Creek near Hamilton
Skalkaho Creek near Hamilton ____ . .__ ...
Skalkaho Creek at Brennan's Ranch, near Hamilton.
Roaring Lion Creek near Hamilton- ..... _ ._ _. _Sawtooth Creek near Hamilton..-.. ........ _ . ....Gird Creek near Hamilton. .--__ _ ...Blodgett Creek near Corvallis... _ _____ _ ....Blodgett Creek near Hamilton.. _____ ._ _ . __Willow Creek:
Willow Creek near Corvallis _ -... ___ _ __
Willow Creek at Aflnson Ranch, near Corvallis-Mill Creek near Hamilton ___ . _ - _____ . .....Fred Burr Creek near Victor ______ . _____Bear Creek near Victor ------------ ------------ ...
Sweathouse Creek near Victor .. _ ... ----- --Gash Creek near Victor _________ ._ ___Big Creek near Victor _____ ____ _ ___Kootenai Creek near Stevensville. -.. __ . __ ..
Burnt Fork Creek:Sunset Canal near Stevensville _. __ . _ . __ .Burnt Fork Creek near Stevensville ____ . _
Bass Creek near Florence. _ _ . -..- __ .... .....Sweeney Creek near Florence.-.. _ _ ... _ . __ ..
Bitterroot River near Florence . ___ _________Eightmile Creek near Florence ___________ .Lolo Creek near Lolo ___ .. __ _ _ .. __ ... .Lolo Creek above Sleeman Creek, near Lolo.. _ ..
Bitterroot River near Missoula. . _ __ .. __ ____ _ .Big Flat Canal near Missoula ______________ -
Knowledge of the magnitude and frequency of floods is particularly useful in designing spillways, stream crossings, and flood-protection works. The recurrence interval of a flood in the annual flood series is the average interval of time within which a given flood will be equaled or exceeded once as an annual maximum. A regional analysis of dis charge records is believed to yield more reliable probability informa tion than analysis of records at individual sites. Regional flood-fre quency curves for four streams are shown in figure 26.
GROUND WATER
Most of the ground water in the Bitterroot Valley is in the pore spaces of the Tertiary and Quaternary sediments that partly fill the valley; some is in the pre-Tertiary sedimentary, metamorphic, and igneous rocks marginal to and underlying the valley. Water from precipitation, irrigation, and losing tributary streams percolates to the ground-water reservoir and then moves laterally until it is dis charged to the earth's surface through springs, wells, and gaining streams, or to the atmosphere by evapotranspiration.
WATER RESOURCES 53
_^
NXs..
\V
\lN
\'
\\
^
p19'
^\^
eri W-
od 41
\
inc IS
\
lud£ 44,
v >
>s th 1947
V
5 fol-48,
\
\
owir 195(
\
ig ^ 3, 1
vat 95
\
er y2-5:
\
ea 3,
s
rs: L959
^\\\
in <ji H Q ,-< CM m in co en en 5 d d d d ,-H CM mo ooooooo om oo en en en en en
PERCENTAGE OF TIME DISCHARGE EQUALED OR EXCEEDED THAT SHOWN
FIGURE 24. Flow-duration curve of daily flows of Bear Creek near Victor.
54 GEOLOGY, WATER RESOURCES, BFITERROOT VALLEY, MONT.
100,000
10,000
1000
100
i
\
Period covers water years 1937-59
o o o o o r-i e\j mo ooooOoo o u"> oo<^ oio^ <yi i CXJ CO ^- If) ^O p*- 00 & ff) O &* G^G^ G
PERCENTAGE OF TIME DISCHARGE EQUALED OR EXCEEDED THAT SHOWN
FIGUBE 25. Flow-duration curve of monthly flows of Bitterroot River nearFlorence.
HYDROLOGIC PROPERTIES
Two hydrologic properties of an aquifer indicate the aquifer's abil ity to transmit and store water. The coefficient of transmissibility measures the capacity of an aquifer to transmit water. It is expressed as the rate of flow of water, in gallons per day, at the prevailing water temperature through a vertical strip of the aquifer 1 foot wide extend ing the full saturated thickness of the aquifer under a hydraulic gradient of 100 percent. The coefficient of storage is a measure of the capacity of an aquifer to store and release water. It is the volume of water released from or taken into storage per unit surface area of
WATER RESOURCES 55
1600
1400
1200
1000
800
600
400
200
^/*
X
^
X
^-
^
^
X^xX
^^
X
,x-"
Bear Creek near Victor; drainage area, 26.8 sq. mi. ^x
XX
^
/ x
^*
X
X
^
X
^
X
x
x
s
//s
X
xls
X
X
X
Blodgett Creek near Cor- vallis; drainage area, 26.4 sq. mi. ^
^^^^
Burnt Fork near Stevensville; drainage area, 74.0 sq. mi.
N 00 <* ID lO 1^ 00 CM O
RECURRENCE INTERVAL, IN YEARS
DISCHARGE, IN THOUSANDS OF CUBIC FEET PER SECOND o -p* cr> oo o i\
XxX
^X
xX"X
s--
^^
^
^X^Bjtterroot River near Darby, Mont.
CM ro ^ in to MX> CM o
RECURRENCE INTERVAL, IN YEARS
FIGURE 26. Frequency of annual floods for some typical Bitterroot River tributaries and for Bitterroot River.
56 GEOLOGY, WATER RESOURCES, BITTERROOT VALLEY, MONT.
the aquifer per unit change in the component of head normal to that surface. These coefficients can be used with other data to estimate (1) the yield and drawdown for proposed wells, (2) the amount of ground water flowing through an aquifer, and (3) the rate at which ground water is moving.
The coefficient of transmissibility was determined at 18 sites from 26 aquifer tests (table 10). The tests were too short to determine accurately the coefficient of storage. The wells pumped during the aquifer tests were shallow domestic and stock wells, observation wells were installed nearby. This situation is not ideal for testing the aquifer because the aquifer thickness may not be known, and generally the pumped well only partially penetrates the aquifer. However, data obtained from the tests are worthwhile as long as the data are not pro jected beyond the limitations imposed by the tests.
TABLE 10. Aquifer-test data [Geologic source: A, alluvium; T, Tertiary sediments]
Flowing well: static head, 5.4 ft above land sur face; drawdown, 6.0 ft below land surface; total drawdown, 11.4 ft.
Observation wells 82 and 140 ft from pumped well .
Observation well at 73 ft from pumped well.
WATER RESOURCES 57
SPECIFIC CAPACITY OF WELLS
The specific capacity of a well, or yield per unit of drawdown, is commonly expressed as the number of gallons per minute that a well will yield per foot of drawdown. Drawdown is not only dependent on the water-yielding properties of the aquifer but also on construc tion and development of the well. Actual drawdown will be greater than the theoretical drawdown even in the best designed and con structed wells and may be several times as great in poorly designed and constructed wells. The discharge and water-level drawdown in the wells used for the aquifer tests are given in table 10.
Specific capacities of wells tapping the alluvium east of the Bitter- root River range from 8 to 230 gpm per foot of drawdown and average about 85 gpm per foot of drawdown. Specific capacities of wells tapping glacial drift west of the Bitterroot River range from 7 to 55 gpm per foot of drawdown and average about 20 gpm per foot of drawdown. Specific capacities of three wells tapping Tertiary sedi ments are 0.4, 5, and 7 gpm per foot of drawdown. Specific capacities of four wells, which produce both from a thin mantle of alluvium and from Tertiary sediments, are 2, 7, 8, and 9 gpm per foot of draw down. The wide range in specific capacities is due largely to the dif ferences in thickness and composition of the aquifer but partly to differences in construction and development of the wells.
The theoretical drawdown after 12 hours of pumping 500 gpm for different values of transmissibility and for an assumed storage co efficient of 0.15 is shown in figure 27. This graph can be used to predict drawdown in a perfectly designed and constructed 24-inch-diameter well. It shows that drawdown increases as transmissibility decreases. Though not shown on the graph, the drawdown increases as the storage
coefficient decreases, according to the relation s k log -~ where
s is drawdown, k is a constant, and S is the coefficient of storage.
WATER TABLE
The surface defined by the water level in nonpumped tightly cased wells open to an unconfined aquifer is called the water table. The water table generally lies at higher altitudes under terraces and hills than under valleys; consequently, it is an irregular surface that reflects, in a general way, the topography.
The altitudes of the water level in about 100 wells were used to make a water-table contour map (pi. 1), which shows the configuration of the water surface about March 1,1968. Ground water moves downslope almost at right angles to the contours.
58 GEOLOGY, WATER RESOURCES, BPITERROOT VALLEY, MONT.
100
50
10 \
\\10,000 100,000 1,000,000
COEFFICIENT OF TRANSMISSIBILITY, IN GALLONS PER DAY PER FOOT
FIGURE 27. Theoretical drawdown in a well 24 inches in diameter, after pump ing for 12 hours at 500 gallons per minute, for various values of transmissibil- ity and a storage coefficient of 0.15.
Ground water moves generally toward the Bitterroot Eiver, but the slope and direction of movement vary locally in detail because differ ences in topography and transmissibility cause changes in the shape and slope of the water table. Others things being equal, a decrease in transmissibility causes a steepening of the water table and closer spac ing of the contours; conversely, an increase in transmissibility tends to flatten the water table. The slope of the water table is greatest (about 150 ft per mile) along the western periphery of the area where the slope of the ground surface is the greatest and the transmissibility is relatively low. The slope is least (about 12 ft per mile) along the valley floor where the slope of the ground surface is low and the transmissi bility is relatively high. West of the river, ground water moves east ward toward the river. Beneath the flood plain east of the river, ground water moves almost parallel to the river, as it does beneath the low
WATER RESOURCES 59
terrace between Hamilton and Stevensville. It moves northwestward toward the river beneath the low terrace along Skalkaho Creek and Burnt Fork, and westward toward the river beneath the low terrace along Threemile and Eightmile Creeks.
The rate of flow of ground water is slow in comparison with that of surface water and was estimated to be 400 feet per year through Ter tiary sand, 700 feet per year through alluvium beneath the flood plain, and 1,000 feet per year through the alluvium west of the river.
The water table fluctuates as water is added or withdrawn from the underground reservoir. Ground water continually discharges by seep age into streams, by evaporation and transpiration (generally along the streams), and by pumping from wells. Discharge gradually lowers the water table except when equaled or exceeded by replenishment to the underground reservoir from snowmelt, precipitation, and seepage from irrigation.
Monthly measurements to determine water-level fluctuations were begun in about 40 wells in the fall of 1955. About 65 wells were meas ured monthly in 1956 and about 95 in 1957. Automatic water-level recorders were operated in five wells during most of the study. Meas urements were continued in 95 wells until October 1959, when the program was reduced to monthly measurements in 23 representative wells.
Water-level fluctuations may be placed into three general groups short term, seasonal, and long term. In general, each group shows dif ferent hydrologic features. Short-term water-level fluctuations may indicate hydrologic characteristics of the aquifer; seasonal fluctuations may be an index of changes in the amount of water in storage; long- term fluctuations may indicate the relative amounts of recharge and discharge from year to year. Short-term fluctuations include (1) daily changes in water level due to pumping or to local recharge, (2) effects of variation in evapotranspiration, (3) changes in barometric pres sure, temperature, and wind, (4) instantaneous fluctuations caused by earthquakes and by movement of heavy loads such as railroad trains. Three types of short-term fluctuations are shown in figure 28.
Seasonal fluctuations indicate variations in the amount of water taken into and released from storage. In general, the water level grad ually declines through the winter and early spring, then rises rapidly in May and June in response to recharge from precipitation and irri gation. It remains fairly high through the irrigation season, then declines rapidly after irrigation ends. Under the existing water regi men in the valley, the general pattern of fluctuation is not likely to change from year to year, but the magnitude of seasonal changes may vary. Local variations from the general pattern of fluctuations are com-
60 GEOLOGY, WATER RESOURCES, BITTERROOT VALLEY, MONT.
2.1
2.2
2.3
2.4
2.5
2.6
2.7
March 1957 15 16 17 18 19 20 21 22
November 1956 2345 678
3.0
3.1
3.2
3.3
3.4
August 1959 14 15 16 17 18 19 20 21
3.0
3.1
3.2
3.3
3.4
3.5
FIGURE 28. Daily water-level fluctuations in well B9-20-26ba. A, diurnal fluctuations caused by tem perature changes; B, fluctuations caused by recharge from industrial waste water; and C, fluctuations caused by earthquake.
WATER RESOURCES 61
mon because of differences in depth to water, source of recharge, and point of discharge. The water levels in deep aquifers may peak later than those in shallow wells. The annual peak water level in well B8- 19-7cb, 116 feet deep, lagged behind that in well B8-20-15ba, 19 feet deep, by 3 to 4 months. The magnitude of fluctuation can vary greatly in nearby wells. The water level in well B9-20-34abl fluctuated more than 25 feet during 1958, while the water level in well B9-20-26bal, about half a mile away, fluctuated less than 3 feet. Well B9-20-34abl is believed to be in a channel cut into Tertiary sediments and subse quently filled with materials of higher permeability than materials from which well B9-20-26bal obtains water. Recharge during the irri gation season fills the reservoir near both wells. Drainage from the more permeable material is much faster; therefore, the water level declines farther at well B9-20-34abl between periods of recharge.
Fluctuations of the water level in 74 wells in the valley were used to estimate the monthly change in ground-water storage. The valley was divided into 74 polygons; each included an observation well. The boundaries of the polygons were determined by the Thiessen method (Thiessen, 1911), and the area of each polygon was planimetered. The monthly change in water level in each well, multiplied by the area of the polygon in which the well was located, was considered to be the volume of material saturated or drained within the polygon during the month. The sum of the volumes for all polygons was considered to be the total volume of material saturated or drained. The monthly changes in the volume of saturated material, the cumulative monthly departures from the volume of saturated material at the end of March 1957, and the monthly changes in the volume of ground water in storage are given in table 11. A graph of the monthly cumulative de parture from the volume of saturated material at the end of March 1957 in the Bitterroot Valley is shown in figure 29. Changes in volume of ground water in storage were computed by multiplying changes in volume of saturated material by the average specific yield of the material (0.07). This value for specific yield is the average ratio of net gain in volume of surface flow from the area to net loss in volume of saturated material within the area when (1) there was little re charge because the ground was frozen and most of the precipitation was stored as snow, (2) the river stage did not rise appreciably, and (3) very little ground water was lost to evapotranspiration (fig. 30). During such a period, the net gain in surface flow from the valley-floor area was due almost wholly to discharge of ground water. The specific yield of 0.07 is considered to be a minimum because there was probably some evaporation during the period used in making computations.
62 GEOLOGY, WATER RESOURCES, BITTERROOT VALLEY, MONT.
JUNE
1959
DEC
PIGTTEE 29. Cumulative departure from the volume of saturated material,March 1957.
Data on long-term fluctuations of the water levels for most of the Bitterroot Valley are limited to 1956-59. Hydrographs for observation wells show no significant or widespread deviations in trend. Yearly recharge to the underground reservoir is approximately equal to yearly discharge, so the water table at the end of the year is at about the same level as at the beginning. Seasonal fluctuations during the period of record ranged from 3 to 30 feet. Although precipitation in June 1958 was one of the highest on record, water levels in many wells were slightly lower in June 1958 than in June 1957 or 1959. The un usually wet June curtailed early irrigation, and probably the recharge to the ground-water reservoir supplied by precipitation was less than normally supplied by irrigation.
RECHARGE
Recharge to the Bitterroot Valley is primarily by infiltration from streams and from irrigation and secondarily by infiltration of precip itation and snowmelt. In most of the valley, the Bitterroot River is normally a gaining stream, but for a short time during the spring
WATER RESOURCES 63
i i_o Hi< uj
ol> OT
sS_ i
60
40
30
20
10
0
x-s' _/"
X" x"^
s's'S ^r
1
/'
\<^V'X
s&^r
1
'
s^/s J>r
/ /S ^r
s' s^
,x>^
Slope 0.07
i
i
x- x- /
X" S^x- x^X" x<x- ^^
/
1
200 400 600 800 10C
CUMULATIVE NET LOSS IN VOLUME OF SATURATED MATERIAL,
IN THOUSANDS OF ACRE-FEET
FIGURE 30. Net gain in volume of surface-water outflow versus net loss in vol ume of saturated material for October and November 1958. Dashed line (1957) given for comparison.
runoff, the stage is high enough to recharge the ground-water reservoir. Most of the tributary streams are perennial in their upper reaches, but during the summer, water is diverted for irrigation or sinks into the unconsolidated materials, leaving the streams dry in their lower reaches. Some of the streams, especially on the east side of the valley, have been diverted and their original course cultivated so that there is no longer a recognizable channel.
According to the Montana State Engineer (1958, p. 30), 104,570 acres are irrigated in Ravalli County; about 100,000 acres of the total are in the study area. The U.S. Soil Conservation Service (1947, p. 12-13) reported the average maximum diversion requirement to be 1 statutory inch per acre, or 1 cfs (cubic foot per second) per 40 acres, which is generally the ditch capacity. The average maximum diversion requirement for the irrigated land in the study area is 2,500 cfs, or about 150,000 acre-feet per month. In 1958, the maximum requirement was available only in May and June. In 1959, the maximum require ment was available in April, May, June, and July. During the irriga tion season (May to September), it is common to divert all the water the ditches will carry when water is available or to divert all that is
64 GEOLOGY, WATER RESOURCES, BITTERROOT VALLEY, MONT.
TABLE 11. Monthly change in volume of saturated material, cumulative monthly change in volume of saturated material, and monthly change in volume of ground water in storage in the Bitterroot Valley, in thousands of acre-feet
available when flow is less than ditch capacity. About 570,000 acre- feet of water was diverted in 1958, and about 625,000 acre-feet in 1959. Based on the U.S. Soil Conservation Service's estimate (oral commun. 1959) that less than 30 percent of the water diverted for irrigation in the valley is lost to evapotranspiration, there was more than 44)0,000 acre-feet of water available for recharge to the ground-water reservoir in 1958 and 440,000 in 1959. However, the reservoir beneath the ir rigated area was filled to capacity by the first of June, and recharge during June and July equaled discharge. After July, recharge was less than discharge.
WATER RESOURCES 65
The amount of recharge from precipitation is governed (1) by the amount, distribution, and intensity of rainfall, (2) by topography, transmissibility, and moisture holding capacity of the surficial deposits, and (3) by infiltration capacity of the soil, consumptive use, and the capacity of the ground-water reservoir to store additional water. The average annual precipitation on the valley floor is 12 or 13 inches. More than a fourth of the total normally occurs, in May and June, which are also the months of high recharge from irrigation, so the relative amount of recharge from precipitation cannot be deter mined from the hydrographs of observation wells. Rainfall on the area was about 161,000 acre-feet between April 1 and September 30, 1958, and about 132,000 acre-feet during the same period in 1959, but very little of it recharged the ground-water reservoir.
Although the relative amounts of recharge from precipitation or irrigation could not 'be determined, the combined effect was estimated from water-level records. From April 1 to July 31, 1958, the volume of saturated material increased by 1,300,000 acre-feet, and for the same period in 1959 there was an increase of 1,200,000 acre-feet. Multiplying those volumes by an average specific yield of 0.07 (p. 61) shows an increase in ground-water storage of about 90,000 acre-feet in 1958 and 82,000 acre-feet in 1959.
DISCHARGE
Ground water is discharged from the Bitterroot Valley by pumping from wells, by effluent seepage into streams, springs, drains, and seeps, and by evapotranspiration.
Discharge from wells is estimated on the basis of population and on the number of irrigation wells. It is estimated that the per capita use of water from wells by 13,000 people is 100 gallons per day. Therefore, annual ground-water discharge from domestic and munici pal wells is almost 1,500 acre-feet. Less than 1,000 acres of land are irrigated from wells. The average application during the irrigation season is about 2 feet. Therefore, less than 2,000 acre-feet of water per year is pumped from irrigation wells. The total 3,500 acre-feet per year represents approximate gross pumpage from the ground- water reservoir. Net discharge would be less because of return seepage from septic tanks, sewer systems, and irrigation.
Ground-water discharge into streams was estimated from figure 29. The average monthly discharge rate is considered to be the average slope of the graph during the fall and early winter, when evapo-
66 GEOLOGY, WATER RESOURCES, BITTERROOT VALLEY, MONT.
transpiration is at a minimum. In water years 1958 and 1959, about 150,000 and 160,000 acre-feet of ground water, respectively, was discharged.
Water discharged into the atmosphere by evaporation, transpira tion, and sublimation is no longer available for use. The combined action of these processes is called consumptive use and is approxi mately the difference between inflow and outflow, plus or minus change in storage. Consumptive use in the Bitterroot Valley during the 1958 water year was about 450,000 acre-feet of water (23 percent of the total water entering the area). During the 1959 water year, the con sumptive use was about 400,000 acre-feet (18 percent of the total water entering the area).
HYDROLOGIC BUDGET, WATER YEARS 1958 AND 1959
EVALUATION
,A hydrologic budget equates accretions to the water supply of an area to depletions. A hydrologic-budget equation basically states that inflow minus outflow equals change in storage. In a general form, which accounts for all water in an area, the budget may be written:
Surface inflow + subsurface inflow + precipitation + decrease in ground-water storage + decrease in surface-water storage + decrease in snow storage + decrease in soil moisture= surface outflow + subsurface outflow + evapotranspiration + in crease in ground-water storage + increase in surface storage + increase in snow storage + increase in soil moisture.
The general equation of the hydrologic budget was modified for the Bitterroot Valley to:
During the 1958 and 1959 water years, surface-water inflow was measured at gaging stations around the margins of the valley; sur face-water outflow was measured at the valley's outlet near Florence; precipitation was measured at stations throughout the area; and the change in storage of ground water was computed from measurements of the water level in wells. It is assumed that decrease in ground-water storage equals net ground-water discharge and increase in ground- water storage equals net ground-water recharge. Subsurface inflow and outflow are about equal and are estimated to be less than 2,500 acre-feet per year. Change in surface-water storage is negligible be-
WATER RESOURCES 67
cause there are no large storage reservoirs within the area and the aver age area of water surface of the Bitterroot River is less than 1,000 acres.
The unmeasured depletions and accretions are evapotranspiration, changes in soil moisture, and changes in snow storage. Unmeasured depletions consist largely of increase in snow storage and sublimation in the winter, increase in soil moisture in the spring and fall, and evapotranspiration in the summer. Unmeasured accretions are de crease in snow storage in the winter and spring and decrease in soil moisture during the growing season. Unmeasured accretions equaled or exceeded unmeasured depletions only in March 1958 and March 1959, owing to snowmelt during these 2 months.
A monthly water budget of the area is given in table 12 and shown in figure 31. The accuracy of the figures is limited by the accuracy of determinations of precipitation, change in ground-water storage, and streamflow.The quantities in column 10, table 12, were determined from the measured quantities and therefore include any inaccuracies in the measured quantities.
ANALYSIS
From October 1957 through March 1958, surface-water outflow ex ceeded inflow. The gain in outflow was derived from ground-water dis charge, which exceeded recharge throughout the period, and from precipitation. Some of the precipitation returned to the atmosphere by evaporation and (or) sublimation and some added to the streamflow.
From April through July 1958, surface-water outflow was less than inflow. In April, the ground-water reservoir received some recharge from precipitation and snowmelt. Owing to high streamflow from snowmelt, May was the month of greatest accretion to the total water supply of the area for the 1958 water year and also the month of greatest surface-water outflow for the year. Ground-water recharge, mostly from infiltration of irrigation water but in part from infiltra tion of rain and snowmelt, was also greatest in May. Much water was consumed by evapotranspiration. There was some net ground-water recharge in June and July 1958, in spite of high evapotranspiration.
During August and September 1958, inflow still exceeded outflow indicating that evapotranspiration was greater than ground-water discharge and precipitation.
GA
INS
LO
SSES
+
I
80
8
DE
PLE
TIO
NS
THO
US
AN
DS
O
F AC
RE-
FEET
AC
CR
ETI
ON
S
oo
^
en888
I
GAI
NS
LOSS
ESD
EP
LETI
ON
S THO
US
AN
DS
O
F AC
RE-
FEET
AC
CR
ETI
ON
SO
5
! Su
rfac
e-w
ater
infl
ow to
Bit
terr
oot V
alle
y 1
Mon
th
Hn
t
Feb................
Mar.
........
.....
July
.. .
Sep
t. ..
....
....
....
To
tal.
....
...
Oct
.. ............
..
Dec
.. ............. -
Feb..- ..
.......
July
.. ---
----
--
Sept.
...... ..
....
..T
ota
l.. .
.....
Bit
terr
oot
Eas
t-si
de
Wes
t-si
de
Riv
er n
ear
trib
utar
ies
trib
utar
ies
Dar
by
(1)
(2)
(3)
21 2
716
.75
10.8
015
.68
16.4
9
34.4
4
137.
545
.27
23.8
515
.40
628.
8
17.3
724
.92
27.9
420
.55
16. 2
519
.54
67. 7
916
2.2
249.
665
.06
23.6
124
.97
719.
8
7.38
6.
19
6.15
5.
15
4.42
4.
70
9.34
70
.71
49.6
3 19
.55
10.6
4 6.
96
200.
8
6.33
6.
07
5.83
4.
94
4.14
5.
71
11.4
8 27
.18
71.4
0 20
.35
9.72
8.
03
181.
2
14.9
7 9.
55
8.66
8.
12
9.85
14
.41
47.2
8 39
8.3
214.
6 69
.89
36.2
0 21
.68
853.
5
23.2
2 46
.35
39.6
0 18
.96
12.4
0 14
.52
77.6
4 20
5.8
424.
5 12
6.3
45.6
0 39
.36
1074
^T
otal
' ro
(4) 43
.62
32.4
9 25
.61
28.9
5 30
.76
36.3
6 91
.06
743.
1 40
1.7
134.
7 70
.69
44.0
4 16
83 46.8
2 77
.34
44.4
5 32
.79
39.7
7 15
6.9
395.
2 74
5.5
211.
7 78
.93
72.3
6 19
75
Mea
sure
d ou
t-
low
from
the
Net
gai
n U
nmea
sure
d T
otal
of
Bit
terr
oot
(+)
or lo
ss
Net
gro
und-
N
et g
roun
d- d
eple
tions
or
accr
etio
ns,
"alle
y (B
ttte
r- (
) in
sur
face
Pre
cipi
tati
on
wat
er
wat
er
accr
etio
ns
whi
ch is
equ
al
ot R
iver
nea
r flo
w 2
disc
harg
e re
char
ge
( )
' to
tot
al o
f Fl
oren
ce)
depl
etio
ns *
(5)
(6)
(7)
(8)
(9)
(10)
(1
1)
1958
wat
er y
ear
55.7
9 47
.34
39.8
4 37
.72
41.6
3 43
.86
79.4
2 60
7.9
353.
2 90
.88
40.8
2 38
.91
1477
1959
wat
er y
ear
56.0
4 89
.88
98.6
2 65
.63
48.3
2 66
.76
143.
0 31
3.9
656.
8 16
3.1
40.5
4 82
.90
1825
+12
. 17
+
14.
85
+14.2
3
+8
.77
+
10.
87
+7
.50
-1
1.6
4
-135.2
-4
8.5
-4
3.8
-2
9.
87
-5.1
3
-205.
8
+9
.12
+
12.5
4
+25.2
5
+21
. 18
+
15.5
3
+26
. 99
-1
3.9
-8
1.3
-8
8.7
-4
8.6
-3
8.3
9
+10.5
4
-149.
7
22.2
6.2
24
.7
8.7
13
.7
4.8
31
.1 .
...
27.2
...
.57
.5 .
...
24.1
...
.9.0
11
.7
240.
9
9.9
37.3
18
.8
21.5
22
.4 .
...
9.1
11.3
...
.41
.3 .
...
2.1
....
11.1
41
.2
251.
5
17.7
15.9
...
.13
.1 .
...
10.6
...
.1.
1 ..
..2.
7 ..
..
11.4
...
.18
.1 ..
..90
.6
18.0
...
.12
.5 .
...
12.6
..
..9.
8 ..
..
.5 ..
..
10.2
...
.12
.6 ..
..76
.3
22.0
54
.3
11.0
2.2
89.5
0.1
15.6
50
.8
14.0
1.
9
82.4
27.7
7.
2 23
.6
10.5
3.9
0 20
.8
108.
1 95
.0
65.7
50
.3
34.9
44
7.7
18.8
37
.3
6.2
10.1
6.8
-1
7.4
9.
6 71
.8
100.
2 48
.8
59.7
43
.3
395.
2
83.5
64
.6
63.4
48
.2
45.6
43
.9
122.
2 77
0.3
459.
2 15
8.8
91.1
73
.8
2015 74
.8
127.
2 10
4.8
75.7
55
.2
48.4
16
8.2
436.
5 77
1.0
213.
8 10
0.2
126.
2 23
02
<l o 0 fel o o 3 H
3 H
fel GO 1 1 J33 td M i
1 C
olum
n 1
plus
col
umn
2 pl
us c
olum
n 3.
3 C
olum
n 5
min
us c
olum
n 4.
s C
olum
n 7
plus
col
umn
8 m
inus
col
umn
6 m
inus
col
umn
9.*
Col
umn
4 pl
us c
olum
n 7
plus
col
umn
8 eq
uals
col
umn
5 pl
us c
olum
n 9
plus
col
umn
10.
WATER RESOURCES 71
Beginning in October 1958 and continuing through March 1959, sur face-water outflow was more than surface-water inflow. Ground-water discharge exceeded recharge each month except February 1959. In March 1959, snowmelt within the area exceeded net increase in soil moisture and evapotranspiration.
From April through July 1959, inflow exceeded outflow; there was net ground-water recharge; much water was evapotranspired.
In August 1959, inflow was still greater than outflow; most of the difference was due to evaporation and transpiration. In September 1959, surface-water outflow was more than surface-water inflow. Evap otranspiration about equaled precipitation. There was slightly more water stored in the ground-water reservoir at the end of the 2-year period than there was at the beginning of the period.
CHEMICAL QUALITY OF WATER
BY H. A. SWENSON
MINERAL CONTENT OF NATURAL WATERS
We know by taste and from common knowledge that rain water is fresh and sea water is salty. Chemical analyses confirm this fact. Lab oratory tests show that rain and snow contain some dissolved solids, perhaps as much as 0.001 percent, or 10 mg/1 (milligrams per liter), whereas sea water averages about 3.5 percent, or 35,000 mg/1, and some natural brines contain several hundred thousand milligrams per liter. Waters in most of our springs, wells, rivers, and creeks have interme diate concentrations. Tolerances to salt content and to specific constitu ents in water for drinking, cultivation of crops, industry, and other uses are now generally known. Table 13 lists the common constituents and their concentrations in 36 samples of surface and ground water in the Bitterroot Valley. Measurements of certain physical charac teristics such as water temperature and color also are tabulated.
72 GEOLOGY, WATER RESOURCES, BITTERROOT VALLEY, MONT.
TABLE 13. Chemical analyses of
[Chemical constituent8
Well or surface sourceDepth Diam- Date of Tem- ofwell eter collec- pera-
74 GEOLOGY, WATER RESOURCES, BITTERROOT VALLEY, MONT.
TABLE 13. Chemical analyses of water
Depth Diam- Date of Tern- Cal- Mag- So- Po- Blear- Well or surface source of well eter collec- pera- Silica Iron cium ne- dium tas- bonate
(ft) of well tlon ture (SlOa) (Fe) (Ca) slum (Na) slum (HCO 3) (in) (°C) (Mg) (K)
Streams from
Como Lake on Hock Creek........................
Blodgett Creek near Corvallis __ ......_.........
Mill Creek near Corvallis _ .... _ ..........
Bear Creek near Victor.... ...................
Big Creek near Victor. _ .-.. .-... ....-.
Kootenai Creek near Stevensvillfi^ ,,
Bass Creek ne3F Stevensville __ .............
......... 10-11-55
......... 9-19-57
......... 9-19-57
Q 1Q-17
......... 9-17-57
......... 9-12-57
...... 9-17-57
g
7
8
7
1?
11
in
4.9
3 4
7.7
7 2
4.1
6.7
5.9
0.00
.04
.04
.07
.02
.00
.02
2.0
1.4
2.2
2.2
2.2
2.6
2.4
0.2
.1
.1
.2
.1
.2
.2
1.1 0. 5
.8 .3
1.2 .3
1.5 .3
1.3 .3
1.5 .6
1.1 .6
9
8
11
1?
9
10
10
1 Analysis by Montana State Board of Health.
Residents of the valley generally are favored with water of good chemical quality. Some domestic supplies contain iron and nitrate in objectionable amounts, but this problem is not common. The success of irrigation and the steady economic development of the valley is due in part to good quality water. The surface waters are softer, as a rule, and contain smaller amounts of dissolved solids than the ground water, as shown in the following table:
Number Range in concentration (mg/1) Source of
samples Dissolved solids Hardness
Wells and springs.________________ 40 42-748 17-210Streams________________________ 16 13-121 4-98
CHEMICAL CHARACTER AND ENVIRONMENT
The chemical character of a natural water reflects the environment through which the water has passed. Geologic factors, as well as the influence of man, play important roles in the composition and con centration of mineral constituents in waters. Water supplies from one side of Bitterroot Valley show distinctive differences in quality from those on the other side, as shown by the relative hardness of water (fig. 32). Streams heading in the Sapphire Mountains (east side of
WATER RESOURCES,
from the Bitterroot Valley Continued
75
Dissolved solids
Car- Sul- Chlo- Fluo- Ni- Bo- Resi-bonate fate ride ride trate ron(C03) (SOO (01) (F) (N03) (B) Sum
Hardnessas CaCOs So-
dium- conduct- Calci- Non- ad- ance pH Color um, car- sorp- (micro- mag- bon- tion mhos at
nesium ate ratio 25°C)
Bitterroot Range
0 0.7
0 1.1
0 1.0
0 1.4
0 2.9
0 4.4
0 2.8
0.2
.2
.2
.2
.2
.2
.2
0.0
.2
.2
.3
.1
.1
.1
0.3
.0
.0
.2
.1
.0
.2
0.01
.01
.00
.04
.00
.04
.02
16
13
20
21
17
22
20
14
11
18
19
16
21
18
6
4
6
6
6
7
7
0
0
0
0
0
0
0
0.2
.2
.2
.3
.2
.2
.2
22.3
15.1
20.1
23.0
21.3
28.2
23.3
6.4
6.5
6.6
6.7
6.7
6.8
6.9
5
5
5
5
5
5
5
valley) are more mineralized than those heading in the Bitterroot Mountains (west side). Ground water, which is recharged by creek and irrigation water, reflects similar differences.
Streams draining the Bitterroot Mountains flow through an area of igneous and metamorphic rocks, which are resistant to rapid solution by water. As a result, these waters have small concentrations of dis solved solids. A sample of water from Como Lake, collected on Octo ber 11,1955, contained only 16 mg/1 of dissolved solids. In the spring, melting of the heavy snowpack in the mountains above Como Lake releases water of even lower mineral content to the reservoir. Chemical analyses of water from seven creeks draining the Bitterroot Mountains are reported in table 13.
The Sapphire Mountains east of the Bitterroot E-iver are composed of sedimentary and igneous rocks. These rocks contain higher propor tions of readily soluble minerals than rocks in the Bitterroot Moun tains. Water from Skalkaho Creek near Hamilton, on October 11,1955, had 113 mg/1 of dissolved solids and was of the calcium magnesium bicarbonate type. This creek heads in an area of granitic gneiss and sedimentary rocks. Daly Creek, a tributary entering above the sam pling site, flows through outcrops of argillaceous limestone and proba bly contributes most of the dissolved solids to Skalkaho Creek. Analyses of waters from six streams that drain the Sapphire Mountains are listed in table 13.
76 GEOLOGY, WATEJR RESOURCES, BITTERROOT VALLEY, MONT.
220
200
180
160
140
100
80
60
40
20
Ground water
iSurface water
West side of river East side of river
FIGURE 32. Hardness of waters from Darby to Florence. Samples are arranged in downstream order for each side of the river.
SELECTED REFERENCES 77
Bitterroot River water in October 1955 contained 53 mg/1 dissolved solids near Darby and 95 mg/1 dissolved solids at Florence, near the north end of the valley. This increase in concentration, which is not significant in relation to the usefulness of the water, is the net effect of inflow from 20 tributaries from the west and five from the east, ground-water discharge, and irrigation return flow.
Water from alluvium beneath the flood plain and terraces is of variable but generally acceptable quality for most uses (table 13), The chemical character of the ground water is influenced by source of recharge, permeability, chemical character of the aquifer, soil cover, and rate of ground-water movement.
SELECTED REFERENCES
Alden, W. C., 1953, Physiography and glacial geology of western Montana andadjacent areas: U.S. Geol. Survey Prof. Paper 231,200 p.
Anderson, A. L., 1952, Multiple emplacement of the Idaho batholith: Jour.Geology, v. 60, no. 3, p. 255-265.
Bretz, J. H., Smith, H. T. IL, and Neff, G. E., 1956, Channeled scablands ofWashington, new data and interpretations: Geol. Soc. America Bull., v. 67,no. 8, p. 957-1049.
Chapman, E. W., Gottfried, D., and Waring, C. L., 1955, Age determinations onsome rocks from the Boulder batholith and other batholiths of westernMontana: Geol. Soc. America Bull., v. 66, no. 5, p. 607-609.
Douglass, E., 1909, A geological reconnaissance in North Dakota, Montana, andIdaho, with notes on Mesozoic and Cenozoic geology: Carnegie Mus., An5:211-288.
Eakins, G. E., and Honkala, F. S., 1952, Cenozoic history of Missoula Valley,Missoula County, Montana [abs.]: Geol. Soc. America Bull., v. 63, no. 12,pt. 2, p. 1361.
Fenneman, N. M., 1931, Physiography of western United States: New York,McGraw-Hill Book Co., 534 p.
Holt, Dean C., 1964, Titanium placer resources in western Montana: U.S. Bur.Mines Eept. Inv. 6365,39 p.
Konizeski, E. L., 1958, A Pliocene vertebrate fauna from the Bitterroot Valley,Montana, and its stratigraphic significance: Geol. Soc. America Bull., v. 69,no. 3, p. 345-346.
Langton, C. M., 1935, Geology of the northeastern part of the Idaho batholithand adjacent region in Montana: Jour. Geology, v. 43, no. 1, p. 27-60.
Larsen, R S., Jr., Gottfried, D., Jaffe, H. W., and Waring, C. L., 1958, Lead- alpha ages of the Mesozoic batholiths of western North America: U.S. Geol.Survey BulL 1070-B, p. 35-62.
Larsen, E. S., Jr., and Schmidt, R. G., 1958, A reconnaissance of the Idaho batho lith and comparison with the southern California batholith: U.S. Geol.Survey Bull. 1070-A, p. 1-33.
Lindgren, W., 1904, A geological reconnaissance across the Bitterroot Eangeand Clearwater Mountains in Montana and Idaho: U.S. Geol. Survey Prof.Paper 27, 123 p.
78 GEOLOGY, WATER RESOURCES, BITTERROOT VALLEY, MONT.
McMurtrey, R. G., and Konizeski, R. L., 1956, Progress report on the geology and. ground-water resources of the eastern part of the Bitterroot Valley, Montana: Montana Bur. Mines and Geology Inf. Oirc. 16, 28 p.
1959, Preliminary report on the geology and water resources of the Bit terroot Valley, Montana: Montana Bur. Mines and Geology Bull. 9, 45 p.
Montana State Engineer, 1958, History of land and water use on irrigated areas,Ravalli County, Montana, Part 1: State Engineer's Office, Helena, Mont,81 p.
Pardee, J. T., 1910, The glacial Lake Missoula: Jour. Geology, v. 18, p. 376-386. 1940, Ripple marks (?) in glacial Lake Missoula, Montana [abs.] : Geol.
Soc. America Bull., v. 51, no. 12, pt. 2, p. 2028-2029. 1942, Unusual currents in glacial Lake Missoula, Montana: Geol. Soc.
America Bull., v. 53, no. 11, p. 1569-1599. 1950, Late Cenozoic block faulting in western Montana : Geol. Soc. Amer
ica Bull., v. 61, no. 4, p. 359-406.Ross, C. P., 1936, Some features of the Idaho batholith: Internat. Geol. Gong.,
16th, Washington, 1933, v. 1, p. 369-385. 1947, Structure of the front of the Bitterroot Range, Mont, [abs.] : Wash
ington Acad. Sci. Jour., v. 37, no. 10, p. 375. 1950, The eastern front of the Bitterrroot Range, Montana: U.S. Geol.
Survey Bull. 974-E, p. 135-175. Ross, C. P., Andrews, D. A., and Witkind, I. J., compilers, 1955, Geologic map of
Montana, prepared in cooperation with Montana Bur. Mines and Geology:Washington, U.S. Geol. Survey.
Sahinen, U. M., Smith, R. I., and Lawson, D. C., 1958, Progress report on clays ofMontana: Montana Bur. Mines and Geology Inf. Circ. 23, 41 p.
Thiessen, A. H., 1911, Precipitation averages for large areas: Monthly WeatherRev., v. 39, p. 1082-1084.
U.S. Geological Survey, 1955, Compilation of records of surface waters of theUnited States through September 1950 Part 12, Pacific slope basins inWashington and upper Columbia River basin: U.S. Geol. Survey Water-Supply Paper 1316, 592 p.
U.S. Geological Survey, 1960, Surface-water supply of the United States, 1959 Part 12, Pacific slope basins in Washington and upper Columbia River basin:U.S. Geol. Survey Water-Supply Paper 1636, 402 p.
1964, Compilation of records of surface waters of the United States,October 1950 to September 1960 Part 12, Pacific slope basins in Washingtonand upper Columbia River basin: U.S. Geol. Survey Water-Supply Paper1736, 415 p.
U.S. Soil Conservation Service, 1947, Reconnaissance conservation report onwater control, use and disposal Bitterroot River drainage basin, RavalliCounty, Montana: U.S. Dept. Agriculture, Soil Conservation Service, Region5, Lincoln, Nebr.,'53 p.
Vine, J. D., and Erdmann, C. E., 1952, Records of wells drilled for oil and gas inMontana : U.S. Geol. Survey Circ. 172, 39 p.