ABSTRACT 578 Geometallurgy: new accurate testwork to meet required accuracies of mining project development Michel Brissette* Starkey & Associates, Canada Veroljub Mihajlovic Chemical Engineering, University of Waterloo, Canada Shaheer Sanuri Materials Engineering, McGill University, Canada ABSTRACT The main purpose of geometallurgy is to improve the mine planning by mapping hardness and throughput into the mine block model using geostatistics to eliminate the large production fluctuations caused by the ore hardness variability coming from different parts of the pit. However, not all grinding testwork available commercially can be applied to geometallurgy because of large amount of sample required and the associated cost per test. Geometallurgy is now being used in designing grinding mill but as the mining project progress, the accuracy of engineering must improve from 30-35% during the scoping study to 10-15% at the bankable feasibility stage and less than 5% for Engineering Procurement and Construction Management. For SAG milling, the SAG Variability Test (SVT) is an abbreviated version of the standard SAGDesign test developed for this geometallurgical need. The same amount of ore than the original test is ground for three cycles into an open batch SAG test and then the SAG pinion energy is predicted to the standard end point of 80% passing 1.7 mm. For ball milling, a Bond Variability Test (BVT) was also developed using the SAG ground ore from the SVT. The Bond ball mill grindability (Gpb), corresponding to the average of the net grams per revolution from the last three cycles of the Bond test, is also predicted from the third cycle. The relative error for both the predicted SAG ore hardness (WSVT) and Bond Work Index on SAG Variability ground ore (Sv-BVI), in kWh/t, averaged 5.5% and 3.8% respectively compared to the SAGDesign testwork values and are within 7% and 10% respectively from plant benchmark and within 7% from the samples sent to all partner laboratories. Both tests can be continued to measure the true hardness necessary for mill sizing. This article discusses the development of these two new tests, SVT and BVT, their potential use and accuracies in any geometallurgical program.
Transcript
ABSTRACT 578
Geometallurgy: new accurate testwork to meet required accuracies of mining project development
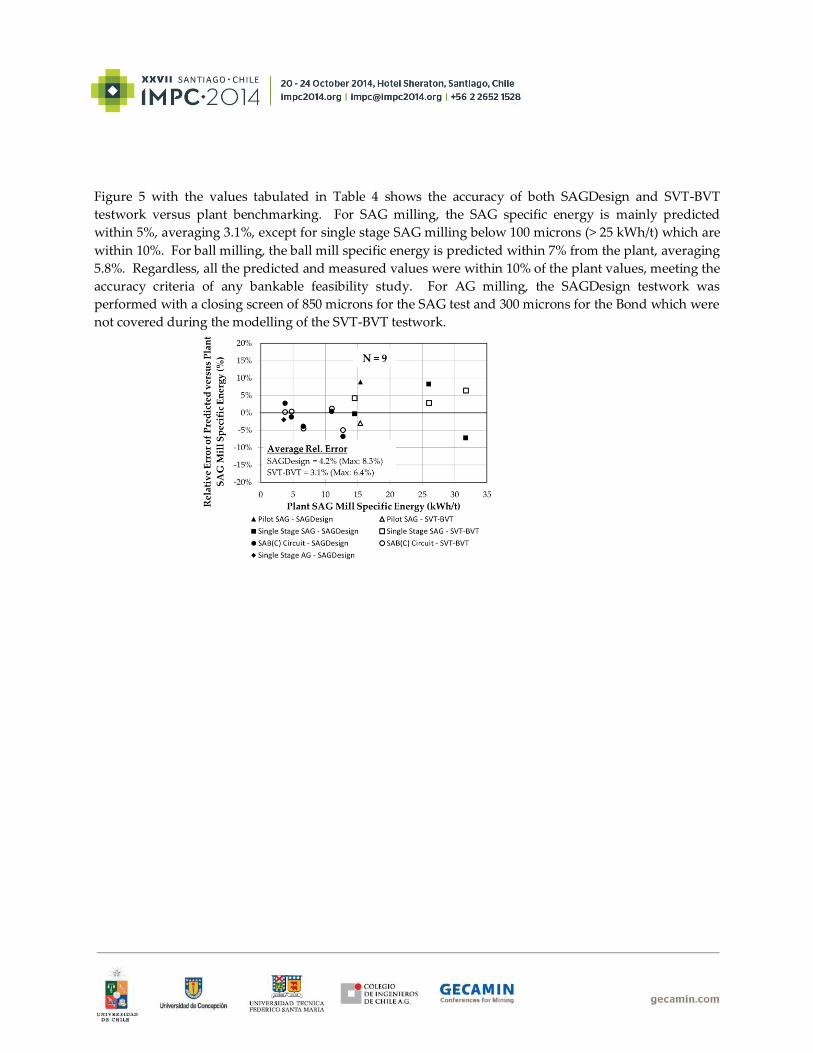
Michel Brissette*
Starkey & Associates, Canada
Veroljub Mihajlovic
Chemical Engineering, University of Waterloo, Canada
Shaheer Sanuri
Materials Engineering, McGill University, Canada
ABSTRACT
The main purpose of geometallurgy is to improve the mine planning by mapping hardness and
throughput into the mine block model using geostatistics to eliminate the large production
fluctuations caused by the ore hardness variability coming from different parts of the pit.
However, not all grinding testwork available commercially can be applied to geometallurgy
because of large amount of sample required and the associated cost per test. Geometallurgy is now
being used in designing grinding mill but as the mining project progress, the accuracy of
engineering must improve from 30-35% during the scoping study to 10-15% at the bankable
feasibility stage and less than 5% for Engineering Procurement and Construction Management.
For SAG milling, the SAG Variability Test (SVT) is an abbreviated version of the standard
SAGDesign test developed for this geometallurgical need. The same amount of ore than the
original test is ground for three cycles into an open batch SAG test and then the SAG pinion energy
is predicted to the standard end point of 80% passing 1.7 mm. For ball milling, a Bond Variability
Test (BVT) was also developed using the SAG ground ore from the SVT. The Bond ball mill
grindability (Gpb), corresponding to the average of the net grams per revolution from the last three
cycles of the Bond test, is also predicted from the third cycle.
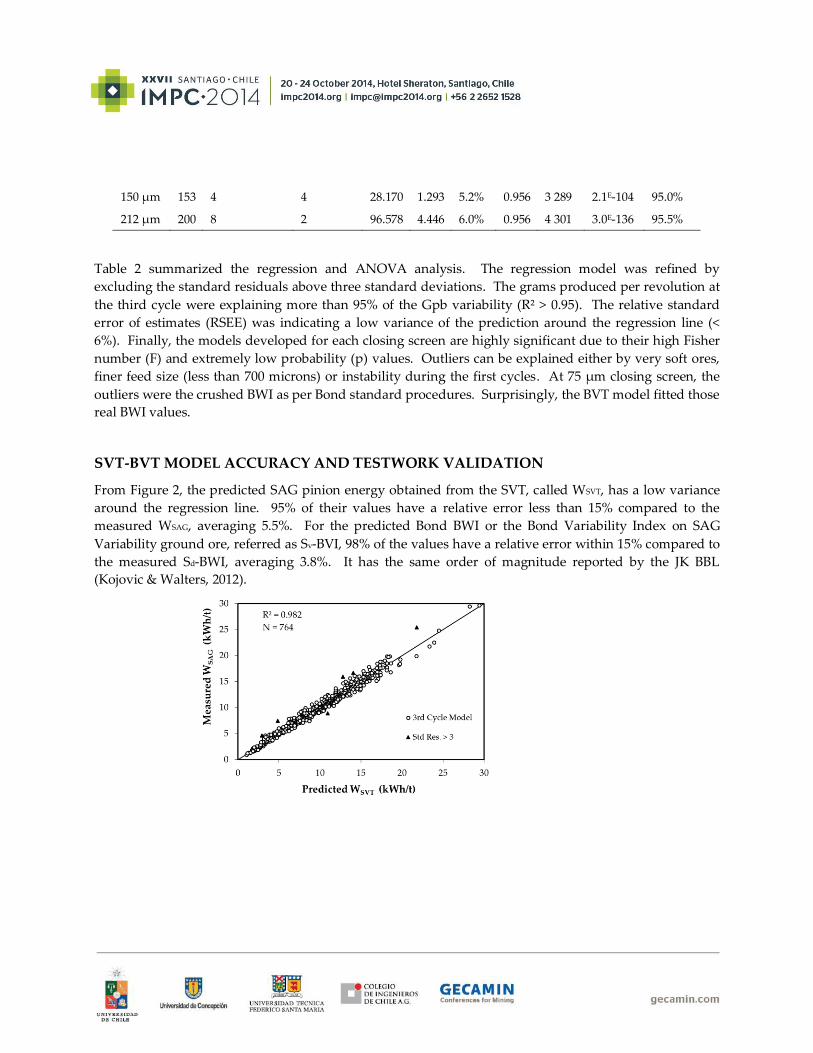
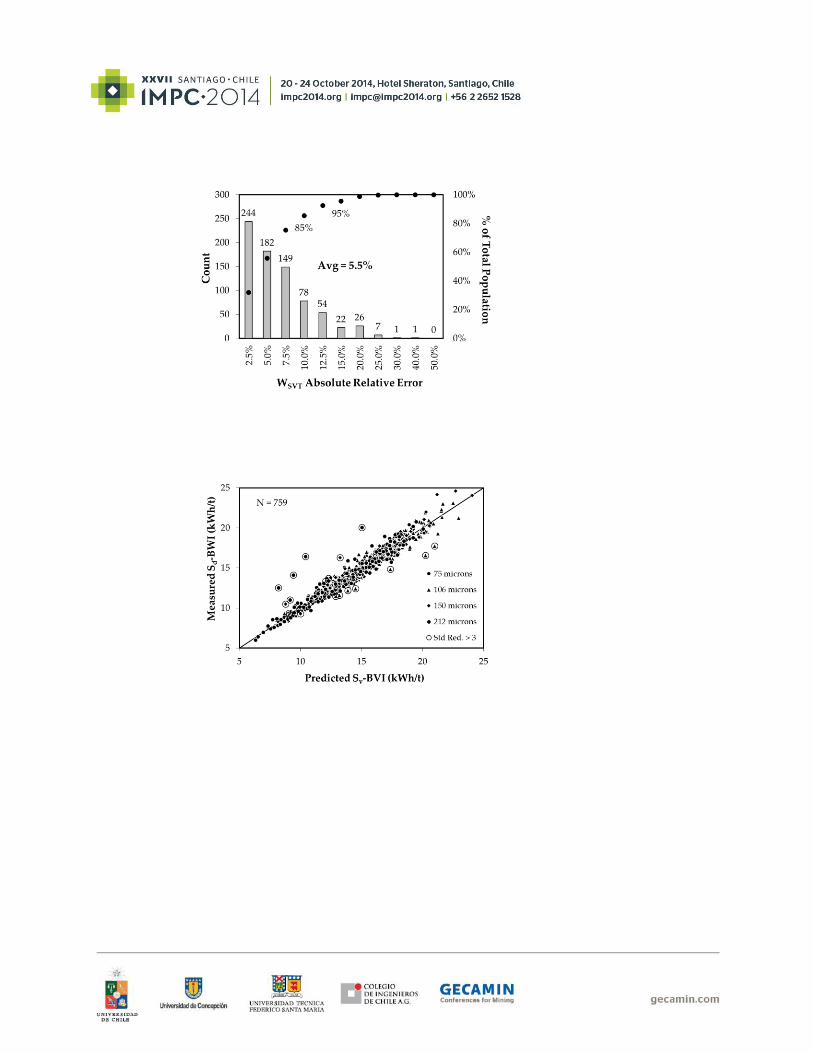
The relative error for both the predicted SAG ore hardness (WSVT) and Bond Work Index on SAG
Variability ground ore (Sv-BVI), in kWh/t, averaged 5.5% and 3.8% respectively compared to the
SAGDesign testwork values and are within 7% and 10% respectively from plant benchmark and
within 7% from the samples sent to all partner laboratories. Both tests can be continued to measure
the true hardness necessary for mill sizing. This article discusses the development of these two new
tests, SVT and BVT, their potential use and accuracies in any geometallurgical program.
INTRODUCTION
Comminution testwork is conducted to mitigate risks associated with the selection and design of a
grinding circuit to ensure that the project generates the necessary cash flow during the payback period.
With geometallurgy, the mine planning is thus optimized by mapping hardness and forecasting
throughput into the mine block model using geostatistics to achieve design tonnage over the life of mine
of the deposit and eliminate the large throughput fluctuations caused by the ore hardness variability.
From the available commercialized grinding tests, some are simply not applicable to geometallurgy
because of the larger number of samples required and their associated cost. New tests or simplified
procedures were developed to measure the ore hardness quickly and cost effectively like the SPI or the
SMC test for SAG milling and the Modified Bond test or the JK Bond Ball Lite (JK BBL) for ball milling.
An understanding of the implications of the testwork methods and data interpretation is required to
effectively moderate the risks. Not only the number of required samples depends on the grinding
testwork chosen and increases during each progressing stage of a mining project (Meadows, Scinto &
Starkey, 2011) but the estimate and relevant testwork need also to be more accurate (Lunt, Ritchie & Fleay,
1997 and Scott & Johnston, 2002): 30-35% for the FEL Phase I (scoping or conceptual), 20-25% for Phase II
(preliminary economic assessment and pre-feasibility), 10-15% for Phase III (bankable feasibility) and less
than 5% for Engineering, Procurement and Construction Management (definitive).
The purpose of this paper is to introduce a new variability or geometallurgical test based from the
SAGDesign grinding testwork as an effective solution to mitigate the risk of mill selection and design of a
grinding circuit as well as to production forecasting that will meet the accuracy requirement of the
progressing development stage of any mining project. The SAGDesign test is an open batch SAG test to
grind the ore progressively in stage (or cycle) to 80% passing 1.7 mm in 6 to 8 cycles in general, followed
with a locked cycle Bond test performed on the SAG ground product from that SAG test to the final grind
product as defined by the standard Bond test. The accuracy of the SAGDesign testwork and the
difference between the standard Bond test on crushed feed and SAG ground ore versus were already
discussed in many papers exceeding the scope of this paper (Starkey & Larby, 2012, Starkey & Scinto,