Geometric Design, Speed, and Safety R.J. Porter, PhD, PE Assistant Professor of Civil Engineering University of Utah [email protected]801-585-1290 4/10/2015 TREC Seminar Series 1 www.trafficlab.utah.edu
Transcript
Geometric Design, Speed, and SafetyR.J. Porter, PhD, PE
Assistant Professor of Civil EngineeringUniversity of Utah
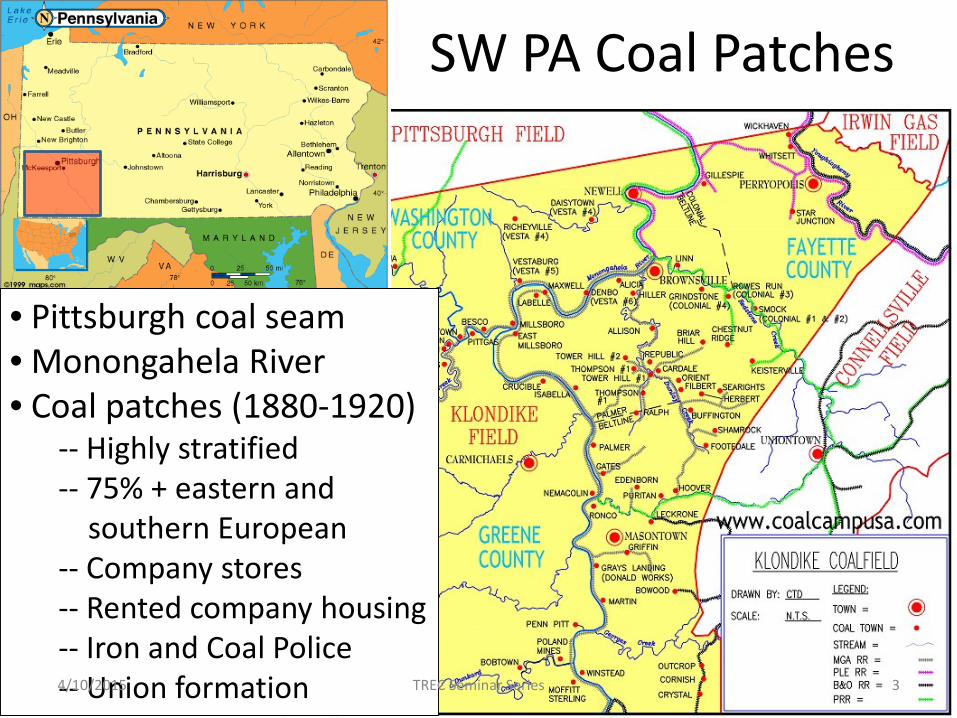
southern European-- Company stores-- Rented company housing-- Iron and Coal Police-- Union formation 34/10/2015 TREC Seminar Series
* data from 2000 censusPictures from www.coalcampusa.com
Vesta #6Denbo, PA (pop. 713*)
• avg house value: $14,200*• avg income: $23,500*
44/10/2015 TREC Seminar Series
• The U (July 2009 - ) • Texas A&M
• Virginia Tech (research)
• Penn State, ’07
• Penn State, ‘95-’97…?
Education and Academic Experience
Cumberland Coal Mine, Summer ‘97
• Penn State, ’00
Teaching and Research:• highway and street design• road safety• project development
• traffic operations• statistics/econometrics• risk and reliability analysis
5
• Penn State, ‘97-’99
4/10/2015 TREC Seminar Series
Geometric Design, Speed, and Safety
4/10/2015 TREC Seminar Series 6
• Why do we get what we get?
• Can we get what we want? How?
Pictures from FHWA-HRT-05-098 (2006)
Background
4/10/2015 TREC Seminar Series 7
Self-enforcing, self-explaining design
Context sensitive design/solutions
Complete streets
Design consistency
Speed management
Traffic calming
Speed prediction feedback loop
Speed harmony
Speed discord
Inferred design speed
4/10/2015 TREC Seminar Series 8
Design Speed
“…a selected speed used to determine the various geometric design features of the roadway…” (2001-current)
“…should be a logical one with respect to topography, anticipated operating speed, the adjacent land use, and the functional classification…”
Structural Design
4/10/2015 9
“Design Load”
Legal Load Limit
Anticipated vehicle loads
Vehi
cle
Load
s
TREC Seminar Series
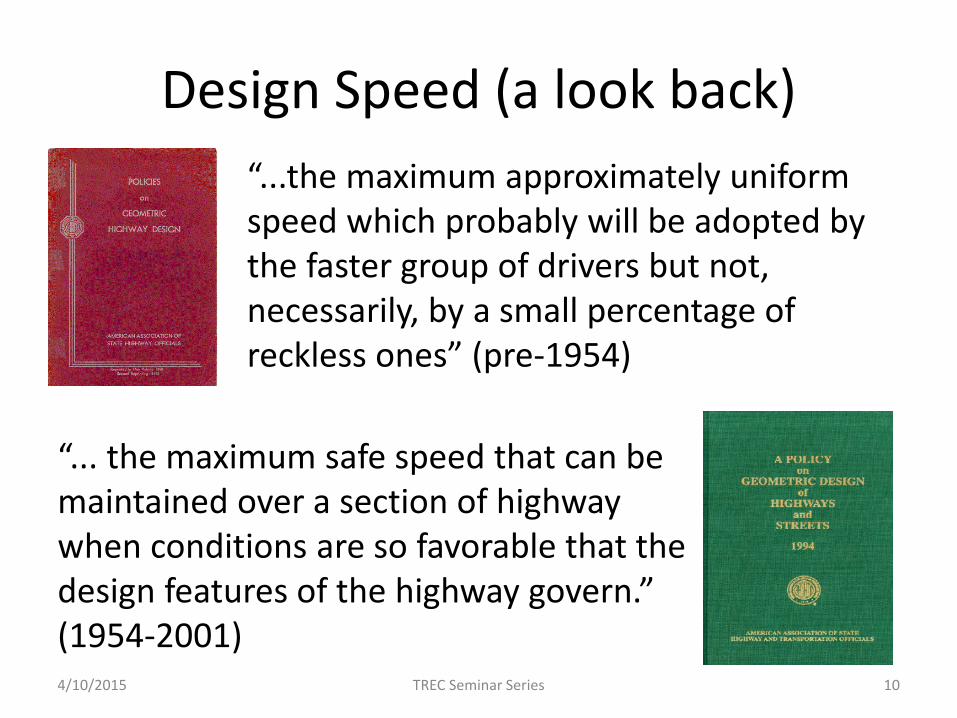
Design Speed (a look back)
4/10/2015 TREC Seminar Series 10
“...the maximum approximately uniform speed which probably will be adopted by the faster group of drivers but not, necessarily, by a small percentage of reckless ones” (pre-1954)
“... the maximum safe speed that can be maintained over a section of highway when conditions are so favorable that the design features of the highway govern.”(1954-2001)
Approximate Relation Between Design and Running Speeds for Urban Conditions
4/10/2015 TREC Seminar Series 11
15
25
35
45
55
65
25 35 45 55 65
Runn
ing
Spee
d, m
ph
Design Speed, mphAdapted from AASHTO (1957)
Design speed ranges from 30 to 40 mph (corresponding to target speeds of 25 to 35 mph).
Design Speed SelectionInsights from NCHRP Report 504
• In urban areas, designers generally select design speeds that are within the range of anticipated operating speeds, regardless of terrain or functional class. The selected design speed was often equal to or 5 mph higher than the anticipated posted speed limit across terrain types and functional classifications.
• In rural areas, designers generally select design speeds that are within the range of anticipated operating speeds, regardless of terrain or functional class. The selected design speed was nearly always 5 mph higher than the anticipated posted speed limit across terrain types and functional classifications.
4/10/2015 12TREC Seminar Series
Speed Relationships in Design Process As Intended/Desired…
4/10/2015 TREC Seminar Series 13
from Donnell et al. (2009)
Criteria Related to Design Speed
4/10/2015 TREC Seminar Series 14
±
+=Ga
VVtSSD
2.3230
47.12
−=
vvs R
SRM 65.28cos1 ( )221
2
200 HHASL+
=
Example of Limiting Values
4/10/2015 TREC Seminar Series 15
emax: Influenced by climate conditions, constructability, adjacent land use and the frequency of slow moving vehicles ( )maxmax
2
min 15 feVR+
=
fmax: The point “at which discomfort due to the lateral acceleration is evident to drivers has been accepted as a design control for the maximum side friction factor on high-speed streets and highways.”
from AASHTO (2004)
“Limiting” Values?
4/10/2015 TREC Seminar Series 16
0
0.1
0.2
0.3
0.4
0.5
0.6
0.7
10 20 30 40 50 60 70 80 90
side
fric
tion
fact
or, f
Design Speed, mph
Available ‘f’, passenger cars, wet pavement
“Margin of Safety”
Maximum ‘f’ used for design
“Limiting” Values?
4/10/2015 TREC Seminar Series 17
0
500
1,000
1,500
2,000
2,500
3,000
3,500
10 20 30 40 50 60 70 80 90
Min
imum
Cur
ve R
adiu
s, fe
et
Design Speed, mph
Minimum curve radius based on actual f, passenger cars, wet pavement
“Margin of Safety”
Minimum curve radius used for design
4/10/2015 TREC Seminar Series 18
Roadway Design Guidance
“Above-minimum design values should be used, where practical…”
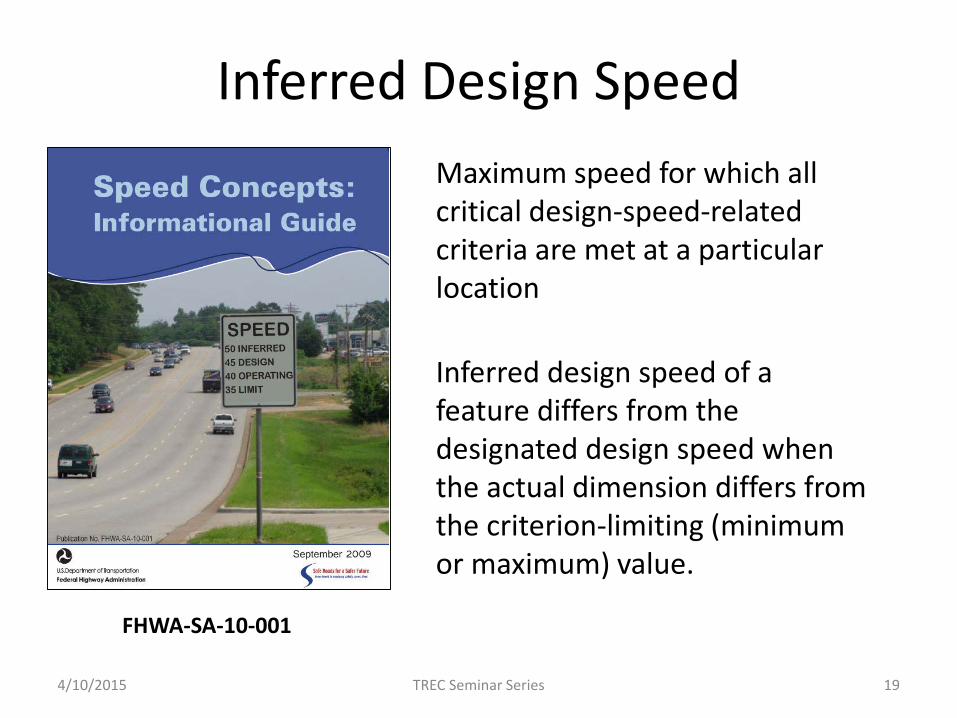
Inferred Design Speed
4/10/2015 19
FHWA-SA-10-001
Maximum speed for which all critical design-speed-related criteria are met at a particular location
Inferred design speed of a feature differs from the designated design speed when the actual dimension differs from the criterion-limiting (minimum or maximum) value.
TREC Seminar Series
Speed Relationships in Design Process As Intended…(with inferred design speed)
4/10/2015 TREC Seminar Series 20
from Donnell et al. (2009)
Expected & Observed Relation Between Design and Running Speeds (Low-Volume)
4/10/2015 TREC Seminar Series 21
Adapted from AASHTO (1957)
15
25
35
45
55
65
25 35 45 55 65
Runn
ing
Spee
d, m
ph
Design Speed, mph
1 Estimated using data from Donnell et al., 2009
Running Speed = Design Speed
Case Study: Blue Course DriveFerguson Township, PA
4/10/2015 22
• New alignment ≈ 2002
• ADT ≈ 3,500• Design speed: 40
mph• Urban collector• Segment length: 1.5
miles• Horizontal curves: 3• Maximum grade:
+3.5%, -6.6%
TREC Seminar Series
Case Study: Blue Course DriveFerguson Township, PA
4/10/2015 TREC Seminar Series 23
Kcrest = 90 ft/%
Rmin = 444 ft for V = 40 mph, emax = 8%; Kcrest,min = 44 ft/% for V = 40 mph
Case Study: Blue Course DriveFerguson Township, PA
4/10/2015 24TREC Seminar Series
Observed Speed Relationships?Low to Moderate Design Speeds
4/10/2015 25
from Donnell et al. (2009)TREC Seminar Series
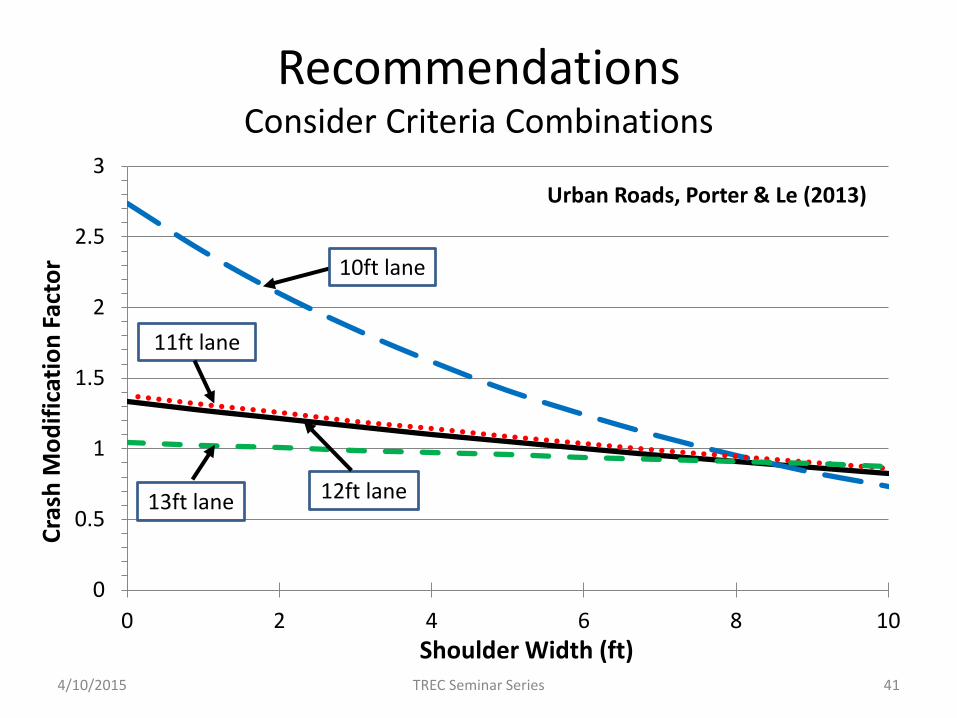
Speed Management Through Road Geometrics“Self-Enforcing, Self-Explaining Roadway Design”
from Porter et al. (2012)
4/10/2015 TREC Seminar Series 26
1. What is known about relationships between road geometry and operating speeds?
2. To what degree does road geometry influence operating speeds?
3. How are safety and security influenced by road geometry?
4. What are potential impacts to large vehicles?
5. What is the nature of the speed-safety trade-off?
What is known about relationships between road geometry and operating speeds?
4/10/2015 TREC Seminar Series 27
10 authors from 5 different countries
a synthesis of existing operating speed models developed in different regions of the world.
Much of what we know in North America is for rural, two-lane highways
What is known about relationships between road geometry and operating speeds?
4/10/2015 TREC Seminar Series 28
0.0%
0.5%
1.0%
1.5%
2.0%
2.5%
3.0%
3.5%
4.0%
4.5%
-15 -5 5 15 25 35 45 55 65 75 85 95 105x (mph)
Mean speed = 55 mph
Std. Deviation = 10 mph
Mean speed = 50 mph
Std. Deviation = 15 mph
Distribution 1
Distribution 2
85th Percentile ≈ 65mph“It is now widely believed that collision rate is more directly affected by speed variations than by speed per se, given that intuitively, the probability of conflicts would be lower if all vehicles were travelling at the same speed.” - TAC
To what degree does road geometry influence operating speeds?