Page 1
2017
UNIVERSIDADE DE LISBOA
FACULDADE DE CIÊNCIAS
DEPARTAMENTO DE BIOLOGIA ANIMAL
Geometric Morphometric and Genetic Diversity analyses
of two small mammal populations from heavy metal mines
in Portugal
Ana Filipa Durão
Mestrado em Biologia Humana e Ambiente
Dissertação orientada por:
Doutora Ana Sofia Quina
Professora Doutora Maria da Luz Mathias
Page 3
À minha Avó
“Caminante, son tus huellas
el camino y nada más;
Caminante, no hay camino,
se hace camino al andar.
Al andar se hace el camino,
y al volver la vista atrás
se ve la senda que nunca
se ha de volver a pisar.
Caminante no hay camino
sino estelas en la mar.”
António Machado
“Proverbios y cantares” in Campos de Castilla, 1912
Page 5
i
Agradecimentos
Uma tese, embora seja considerada um trabalho individual, não poderia ser concretizada sem o
suporte e a generosidade daqueles que ajudam e ensinam ao longo do processo. Como tal, gostaria de
expressar a minha gratidão a todos que me ajudaram e permitiram que este trabalho se pudesse realizar.
Assim gostaria de agradecer às minhas orientadoras: à Doutora Ana Quina por me ter
apresentado este maravilhoso mundo novo da Ecotoxicologia Evolutiva, pelas incansáveis horas de
discussão e debate de ideias (perto e à distância) e pela disponibilidade total que sempre mostrou ao
longo de toda a tese, e à Professora Maria da Luz Mathias pelos conselhos, pelo apoio e pelo
encorajamento que sempre me deu para abraçar a morfometria, caminho que hoje tento traçar.
Ao Professor Doutor Jacint Ventura pela sua generosidade em partilhar comigo o seu
conhecimento e por me ter ajudado numa fase tão crucial do projecto.
Ao Doutor Francesc Muñoz-Muñoz pela ajuda nos bloqueios técnicos que tantas vezes me
stressaram e pelas horas de partilha de ideias e procura de soluções.
Ao Professor Doutor Octávio Paulo pelos conselhos sábios na hora da discussão do trabalho.
Ao Welvis Fernandes que me ajudou a dar os primeiros passos nas análises de morfometria
geométrica perdendo horas do seu tempo a ensinar-me.
Ao grupo de investigação de Biologia da Adaptação e Processos Ecológico que me acolheram
no seu grupo e que nas longas horas das reuniões de terça-feira discutiam, partilhavam a sua opinião
sobre o trabalho e acima de tudo me ajudavam a ser critica e a melhorar. Assim gostaria de agradecer:
à Doutora Ana Cerveira, à Doutora Sofia Gabriel, ao Doutor Joaquim Tapisso, à Doutora Rita Monarca,
à Doutora Sophie e ao Tomé. Gostaria de agradecer em especial ao Diogo e ao Flávio que para além de
participarem ativamente nas reuniões me ensinaram a armadilhar nas saídas de campo que fizemos.
Aos meus amigos, os que levo no coração sempre que me tenho de ir embora (Food Junkies) e
aos novos que partilharam comigo estes últimos momentos de stress: Anna i Sandra, graciès per totes
les paraules de suport i comoditat en moments estressants.
A mis compis de piso (Sónia, Wanga y Avi) por la amistad, por la fuerza y por el apoyo
constante principalmente en los momentos más difíciles en que “nos huye el suelo”.
À Nês por tudo o que partilhamos, pelas aventuras milaborantes que sempre nos metemos e que
acabam sempre por dar fantásticas histórias, por alinhar nas minhas maluqueiras (como armadilhagens
em dias de festa), pela ajuda, pelo apoio, mas acima de tudo pela amizade.
Aos meus pais. A vida têm-nos ensinado que tudo muda muito depressa, os planos que temos
muitas vezes não são mais do que isso mesmo, planos e que as pessoas que amamos partem sem aviso
prévio ou bilhete de despedida. O tempo têm-nos ensinado que unidos somos capaz de ultrapassar
medos, barreiras e continuar a andar, por mais doloroso que seja o caminho. Todo este processo (as
teses, as mudanças, as perdas) seriam ainda mais difíceis se eu não tivesse a vossa ajuda e o vosso apoio.
Poucas são as palavras para agradecer à minha Mãe que todos os dias me envia uma dose de energia e
ao meu Pai que me lembra que não vale apena fazer planos, porque a vida tem planos para nós.
Ao meu irmão por me lembrar que sou humana e que de vez em quando convêm respirar e à
Cláudia por me sempre dar uma mão amiga.
Page 6
ii
Por último, em memória da minha Avó, a minha segunda Mãe, a minha amiga, a minha
companheira de armas que sempre partilhou comigo os bons e os maus momentos e que com o seu forte
caracter sempre me ensinou que para a frente é que é o caminho.
A todos um muito obrigada.
Page 7
iii
Resumo
A indústria mineira tem tido ao longo dos últimos séculos um papel preponderante no
desenvolvimento económico dos países. Contudo a sua intensa atividade tem deixado marcas profundas
no ambiente tanto durante o seu período de exploração, como após o seu encerramento, sendo hoje em
dia considerada uma das maiores fontes de poluição antropogénicas de metais. Durante os processos de
britagem e moagem muitos materiais não são recuperados, sendo depositados em escombreiras. Estes
locais sujeitos à ação dos elementos tornam-se fontes imprevisíveis de contaminação de água, solo,
vegetação e atmosfera, representando sérios riscos ao nível biológico e ecológico. Esta exposição a
metais, seja a metais pesados ou a elevadas concentrações de metais essenciais, tem efeitos tóxicos
imediatos sobre os indivíduos ou a médio-longo prazo sobre as populações ou comunidades. Um dos
efeitos deletério é a sua capacidade para aumentar a formação de espécies reativas de oxigénio induzindo
stress oxidativo nos animais. Este efeito pode ter implicações nas células somáticas, podendo originar
doenças degenerativas, processos carcinogénicos e mutagénicos (com possíveis consequências para a
fitness das populações naturais) ou ao nível das células germinativas, prejudicando a geração seguinte.
Em ambos os casos estas alterações poderão ter resultados demográficos na população. O stress
ambiental causado pelos metais pesados pode afetar a composição das populações de maneiras distintas:
através do aumento da taxa de mutação e/ou alteração da taxa de migração (gene flow) ou através de
eventos de bottleneck (deriva genética) e/ou seleção de genótipos tolerantes (seleção natural). Esta
alteração do padrão genético poderá ter consequências tanto ao nível fisiológico como morfológico. O
uso de sentinelas é fundamental para este tipo de estudos toxicológicos, permitindo uma visão holística
do impacte negativo que os metais têm no ambiente e na saúde humana. Devido à importância que têm
na cadeia alimentar introduzem a componente espacial e temporal na análise, algo que não é possível
através de uma análise química direta no ambiente. O uso de biomarcadores permite detetar e quantificar
o efeito da exposição aos metais ao longo dos diferentes níveis de organização biológica.
Embora se saiba que os metais pesados têm efeitos negativos nos indivíduos, poucos estudos
têm sido realizados em pequenos mamíferos a níveis de organização biológica superiores, ainda sendo
limitado o conhecimento que o efeito crónico à exposição dos metais pesados pode ter nas populações.
Neste contexto a presente tese pretendeu entender qual o impacto que os metais têm sobre a
biodiversidade, através da análise das alterações ao nível morfológico e genético. Este tipo de estudos
permite analisar de uma maneira indirecta o risco para a saúde humana.
No presente trabalho, foram estudadas duas espécies de pequenos mamíferos Crocidura russula
(Hermann, 1780) e Mus spretus (Lataste, 1883), já anteriormente usados em estudos de
biomonitorização. Estas duas espécies têm um tempo geracional muito curto, o que faz por exemplo,
com que pressões ambientais possam gerar rápidas mudanças na história evolutiva destas espécies,
fazendo delas bons biomonitores de estudos de ecotoxicologia evolutiva. Os animais do presente estudo
foram capturados entre 2002 e 2003 em duas minas localizadas a sudeste de Portugal, a mina de Aljustrel
e a mina da Preguiça, e numa zona de referência para fins comparativos (Moura). A mina de Aljustrel é
uma mina que se localiza na Faixa Piritosa Ibérica. Esta operou intensamente entre 1867 a 1996 (ano
em que cessa atividade), extraindo cobre, zinco, chumbo e prata. É uma área que apresenta uma profunda
alteração e degradação da paisagem, reflexo dos longos anos de exploração. A mina da Preguiça é uma
mina localizada na Zona da Ossa Morena, tendo estado ativa entre 1911 e 1964 e extraído
essencialmente zinco e chumbo. Este local não aparenta grandes sinais de degradação ambiental tendo
a vegetação invadido a mina e escondido escorias e resíduos existentes. Estudos anteriores realizados
nestes locais mostraram que comparativamente com área de referência ambas as minas apresentaram
elevadas concentrações de zinco, arsénio e chumbo nos solos, juntamente com zinco e chumbo nas
Page 8
iv
plantas. Alterações bioquímicas (níveis de metalotioninas, atividade enzimática antioxidante),
histológicas (rins e fígado), fisiológicas (parâmetros morfológicos e hematológicos) e um aumento da
frequência de micronúcleos foram observadas nestas mesmas minas em Crocidura russula e Mus
spretus.
Partindo deste conhecimento, o principal objetivo da presente tese foi avaliar qual o efeito dos
metais pesados a longo-médio prazo em duas populações de pequenos mamíferos que vivem em minas
abandonadas, recorrendo a biomarcadores genéticos e análise de morfometria geométrica. A estrutura
escolhida para a análise morfológica foi a mandíbula devido a ser uma estrutura amplamente usada em
diversos estudos, nomeadamente em estudos toxicológicos. É uma estrutura composta só por um osso
que apresenta uma estrutura plana, permitindo a aplicação de uma análise de morfometria geométrica
em 2D. Esta análise foi realizada unicamente em Mus spretus devido ao limitado número de exemplares
de Crocidura russula existentes na zona de referência. Um total de 124 indivíduos adultos foram
analisados (mandíbula esquerda e direita), tendo sido todas as mandíbulas limpas através do método de
água fervente. Posteriormente foram digitalizadas e colocado 19 landmarks sobre cada mandibula
usando software específico. Para analisar a forma os landmarks foram decompostos em size e shape,
tendo sido a variação na shape analisada na mandíbula como um todo e em cada módulo funcional
separado (ramo ascendente e a região alveolar). O tamanho da mandíbula foi obtido pelo centroid size.
Para explorar as diferenças da shape e avaliar as distâncias morfológicas entre populações foi realizado
uma análise da variante canónica para a componente simétrica e assimétrica. Por fim como biomarcador
da instabilidade do desenvolvimento, foi calculado a assimetria flutuante para os três locais, tendo sido
realizado um teste estatístico. As evidências para as mudanças genéticas populacionais nas duas espécies
foram investigadas usando parâmetros de diversidade de dois marcadores mitocondriais sujeitos a
pressões seletivas diferentes, o gene citocromo b (Cyt b) e a região controlo. O ADN genómico foi
extraído de 63 Crocidura russula e 75 Mus spretus, tendo sido os fragmentos de ADN mitocondrial
amplificados através de reações em cadeia da polimerase, utilizando primers específicos. Os produtos
obtidos foram purificados e sequenciados. As sequências obtidas foram editadas, alinhadas e
comparadas com as sequências existentes no GenBank. No caso de Crocidura russula, uma vez que o
comprimento da região controlo é muito variável mesmo dentro de um indivíduo (heteroplasmia de
tamanho), a região controlo foi aqui usada como “marcador genético neutro”. Como parâmetros de
diversidade genética foram analisados: a diversidade haplótidica, nucleótidica, número de haplótipos,
substituições sinónimas e não sinónimas, variable sites e mismatch distribution, enquanto a análise da
estrutura populacional foi avaliada através da variação genética entre e dentro das populações por uma
análise da variância molecular e pela relação entre haplótipos estabelecida pela rede de haplótipos.
Os resultados deste estudo confirmaram que para além de existirem alterações a nível individual,
tanto as populações de Crocidura russula como Mus spretus nas duas minas estudadas estão a sofrer
impactos negativos a outro nível de organização biológica. As análises morfológicas em Mus spretus
revelaram diferenças entre as três populações e proximidade morfológica entre locais contaminados,
embora se tenha verificado uma aproximação genética maior entre local de Referencia e a Mina da
Preguiça. Estas mudanças morfológicas sugerem que a baixa qualidade ambiental está a atuar de uma
forma direta e indireta, através da disponibilidade de recursos entre os diferentes locais. Ao nível da
assimetria flutuante não foram encontradas diferenças significativas entre as populações, o que pode
estar relacionado com a sensibilidade da mandíbula a perturbações ambientais ou à sazonalidade da
biodisponibilidade dos metais. Baseado no gene Cytb, ambas as espécies na mina de Aljustrel
apresentaram altos valores de diversidade genética possivelmente devido ao gene flow das populações
circundantes, atuando este lugar como um ecological sink. Os baixos valores registados em Cytb
juntamente com os “marcadores genéticos neutros” da região controlo sugeriram que a população da
Page 9
v
mina de Preguiça, possivelmente num passado recente sofreu um bottleneck, tendo sido recolonizada
por indivíduos de populações próximas como a zona de referência. Esta diminuição populacional
possivelmente deveu-se a um aumento da taxa mutacional nesta população, o qual é sugerido pelo
aumento da diversidade genética na região controlo.
Os nossos resultados confirmam o impacto potencial que as minas abandonadas têm ao nível
individual e ao nível das populações, permanecendo activos os efeitos nocivos da actividade mineira.
Estes resultados reforçam a importância de planos de recuperação ou ações de remediação nas minas
abandonadas, de modo a mitigar os efeitos adversos dos metais pesados. Uma vez que a resposta
populacional nas duas espécies foi coincidente, conclui-se que as diferenças registadas são devido às
diferentes características das minas, reforçando a importância das distintas variáveis que podem
influenciar as respostas da população e que fazem os estudos de toxicologia evolutiva complexos. Por
fim, este estudo corroborou a sustentabilidade das duas espécies usadas como bons biomonitores da
qualidade ambiental, assim como o uso de biomarcadores genéticos e morfométricos para a identificação
dos efeitos toxicológicos ao nível da população.
Palavras-chave: Mus spretus, Crocidura russula, Pequenos mamíferos, metais, biomarcadores
Page 11
vii
Abstract
Portugal has a long history of mining. Nonetheless, a decline in this activity has been observed over the
last decades, with consequent abandonment of mining areas without recovery plans. Abandoned mines
constitute one major environmental problem since they are unpredictable sources of metal pollution.
Although environmental pollution may have effects at all levels of biological organization, few studies
have been performed on high organizational levels, like the population level, so that the chronic effect
of metal toxicity remains largely unknown. To understand the medium-long term impact of metals on
biodiversity, in this study it was performed geometric morphometric and genetic analyses of the
populations of two mammalian sentinel species (Mus spretus and Crocidura russula) living in two heavy
metal polluted mines in southern Portugal (Aljustrel mine, deactivated since 1996, and Preguiça mine,
deactivated since 1964), that were previously shown to harbour changes at the biochemical, histological
and physiological levels. We observed that the morphological analysis in Mus spretus revealed
mandibular morphological differences in the three populations and a greater morphological similarity
between the animals from mines. These morphological changes may be associated with the low
environmental quality in mines. In the Aljustrel mine, both species showed higher genetic diversity in
the Cytochrome b gene, while in the populations from Preguiça, the diversity of the Cytochrome b gene
and of the mitochondrial control region changed in opposite directions, high genetic diversity in the
latter, and low diversity in Cytb. These results suggest that Aljustrel may have functioned as an
ecological sink and that in Preguiça a bottleneck may have occurred in the recent past, possibly due to
an increase in the mutational rate. Our results confirmed the potential environmental impact of mines at
the individual level and showed that within a relatively short time, pollution by heavy metals had altered
normal homeostatic pathways and the genetic structure of natural populations. Since the effects on the
populations of both species were concordant, it may be concluded that the different responses are due
to the different characteristics of each mine. This study also corroborates the sustainability of these two
species as biomonitors of environmental quality and the use of genetic and morphological biomarkers
in identifying toxicological effects at a population level. Ecotoxicological studies such as this have the
potential to assess the impact of anthropogenic stress on the evolutionary history of natural populations,
as well as to reinforce the importance of requalification plans or remediation actions in abandoned
mines.
Keywords: Mus spretus, Crocidura russula, Small mammals, metals, Biomarker
Page 13
ix
Table of Contents
Agradecimentos ...................................................................................................................................... i
Resumo .................................................................................................................................................. iii
Abstract ................................................................................................................................................ vii
List of Abbreviations ........................................................................................................................... xii
1. Introduction ................................................................................................................................... 1
1.1. Mining industry as a source of heavy metal pollution ............................................................. 3
1.1.1. Abandoned mines ............................................................................................................ 4
1.2. Biological impact of heavy metals .......................................................................................... 5
1.3. Small mammals as sentinels of heavy metal pollution ............................................................ 6
1.4. Contaminant effects on natural populations. ........................................................................... 8
1.5. Biomarkers ............................................................................................................................ 12
1.5.1. Genetic biomarkers ........................................................................................................ 12
1.5.2. Morphological variation ................................................................................................ 14
1.6. Case study - Aljustrel and Preguiça mines ............................................................................ 18
2. Thesis context and objectives ..................................................................................................... 21
3. Paper Quina, A.S., Durão, A.F., Mathias, M.L. - Geometric Morphometric and Genetic Diversity
analyses of two small mammal populations from heavy metal mines in Portugal (manuscript in
preparation) .......................................................................................................................................... 25
Geometric Morphometric and Genetic Diversity analyses of two small mammal populations
from heavy metal mines in Portugal .............................................................................................. 27
4. Final considerations and concluding remarks .......................................................................... 65
4.1. Final considerations ............................................................................................................... 65
4.2. Concluding remarks .............................................................................................................. 67
4.3. Future perspectives ................................................................................................................ 68
References ............................................................................................................................................ 69
ANEXO I – Protocol of the simmering method .................................................................................... 77
ANEXO II - Summary of cranium cleaning techniques tested on Mus spretus .................................... 77
ANEXO III - Flowchart of the Geometric Morphometry analysis ....................................................... 79
ANEXO IIII - Flowchart of the Genetic analysis .................................................................................. 80
Page 15
xi
Table of Figures
Figure 1 Mining issues with a negative effect on the environment and human health (adapted from
Hatch, 2013). ........................................................................................................................................... 3
Figure 2 Small mammals commonly used as sentinels: a) Mus spretus and b) Crocidura russula. ...... 8
Figure 3 Summary of how genotoxic and non-genotoxic contaminants may lead to population-level
consequences. The up and down arrows within the boxes suggest increase and decrease, respectively
(adapted from Rose and Anderson, 2005). ............................................................................................ 10
Figure 4 The four cornerstones of Evolutionary Toxicology (adapted from Bickham, 2011). ............ 11
Figure 5 Effect of environmental pollutants on all biological organization levels and the most used
biomarkers at each organizational level (adapted by (Mussali-Galante et al., 2013a). ......................... 13
Figure 6 Frequency distribution (f) of left - right differences for three types of asymmetry a) fluctuating
asymmetry, b) directional asymmetry and c) antisymmetry (modified from Klingenberg, 2015). In the
X-axis, “0” means perfect symmetry. ................................................................................................... 15
Figure 7 Mouse mandible with the four components: ramus and three processes. Two main modules:
alveolar region and ascending ramus (adapted from Atchley et al., 1985). .......................................... 17
Figure 8 Map of Portugal showing the location of the Aljustrel and Preguiça mines. ......................... 18
Figure 9 General appearance of the Preguiça and Aljustrel mine at 2002-2003. A) Aljustrel mine and
B) Preguiça mine (Marques, 2008). ...................................................................................................... 19
Page 16
xii
List of Abbreviations
AMD – acid mine drainage
AMOVA – analysis of molecular variance
ANOVA – analysis of variance
AS – antisymmetry
CA – chromosome aberrations
CR – control region
CSB – conserved sequence blocks
CV – canonical vector
CVA – canonical variates analysis
CVS – volcano-sedimentary complex
Cytb - cytochrome b
DNA - deoxyribonucleic acid
DS – directional asymmetry
ETAS – extended termination associated sequences
FA – fluctuating asymmetry
h – number of haplotypes
HSD – honestly significant difference
IPB – Iberian Pyrite Belt
LMS – landmarks
MN – micronucleated cells
mtDNA – mitochondrial deoxyribonucleic acid
OMZ – Ossa Morena Zone
PSZ – Portuguese Southern Zone
RNA - ribonucleic acid
ROS – reactive oxygen species
SCE – sister chromatic exchange
Page 19
Introduction
3
1. Introduction
1.1. Mining industry as a source of heavy metal pollution
The mining industry has contributed significantly to the economic, social, cultural and technological
development of the societies in which they operate. However, its exploitation has left deep marks on the
environment, degenerating and degrading natural resources and endangering the human health (Figure
1). Today, the mining industry is seen as one of the anthropogenic activities that produce the deepest
impacts on the environment. It is responsible for the release of potentially toxic substances suspected of
causing adverse effects at different levels of the biological organization, not only during its activity but
after its unscheduled shutdown. Irrespective of whether the results vary according to site conditions and
the type of exploration, it can be considered that there are three major problems:
1. Change in landscape;
2. Changes in hydrological conditions;
3. Tailing
Figure 1 Mining issues with a negative effect on the environment and human health (adapted from Hatch, 2013).
In the case of the alteration of the landscape, this is visible from the beginning of the mining
cycle, having different types of impact in the lithosphere as landscape change, landlessness, unused pits,
and shafts (Zyl et al., 2002). These changes not only preclude the use of land for other purposes, (such
as for agriculture), but also it is a loss of biodiversity through the degradation of vegetation.
One of the biggest problems in the mining industry is the amount of waste from excavation
operations. For many years tailings were dumped into nearby watercourses, resulting in extreme
conditions, for example water color change. Nowadays, these wastes are in a tailing disposal facility,
which is, piles of mined materials that cannot be recovered during mill operations. These piles of waste
are exposed to erosion (Henriques and Fernandes, 1991) mechanical dispersion, leaching, and oxidation
by the oxygen present in pluvial waters (Santos Oliveira et al., 2002), releasing into the environment
high concentrations of heavy metals. The mineral composition of these wastes will significantly
Acid mine drainage
(AMD)
Toxicity Metal leaching and
heavy metal
contamination
Erosion and sedimentation Tailing
Watercourses and groundwater vulnerability
Greenhouse gases Climate changes
Medium affected: water, air, land
Impact to: Biodiversity, human health and social conditions
Page 20
4
influence the quality of surface and groundwater of these sites. The effluents from mine drainage water
or the simple rainwater on these residues can carry heavy metals to long distances in the form of
leachates, through infiltration and percolation processes into groundwater (Santos Oliveira et al., 2002).
The redox conditions between oxic water and anoxic sediments can have profound influences on the
speciation and bioavailability of many trace metals (Morse and Luther, 1999).
The major environmental problems in mining are the acid mine drainage (AMD), i.e., the
oxidation of sulphide in the presence of water and oxygen originating ferric hydroxides and sulphuric
acid. While any mineral deposit containing sulphide is a potential source of AMD, pyrite (FeS2) is the
primary mineral associated with the generation of AMD (Gray, 1997). As water becomes more acidic,
its capacity to leach other elements increases, producing a percolate rich in dissolved metals (Hofmann
and Schuwirth, 2008). This water acidification is one of the effects of AMD, characterized by high metal
content at low pH. The water quality is degraded due to pH reduction and increased solubility of soluble
metals, transporting the metals from mine to water body. This degradation of water quality will have
direct and indirect effects, which can compromise the ecological structure through biological and
physical changes, such as increasing the concentration of heavy metals in sediments, facilitating the
entry into the food chain (Gray, 1997). In many cases, mine areas show high levels of heavy metals in
surface waters, groundwater and soils, aggravated by the long-term persistence in the environment
(Hofmann and Schuwirth, 2008). It is hard to predict the impact of AMD due to the variability of the
discharge, variation in composition that varies seasonally, the effect of surface runoff from exposed
areas during heavy rains and the effect of discharge characteristics which affect the dilution and the
concentration of organic matter (Gray, 1997).
1.1.1. Abandoned mines
An abandoned mine is a mine that has no activity, no management, no recovery plan and no one
responsible for its rehabilitation or remediation (Mhlongo and Amponsah-Dacosta, 2015).
Despite the fact that Portugal has a long mining history dating since the Pre-Roman ages, over the
last decades Portugal has witnessed a continuous decrease in mining. This reduction resulted in a high
number of abandoned mining areas, mostly without an environmental recovery plan which represents a
serious environmental problem. Between 1991 and 2001, an environmental report about the main
degraded mining areas of Portugal indicated the existence of more than 85 abandoned mines (Santos
Oliveira et al., 2002). Nowadays, about 175 mines are abandoned, 114 of polymetallic sulfides and 61
of radioactive ore (Ameixa, 2017). This growing abandonment resulted from an exploration based on
economic criteria as a consequence of economic conditions, resource depletion or a combination of both
(Santos Oliveira et al., 2002; EDM, 2011). Many mines underwent cyclical exploration processes
interrupted with new re-openings due to fluctuations in the price of metals on the market, which led to
a rapid expansion of the mining area, followed by a closure without a recovery plan.
Due to various European pressures, there has been a growing increase in legislation over the last
two decades, reinforcing the importance of a sustainable policy of environmental concern, aware of the
legacy that the mining has left over. In Portugal, the first survey of environmental inventories and
characterization of abandoned mines took place in 1994. This study concluded that abandoned mines
could be a risk factor for public health and safety, increasing with the time of abandonment (Santos
Oliveira et al., 2002). Although the environmental recovery in abandoned mining areas was already
covered in 1987 (Lei de Bases do Ambiente - Decreto de Lei n.o 11/87, of April 7) only in 2001, was
Page 21
Introduction
5
defined the regulation of concession of degraded mining areas environmental recovery (Decreto-Lei n.o
198-A/2001 of July 6).
The delay in the rehabilitation of abandoned mines is due in large part to the lack of clearly attributed
responsibilities, the absence of recovery criteria and standards for these mines, and the high cost of
rehabilitation which are applied to the mining companies (UNEP and COCHILCO, 2001). Still, many
abandoned mines no longer have owner or property rights, ending the responsibility on governments to
inventory and evaluate mine sites. Portugal has already invested more than 139 million euros for
remediation (Carvalho, 2017). Though efforts are being made to rehabilitation and reduce environmental
impacts, abandoned mines have been sites of metal persistence with unpredictable consequences for
living organisms including risks to human health.
1.2. Biological impact of heavy metals
Metals have been identified as toxic elements for almost all living organisms (WHO, 2007). Some
of them are elements that occur naturally in the earth's crust. However, anthropogenic activities like the
mining industry have contributed to the increased introduction of these metals into the environment.
Heavy metals constitute a very heterogeneous group of elements that vary widely in their chemical
properties as well as in biological functions (Raikwar et al., 2008). Many metals, such as iron (Fe),
copper (Cu), zinc (Zn), cobalt (Co), molybdenum (Mo) and manganese (Mn), are essential to living
organisms (Valavanidis and Vlachogianni, 2010). They play a critical role in the physiological functions
of plants and animals, in the constitution of some enzymes and various reactions of oxidation-reduction
(WHO, 1996). Despite this undeniable importance, they can be toxic when in high amounts. On the
other side, other metals are not required for metabolic activities (e.g., mercury (Hg), lead (Pb), nickel
(Ni), chromium (Cr), cadmium (Cd) and arsenic (As)) and even at low concentrations are toxic. This
metals may replace essential metals and interfere with the function of the associated enzymes and
cofactors (Valavanidis and Vlachogianni, 2010). These metals are persistent and non-metabolized in
other intermediate compounds, which leads to their accumulation in the food chain through uptake at
the primary producer level and consumption at the consumer level (Raikwar et al., 2008).
The heavy metals bioavailability in different terrestrial compartments depends on many factors:
total concentration and speciation of metals, mineralogy, pH, redox potential, temperature, total organic
content and suspended particle content, as well as their transport and removal (John and Leventhal,
1995). This bioavailability facilitates the entrance into the food chain, increasing their bioaccumulation.
The bioaccumulation will depend on the available amount of each metal in the environment and the way
of entry. The accumulation along the trophic chain may give rise to magnification.
The use of a biomonitor allows a holistic view of the negative impact that metals have on the
environment, allowing an analysis under real conditions, including a temporal and spatial component
given by the accumulation of environmental impacts throughout the life of the organism, something that
is not possible through direct chemical analysis of the environment. Exposure to toxicants in mining
areas induces morphological alterations, namely, fluctuating asymmetries, lower weight and less mass
in some internal organs in local animals (Nunes et al., 2001a, 2001b; Sánchez-Chardi et al., 2007). These
changes reflect the efficiency of the mechanisms in the control of the organism stability, possible due to
environmental disturbances (Nunes et al., 2001a, 2001b). Often, organisms exposed to high
concentrations of metals use different defense mechanisms, such as reducing consumption, increasing
Page 22
6
excretion and/or sequestration through the storage of metal-bound proteins, such as metallothionines
(Valavanidis and Vlachogianni, 2010).
One of the deleterious effects of metals is their ability to increase the formation of reactive oxygen
species (ROS) by inducing oxidative stress in animals (Sies, 1993). This imbalance caused by the
production of ROS (Prá et al., 2008), can at a molecular level, lead to situations of oxidative stress
(Belyaeva et al., 2012). The production of ROS can cause, for example, oxidative modification of
proteins, DNA damage repair inhibition like adducts forming on the nucleotide basis of the DNA
(Shugart et al., 2003) with following modification in tissue structure and chromosomal alterations
(Cooke et al., 2003). The occurrence of mutations may lead to degenerative diseases (Andersen, 2004)
carcinogenic and mutagenic processes (Raikwar et al., 2008), which may affect the fitness of natural
populations (Sánchez-Chardi et al., 2008). Namely, genotoxic insults can alter somatic or germ cells,
having direct implications to an individual or his offspring (Bickham, 2011). In both cases, these cell
changes may have demographic effects on the population, which may reduce the individuals' longevity,
differentiation of sexual proportions, reproductive success reduction, low viability or even infertility
(Bickham et al., 2000). In the environment, the elements often appear mixed, being necessary not only
to take into account their action individually but also the interaction of the elements.
However, not all chemical contaminants have a mutagenic effect; these are called non-genotoxicants
and are the focus of interest in Evolutionary Toxicology, since they do not interfere directly with
chromosome structures or alter DNA, but may have a genetic impact on populations. Non-genotoxicants
can modify the population demographics, leading to selection for particular traits that promote survival
and reproduction in contaminated environments (Bickham, 2011) alteration in migration rates or
bottlenecks (Berckmoes et al., 2005) leading to changes in genetic diversity. Environmental pollution
has, therefore, the potential to rapidly change the evolutionary history of wild populations of small
mammals.
Regarding human health, studies in populations near to abandoned mines have shown that there may
be adverse effects on people's health as loss of smell (anosmia), high levels of metals in blood, increased
respiratory problems and cases of cancer (Coelho et al., 2007; Kim et al., 2008). Abandoned mines with
no remediation plans can cause serious problems in the long term and may sometimes have more
significant impacts than active mines since it exposes populations to unpredictably heavy metal
concentrations over long periods. Studies developed in communities living near abandoned mines have
shown that these populations may be subject to high concentrations of heavy metals through feed or
water consumption (Ji et al., 2013; Kim et al., 2008). Although consumption may not occur directly
from contaminated sites, a magnification may take place along the trophic chain and may affect local
human populations, for example through hunting.
1.3. Small mammals as sentinels of heavy metal pollution
The usage of animals to assess and predict the effects of contaminants on the human population is
dated for more than a century ago. A classic example is the miner's canary used to warn the presence of
potentially lethal carbon monoxide concentrations in coal mines. In 1914, one of the first articles that
mention the use of birds and mice as good indicators of the existence of poisonous gas was published in
the Journal of Industrial and Engineering Chemistry (Reif, 2011). As these two examples illustrate, it
was soon realized that using animals as biological monitoring tools is advantageous. These biological
monitoring tools allow us: to know anthropogenic changes in nature; understand dynamic balance in
Page 23
Introduction
7
ecosystems; provide early warning of significant environmental changes; check the effectiveness of
established regulatory mechanisms; define critical pathways of pollutants for humans in the different
compartments of the earth; and integrate the physical and chemical effects in a biological context
(review by Wren, 1986).
The concept of sentinel can be easily confused with two other concepts: biomonitor and bioindicator.
According to O'Brien et al. (1993) bioindicators are organisms whose characters are used to indicate the
absence or presence of a particular contaminant in the environment; on the other hand, biomonitor is
when it is possible to measure the extent of this contamination to know health implications of other
species or the environment. Sentinel concept distances itself from this latter by the simple question of
being applied to man, since it allows evaluating the implications for human health and gives warnings
of these implications. Not all species fall into these categories. The sentinel animals have more selection
criteria, such as physiological characteristics similar to man´s (so that the biological and pathological
effects after exposure can be compared), as well as the same pathways (route of toxic exposure), through
ingestion and inhalation of contaminants (O’Brien et al., 1993). However, some criteria are common
among biomonitors and sentinels, such as:
to provide measurable responses (ideally including accumulation of tissue residues);
to reflect the population response;
to give a proportional response to the degree of contamination or degradation (through structural
changes appearance or physicochemical composition) (Holt and Miller, 2010);
to be common in the analysed areas (so that it is abundant and easy to capture);
to tolerate a certain level of contamination (Zakrzewska et al., 2010);
its ecology and life history has to be well known (Holt and Miller, 2010);
to have a long enough life span to demonstrate the effects of exposure over time and;
to have a good position in the food chain (O’Brien et al., 1993).
In this context, the majority of species used in terrestrial biomonitoring studies have been small
mammals. They are useful sentinels because they are in close contact with soil, water, and air pollutants,
their analysis represent a realistic approach of mixtures and concentrations of metal exposure (Tovar-
Sánchez et al., 2012), play a significant role in food chains (considered intermediates for metal transfer
to higher trophic levels) (Levengood and Heske, 2008), and since they are relatively common, they are
easily captured and distributed in both contaminated and uncontaminated reference sites (Talmage and
Walton, 1991).
Several studies have been carried out with small mammals documenting the accumulation of heavy
metals within individuals (Marques et al., 2008; Mussali-Galante et al., 2013b; Sánchez-Chardi et al.,
2013; Tovar-Sánchez et al., 2012). These studies provide information on availability within an
individual and to some extent the population, which may affect the entire community (Kendall et al.,
2001). The exposure to a particular contaminant can alter the composition of the community by, for
example, reducing the abundance of a species (Kendall et al., 2001). An adequate way of monitoring
the environmental quality is through the use of multiple species, mainly species occupying different
positions in the food chain. In Portugal and Spain, Algerian mouse (Mus spretus) and the greater white-
toothed shrew (Crocidura russula) (Figure 2) have been widely used as sentinels or biomonitors (Lopes
et al., 2002; Marques et al., 2008; Nunes et al., 2001a; Sánchez-Chardi et al., 2013, 2008, 2007; Tapisso
et al., 2009; Viegas-Crespo et al., 2003).
Page 24
8
Figure 2 Small mammals commonly used as sentinels: a) Mus spretus and b) Crocidura russula.
These two species differ in some ecological characteristics. Crocidura russula is a small
insectivore of the Soricidae family and is distributed throughout southern and western Europe and North
Africa, with remarkable genetic uniformity (Ramalhinho et al., 1999). This species lives in very diverse
environments, including lands adjacent to rivers, places with abundant undergrowth to open habitats.
The shrews have a peculiar breeding system of monogamy and female dispersal contrarily to polygamy,
and male dispersal observed in mammals (Balloux et al., 1998) and have about four litters from March
to September (Cantoni and Vogel, 1989). The spatial dispersion is small, presenting a significant
correlation between genetics and geographic distance (Balloux et al., 1998).
Mus spretus is an endemic rodent from the Mediterranean region belonging to the Muridae family.
It occurs in south-eastern Europe and North Africa, being found in pastures and cereal fields and
avoiding open areas. It shows two phases marked in the reproductive cycle, a period of sexual inactivity
in winter (November-January), and two phases of maximal activity in April-May and August-September
(Palomo et al., 2009). On average, there are about five pups, ranging from two to ten (Palomo et al.,
2009). Concerning spatial dispersion of males, it appears to be strongly related to the presence of other
species, with a mean range of 343 ± 95 m2 (Gray et al., 1998).
These two species occupy distinguished positions in the food chain. Mus spretus represents an
intermediate stage between trophic levels since this species is important in the diet of carnivorous birds
and mammals. Crocidura russula accounts for a high position in the food chain and has a high metabolic
rate, accumulating larger amounts of toxic pollutants (Talmage and Walton, 1991). Environmental
pressures can generate rapid changes in the evolutionary history of these species since it has short
generation times, which makes them good bioindicators of evolutionary toxicology studies.
1.4. Contaminant effects on natural populations.
Environmental contaminants can affect genetic systems at a variety of organizational levels.
Nevertheless, understanding the contaminant effects on natural population’s presents a high complexity
since different mechanisms can have similar answers and similar mechanisms can give different answers
(Van Straalen and Timmermans, 2002).
As described in the sub-chapter Biological impact of heavy metals, contaminants can be mutagenic,
called genotoxicants (causing direct damage to the DNA in somatic cells and potential heritable effects),
or non-genotoxicants. These latter, although not having a direct effect on the structures, can have an
indirect genetic impact in the population (Rose and Anderson, 2005). Heavy metals can affect
Page 25
Introduction
9
populations through somatic cell changes or heredity. In the latest case, this can occur by induced
mutations in the germ cells passing to offspring. This mutation may remain in the population even after
the removal of the contaminant, by selection or another process at the population level, increasing its
permanence due to the stress caused by the contaminated environment. Alterations at the somatic cells
level, can lead to change in the structural age of the population (Theodorakis et al., 2001); reduction of
longevity of individuals (Agarwal and Sohal, 1994; Harshman and Haberer, 2000); modification of the
size of individual (which may have implications for survival; behavior or fecundity) (Siegel et al., 1992);
or alteration of the population sex ratio (McDonald et al., 2014; Scheirs et al., 2006). These changes
may have ecological effects, resulting as in demographic changes (Bickham et al., 2000) (Figure 3).
These population changes are correlated with genetic and morphological variations in the population
(Frankham, 1996). It is expected that a decrease in population will have negative impacts on genetic and
morphological variation in the population. All these changes in the population structure cause indirect
genetic effects. Bickham (2011) based on concepts presented by Van Straalen and Timmermans (2002)
considers that there are four categories of population genetic responses to contaminant exposure: a)
genome-wide changes in diversity, b) changes in allelic or genotypic frequencies due to contaminant-
mediated selective pressure, c) changes in gene flow between populations, and (d) increased mutation
rates.
Page 26
10
Nongenotoxic/mixed
contaminants
Genotoxic contaminants
DNA damage
DNA repaired
Somatic mutations
(nonheritable)
Germline mutations
(heritable)
Deleterious mutations
Adults:
cancer/disease
Embryos larvae:
abnormal/death
Reproductive sucess
Population declines (i.e., decrease in abundance and
distribution, altered age class structure)
Genetic
diversity
Gamete, embryo, or
larval viability
Decrease in
fitness Altered gene
frequencies
Population
extincton
Collateral
consequences Genetic
adaptation
Selection: against
susceptible/for
resistant genotypes
Slightly
deleterious
mutations
Mutational load
Genetic
diversity
Individual-level consequences
Population-level consequences
Figure 3 Summary of how genotoxic and non-genotoxic contaminants may lead to population-level consequences. The up and down
arrows within the boxes suggest increase and decrease, respectively (adapted from Rose and Anderson, 2005).
Page 27
Introduction
11
These four categories are called the four cornerstones of Evolutionary Toxicology and are used to
explain the differences among populations driven by anthropogenic contaminants in the different studies
that have been performed (Figure 4).
Figure 4 The four cornerstones of Evolutionary Toxicology (adapted from Bickham, 2011).
The first cornerstone focuses on the genetic diversity conservation because this is proportional
to extinction probability (Bickham, 2011). Populations initially exposed to contaminants may suffer a
decrease in population size and may lead to loss of genetic variability through genetic drift (Bickham,
2011). This decrease will depend not only on the initial population size but also on the response time a
population will take to recover (Medina et al., 2007). This loss of genetic diversity due to anthropogenic
effects is called genetic erosion (Van Straalen and Timmermans, 2002). An increase in genetic
variability also may occur (Eeva et al., 2006) resulting from new mutations, migration or mixed
populations and diversifying selection (Theodorakis et al., 1997).
In the case of migration of several populations (gene flow between populations), these may
contribute to an increase of genetic variation, masking the genotoxic effect that may exist on the site
(Baker et al., 2001; Matson et al., 2006, 2000; Theodorakis et al., 2001). This phenomenon occurs
mainly in sites where the polluted area appears to have all the habitable conditions, but the animals that
lived there fail to reproduce or survive. Migrants maintain the number of inhabitants from other places
(Matson et al., 2006) i.e., the increase of genetic diversity results from the increase of gene flow from
neighboring populations. These areas are called ecological sinks.
The immigrants from neighboring areas play an important role in maintaining the population
gene pool, especially after a bottleneck. The emergent population will result not only from immigrant
individuals but also from individuals that survived polluted environments due to favorable genotypes in
degraded areas. This selective pressure mediated by contaminants conduces to changes in the genetic or
allelic frequency of populations (Bickham and Smolen, 1994).
Populations continuously exposed to contaminants can, in turn, develop a certain tolerance.
There has been an inherited genetic selection that leads to evolutionary processes on a small scale, called
micro-evolution. This micro-evolution occur rapidly in a few years or a few generations, involving a set
of morphological and physiological characteristics that may have implications for the populations, their
ecological response capacity and the global participation of the ecosystem, thus having an associated
Non-genotoxicants Genotoxicants
Reduced reproductive sucess Direct alteration of DNA
Selection at survivorship loci
Alteration of gene flow and dispersal patterns
Genome-wide changes in genetic diversity
Increased mutation rates
Exposure
Page 28
12
ecological cost (Medina et al., 2007). In some cases, stress-induced variation may play a crucial role in
the divergence of species (Badyaev and Foresman, 2000).
In addition to changes in genetic diversity with phenotypic implications, stress environments
can cause development instability during the ontogeny of the individual (Eeva et al., 2000; Nunes et al.,
2001a; Parsons, 1990; Sánchez-Chardi et al., 2013), giving rise to small deviations of the symmetry.
These asymmetries may have an indirect effect on the population, for example, through mate choice
decisions (females assess the genetic quality of potential mates by symmetry, opting for symmetric
individuals) (Moller and Pomiankowski, 1993; Morris, 1998) or mating success (the asymmetry can
lead to its infeasibility) (Blanckenhorn et al., 1998).
The studies of the effects of contaminants on natural populations are complex, and although
several studies have been conducted on wild populations, the understanding of evolutionary responses
in wildlife due to exposure is limited (Bickham, 2011).
This complexity is due to the numerous factors associated with the contaminants (such as species
susceptibility, the degree of disturbance or ecosystem), as well as the possibility of the change of the
genetic pattern due to natural processes. The interpretation of results from evolutionary toxicology
studies should be viewed very carefully, to exclude the possibility of the historical event having caused
the observed genetic patterns (Meeks et al., 2009). Therefore, it is important to consider a set of
biomarkers at different organizational levels to have a holistic view of the problem.
1.5. Biomarkers
1.5.1. Genetic biomarkers
Several biomarkers allow us to characterize the health of individuals in toxicological terms, knowing
their exposure, effect, and susceptibility to the presence of heavy metals in abandoned mines. Genetic
alteration resulting from genotoxic exposure may lead to the formation of adducts (modified base pair),
inversions, deletions or additions, excess micronuclei and mitotic aberrations, DNA strand rupture, and
chromosomal rearrangement (Medina et al., 2007). However, these biomarkers are focused on
physiological and genetically mediated changes in tolerance at the individual level only (Figure 5)
(Medina et al., 2007). In the case of a population or community, the point of interest increases with
chronic exposures at low concentrations to a mixture of chemical agents (Depledge, 1994).
This change leads to the need of using specific biomarkers at each level of biological organization.
Specific biomarkers become increasingly complex as we move up in the organization (e.g., from
population to the ecosystem), increasing the time scale and ecological importance (Mussali-Galante et
al., 2013a). These should be chosen to reflect the changes in the fitness of an organism (e.g., premature
death, ability to mate, fecundity and the viability of offspring) since there are changes that affect the
population (Evenden and Depledge, 1997). In this context there are two reasons why the study of DNA
repair and damage are important: firstly because DNA is the fundamental unit of heredity and
reproduction, and therefore disturbances in structure and functions can lead to changes in population
dynamics or demographics; and secondly because the effects may be more refractory than at the
individual level, since due to genetic diversity the return to the pre-contamination point may take several
generations (Bickham and Smolen, 1994). Mitochondrial DNA is more vulnerable than nuclear DNA in
some genotoxic environments. This feature has been explained by its physical location since the mtDNA
Page 29
Introduction
13
nucleoids are anchored to the side of the internal membrane matrix, which is close to the respiratory
chain (electron transport chain) that generates a significant amount of ROS and due to its reduced DNA
repair capacity (Meyer et al., 2013). The mtDNA is a target for oxidative damage which, once damaged,
can amplify oxidative stress by increasing the expression of proteins essential for the respiratory chain,
becoming a vicious cycle (Van Houten et al., 2006). In studies of phylogenetic relationships, mtDNA is
often used in detriment of nuclear DNA because it does not undergo meiotic recombination (not being
"shuffled" during the production of the gametes as are nuclear genes), have a slower degradation than
nuclear DNA (advantageous in case of degraded or old samples), and presents a higher rate of mutation
compared to nuclear DNA (Arif and Khan, 2009). Also, mtDNA allows a view of the regional patterning
since its maternal, haploid mode of inheritance exposes it to only a one-quarter of the gene flow
(Bickham et al., 2000).
Figure 5 Effect of environmental pollutants on all biological organization levels and the most used biomarkers at each
organizational level (adapted from Mussali-Galante et al., 2013a).
The choice of the markers is an important factor in the analysis of the genetic diversity of the
populations since not all markers are subject to the same selective pressure.
1.5.1.1. Cytochrome b and the Control Region
Taking into account genetic ecotoxicology studies already performed (Baker et al., 2001; Eeva
et al., 2006; Giska et al., 2015; Matson et al., 2006; Theodorakis et al., 2001), two mitochondrial markers
were chosen for the present study, Cytochrome b (Cytb) and the Control Region (CR).
Cytochrome b is an enzyme component of respiratory chain complex III, and, within this complex,
it is the only component encoded from the mitochondrial genome (Dumoulin et al., 1996; Irwin et al.,
Metal concentration in biological samples
Cellular and molecular effects
Individual effects
Population effects
Community effects
Ecosystem effects
Biomarkers of exposure
Biomarkers of effect
Biomarkers of susceptibility
Ecological indicators
Evolutionary effects
-DNA adducts -Oxidative damage - Metallothionein induction
-DNA breaks -MN, CA -Alterations in DNA
repair enzymes
-SNP s -Metabolism enzyme
induction -Different DNA
repair capacity -Risk of disease -Cancer -Aging -Chronic diseases -Decreased longevity -Decreased fertility
and fecundity
-Sex proportion
alterations -Age structure
alterations -Low reproductive
success -Inbreeding -Genetic diversity
alterations -Low fitness -Population declines
-Shifts in
diversity and
species richness -Change in
dominant species -Change in
species
composition
Biodiversity loss
-Alterations
in energy and nutrient
cycles -Food web
alterations
Early warning to individual health Early warning from population to ecosystem health
Environmental metal exposure
Page 30
14
1991). It is responsible for the transmembrane electron transfer by which redox energy is converted into
a proton motive force (Degli Esposti et al., 1993). Beyond playing an important role in the electron
transport chain, its molecular evolution is well understood in mammals (Irwin et al., 1991) and it is a
protein coding gene which evolves at an intermediate rate when compared to the Control region (Baker
et al., 1999). In the case of the Control region, it exhibits high levels of variation compared to a coding
protein, because of the reduced functional constraints and the relaxed selection pressure, with an
extremely rapid rate of evolution. Functioning as a neutral locus, it is expected to be sensitive primarily
to historical factors such as population bottlenecks (Bickham and Smolen, 1994). In terms of structure,
it has a similar structure in all organisms, divided into three domains: a central conserved domain
(implicated in formation of D-loop and the regulation of H-strand replication) surrounded by two
variable domains, left domain adjacent to the Pro-tRNA gene (R1) which contain ETAS (extended
termination-associated sequences) and a right domain adjacent to the Phe-tRNA gene (R2) which
contain CSBs (conserved sequence blocks that play the major role in the regulation of the replication
process of DNA) (Fumagalli et al., 1996). A study performed by Sbisà et al. (1997) with ten different
mammalian orders identified that in all the organisms considered in the study, events of repeats
sequences occur in one of the domains (ETAS or CBS domain). In Crocidura russula these tandemly
repeated sequences can occur in both domains, which makes the mtDNA control region size variable,
even between individuals (Fumagalli et al., 1996).
1.5.2. Morphological variation
Morphological variations are changes that can occur directly from genetic changes or epigenetic
effects in the process of development or growth of the organism (considering epigenetic effects
developmental interactions among cells, tissues and their environments) (Young and Badyaev, 2007).
A variety of biological processes can produce differences in form between individuals or their parts,
whether by disease, adaptation to local geographic factors, long-term evolutionary diversification or
different responses to the same selective pressures (or differences in the selective pressures themselves)
(Zelditch et al., 2004)
These morphological variations are characterized and quantified by a biological discipline called
Morphometry which has undergone a revolution over the last decades. Between the 60's and 80's, the
data were obtained through sets of direct measurements of traits, so-called Classical Morphometry.
Through the implementation of several statistical tools for shape analysis, Morphometry was reinvented
by appearing the Geometric Morphometry.
In the geometric morphometric analysis, the form of an organism and the morphological structure
is represented by landmarks, discrete anatomical points that are arguably homologous in all individuals
in the analysis (Zelditch et al., 2004). The shape variation is analysed by the displacement of these
landmarks which can be represented in both 2D and 3D, and it is classified into different categories
according to anatomical and geometric criteria (Bookstein, 1991). The form is the combination of shape
and size, in which the size is the structure scale and the shape the geometric information which allows
recognizing of the structure (Bookstein, 1991) i.e., geometric properties except for its size, position, and
orientation (Klingenberg, 2010).
Although shape and size are analysed separately, this does not mean that they cannot depend on
each other. The dependence of the shape on size is called allometry (Klingenberg, 2016), and is an
Page 31
Introduction
15
important relation to take into account in the analysis of the shape since the changes observed in shape
can be only due to size.
Most animals are symmetric and bilateral, i.e., when divided into two sides of a plane or axes they
present the two parts with an equivalent property of size and shape, in which the left and the right sides
are the mirror image of each other. This type of symmetry is so-called matching symmetry (an example
is the mandible of a rodent) (Klingenberg, 2015). The other type of symmetry is called object symmetry
and is when the object is symmetric in itself, the axis or plane of symmetry runs through the structure,
such as the cranium. In symmetrical structures, it is to be expected that both sides of the structure are
identical. However, this is not always the case and deviations from perfect symmetry may arise. These
deviations may be measured as variances (or related measures of dispersion) of linear dimensions, shape
variation involving landmarks, or as continuous symmetry measures (Graham et al., 2010). Three types
of asymmetry have been distinguished according to the distribution of left–right differences in a
population (Klingenberg, 2015; Palmer and Strobeck, 1986; Van Valen, 1962): directional asymmetry
(DS), fluctuating asymmetry (FA), and antisymmetry (AS) (Figure 6).
Directional asymmetry is a tendency for a trait to be consistently different between the left and right
side and can be quantified by the difference between left and right averages differing from zero (Graham
et al., 2010; Klingenberg, 2015). This type of asymmetry is observed in the internal organs of most
bilateral animals and is defined under genetic control. Robust statistical methods are needed to identify
this asymmetry.
Antisymmetry is a pattern of asymmetry where most individuals are “left-sided” or “right-sided”,
which may result in a bimodal or platykurtic distribution due to the mixture of random left- and right
individuals (Graham et al., 2010; Klingenberg, 2015). The biological interpretation of AS has been
debated, attributed both to hereditary characteristics (Graham et al., 1993) and as a response to stress
(Graham et al., 2010). Nevertheless, a work by McKenzie and Clarke (1988) observed antisymmetry in
Lucilia cuprina, during the evolution of the flies' resistance to Diazanon, leading some authors to
consider that AS may appear as an evolutionary manifestation (Graham et al., 1993; Palmer, 1996).
Some registered AS are morphological manifestations of a particular type of behavior, such as in
Octopus vulgaris (Byrne et al., 2004) and Sepia lycidas (Lucky et al., 2012) in which the way they attack
their prey shows a differentiation between individuals in the lateral asymmetry of the eye.
Figure 6 Frequency distribution (f) of left - right differences for three types of asymmetry a) fluctuating asymmetry, b)
directional asymmetry and c) antisymmetry (modified from Klingenberg, 2015). In the X-axis, “0” means perfect symmetry.
The last type of asymmetry is FA. Fluctuating asymmetry refers to small differences between
the left and right sides due to random imprecisions in developmental processes. These perturbations are
a consequence of the stochastic nature of cellular processes (Klingenberg, 2003). This type of
Page 32
16
asymmetry usually is associated with a bell-shaped distribution of left–right differences, commonly
accepted as a normal distribution. The study of normality distribution and kurtosis test is usually done
to distinguish this type of asymmetry from the others. Several studies have used fluctuating asymmetry
as a biomarker of instability in development (Crocidura russula -(Sánchez-Chardi et al., 2013);
Apodemos agrarius –(Velickovic, 2007, 2004); Apodemus flavicollis –(Blagojević and Vujošević,
2004); Mus spretus- (Nunes et al., 2001a; Yalkovskaya et al., 2016)), since the left, and right sides of
the same organism share the same genome (Graham et al., 2010; Klingenberg, 2015). These studies
correlated these small variations with contaminated or stress environments, sometimes associated with
the negative fitness of an individual (Badyaev et al., 2000; Møller, 1997). Even though the relationship
between environmental stress and FA is not yet a clear process, it is possible that it may be associated
with the amount of energy available for buffering or regulation of developmental processes (Graham et
al., 1993; Mitton, 1993). The increase of FA is sometimes associated with bone reduction, which is
consistent with the energetic explication between stress and FA (Nunes et al., 2001a; Siegel et al., 1992).
Nonetheless, although results may differ with species, combinations of specific stressors, level and
duration of pollution, and morphological characters, FA is considered a suitable indicator of
environmental-induced developmental instability (Beasley et al., 2013). Fluctuating asymmetry has
been used as an individual marker of exposure to stress induced by contaminants during the
developmental period (Badyaev et al., 2000).
1.5.2.1. The mouse mandible
The mandible of Mus spretus was chosen in the present study to assess the morphological effects
of heavy metal contaminants. The mouse mandible is a complex structure, composed by multiples parts
that have different origins, rates of differentiation, composition, and function. It is composed of four
morphogenetic regions, the ramus and three processes (condylar, angular and coronoid) (Figure 7)
(Atchley and Hall, 1991; Klingenberg and Navarro, 2012). Usually, it is grouped into two main modules
(alveolar region and ascending ramus) (Atchley et al., 1985; Cheverud et al., 1997, 1991; Klingenberg,
2003; Klingenberg et al., 2004). The alveolar region bears the teeth (that include the molar and incisor
alveolar), and the ascending ramus includes the three processes and the part that articulates with the
skull and which participates in the attachments of muscles. The mandible is composed of one bone and
has already been used previously in toxicology studies (Sánchez-Chardi et al., 2013; Yalkovskaya et al.,
2015). Because the mandible is a plane structure, it allows a 2D geometric morphometric analysis.
The mandible is a structure that presents plasticity, shaping as an active response to the various
interactions and feedbacks with its functional environment. This adaptation is due in large part to the
muscular activity that leads to an adjustment of the bone to its function (Renaud and Auffray, 2010;
Tanaka et al., 2007). Several studies have demonstrated that the consistency of the food can lead to
different mandible morphologies (Luca et al., 2003; Mavropoulos et al., 2005, 2004; Michaux et al.,
2007; Tanaka et al., 2007; Yamada and Kimmel, 1991). Morphological changes caused by the
environment can lead to adaptive functional changes that increase the biomechanical efficiency of food
processing in the result of a larger request (Anderson et al., 2014).
Page 33
Introduction
17
Figure 7 Mouse mandible with the four components: ramus and three processes. Two main modules: alveolar region and
ascending ramus (adapted from Atchley et al., 1985).
Since genetic variation is the basis of diversity and evolution (Medina et al., 2007), and that
morphological changes may be a biomechanical, ecological or genetic response to the degradation of
environmental quality, both types of biomarkers – genetic and morphometric- are useful tools to study
population responses to contaminants.
Page 34
18
1.6. Case study - Aljustrel and Preguiça mines
The Aljustrel Mine is located near the village of Aljustrel, in the district of Beja (Figure 8). It is
located in the Iberian Pyrite Belt (IPB), known for its richness in deposits of volcanogenic solid sulfides
(pyrites). These sulfide deposits of the IPB are associated with a volcano-sedimentary complex (CVS)
geological formation between the Devonian and the Carbonic (CMA, 2017). The IPB form the most of
the Portuguese Southern Zone (PSZ) of the Iberian segment of the Variscan belt (Carvalho et al., 1971).
This area as an extension of 250 km long and 30 to 60 km wide, covering part of Alentejo, Algarve, and
Andalusia (CMA, 2017, Carvalho et al., 1971).
Figure 8 Map of Portugal showing the location of the Aljustrel and Preguiça mines.
The mining area presents six pyrite deposits arranged along the CVS structure with about 6km,
distributed in two main alignments: Fetais, Estação e Algares, Moinho, São João and Gavião (Carvalho
et al., 1971).
The mines of the IPB have a long history, dating from the time of the Tartessos, Carthaginians
and later by the Romans (Carvalho et al., 1971). These mines are an example of environmental impact
due to long extension and duration of intense mining. Their continuous work for more than 3000 years
that has modified the landscape and caused increasing pollution (Tornos, 2006). Throughout its history,
it has presented some instability, much associated with the value of the pyrite in the market. In 1993 it
entered a period of suspension, having resumed activity in 2006, due to the concession change. In 2002
and 2003, Aljustrel mine presented a high degradation of the landscape with oxidized mine structures,
water with a reddish color and tons of mining tails, as showed in Figure 9A.
AMD is a particularly important problem in the Aljustrel mine because the ore exploited is mostly
sulfides, producing very acidic waters and the release of potentially toxic metals. This process is a
cyclical process that extends well beyond the life of mine exploration, silently acting in the environment.
Page 35
Introduction
19
The Preguiça mine is located in Serra da Preguiça, 17km from the City of Moura, belonging to
the district of Beja (Figure 8). It is located in Ossa-Morena Zone (OMZ), in Magnetitic – Zinciferous
Belt, contacting in the south with PSZ. OMZ is characterized by a marked paleogeographic
heterogeneity with pre-Cambrian, Cambrian, and Silurian formations ending with a late Devonian
period (Martins, 2013a).
The first miners registered in this area date from 1852 with emphasis on the concession of
Umbria Preguiça, which was recorded as a manifesto for iron, lead and other minerals. In 1911, four
concessions were registered and operated until 1915, in which, after the beginning of the First World
War, the work was suspended and abandoned in 1926. In 1964 and 1966 the mine was in full operation
with a production of 13,000t/year, the last year in which it was in operation, and is currently abandoned
(Martins, 2013b). Over the last decades, the vegetation has taken over the mine hiding scaring and tailing
existing in the mine (Figure 9B).
Figure 9 General appearance of the Preguiça and Aljustrel mine at 2002-2003. A) Aljustrel mine and B) Preguiça mine
(Marques, 2008).
Studies in the bodies of small mammals (Mus spretus and Crocidura russula) sampled in the
area showed a significant increase of metals in these animals in both the liver and kidneys when
compared to nearby reference sites (Marques, 2008; Sánchez-Chardi et al., 2007). In these sites, a
vascular endothelial damage, fibrosis, and cell infiltration marks in Mus spretus has also been observed
(Marques, 2008) as well as an increase in the number of pathological alterations with severity (necrosis,
apoptosis and cytoplasmic vacuolization in hepatic tissues) in Crocidura russula from Aljustrel mine
(Marques, 2008; Sánchez-Chardi et al., 2008).
In the case of genotoxicity tests, in Crocidura russula a correlation was found between the
frequency of micronuclei and the concentration of heavy metals, which may indicate a clastogenic effect
in hepatic tissues (Sánchez-Chardi et al., 2008). Also a GST activity decreased compared to the reference
site was observed (Marques, 2008; Sánchez-Chardi et al., 2008). The combination of these two results
may suggest that increased exposure to heavy metals over several generations will have given rise to
selective pressure leading to the selection of more metal-tolerant individuals adapted to low-quality
environments (Viegas-Crespo et al., 2003).
Though previous studies have warned of the environmental problem of abandoned mines, these
studies are at the individual level. Only knowledge at the level of higher biological organizations, such
as at the level of populations, allows a deeper insight into the real impact that heavy metal mines can
have on the health and quality of life of natural populations.
Page 37
21
2. THESIS CONTEXT AND OBJECTIVES
Page 39
Thesis context and objectives
23
2. Thesis context and objectives
This study follows previous works (Marques, 2008; Marques et al., 2008, 2007, Sánchez-Chardi et
al., 2008, 2007), performed in two distinct sentinels (Mus spretus and Crocidura russula) which were
living in two mines in southern Portugal, Preguiça and Aljutrel mine, in comparison with a reference
population (Moura). Since previous work have shown high concentrations of heavy metals in the
environment, animal tissues and changes at the molecular level, the present work intends to understand
the medium-long term effects that heavy metals can have on the individual and population levels,
through the study of genetic and morphological variations of populations. In addition to this main
objective, the present study intends:
To contribute to the growing of the number of studies on the long-medium term effects of
environmental pollution on wild populations of the terrestrial ecosystem, since the number is
limited.
To contribute to an understanding of the potential permanent effects that chronic exposure to
heavy metals may have on humans.
To be the first population study in genetic diversity of Mus spretus and Crocidura russula living
in a contaminated environment, as well as the first geometric morphometric study of the
mandible of Mus spretus.
Page 41
25
3. PAPER
Paper Quina, A.S., Durão, A.F., Mathias, M.L. - Geometric Morphometric and Genetic
Diversity analyses of two small mammal populations from heavy metal mines in Portugal
(manuscript in preparation)
Page 43
27
Geometric Morphometric and Genetic Diversity analyses of two small mammal
populations from heavy metal mines in Portugal
Quina*1, A.S., Durão*, A.F., Mathias, M.L.
Center for Environmental and Marine Studies (CESAM), Departamento de Biologia Animal, Faculdade
de Ciências da Universidade de Lisboa, Campo Grande, 1749-016 Lisboa, Portugal
* First co-authors; 1Corresponding author
Faculdade de Ciências, Universidade de Lisboa, Edifício C2, 3º Piso, Campo Grande, 1749-016 Lisboa,
Portugal.
Telephone: + 351 217500000
E-mail address: [email protected]
Page 44
28
ABSTRACT
The mining industry is one of the largest sources of anthropogenic environmental pollution. The use of
biomarkers and biomonitors is essential to detect, quantify and assess the effects of contaminants on
natural populations across different levels of biological organization. Few studies have addressed high
organizational levels, like the population level, such that the medium-long term impact of metal
pollution remains largely unknown. We addressed this question through a geometric morphometric and
genetic analyses of the populations of two sentinel mammalian species (Mus spretus and Crocidura
russula) living in two heavy metal polluted mines in Portugal (Aljustrel and Preguiça mines), that were
previously shown to harbour changes at the biochemical, histological and physiological levels. We
observe that both species have acquired alterations in the shape of the mandible and in the genetic
diversity of the gene Cytb and the mitochondrial control region. The mandibular shape from the animals
of the mines was morphologically more alike. In the Aljustrel mine, both species showed higher genetic
diversity in Cytb, while in the populations from Preguiça, the diversity of the two markers changed in
opposite directions, high genetic diversity in the control region, and low diversity in Cytb. These results
suggest that Aljustrel may have functioned as an ecological sink, and that in Preguiça a bottleneck may
have occurred in the recent past, possibly due to an increase in the mutational rate. We show that within
a relatively short time, pollution by heavy metals has altered normal homeostatic pathways and the
genetic structure of natural populations. Ecotoxicological studies such as this have the potential to assess
the impact of anthropogenic stress on the evolutionary history of natural populations, as well as to warn
of the importance in recovering abandoned mines.
Page 45
29
INTRODUCTION
Heavy metal mining is one of the most pollutant human activities to our natural environment.
During extraction and mineral processing, heavy metals are exposed at the earth surface and become
bioavailable to wild organisms. By generating acid or alkaline drainage, they pollute the neighbouring
water, soil, sediment, and organic materials (vegetation), and as metals are assimilated, all trophic levels
in a community become contaminated. At high internal concentrations essential metals become toxic,
whereas other metals, like mercury, lead, nickel, chromium, cadmium, and arsenic, are already toxic at
low concentrations. To organisms living in the surroundings of the polluted sites toxic effects can be
immediate, but the whole community and ecosystem functioning can change if the level and duration of
pollution is sustained. Alterations in a short period of time may involve physiological and morphological
traits as well as genetic changes. “Biomarkers” or “early-warning” signals may be used to detect and
quantify exposure to metals across different levels of biological organization (Mussali-Galante et al.,
2013a). For instance, animal behavior or growth parameters may be studied to measure individual
susceptibility to toxics, and used as evidence of the presence of alterations at lower biological levels
(e.g. cellular and physiological) (Clements, 2000). At higher levels of biological organization, such as
the population level, biomarkers measure shifts in population parameters like genetic diversity and
structure, or demographic declines (Mussali-Galante et al., 2013a).
Terrestrial vertebrates living in contaminated areas have been shown to bioaccumulate heavy
metals in their tissues (e.g. (Marques et al., 2008; Pereira et al., 2006; Sanchez-Chardi et al., 2007;
Sanchez-Chardi et al., 2009a; Viegas-Crespo et al., 2003)). The measure of toxicity levels in these
sentinel species provide a valuable insight into the health status of the entire ecosystem, and are thus
very helpful for human and environmental risk assessments. Because of their key importance in the food
chain (diversified food habits like herbivory, omnivory or insectivory, and serve as prey to other
animals), small mammals are particularly suitable as sentinels of ecosystem quality (da Silva et al., 2017;
Talmage and Walton, 1991). We have previously studied two of such small mammals, the Algerian
Mice (Mus spretus) and the Greater white-toothed shrew (Crocidura russula), living in the surroundings
of two heavy metal mines in Portugal. Compared to a nearby reference population, these animals carried
alterations at the biochemical (antioxidant enzyme activities, metallothionein levels), histological (liver
and kidneys) and physiological (morphological and haematological parameters) levels, including an
increase in micronuclei frequency (Marques, 2008; Marques et al., 2008; Marques et al., 2007; Sanchez-
Chardi et al., 2008; Sanchez-Chardi et al., 2007). Few studies have addressed small mammals at higher
levels of biological organization particularly in what concerns heavy metal pollution (Baker et al., 2001;
Berckmoes et al., 2005; Mikowska et al., 2014; Mussali-Galante et al., 2013b; Rakitin et al., 2016;
Sanchez-Chardi et al., 2013; Theodorakis et al., 2001; Wickliffe et al., 2002; Wickliffe et al., 2006),
such that the extent of the negative impacts of metal toxicity on small mammal populations remains
largely unknown. In theory, population persistence in a polluted site will depend on the individual
physiological resilience. In species with short generation times like Mus spretus and Crocidura russula
sensitive individuals will die or reproduce less efficiently resulting in population declines and
contaminant-induced selection of tolerant phenotypes. Environmental pollution has therefore the
potential to quickly change the evolutionary history of wild populations of small mammals.
To better understand the chronic effects of environmental pollution by heavy metals, we here
analysed at the population level the two previously studied sentinels Mus spretus and Crocidura russula
living in two heavy metal mines in Southern Portugal, the Aljustrel and the Preguiça mines. In doing so,
we intended to get a comprehensive portrayal, from biochemical to genetic, molecular to population, of
the impact of heavy metal pollution on biodiversity, using the same samples as before. The Aljustrel
Page 46
30
mine is located in the Iberian Pyrite Belt. This region contains large polymetallic sulphide deposits that
have been exploited since 3000 BC, by Phoenicians and Romans, and formally operational from 1867
to 1996. The Preguiça mine is located in the Magnetite-Zinc Belt of the Ossa-Morena zone in the Iberian
Peninsula, and laboured between 1911 and 1964, with main extractions of zinc and lead ores. Compared
with the nearby reference region, the natural environment within both mines is highly polluted, with
increased levels of zinc, arsenic and lead in the soil, and zinc and lead in plants (Marques, 2008). High
concentrations of manganese and copper, and of manganese, iron, and arsenic were also found,
respectively, in the soil and vegetation of Aljustrel (Marques, 2008; Marques et al., 2008). Since we
observed alterations in Mus spretus and Crocidura russula from these mines using biomarkers at lower
levels of biological organization (biochemical, physiological, individual), we now used biometric and
genetic markers to evaluate associated population effects. We searched for form perturbations in the
mandible of adult Mus spretus with a geometric morphometrics analysis. Population genetic changes in
Mus spretus and Crocidura russula were investigated using diversity parameters of two mitochondrial
markers that are under different selective pressures, the gene cytochrome b (Cytb) and the control region
(CR). Mitochondria are cellular organelles particularly vulnerable to the toxic effects of heavy metals
(Meyer et al., 2013), and mitochondrial markers have been used in genetic ecotoxicology studies before
(Andre et al., 2010; Baker et al., 2001; Eeva et al., 2006; Giska et al., 2015; Kim et al., 2003; Matson et
al., 2006; Theodorakis et al., 2001; Wickliffe et al., 2002; Wickliffe et al., 2006). With this study, we
provide, to our knowledge, the first population study on the genetic diversity of Mus spretus and
Crocidura russula living in heavy metal contaminated locations, as well as the first geometric
morphometric study of the mandible of Mus spretus.
Page 47
31
MATERIAL AND METHODS
1. Samples and Studied sites
All specimens of Mus spretus and Crocidura russula used in this study were sampled during
2002 and 2003, in the vicinity of two abandoned mines (Aljustrel and Preguiça) and of a reference
location (Moura), in Southern Portugal (Fig. 1). Previous studies had already shown that animals from
these mine sites had high body burdens of heavy metals (Marques et al., 2007; Sánchez-Chardi et al.,
2007, leading to alterations in enzymatic activities (Marques et al., 2008; Sanchez-Chardi et al., 2008),
and in haematological, histological and genotoxic parameters (Marques, 2008; Sánchez-Chardi et al.,
2007).
Fig. 1. Location of sampling sites: Aljustrel and Preguiça mines and the Reference site (Moura).
In 2002-2003, both Preguiça and Aljustrel mines were inactive. The Preguiça mine is located
approximately 20 km southeast from the reference location (see below), in Preguiça Mountain
(38°02′15″N; 07°17′01″W) in the Iberian Magnetic-Zinciferous Belt. This area was dominated by trees,
shrubs and herbaceous species at the time of sample collection. The Aljustrel mine is located
approximately 72 km southwest (37°53′08″N; 08°08′32″W) of the Reference site in the Iberian pyrite
belt, known for its pyrite deposits. Sampling was performed along “Água Forte” riverside, which is
characterized by its red color due to stored acidic effluents discharged during rainy periods. For
comparative purposes, a site with similar features to the mining surroundings, in terms of climate and
vegetation, and without known exogenous sources of heavy metals was selected, and referred hereafter
as the Reference site (Moura) (38°11′13″N; 07°24′34″W).
Page 48
32
2. Morphometric analyses
In the individual morphometric analysis only Mus spretus specimens were used since the short
number of available samples of Crocidura russula was inadequate to allow inter-site comparisons. The
right and left side of the mandible of 124 specimens of Mus spretus were analyzed: 48 from Aljustrel,
49 from Preguiça, and 25 from the Reference site. To reduce a source of bias from growth patterns, only
adult mice were used, classified according to the criteria established by Mira and Mathias (1996): weight
> 8g, body length >70mm, and with a brownish pelage. All specimens were cleaned by the simmering
method. The lingual views of right and left mandible were scanned with a scale in a HP Scanjet 4470c
Scanner (2400px, 24bit color) in the same conditions. Nineteen two-dimensional landmarks (LMS) were
digitized three times by the same person using tpsDig2 software v. 2.26 (Rohlf, 2010). To analyze the
form of the hemi-mandible, each set of landmarks was decomposed into size and shape, which were
studied separately. Size of hemi-mandibles were estimated from their centroid size, calculated as the
square root of the sum of squared distances of each landmark from their centroid (Bookstein, 1991). The
landmarks of the left hemi-mandible were mirrored, superimposed using generalized Procrustes fit and
projected onto the shape tangent space (Goodall, 1991; Klingenberg and McIntyre, 1998). In this way
the variation of size, position and orientation is removed, and the landmark coordinates of the
superimposed configurations (called Procrustes coordinates) were used for further multivariate analyzes
(Klingenberg et al., 2003).
2.1. Analyses of source of size and shape variation
Procrustes coordinates and centroid sizes were analyzed by means of multivariate statistics
methods: a Procrustes analysis of variance (ANOVA) and two-factorial ANOVA, respectively.
Individual and side were the random and fixed main effects and the Procrustes distance the dependent
variable (Palmer and Strobeck, 1986). The individual factor stands for individual variation (symmetric
component of variation), while the latter characterizes directional asymmetry (i.e. the average difference
between the left and right side of the mandible in the whole sample). The interaction between these two
factors (individual and side) represents the non-directional asymmetry (fluctuating asymmetry and
antisymmetry - asymmetric component of variation, i.e. the variation of differences between the left and
right mandible among individuals) (Klingenberg and McIntyre, 1998; Palmer, 1994). Measurement
error was quantified from residual variance between replicate components. Site and sex were additional
main effects in Procrustes ANOVAs. Since no statistically significant value was found for sex, all data
were pooled. Differences in size and shape were tested between sites for all mandibles. To study the
total shape variation, Procrustes ANOVAs were partitioned into symmetric (variation among
individuals) and asymmetric (variation within individuals) components (Klingenberg et al., 2002;
Klingenberg et al., 2003). To assess variations in shape in each functional module, the hemi-mandible
was divided into two subsets corresponding each to a mandibular module, the alveolar region and the
ascending ramus, composed of eleven and eight landmarks, respectively (Fig. 2).
Page 49
33
Landmark Description
1 Anterior most point on incisor alveolar (point of symphysis)
2 Posterior most point of symphysis
3 Minimum of depression of incisor ramus
4 Anterior most point of first-molar
5 Anterior most point of second-molar
6 Anterior most point of third-molar
7 Posterior most point of third-molar
8 Intersection of molar alveolar and base of coronoid process.
9 Dorsal-most point of coronoid process
10 Minimum of depression posterior of coronoid process – Mandibular notch
11 Anterior most point of condylar process at junction with the articular disc
12 Central most point of condylar process at junction with the articular disc (middle of articular disc)
13 Posterior most point of condylar process at junction with the articular disc
14 Anterior-most point along anterior edge of the mandibular foramen
15 Intermedium point between condylar and angular process
16 Posterior most point of angular process
17 Minimum of depression formed by angular process and incisor ramus
18 Posterior most tuberosity of insertion site of mandibular transverse muscle
19 Anterior most tuberosity of insertion site of mandibular transverse muscle
Fig. 2 Location and description of the 19 landmarks used in the geometric morphometric analysis in the right hemi-mandible
of Mus spretus (lingual view). The dash line divides the alveolar module of the ascending module.
2.2. Analyses of size and Allometry
Allometry is the dependence of shape on size and can potentially bias the analyses of shape.
Allometry was analysed through multivariate regression of both components, using the symmetric and
asymmetric component of shape onto symmetric and asymmetric log centroid size, respectively.
Statistical significance of regression was obtained through permutation tests with 10000 iterations
(p<0.01) under the null hypothesis of independence between size and shape (Klingenberg, 2011). Mean
centroid size and standard deviation were calculated among specimens of sites, for the entire mandible
and the two mandibular modules separately.
Page 50
34
2.3. Analyses of shape variation and Morphological distances
To explore mandible shape difference and assess morphological distance (in Mahalanobis
distance), a canonical variates analysis (CVA) for symmetric and asymmetric components was
performed. This analysis is intended to capture the amount of variation in one set of variables that is
accounted by the other set of variables along one or more axes. Mahalanobis distances were calculated
from size-corrected raw data between sites. Statistical difference was calculated by a permutation test
(10000 permutation rounds; p<0.01) (Klingenberg, 2011).
2.4. Fluctuating Asymmetry
When analyzing fluctuating asymmetry (FA), it is important to perform a preliminary analysis
to detect features that may confound the analysis of FA (Palmer, 1994; Palmer and Strobeck, 1986),
such as directional asymmetry (DA; a side of a bilateral character that is consistently larger than the
other) and antisymmetry (AS; a systematic deviation from symmetry) (Klingenberg, 2015; Palmer,
1994). To check if variation among individuals (FA and DA) was significant, parametric F-tests were
performed in Procrustes and two-factor ANOVAs. These three types of asymmetry can be distinguished
according to the distribution of left-right individual means of population (Graham et al., 2010;
Klingenberg, 2015). In fluctuating asymmetry, differences between left and right trait values (L-R) in a
population are randomly clustered around a mean of zero that represents perfect symmetry (Palmer,
1994). In directional asymmetry, the mean difference between traits values is not zero, and in
antisymmetry, a systematic deviation from symmetry results in a bimodal or platikurtic distribution
(large dispersion of data along the X axis, with thinner tails in comparison with normal distribution)
with a mean of zero (Graham et al., 2010). To check for the existence of antisymmetry, asymmetric
components of shape variation were inspected for signs of deviations from normal distribution using the
Kolmogorov-Smirnov test and kurtosis test. All sites revealed a bimodal distribution and significantly
negative values in kurtosis (see results), suggesting the existence of antisymmetry. Considering that one
of the factors that can influence the pattern and amount of FA is allometry (Klingenberg, 2015), it was
investigated if this antisymmetry came from the relation between size and shape. Since the allometric
results in the asymmetric component of shape revealed a great dependence on size (see results), a
distribution of the sum of the absolute residual values across the landmarks of the asymmetric
components was performed. Normality was tested with a Kolmogorov-Smirnov and a kurtosis test.
Since a normal distribution was found (see results), and the asymmetric direction was negligible (see
results), residual values were considered to correspond to shape FA. To detect shape FA divergences
among sites a one-way ANOVA was performed, where FA values were the dependent variable and sites
the fixed effects. For evaluating differences between sites, a Tukey´s Honestly Significant Difference
(HSD) was used in ANOVA procedures (Spjotvoll and Stoline, 1973). The Kolmogorov-Smirnov test
of normality, the kurtosis test and the Tukey’s HSD were performed using SPSS v.23.0 software (IBM
Corp, 2013). All the other analyzes were conducted with the geometric morphometric methods
implemented in MorphoJ v.1.06d.
3. Genetic analyses
3.1. DNA extraction, PCR amplification and Sequencing
A total of 63 Crocidura russula (25 from Aljustrel, 22 from Preguiça, and 16 from the Reference
site) and 75 Mus spretus (25 from each site) were studied. Total genomic DNA was extracted from the
tail using a commercial DNA extraction kit (E.Z.N.A. Tissue DNA kit, Omega Bio-Tek, Inc) following
Page 51
35
the manufacturer´s protocol. For Mus spretus, the mitochondrial Cytb gene was amplified using the
primer pair L14723 (Lecompte et al., 2002) and H15915 (Irwin et al., 1991), and the control region
using the primer pair L15774 (Shields and Kocher, 1991) and H2228 (Searle et al., 2009). The Cytb
gene of Crocidura russula was amplified using the primer pair L14727-SP and H-15915-SP (Jaarola
and Searle, 2002). All PCR reactions were performed with 12,5 µl Taq DNA Polymerase Master Mix
2X (2mM MgCl2) (VWR, Belgium), 0.1µM of each primer and 10-20ng of genomic DNA in a total
volume of 25 µl. Amplification conditions for Mus spretus were the following: pre-denaturation at 95°C
for 5 min (one cycle), 30 cycles of denaturation at 95°C for 1 min, annealing temperature at 61°C (Cytb)
or 64°C (control region) for 1 min, and extension at 72°C for 1 min, plus a final extension at 72°C for
10 min. Amplification of Crocidura russula Cytb was performed with the following conditions: 95°C
for 5 min (one cycle), 35 cycles of 95°C for 1 min, 62°C for 1 min and 72°C for 1 min, and a final
extension at 72°C for 10 min. PCR products were purified by enzymatic clean-up (Exonuclease I and
FastAP Thermosensitive Alkaline Phosphatase (Termo Scientific, USA)), followed by sequencing in
the forward direction by STABVIDA (Almada, Portugal), or in both directions whenever ambiguous
positions were found. Sequences were aligned using the Clustal W algorithm (Thompson et al., 1994),
revised and edit manually in Bioedit Sequence Alignment Editor 7.2.5 (Hall, 1999), and trimmed to a
final length of 1038bp (Cytb) and 824bp (control region). To discard amplification of nuclear
pseudogenes, the Cytb sequence was translated to protein using the vertebrate mitochondrial code in
MEGA v.6 (Tamura et al., 2013), and checked for premature stop codons, as well as compared against
published sequences from GenBank. Shared sequences were collapsed into haplotypes using the
program DNAcollapser (Villesen, 2007).
The control region of Crocidura russula is found to vary in size, even within one individual
(length heteroplasmy), because of variation in the number of repeat motifs in tandem repeat sequences
that are present in the left (R1) and right domains (R2) (Fumagalli et al., 1996). To count the number of
heteroplasmic and homoplasmic individuals in each population, a region in the control region that
includes the R1 domain was amplified using the primer L15774 (Shields and Kocher, 1991) and a
designed reverse primer CR_REV (5´-AAC TAC TTC GGC CCC CAT AG-3´). Amplification was
performed as follows: 95°C for 5 min (one cycle), 20 cycles of 95°C for 1 min, 56°C for 1 min and 72°C
for 1 min, followed by 12 cycles of 95°C for 1 min, 50°C for 1 min and 72°C for 1 min, plus a final
extension at 72°C for 10 min. Absence or presence of multiple-sized PCR products per individual
(homoplasmic and heteroplasmic individuals, respectively) was checked on standard 1% agarose gel
electrophoresis. Banding pattern per individual was confirmed by altering amplification conditions.
Number of amplified bands varied from 1 to 5, with band modal size of approximately 1200bp. Target
amplification was attested by sequencing a subset of PCR products in both directions, followed by
comparison with GenBank published sequences.
3.2. Data analysis - Genetic diversity and Population structure
Nucleotide () and haplotype (Hd) diversities, numbers of haplotypes (h), variable sites and
synonymous and nonsynonymous substitutions were determined with DnaSP v.5.10.01 (Librado and
Rozas, 2009). The distribution of pairwise differences for each population (mismatch distributions) were
calculated in Arlequin v.3.5.2.2 (Excoffier and Lischer, 2010), and used to statistically test differences
in nucleotide diversity values between populations with Mann-Whitney U Test (with continuity
correction) using SPSS v.23.0. Differences in haplotype diversity values between populations were
tested with a chi-square test in DnaSP v.5.10.01. For all tests, statistically significant values were
considered for p<0.05. Analysis of molecular variance (AMOVA) was used to assess genetic
differentiation among (ST) and between (pairwise φST) populations in Arlequin v.3.5.2.2. Statistical
Page 52
36
differences were tested with a permutation test (10000 permutations; p < 0.05) in the same software.
Haplotype network trees were constructed in Network v.5.0.0.0 (Bandelt et al., 1999), using the median-
joining method. Fasta files were converted into nexus format in Concatenator v.1.1.0 (Pina-Martins and
Paulo, 2008). Frequencies of individuals with specific haplotypes and with heteroplasmy were compared
between populations with a chi-square test (p<0.05) using SPSS v.23.0.
Page 53
37
RESULTS
1. Geometric Morphometric Analysis – Mus spretus mandible
1.1. Sources of size and shape variation and Analyses of size
As shown in Tables 1 and 2, Procrustes analysis of variance (ANOVA) and two-factors ANOVA
conducted on the entire sample revealed a significant effect of the individual, side (directional
asymmetry) and their interaction (non-directional asymmetry) in mandible size and shape. A significant
difference between sites was found in mandible shape but not in size. Since variation between replicates
was significantly exceeded by variation of non-directional asymmetry, the variation due to measurement
error was taken as negligible. The centroid sizes (mean ± standard deviation) of the whole mandible and
modules from animals of each site are shown in Table 3.
Table 1 Procrustes ANOVA conducted on the entire sample to evaluate the influence of measurement error on shape data.
Effect Shape
SS df Ms F P Pillai tr P
Individual 0.827 4046 2.045 x 10⁻⁴ 2.77 <0.0001 25.29 <0.0001
Side 0.047 34 1.372 x 10⁻³ 18.61 <0.0001 0.86 <0.0001
Individual x Side 0.303 4114 7.372 x 10⁻⁵ 14.43 <0.0001 20.56 <0.0001
Site 0.044 68 6.430 x 10⁻⁴ 3.15 <0.0001 1.21 <0.0001
Measurement error 0.085 16592 5.110 x 10⁻⁶
SS, sum of squares; df, degree of freedom; MS, mean squares; F, F statistic; P-value; Pillai tr, Pillai´s trace
Table 2 Two-factor ANOVA conducted on the entire sample to evaluate the influence of measurement error on size data.
Effect Size
SS df Ms F P
Individual 330.846 119 2.780 9.12 <0.0001
Side 2.333 1 2.333 7.66 0.0065
Individual x Side 36.871 121 0.305 13.59 <0.0001
Site 8.956 2 4.478 1.65 0.204
Measurement error 10.94 488 0.022
SS, sum of squares; df, degree of freedom; MS, mean squares; F, F statistic; p-value
Table 3 Symmetric centroid size (mean ± standard deviation) of the whole mandible of Mus spretus and of the two mandibular
modules, in each sampling site.
Sites Centroid Size (mm)
Whole mandible Alveolar region Ascending ramus
Aljustrel 18.53 ± 0.043 8.83 ± 0.016 6.38 ± 0.019
Preguiça 18.72 ± 0.042 8.85 ± 0.016 6.45 ± 0.019
Reference site 18.79 ± 0.059 8.95 ± 0.022 6.50 ± 0.026
Page 54
38
1.2. Symmetric component
A significant dependence of the symmetric component of shape on size (allometry) was detected
in all sites (6.93%; p<0.0001), in which Aljustrel displayed the highest percentage of allometry
(10.01%). The CVA performed in size-corrected data of the entire sample set showed a marked
separation between mines sites (Aljustrel and Preguiça) and the Reference site along the axis of the first
canonical vector (CV1), which explained 72.69% of total mandible shape variation (Fig. 3). This
variation was mainly due to the shape differences in the ascending ramus, in the condylar process.
Variation in the second canonical vector (CV2) showed a separation between mines mainly due to shape
differences in the condylar and angular processes. The CVA performed on the two separate modules
showed the same separation of sites along the CV1 and the CV2 axes (Fig. 4 and 5), with the CV1 axis
explaining 72.46% and 57.05% of shape variation in the ascending ramus and alveolar region,
respectively. Table 4 shows the values of the Mahalanobis distances between sites of the entire sample
set. Significant Mahalanobis distances for the whole mandible and for each module were found
(p<0.0001), indicating that significant differences among individuals exist in mandible shape. The
shortest distance was detected between Aljustrel and Preguiça, while the longest distance was obtained
between Preguiça and the Reference site. These results show that animals from mine sites present a more
similar shape variation between each other than between Preguiça and the Reference site, which
although geographically closer, have more dissimilar populations in terms of variation in the mandibular
shape.
Fig. 3 Plot of the canonical variate 1 (CV1) and 2 (CV2) of symmetric component (A-Aljustrel, R-Reference site, P-Preguiça).
Diagrams of shape changes associated with the extreme values of CV1 and CV2 are shown magnified three times.
Page 55
39
Fig. 4 Plot of the canonical variate 1 (CV1) and 2 (CV2) of symmetric component of ascending ramus (A-Aljustrel, R-Reference
site, P-Preguiça). Diagrams of shape changes associated with the extreme values of CV1 and CV2 are shown magnified two
times.
Fig. 5 Plot of the canonical variate 1 (CV1) and 2 (CV2) of symmetric component of alveolar region (A-Aljustrel, R-Reference
site, P-Preguiça). Diagrams of shape changes associated with the extreme values of CV1 and CV2 are shown magnified two
times.
Page 56
40
Table 4 Mahalanobis distances between sites using size-corrected data obtained in the canonical variate analysis of symmetric
and asymmetric components.
Sites
Mahalanobis distance
Whole mandible Alveolar region Ascending ramus
Symmetric Asymmetric Symmetric Asymmetric Symmetric Asymmetric
Reference site vs Aljustrel 3.69* 2.29* 2.19* 1.65* 1.61* 0.78
Reference site vs Preguiça 4.21* 2.34* 2.24* 1.81* 2.04* 0.89
Aljustrel vs Preguiça 2.26* 1.54** 1.63* 1.07*** 1.20* 0.71
*p < 0.0001; ** p < 0.001; ***p < 0.05
1.3. Asymmetric component
A significant dependence of the asymmetric component of shape on size was detected in all sites
(43.27%; p<0.0001), in which Preguiça registered the highest percentage of allometry (47.51%). The
CVA conducted in the asymmetric component from the entire sample set revealed that the CV1
explained 62.2% of shape variation. As with the symmetric component, separation between mines and
the Reference site was explained along the CV1 axis. This separation was also observed in the alveolar
region (CV1: 67.81%). The CVA conducted in the ascending ramus did not show a clear distinction
between sites (CV1: 58.5%). Significant Mahalanobis distances for the whole mandible were found
(p<0.001), indicating significant shape differences within individuals. The shortest distance was again
detected between Aljustrel and Preguiça, and the longest distance between Preguiça and the Reference
site. This indicates that mandibular shape varies in a more resembling way within individuals of the
mines, a characteristic likely linked to environmental degradation or to the lower quality of food found
in mines.
1.4. Antisymmetry and Fluctuating Asymmetry
All sites revealed a non-normal distribution (0.227 < K-s-d < 0.294; p>0.05) and negative
kurtosis values (-1.285 < Kurtosis < -1.840). This indicates that the mandible showed antisymmetry
(suggested by the bimodal and platykurtic distribution), i.e. specimens of Mus spretus from all three
sites had consistently the left mandible larger than the right mandible or vice versa. The distribution of
the sum of the absolute residual values across the landmarks, performed to investigate if this
antisymmetry came from allometry, showed no significant values of Kolmogorov-Smirnov for
normality (K-s-d = 0.108; p>0.15), as well as positive values of kurtosis (Kurtosis = 2.631;
std.err.kurtosis = 0.435) with a mesokurtic distribution, suggesting that antisymmetry is due to size.
Since the variation of non-directional asymmetry was much greater than the variation due to directional
variation (Table 1 – Procrustes ANOVA), we considered that this was negligible. The Turkey´s HSD
test indicated that shape FA values did not differ significantly between sites (Fig. 6).
Page 57
41
Fig. 6 Variation of Shape FA between sampling sites.
2. Population genetic analysis – Mus spretus and Crocidura russula
2.1. Cytb gene
The amplified Cytb sequence was 1038bp in size both in Mus spretus and Crocidura russula
(sequence data have been deposited in GenBank with accession numbers XXXX-XXXX). A total of 26
Cytb haplotypes were found in Mus spretus: 14 in the Reference site, 12 in Aljustrel and 10 in Preguiça
(Table 5). Three haplotypes were common to all sites: haplotypes 1, 2 and 3. The most frequent
haplotype (haplotype 2) is identical to an already published haplotype (Accession number JX457726)
and was found in individuals captured in northern Portugal and southern Spain (Barbosa et al., 2013).
This haplotype is therefore apparently widespread in the Iberian Peninsula and may be an ancestral
haplotype in this species. Most individuals in Preguiça (72%) had haplotypes shared with individuals
from Aljustrel and the Reference site, while in these populations, sharing was observed in 60% and 56%
individuals, respectively. The Reference site had the highest number of polymorphic sites (18), while
Preguiça had the lowest (14) (Table 6). Among the three populations, Preguiça also had the lowest
number of singleton and private sites (35% and 29% of the variable sites, respectively). A haplotype
network using the median-joining approach revealed a star-like pattern for haplotypes from Preguiça
and the Reference site, where most haplotypes are connected to haplotype 2 (Fig. 7A). In Aljustrel this
pattern is not apparent, since haplotypes were connected to four major haplotypes (15, 1, 2, 18).
Population diversity values are presented in Table 5 and Fig. 8. Both haplotype and nucleotide diversities
were the lowest in Preguiça. In Aljustrel, nucleotide diversity was also lower when compared to the
Reference site, but haplotype diversity was higher, reflecting the more heterogeneous distribution of
individuals among haplotypes as already suggested by the network tree. The distribution of haplotypes
among the three populations was statistically significantly different between Aljustrel and the other two
populations (chi-squared test; p<0.05). The distribution of the pairwise differences (mismatch
distribution) in the population of the Reference site differed significantly from that of Preguiça (Mann-
Whitney U test; p<0.05) (Fig. 9). The analysis of molecular variance (AMOVA) revealed no genetic
structure for Mus spretus, indicating that the global source of genetic variation is within and not among
groups (Table 7). This analysis revealed little genetic differentiation among the three populations of Mus
spretus (ST=0.0338), likely reflecting the high dispersion capacity of this species (Gray et al., 1998)
and the geographic proximity between locations. Nonetheless, pairwise ST comparisons showed that
the Aljustrel population was differentiated from Preguiça and the Reference site (Table 8), which were
more genetically similar with each other is spite of the lower genetic variability found in Preguiça.
Page 58
42
Table 5 Distribution of haplotypes, number of haplotypes (h) and Diversity indices (Hd and ) for the Cytb gene of Mus spretus from the three sampling sites.
Population Haplotype
h Diversity indices
1 2 3 4 5 6 7 8 9 10 11 12 13 14 15 16 17 18 19 20 21 22 23 24 25 26 Hd ± s.d. π ± s.d
Reference site 1 9 2 1 1 1 2 2 1 1 1 1 1 1 - - - - - - - - - - - - 14 0.870 ± 0.061 0.0024 ± 0.0015
Aljustrel 4 3 1 - - - - - - - - - - - 5 2 1 3 1 2 1 1 1 - - - 12 0.920 ± 0.029 0.0022 ± 0.0014
Preguiça 1 9 1 3 1 - - - - - - - - - 2 1 - - - - - - - 2 2 3 10 0.850 ± 0.057 0.0021 ± 0.0013
Total 6 21 4 4 2 1 2 2 1 1 1 1 1 1 7 3 1 3 1 2 1 1 1 2 2 3
Hd ± s.d. haplotype diversity ± standard deviation; π ± s.d. nucleotide diversity ± standard deviation
Table 6 Sequence diversity values for the Cytb gene and the Control region of Mus spretus and the Cytb gene of Crocidura russula from each sampling site. A - Aljustrel, P - Preguiça, R -
Reference site.
Sequence diversity
Mus spretus Crocidura russula
Cytb Control region Cytb
A P R A P R A P R
No. of variable sites 15 14 18 9 18 9 16 9 12
No. of singleton variable sites 8 5 9 5 10 5 7 3 6
No. of parsimony informative site 7 9 9 4 8 4 9 6 6
No. of private sites 8 4 10 1 10 0 14 4 7
No. of transitions 14 14 16 9 16 8 15 9 12
No. of transversions 1 0 2 0 3 1 1 0 0
No. of synonymous substitutions 13 13 16 - - - 12 7 8
No. of nonsynonymous substitutions 2 1 2 - - - 4 2 4
Page 59
43
Fig. 7 Median-joining networks of the Cytb (A) and the Control region (B) haplotypes found in Mus spretus, and of the Cytb
haplotypes from Crocidura russula (C). Sampling sites are coloured differently in a grey scale. Numbers of circles correspond
to haplotypes as described in Tables 4, 5 and 6. Areas of the circles are proportional to the haplotype frequency. Each bar on
the connecting lines separates two mutational events.
Page 60
44
Fig. 8 Nucleotide and haplotype diversities for the Cytb gene and the Control region of Mus spretus and Crocidura russula at
each sampling site. The same letter means that values are significantly different (p<0.05). A - Aljustrel, P – Preguiça, R –
Reference site. Error bars represent s.d.
Page 61
45
Fig. 9 Frequency distributions of the number of pairwise nucleotide differences (mismatch distributions) between haplotypes
of the Cytb gene and the Control region in Mus spretus and Crocidura russula from each sampling site (A-Aljustrel, P-Preguiça,
R-Reference site).
Table 7 Fixation index and sources of variation in the Cytb gene and the Control region of Mus spretus and in the Cytb gene of
Crocidura russula. A - Aljustrel, P - Preguiça, R - Reference site.
Fixation index and source of
variation
Mus spretus Crocidura russula
Cytb Control region Cytb
φst 0.0338 0.0458 0.1594
% among populations 3.38 4.58 15.94
% within populations 96.62 95.42 84.06
Page 62
46
Table 8 Pairwise ST comparisons between populations from each sampling site of Mus spretus and Crocidura russula, for
the Cytb gene and the Control region.
Pairwise
φST
Mus spretus Crocidura russula
Cytb Control region Cytb
Aljustrel Preguiça Aljustrel Preguiça Aljustrel Preguiça
Preguiça 0.044* - 0.065* - 0.182* -
Reference site 0.055* 0.0017 0.037 0.033* 0.159* 0.127*
*p < 0.05
A total of 21 haplotypes were found in the three populations of Crocidura russula: 9 in the
Reference area, 11 in Aljustrel and 6 in Preguiça (Table 9). The three sites differed in the most frequent
haplotypes: 1 and 3 in Preguiça, 2 and 4 in the Reference area, and haplotype 12 in Aljustrel. Most
individuals in Preguiça (69%) had a shared haplotype, which contrasted with Aljustrel and the Reference
site, where sharing was observed in 19% and 43% of individuals, respectively. Aljustrel had the highest
number of polymorphic sites (16) (Table 6), while Preguiça had the lowest number of polymorphic sites
(9), and of singleton and private sites (33% and 44% of the variable sites, respectively). The haplotype
network shows that, in each population, haplotypes are not connected to a single haplotype but to the
most common haplotypes (Fig. 7C), suggesting that none population is expanding. Haplotype and
nucleotide diversity values were lower in Preguiça and higher in Aljustrel (Table 9 and Fig. 8).
Haplotype diversity was statistically different among the three populations (chi-squared test; p<0.05).
Aljustrel had a mismatch distribution that differed from the Reference site and Preguiça (Mann-Whitney
U test; p<0.05). The analysis of molecular variance also revealed that the global source of genetic
variation in Crocidura russula is mostly within and not among groups of populations (Table 7). All
three populations were greatly differentiated among them (ST=0.1594), and between each other
(pairwise ST; Table 8). This result is comparable to that found with microsatellite and D-loop markers,
where significant differentiation was observed among populations located within small geographic
distances (Balloux et al., 1998; Ehinger et al., 2002).
A smaller fragment of Cytb with 904bp was used to allow haplotype comparisons with known
Crocidura russula Cytb sequences. The smaller versions of haplotypes 1 and 3, the two most common
in Preguiça, were identical, respectively, to published haplotypes H1 (Accession number AY918373)
and Eur6 (Accession number KT167331). These haplotypes are apparently widely spread throughout
the distribution range of this species in Europe: haplotype H1 (=H8 or EUR1) was found in northern
France, southeast Switzerland, southern Portugal and central Iberian Peninsula (Brandli et al., 2005;
Fontanillas et al., 2005; Gargan et al., 2016), and haplotype EUR6 in northern Spain (Gargan et al.,
2016).
Page 63
47
Table 9 Distribution of haplotypes, number of haplotypes (h) and Diversity indices (Hd and ) for the Cytb gene of Crocidura russula from the three sampling sites.
Population Haplotype
h Diversity indices
1 2 3 4 5 6 7 8 9 10 11 12 13 14 15 16 17 18 19 20 21 Hd ± s.d. π ± s.d.
Reference site 3 6 1 6 1 3 1 1 1 - - - - - - - - - - - - 9 0.858 ± 0.044 0.0025 ± 0,0015
Aljustrel 3 1 - - - - - - - 3 1 6 2 1 2 4 1 1 - - - 11 0.903 ± 0.034 0.0031 ± 0,0018
Preguiça 5 1 5 - - - - - - - - - - - - - - - 2 2 1 6 0.817 ± 0.063 0.0022 ± 0,0014
Total 11 8 6 6 1 3 1 1 1 3 1 6 2 1 2 4 1 1 2 2 1
Hd ± s.d. haplotype diversity ± standard deviation; π ± s.d. nucleotide diversity ± standard deviation
Table 10 Number of animals of Crocidura russula with length heteroplasmy in the Control region.
Frequency Site
Aljustrel Preguiça Reference site
Homoplasmic 14 (56%) 3 (19%) 13 (57%)
Heteroplasmic 11 (44%) 13 (81%) 10 (43%)
Table 11 Distribution of haplotypes, number of haplotypes (h) and Diversity indices (Hd and ) for the control region of Mus spretus from the three sampling sites.
Population Haplotype
h Diversity indices
1 2 3 3 5 6 7 8 9 10 11 12 13 14 15 16 17 18 19 20 21 22 Hd ± s.d. π ± s.d.
Reference site 1 7 4 4 1 1 3 1 2 1 - - - - - - - - - - - - 10 0.877 ± 0.040 0.0025 ± 0.0016
Aljustrel 4 7 3 4 1 - - - - - 1 1 3 1 - - - - - - - - 9 0.870 ± 0.039 0.0023 ± 0.0015
Preguiça 1 6 4 - - 1 1 - - - 3 - - - 1 1 2 2 1 1 2 1 14 0.923 ± 0.031 0.0033 ± 0.0020
Total 6 20 11 8 2 2 4 1 2 1 4 1 3 1 1 1 2 2 1 1 2 1
Hd ± s.d. haplotype diversity ± standard deviation; π ± s.d. nucleotide diversity ± standard deviation
Page 64
48
2.2. Control region
In Crocidura russula, the frequency of individuals with length heteroplasmy in the control
region was statistically different between sites (chi-squared test; p<0.05). The population from Preguiça
was mostly heteroplasmic (81% individuals), contrasting to the Reference site and Aljustrel where,
respectively, 43% and 44% individuals had heteroplasmy (Table 10).
The amplified sequence in the control region of Mus spretus was 825bp in size (deposited in
GenBank with accession numbers XXXX-XXXX). We found a total of 22 haplotypes: 10 in the
Reference site, 9 in Aljustrel and 14 in Preguiça (Table 11). Haplotype 2 was the most frequent
haplotype among the three populations. Haplotype 3 is also a common haplotype and is identical to the
haplotype found in three specimens caught near Madrid, Spain (Accession numbers DQ266070-72).
Contrasting with that found with the Cytb gene, nearly 40% of the Preguiça population carried exclusive
haplotypes. In Aljustrel and in the Reference site 80% and 84% of the individuals had shared haplotypes,
again in an opposite pattern to that found with the Cytb gene. As shown in Table 6, Preguiça had the
highest number of polymorphic sites (18), and of singleton and private sites (55% of the variable sites).
Most variable sites in Preguiça were transitions of each type (C/T and A/G), while in Aljustrel and in
the Reference site variation were mostly C/T transitions (67% and 63%, respectively). An indel was
found in position 674. The majority of the individuals had haplotypes with deletion: 80%, 72% and 92%
in Aljustrel, the Reference site and Preguiça, respectively (Table 12). This deletion is also present in the
above-mentioned three specimens from Madrid but absent in an individual sampled near Cádiz, Spain
(Accession number U47539), and therefore its presence/absence seems to be polymorphic in Mus
spretus. Haplotype network revealed an intricate pattern of relationships among haplotypes from all the
populations, largely reflecting the sharing of variable sites between haplotypes (Fig. 7B). This indicates
that most variation occurs in preferential sites (“hotspots”) along the control region and that the observed
haplotypes are different combinations of these variable sites. This is particularly noticeable in the
populations of Aljustrel and the Reference site, while in the population of Preguiça the majority of
variation is observed in private sites. In an opposing pattern to that observed with Cytb, both haplotype
and nucleotide diversities in the control region were the highest in Preguiça and the lowest in Aljustrel
(Table 12 and Fig. 8). The distribution of haplotypes did not differ between populations (chi-squared
test), but Preguiça differed significantly from the Reference site and Aljustrel in the distribution of
pairwise differences (Mann-Whitney U test; p<0.05) (Fig. 8). The analysis of molecular variance
revealed no genetic structuring in Mus spretus (Table 8). Genetic differentiation was low among the
three populations (ST=0.0458), however, pairwise ST estimates showed that the population from
Preguiça was genetically differentiated from those of the Reference site and Aljustrel (Table 9), again
contrasting to that found with the Cytb gene.
Table 12 Number of animals of Mus spretus with an insertion or deletion at position 674 of the Control region.
Frequency
Site
Aljustrel Preguiça Reference site
w/ insertion 5 (20%) 2 (8%) 7 (28%)
w/ deletion 20 (80%) 23 (92%) 18 (72%)
Page 65
49
DISCUSSION
In this study, the same populations of Mus spretus and Crocidura russula living in heavy metal
polluted mines, that were previously found to harbour changes at the biochemical, histological and
physiological levels (Marques, 2008; Marques et al., 2008; Marques et al., 2007; Sanchez-Chardi et al.,
2008; Sanchez-Chardi et al., 2007), were shown here to have acquired alterations at two other levels of
biological organization as well, the morphometric and the genetic levels.
The individual morphometric geometric analysis of the mandible of adult Mus spretus revealed
that animals from the three sites differed in the shape of the mandible. Also, mandibular shape from the
animals of the polluted sites was morphologically more alike, as measured by the Mahalanobis distances
of the shape, than the mandibles from animals of the Reference site. The highest difference between the
mandible shape of animals from the polluted sites and of the Reference site was found in the ascending
ramus, particularly in the condylar process, whereas between animals of the two mine sites shape
variations were located in both the angular and condylar processes. The alveolar module holds the teeth
and is involved in the cutting and chewing of food or other material, while the ascending ramus
articulates with the skull and participates in the attachments of masticatory muscles. In the evolution of
Murinae, changes in the shape of the mandible were shown to be related to the functioning of the
mandible, namely with the type of consumed food (Michaux et al., 2007). Mus spretus is omnivorous
and slight preferences in diet could explain the separation of the groups as a result of local adaptation to
the available food type (Homsi and Aulagnier, 2010; Luca et al., 2003; Maki et al., 2002). The landscape
from Aljustrel mine was particularly degraded and mine tailings were un-vegetated at the time of
sampling; in contrast, Preguiça was covered by vegetation that hided all the tailings and scoria produced
by mining. Because bone growth is a dynamic process, with formation and resorption of bone that
responds to the mechanical forces experienced (Renaud et al., 2010; Vecchione et al., 2010), mandibles
may have been shaped differently in young mice from both sites during their post-natal development
(Martinez-Vargas et al., 2017). Nonetheless, vegetation and general landscape at the Reference sampling
site were very similar to that of Preguiça. Assuming a similar genetic background in these two
populations of Mus spretus (as suggested by the diversity of Cytb gene), the observed differences in
mandibular morphology could have been induced by distinct internal stressors that disturb metabolic
pathways and gene expression of developmental and bone remodelling genes. Exposure to
environmental pollutants in utero is known to affect fetal skeleton development and growth (Allen and
Leamy, 2001; Sholts et al., 2015). Interestingly, animals from Preguiça and the Reference site had the
most dissimilar mandible shapes among all sites (higher Mahalanobis distances between them), despite
genetic proximity, with mandibular shape varying in a more resembling way within individuals of the
mines. This is highly suggestive for a role of environmental quality in defining mandibular
morphological plasticity in Mus spretus. For instance, higher hepatic concentrations of selenium were
found in Mus spretus from both mines, and deficit or excess of selenium has been shown to influence
the biomechanical strength of bones (Turan et al., 2000).
One phenotypic manifestation of variability in development induced by toxics is the presence
of deviations from perfect symmetry of paired-structures in the body of exposed organisms. Fluctuating
asymmetry has been used as an individual marker of exposure to stress induced by contaminants during
the developmental period (Badyaev et al., 2000). This type of asymmetry has been reported in various
studies of small mammals living in polluted sites (Nunes et al., 2001a; Sanchez-Chardi et al., 2013;
Velickovic, 2004), but there are also examples where it failed to be observed (Allen and Leamy, 2001;
Owen and Mcbee, 1990). Nonetheless, although results may differ with species, combinations of
specific stressors, level and duration of pollution, and morphological characters, fluctuating asymmetry
Page 66
50
is considered a suitable indicator of environmental-induced developmental instability (Beasley et al.,
2013). In spite of the presence of contaminants in the soil and vegetation of Aljustrel and Preguiça
relative to the Reference site and the evidence of physiologic alterations in the animals from these mines,
we did not detect significant differences in mandibular shape fluctuating asymmetry between sites. One
possible reason is that this species may have acquired an ability to efficiently buffer any environmental
disturbance so that no major disruption of the normal mandibular developmental processes, in terms of
symmetry, occurs during the prenatal and early post-natal periods. Fluctuating asymmetry of dental traits
size has been reported in Mus spretus living in a riparian heavy metal–polluted area in Central Portugal
(Nunes et al., 2001a), but susceptibility to pollutants may differ between jaw and dental characters due
to their distinct differentiation process (Swiderski and Zelditch, 2013). Also, non-integrated traits, such
as teeth traits, seem to be particularly sensitive to environmental perturbations associated with stress
(Badyaev and Foresman, 2000). One other possibility could be related with a non-coincident seasonality
between heavy metal bioavailability and the reproductive cycle of Mus spretus (Lopes et al., 2002). This
species typically reproduces in spring and summer (Palomo et al., 2009), and seasonal variation in
metallothionein induction (highest in wet season) and in antioxidant enzyme activities (highest in dry
season) was in fact observed in adult animals captured in Aljustrel (Marques et al., 2008). Such variation
could influence the physiological condition of pregnant females and the consequent induction of
offspring asymmetry. Finally, and unexpectedly, Mus spretus was found to be antisymmetric in
mandible shape, i.e. most individuals were found to be either “left-sided” or “right-sided” asymmetric,
a finding not yet reported for this species (not observed in dental characters (Nunes et al., 2001a)), or
even described in other small mammals (Palmer, 1996). We are uncertain if this type of asymmetry has
confounded our estimates of FA in the mandible of Mus spretus, although we tried to reduce this effect
by using residual values of shape FA. Antisymmetry in morphological characters in other animal groups
has been linked to behavioral laterality (cuttlefish Sepia lycidas (Lucky et al., 2012)) or sexual
dimorphism (larger claw in male fiddler crabs of the genus Uca). Mus spretus shows a behavioral pattern
in the use of the mouth not reported in other rodents, with both males and females picking up feces in
their mouths or rolling them forwards or sideways with the tip of the snout, often repeatedly, in distances
of several centimeters (Hurst and Smith, 1995). Whether this behavior is associated with evolution of
mandibular antisymmetry in Mus spretus is purely hypothetical. Moreover, to ascertain that this
peculiarity is truly species-specific and not particular to this region of the Iberian Peninsula (due to
phylogeography or a local adaptation), a larger sampling effort covering the whole distribution range of
Mus spretus should be accomplished in the future.
The genetic composition of populations can be affected by environmental pollutants in four
main ways: by increasing mutation rates, selecting tolerant genotypes, causing bottleneck events, or
altering migration (gene flow) (van Straalen and Timmermans, 2002). The study of the genetic
variability of natural populations living in polluted sites may thus reveal a higher, lower variability or
no altered patterns relative to a reference area [reviewed in (Mussali-Galante et al., 2014)]. The Cytb
gene revealed an overall genetic similarity among the three populations of Mus spretus (st=0.03384;
little genetic differentiation). This finding is not unexpected given the high dispersive capacity of this
species (Gray et al., 1998). Nonetheless, the Aljustrel population was genetically differentiated from the
populations of Preguiça and the Reference site, and had higher haplotype diversity than the latter. This
could be explained by several processes: phylogeography, reduction in effective population size in the
past followed by genetic drift and population expansion, or admixture of different source populations.
The scarcity of phylogeographic studies of Mus spretus in the Iberian Peninsula precludes us from
confirming or excluding this hypothesis. As a polluted and unsuitable habitat, Aljustrel could have had
its population number diminished in a not recent past, with animals failing to adequately survive and
reproduce there, being now constituted by a stable population already adapted to that environment; or it
Page 67
51
may have been populated by migrant individuals coming from surrounding populations, in which case
Aljustrel would have functioned as an ecological sink (Matson et al., 2006). The results from Crocidura
russula, a species that has a lower dispersive capacity than Mus spretus (Balloux et al., 1998), may
support the latter scenario. Phylogeographic studies of Crocidura russula in the Iberian Peninsula show
that this species can be highly variable in the Cytb gene even between close localities (Gargan et al.,
2016), and indeed our three populations were genetically highly differentiated (st=0.15936). Still, the
population from Aljustrel had higher genetic diversity values than in the Reference site, with 84% of the
animals carrying unique haplotypes (contrasting to 57% and 31% in the Reference site and Preguiça,
respectively). Moreover, haplotypes in Aljustrel were more polymorphic than in the other sites, differing
on average in 3.24 bases, while in the Reference site and Preguiça average nucleotide differences
between haplotypes were 2.55 and 2.26, respectively. The presence of more polymorphic haplotypes in
Aljustrel could result from immigration of individuals originating in different neighbouring populations.
The Preguiça mine, on the other hand, seems to have relatively homogeneous populations of
Mus spretus and Crocidura russula as regards Cytb diversity: lower nucleotide and haplotype diversities
relative to the reference population and high level of haplotype sharing with the Reference site and
Aljustrel. Populations living in contaminated environments can undergo a decrease in genetic variation
or changes in allele frequencies because of demographic bottlenecks that result from lower fitness and/or
reproductive success of the individuals and selection of more tolerant genotypes. This loss of genetic
diversity in populations subjected to anthropogenic stress has been labeled “genetic erosion” (van
Straalen and Timmermans, 2002). It is therefore conceivable that the populations of both species in
Preguiça may have suffered a bottleneck in the recent past, with loss of the rarer haplotypes, and arose
from founder populations most probably originating in the Reference site (or its surroundings) given the
genetic similarity and geographic proximity between these two sites (20 km apart and no major physical
obstacle in-between). The presence/absence of structural variations in the control region of Mus spretus
and Crocidura russula also sustained this scenario. We used these variations as “neutral genetic
markers” to measure shifts in population number. The frequency of individuals carrying such structural
features in the control region (an indel in position 674 in Mus spretus and length heteroplasmy in
Crocidura russula) was compared between sites. In Crocidura russula, length heteroplasmy in the
control region is constitutive (Fumagalli et al., 1996), and indeed we found that 43% of shrews in the
Reference site were heteroplasmic. A similar frequency was found in Aljustrel (44%), but contrasts with
the significantly higher number of heteroplasmic animals found in Preguiça (81%). The results from
Cytb point to the plausibility of a genetic drift bottleneck being at the origin of this shift in heteroplasmy
frequency in Preguiça, but we cannot reject that an elevated instability in repeat length could also have
contributed to this increased frequency (Rinner et al., 2011; Yauk and Quinn, 1996), for instance,
through loss of replication accuracy of the mitochondrial DNA (increase in replication slippage),
deficient repair, or increased mutations in sites near repeats (forming secondary structures). In Mus
spretus, the indel in position 674 of the control region is also apparently polymorphic in this species.
For instance, a deletion is present in three specimens sampled near Madrid, Spain, but absent in an
individual sampled near Cádiz, Spain. In our populations, deletion was found in 72% and 80% of the
individuals from the Reference site and Aljustrel, respectively, but present in the majority of the
individuals from Preguiça (92%). These frequencies, though not statistically different, are again
consistent with the lower diversity found in Cytb and suggestive that, as for Crocidura russula, a
decrease in genetic diversity in Mus spretus may have occurred in the past in Preguiça.
A change on the diversity parameters of any two mitochondrial regions should coincide in
direction due to genetic linkage. Remarkably, in Preguiça, we observed changes in opposite directions
in the two markers used in Mus spretus. Nucleotide diversity in the control region was significantly
Page 68
52
higher in Preguiça than in the Reference site or Aljustrel (these two sites did not differ in the genetic
diversity of the control region). Nearly 40% of the individuals had unique haplotypes, contrasting with
that found with the Cytb gene where most individuals (78%) had shared haplotypes. Preguiça had the
highest number of polymorphic and private sites (55% of the variable sites). An increase in genetic
variation in mitochondrial DNA may arise from gene flow or new mutations. The former possibility is
unlikely since the results from Cytb show a relatively low diversified population in Preguiça. Instead,
exposure to heavy metals may have increased the genetic diversity of populations through increased
mutation rates (Eeva et al., 2006). Many chemicals and heavy metals are known to be mutagenic and
genotoxic to Mus spretus (da Silva et al., 2013; Ieradi et al., 1998; Marques et al., 2006; Mateos et al.,
2008; Tanzarella et al., 2001; Tapisso et al., 2009). Presumably, both mitochondrial regions are equally
susceptible to the genotoxic effects by heavy metals but given the involvement of the Cytb gene in
protein complexes of the OXPHOS pathway, deleterious variants in this gene might be purged from the
population (purifying selection). On the other hand, the control region, although functionally important
to mitochondrial replication and transcription, is a very variable region and, for this reason, frequently
used in intraspecific phylogenetic studies. The intricate pattern of haplotype relationships observed in
the network tree might indicate that in Mus spretus variation in the control region was concentrated in
preferential sites (“hotspots”), especially in the ETAS and CSB domains. The ETAS domain is the most
variable domain of the control region in rodents (Larizza et al., 2002). In Preguiça, variable sites were
mainly observed in this domain but mutations in conserved regions of the CSB domain were also found
and only in this population. The CSB domain in Mus spretus is constituted by three functionally
important conserved sequence blocks (CSB1-3) (Larizza et al., 2002). Intriguingly, one of the mutations
found in Preguiça was located in CSB1, a region that contains the RNA/DNA transition sites, the MRP
cleavage sites, and the 3’ end of short RNA primers. These new mutations might only be slightly
deleterious, contrasting with Cytb mutations. It is possible that conservation of secondary structuring in
the control region might act as a selective force that retains novel mutations in this mitochondrial region
(Pereira et al., 2008). Moreover, because these mutations were not found in a heteroplasmic form
(mutation heteroplasmy), sufficient time must have passed to allow their fixation in the population
(Bickham, 2011).
In summary, we have found that populations of two small mammalian species at different
trophic levels in the ecosystem, both living in sites polluted with heavy metals, present alterations at
their morphology and genetic composition in comparison with a nearby reference population. These
alterations are both present in Aljustrel and Preguiça but differ between mines, which could be
associated with their distinct metal bioavailability, intensity of metal extraction, landscape, and length
of mining (i.e. duration of metal exposure) (Marques, 2008). Our data underlines the notion that metal
pollution impacts the immediate natural community at various interconnected levels of biological
organization. Animals living in the surroundings of mines or polluted sites display changes at the
histologic, enzymatic, transcriptomic and proteomic levels, reflecting the toxic effects of internal
contaminants (Abril et al., 2015; Abril et al., 2011; Bonilla-Valverde et al., 2004; Garcia-Sevillano et
al., 2014; Marques et al., 2008; Marques et al., 2007; Montes-Nieto et al., 2007; Nunes et al., 2001b;
Ruiz-Laguna et al., 2016; Sanchez-Chardi et al., 2009a; Sanchez-Chardi et al., 2009b; Viegas-Crespo et
al., 2003). These changes may potentially modulate developmental pathways resulting in morphological
variations (Sanchez-Chardi et al., 2013). Even so, animals seem to survive and thrive in these stressful
environments (Biser et al., 2004; Levengood and Heske, 2008; Phelps and Mcbee, 2010). Within a
relatively short time, the population genetic structure may be altered, and individuals from mines
become selected to resist to pollutants, a process already referred as “micro-evolution due to pollution”
(Medina et al., 2007). Studies of genetic ecotoxicology such as this have the potential to evaluate the
impact of anthropogenic stress in the evolutionary history of natural populations (Banks et al., 2013;
Page 69
53
Bickham, 2011). Because the ecological costs of any genetic change are largely unpredictable (Medina
et al., 2007), sustainable metal extraction and processing are needed, as well as environmental recovery
of abandoned mines to mitigate this impact (Hughes et al., 2008).
Page 70
54
REFERENCES
Abril, N., Chicano-Gálvez, E., Michán, C., López-Barea, J., 2015. iTRAQ analysis of hepatic proteins
in free-living Mus spretus mice to assess the contamination status of areas surrounding Donana
National Park (SWSpain). Science of the Total Environment. 523, 16-27.
Abril, N., Ruiz-Laguna, J., Osuna-Jiménez, I., Vioque-Fernández, A., Fernández-Cisnal, R., Chicano-
Gálvez, E., Alhama, J., López-Barea, J., Pueyo, C., 2011. Omic Approaches in Environmental
Issues. Journal of Toxicology and Environmental Health-Part a-Current Issues. 74, 1001-1019.
Allen, D. E., Leamy, L. J., 2001. 2,3,7,8-tetrachlorodibenzo-p-dioxin affects size and shape, but not
asymmetry, of mandibles in mice. Ecotoxicology. 10, 167-176.
Andre, J., et al., 2010. Molecular genetic differentiation in earthworms inhabiting a heterogeneous Pb-
polluted landscape. Environmental Pollution. 158, 883-890.
Badyaev, A. V., Foresman, K. R., 2000. Extreme environmental change and evolution: stress-induced
morphological variation is strongly concordant with patterns of evolutionary divergence in
shrew mandibles. Proceedings of the Royal Society B-Biological Sciences. 267, 371-377.
Badyaev, A. V., Foresman, K. R., Fernandes, M. V. 2000. Stress and developmental stability:
Vegetation removal causes increased fluctuating asymmetry in shrews. Ecology. 81, 336-345.
Baker, R. J., Bickham, A. M., Bondarkov, M., Gaschak, S. P., Matson, C. W., Rodgers, B. E., Wickliffe,
J. K., Chesser, R. K., 2001. Consequences of polluted environments on population structure: the
bank vole (Clethrionomys glareolus) at Chornobyl. Ecotoxicology. 10, 211-6.
Balloux, F., Goudet, J., Perrin, N., 1998. Breeding System and Genetic Variance in the Monogamous,
Semi-Social Shrew, Crocidura russula. Evolution. 52, 1230-1235.
Bandelt, H. J., Forster, P., Röhl, A., 1999. Median-joining networks for inferring intraspecific
phylogenies. Molecular Biology and Evolution. 16, 37-48.
Banks, S. C., Cary, G. J., Smith, A. L., Davies, I. D., Driscoll, D. A., Gill., A. M., Lindenmayer, D. B.,
Peakall, R., 2013. How does ecological disturbance influence genetic diversity? Trends in
Ecology & Evolution. 28, 670-679.
Barbosa, S., Pauperio, J., Searle, J. B., Alves, P. C., 2013. Genetic identification of Iberian rodent species
using both mitochondrial and nuclear loci: application to noninvasive sampling. Molecular
Ecology Resources. 13, 43-56.
Beasley, D. E., Bonisoli-Alquati, A., Mousseau, T. A., 2013. The use of fluctuating asymmetry as a
measure of environmentally induced developmental instability: A meta-analysis. Ecological
Indicators. 30, 218-226.
Berckmoes, V., Scheirs, J., Jordaens, K., Blust, R., Backeljau, T., Verhagen, R., 2005. Effects of
environmental pollution on microsatellite DNA diversity in wood mouse (Apodemus
sylvaticus) populations. Environ Toxicol Chem. 24, 2898-907.
Bickham, J. W., 2011. The four cornerstones of Evolutionary Toxicology. Ecotoxicology. 20, 497-502.
Biser, J. A., Vogel, L. A., Berger, J., Hjelle, B., Loew, S. S., 2004. Effects of heavy metals on
immunocompetence of white-footed mice (Peromyscus leucopus). Journal of Wildlife Diseases.
40, 173-184.
Bonilla-Valverde, D., Ruiz-Laguna, J., Muñoz, A., Ballesteros, J., Lorenzo, F., Gómez-Ariza, J. L.,
López-Barea, J., 2004. Evolution of biological effects of Aznalcollar mining spill in the
Algerian mouse (Mus spretus) using biochemical biomarkers. Toxicology. 197, 123-138.
Bookstein, F. L., 1991. Morphometric Tools for Landmark Data. Geometry and Biology. Cambridge
University Press.
Brandli, L., Handley, L. J., Vogel, P., Perrin, N., 2005. Evolutionary history of the greater white-toothed
shrew (Crocidura russula) inferred from analysis of mtDNA, Y, and X chromosome markers.
Molecular Phylogenetics and Evolution. 37, 832-844.
Clements, W. H., 2000. Integrating effects of contaminants across levels of biological organization: an
overview. Journal of Aquatic Ecosystem Stress and Recovery. 7, 113-116.
da Silva, F. M. R., Eslava-Martins, S., Muccillo-Baisch, A. L., Mathias, M. L., 2017. Mus spretus as an
environmental sentinel: A review of 17 years (1998-2015) of research in Mediterranean Europe.
Ecological Indicators. 73, 61-67.
Page 71
55
da Silva, F. M. R., Monarca, R. I., Dias, D., Ramalhinho, M., Mathias, M. L., Muccillo-Baish, A., 2013.
Geno- and Cyto-toxicity in Free-Living Rodent Mus spretus Exposed to Simulated Onshore Oil
Spill. Bulletin of Environmental Contamination and Toxicology. 91, 465-468.
Eeva, T., Belskii, E., Kuranov, B., 2006. Environmental pollution affects genetic diversity in wild bird
populations. Mutat Res. 608, 8-15.
Ehinger, M., Fonatnillas, P., Petit, E., Perrin, N., 2002. Mitochondrial DNA variation along an altitudinal
gradient in the greater white-toothed shrew, Crocidura russula. Molecular Ecology. 11, 939-
945.
Excoffier, L., Lischer, H. E., 2010. Arlequin suite ver 3.5: a new series of programs to perform
population genetics analyses under Linux and Windows. Molecular Ecology Resources. 10,
564-7.
Fontanillas, P., Dépraz, A., Giorgi, M. S., Perrin, N., 2005. Nonshivering thermogenesis capacity
associated to mitochondrial DNA haplotypes and gender in the greater white-toothed shrew,
Crocidura russula. Molecular Ecology. 14, 661-670.
Fumagalli, L., Taberlet, P., Favre, L., Hausser, J., 1996. Origin and evolution of homologous repeated
sequences in the mitochondrial DNA control region of shrews. Molecular Biology and
Evolution. 13, 31-46.
Garcia-Sevillano, M. A., García-Barrera, T., Navarro, F., Abril, N., Pueyco, C., López-barea, J., Gómez-
Ariza, J. L., 2014. Use of Metallomics and Metabolomics to Assess Metal Pollution in Donana
National Park (SW Spain). Environmental Science & Technology. 48, 7747-7755.
Gargan, L. M., Cornette, R., Yearsley, J. M., Montgomery, W. I., Pauério, J., Alves, P. C., Butler, F.,
Pascal, M., Tresset, A., Herrel, A., Lusby, J., Tosh, D. G., Searle, J. B., McDevitt, A. D., 2016.
Molecular and morphological insights into the origin of the invasive greater white-toothed
shrew (Crocidura russula) in Ireland. Biological Invasions. 18, 857-871.
Giska, I., Babik, W, van Gestel, C. A., van Straalen, N., M., Laskowski, R., 2015. Genome-wide genetic
diversity of rove beetle populations along a metal pollution gradient. Ecotoxicology and
Environmental Safety. 119, 98-105.
Goodall, C., 1991. Procrustes Methods in the Statistical-Analysis of Shape. Journal of the Royal
Statistical Society Series B-Methodological. 53, 285-339.
Graham, J. H., Raz, S., Hel-Or, H., Nevo, E., 2010. Fluctuating Asymmetry: Methods, Theory, and
Applications. Symmetry-Basel. 2, 466-540.
Gray, S. J., Hurst, J. L., Stidworthy, R., Smith, J., Preston, R., MacDougall, R., 1998. Microhabitat and
spatial dispersion of the grassland mouse (Mus spretus Lataste). Journal of Zoology. 246, 299-
308.
Hall, T. A., 1999. BioEdit: a user-friendly biological sequence alignment editor and analysis program
for Windows 95/98/NT. Nucleic Acids Symposium Series. 41, 95-98.
Homsi, N. K. E., Aulagnier, S., 2010. Unexpected morphometric differentiation of the Algerian mouse,
Mus spretus (Rodentia: Muridae) from Kabylie of Djurdjura (Algeria). Mammalia. 74, 199-207.
Hughes, A. R., Inouye, B. D., Johnson, M. T. J., Underwood, N., Vellend, M., 2008. Ecological
consequences of genetic diversity. Ecology Letters. 11, 609-623.
Hurst, J. L., Smith, J., 1995. Mus-Spretus Lataste - a Hygienic House Mouse. Animal Behaviour. 49,
827-834.
Ieradi, L. A., Moreno, S., Bolívarc, J. P., Cappaid, A., Benedettod, A., Cristaldid, M., 1998. Free-living
rodents as bioindicators of genetic risk in natural protected areas. Environmental Pollution. 102,
265-268.
Irwin, D. M., Kocher, T. D., Wilson, A. C., 1991. Evolution of the Cytochrome-B Gene of Mammals. J
Mol Evol. 32, 128-144.
Jaarola, M., Searle, J. B., 2002. Phylogeography of field voles (Microtus agrestis) in Eurasia inferred
from mitochondrial DNA sequences. Molecular Ecology. 11, 2613-2621.
Kim, S. J., Rodriguez-Lanetty, M., Suh, J. Song, J., 2003. Emergent effects of heavy metal pollution at
a population level: Littorina brevicula a study case. Marine Pollution Bulletin. 46, 74-80.
Klingenberg, C. P., 2011. MorphoJ: an integrated software package for geometric morphometrics.
Molecular Ecology Resources. 11, 353-357.
Klingenberg, C. P., 2015. Analyzing Fluctuating Asymmetry with Geometric Morphometrics: Concepts,
Methods, and Applications. Symmetry-Basel. 7, 843-934.
Page 72
56
Klingenberg, C. P., Barluenga, M., Meyer, A., 2002. Shape analysis of symmetric structures:
Quantifying variation among individuals and asymmetry. Evolution. 56, 1909-1920.
Klingenberg, C. P., McIntyre, G. S., 1998. Geometric morphometrics of developmental instability:
Analyzing patterns of fluctuating asymmetry with procrustes methods. Evolution. 52, 1363-
1375.
Klingenberg, C. P., Mebus, K., Auffray, J. C., 2003. Developmental integration in a complex
morphological structure: how distinct are the modules in the mouse mandible? Evolution &
Development. 5, 522-531.
Larizza, A., Pesole, G., Reyes, A., Sbisà, E., Saccone, C., 2002. Lineage specificity of the evolutionary
dynamics of the mtDNA D-loop region in rodents. J Mol Evol. 54, 145-155.
Lecompte, E., Granjon, L., Denys, C., 2002. The phylogeny of the Praomys complex (Rodentia :
Muridae) and its phylogeographic implications. Journal of Zoological Systematics and
Evolutionary Research. 40, 8-25.
Levengood, J. M., Heske, E. J., 2008. Heavy metal exposure, reproductive activity, and demographic
patterns in white-footed mice (Peromyscus leucopus) inhabiting a contaminated floodplain
wetland. Science of the Total Environment. 389, 320-328.
Librado, P., Rozas, J., 2009. DnaSP v5: a software for comprehensive analysis of DNA polymorphism
data. Bioinformatics. 25, 1451-1452.
Lopes, P. A., Viegas-Crespo, A. M., Nunes, A. C., Pinheiro, T., Marques, C., Santos, M., C., Mathias,
M. L., 2002. Influence of age, sex, and sexual activity on trace element levels and antioxidant
enzyme activities in field mice (Apodemus sylvaticus and Mus spretus). Biological Trace
Element Research. 85, 227-239.
Luca, L., Robert, D., Francesca, S. M., Francesca, P., 2003. Consistency of diet and its effects on
mandibular morphogenesis in the young rat. Prog Orthod. 4, 3-7.
Lucky, N. S.,Ihara, R., Yamaoka, K., Hori, M., 2012. Behavioral Laterality and Morphological
Asymmetry in the Cuttlefish, Sepia lycidas. Zoological Science. 29, 286-292.
Maki, K., Nishioka T., Shioiri, E., Takahashi, T., Kimura, M., 2002. Effects of dietary consistency on
the mandible of rats at the growth stage: computed X-ray densitometric and cephalometric
analysis. Angle Orthod. 72, 468-75.
Marques, C. C., Small mammals as bioindicators in the assessment of toxicological effects resulting
from the exposure to heavy metals. PhD Thesis, Departamento de Biologia Animal, Faculdade
de Ciências. Universidade de Lisboa, 2008.
Marques, C. C., Gabriel, S. I., Pinheiro, T., Viegas-crespo, A. M., Mathias, M. L., Bebianno, M. J.,
2008. Metallothionein levels in Algerian mice (Mus spretus) exposed to elemental pollution:
An ecophysiological approach. Chemosphere. 71, 1340-1347.
Marques, C. C., Nunes, A. C., Pinehiro, T., Santos, M. C., Viegas-crespo, A. M., Ramalhinho, M. G.,
Mathias, M. L., 2006. An assessment of time-dependent effects of lead exposure in Algerian
mice (Mus spretus) using different methodological approaches. Biological Trace Element
Research. 109, 75-89.
Marques, C. C., Sánchez-Chardi, A., Gabriel, S. I., Nadal, J., Viegas-Crespo, A. M., Mathias, M. L.,
2007. How does the greater white-toothed shrew, Crocidura russula, responds to long-term
heavy metal contamination? - A case study. Science of the Total Environment. 376, 128-133.
Martinez-Vargas, J., Muñoz-Muñoz, F., Martinez-Maza, C., Molinero, A., Ventura, J., 2017. Postnatal
mandible growth in wild and laboratory mice: Differences revealed from bone remodeling
patterns and geometric morphometrics. Journal of Morphology. 278, 1058-1074.
Mateos, S., Daza, P., Domínguez, I., Cárdenas, J. A., Cortés, F., 2008. Genotoxicity detected in wild
mice living in a highly polluted wetland area in south western Spain. Environmental Pollution.
153, 590-593.
Matson, C. W., Lambert, M. M., McDonald, T. J., Autenrieth, R. L., Donnelly, K. C., Islamzadeh, A.,
Politov, d. I., Bickham, J. W., 2006. Evolutionary toxicology: Population-level effects of
chronic contaminant exposure on the marsh frogs (Rana ridibunda) of Azerbaijan.
Environmental Health Perspectives. 114, 547-552.
Medina, M. H., Correa, J. A., Barata, C., 2007. Micro-evolution due to pollution: Possible consequences
for ecosystem responses to toxic stress. Chemosphere. 67, 2105-2114.
Page 73
57
Meyer, J. N., Leung, M. C., Rooney, J. P., Sendoel, A., Hengartner, M. O., Kisby, G. E., Bess, A. S.,
2013. Mitochondria as a target of environmental toxicants. Toxicol Sci. 134, 1-17.
Michaux, J., Chevret, P., Renaud, S., 2007. Morphological diversity of Old World rats and mice
(Rodentia, Muridae) mandible in relation with phylogeny and adaptation. Journal of Zoological
Systematics and Evolutionary Research. 45, 263-279.
Mikowska, M., Gaura, A., Sadowska, E., Koteja, P., Swiergosz-Kowalewska, R., 2014. Genetic
variation in bank vole populations in natural and metal-contaminated areas. Arch Environ
Contam Toxicol. 67, 535-46.
Mira, A., Mathias, M. L., Padrões de reprodução em ratinhos-caseiros (Mus musculus domesticus) e
ratinhos-ruivos (Mus spretus). In: A. M. P. Lavadinho, (Ed.), Os Roedores na Agricultura.
DGPC, Lisboa, 1996, pp. 65-75.
Montes-Nieto, R., Fuentes-Almagro, C. A., Bonilla-Valverde, D., Prieto-Alamo, M. J., Jurado, J.,
Carrascal, M., Gómez-Ariza, J. L., López-Barea, J., Pueyo, C., 2007. Proteomics in free-living
Mus spretus to monitor terrestrial ecosystems. Proteomics. 7, 4376-4387.
Mussali-Galante, P., Tovar-Sánchez, E., Valverde, M., Rojas, E. 2013a. Biomarkers of Exposure for
Assessing Environmental Metal Pollution: From Molecules to Ecosystems. Revista
Internacional De Contaminacion Ambiental. 29, 117-140.
Mussali-Galante, P., Tovar-Sánchez, E., Valverde, M., Valencia-Cuevas, L., Rojas, E., 2013b. Evidence
of population genetic effects in Peromyscus melanophrys chronically exposed to mine tailings
in Morelos, Mexico. Environ Sci Pollut Res Int. 20, 7666-79.
Mussali-Galante, P., Tovar-Sánchez, E., Valverde, M., Rojas, E., 2014. Genetic structure and diversity
of animal populations exposed to metal pollution. Rev Environ Contam Toxicol. 227, 79-106.
Nunes, A. C., Auffray, J. C., Mathias, M.L., 2001a. Developmental instability in a riparian population
of the Algerian mouse (Mus spretus) associated with a heavy metal-polluted area in central
Portugal. Archives of Environmental Contamination and Toxicology. 41, 515-521.
Nunes, A. C., Mathias, M. L., Crespo, A. M., 2001b. Morphological and haematological parameters in
the Algerian mouse (Mus spretus) inhabiting an area contaminated with heavy metals.
Environmental Pollution. 113, 87-93.
Owen, R. D., Mcbee, K., 1990. Analysis of Asymmetry and Morphometric Variation in Natural-
Populations of Chromosome-Damaged Mice. Texas Journal of Science. 42, 319-332.
Palmer, A. R., Fluctuating asymmetry analyses: a primer. In: T. A. Markow, (Ed.), Developmental
Instability: Its Origins and Evolutionary Implications. Kluwer Academic Publishers, 1994, pp.
335-364.
Palmer, A. R., 1996. From symmetry to asymmetry: Phylogenetic patterns of asymmetry variation in
animals and their evolutionary significance. Proc Natl Acad Sci U S A. 93, 14279-14286.
Palmer, A. R., Strobeck, C., 1986. Fluctuating Asymmetry - Measurement, Analysis, Patterns. Annual
Review of Ecology and Systematics. 17, 391-421.
Palomo, L. J., Justo, E. R., Vargas, J. M., 2009. Mus spretus (Rodentia: Muridae). Mammalian Species.
1-10.
Pereira, F., Soares, J., Carneiro, J., Pereira, L., Richards, M. B., Samuels, D. C., Amorim, A., 2008.
Evidence for Variable Selective Pressures at a Large Secondary Structure of the Human
Mitochondrial DNA Control Region. Molecular Biology and Evolution. 25, 2759-2770.
Pereira, R., Pereira, M. L., Ribeiro., R., Gonçalves, F., 2006. Tissues and hair residues and
histopathology in wild rats (Rattus rattus L.) and Algerian mice (Mus spretus Lataste) from an
abandoned mine area (Southeast Portugal). Environmental Pollution. 139, 561-75.
Phelps, K. L., Mcbee, K., 2010. Population Parameters of Peromyscus Leucopus (White-Footed
Deermice) Inhabiting a Heavy Metal Contaminated Superfund Site. Southwestern Naturalist.
55, 363-373.
Pina-Martins, F., Paulo, O. S., 2008. CONCATENATOR: sequence data matrices handling made easy.
Molecular Ecology Resources. 8, 1254-1255.
Rakitin, S. B., Grigorkina, E. B., Olenev, G. V., 2016. Analysis of Microsatellite DNA in Rodents from
Eastern Urals Radioactive Trace Zone and Contiguous Territories. Genetika. 52, 453-60.
Renaud, S., Auffray, J. C., Porte, S., 2010. Epigenetic effects on the mouse mandible: common features
and discrepancies in remodeling due to muscular dystrophy and response to food consistency.
Bmc Evolutionary Biology. 10.
Page 74
58
Rinner, B. P., Matson, C. W., Islamzadeh, A., McDonald, T. J., Donnelly, K. C., Bickham, J. W., 2011.
Evolutionary toxicology: contaminant-induced genetic mutations in mosquitofish from
Sumgayit, Azerbaijan. Ecotoxicology. 20, 365-376.
Rohlf, F. J., TpsDig2: Digitize coordinates of landmarks and capture outlines. Stony Brook, NY:
Department of Ecology and Evolution, State University of New York at Stony Brook, 2010.
Ruiz-Laguna, J., Vélez, J. M., Pueyo, C., Abril, N., 2016. Global gene expression profiling using
heterologous DNA microarrays to analyze alterations in the transcriptome of Mus spretus mice
living in a heavily polluted environment. Environmental Science and Pollution Research. 23,
5853-5867.
Sanchez-Chardi, A., García-Pando, M., López-Fuster, M. J., 2013. Chronic exposure to environmental
stressors induces fluctuating asymmetry in shrews inhabiting protected Mediterranean sites.
Chemosphere. 93, 916-923.
Sanchez-Chardi, A., Marques, C. C., Gabriel, S. I., Capela-Silva, F., Cabrita, A. S., López-Fuster, M.
J., Nadal, J., Mathias, M. L., 2008. Haematology, genotoxicity, enzymatic activity and
histopathology as biomarkers of metal pollution in the shrew Crocidura russula. Environmental
Pollution. 156, 1332-1339.
Sanchez-Chardi, A., Marques, C. C., Nadal, J., Mathias, M. L., 2007. Metal bioaccumulation in the
greater white-toothed shrew, Crocidura russula, inhabiting an abandoned pyrite mine site.
Chemosphere. 67, 121-130.
Sanchez-Chardi, A., Peñarroja-Matutano, C., Borrás, M., Nadal, J., 2009a. Bioaccumulation of metals
and effects of a landfill in small mammals Part III: Structural alterations. Environmental
Research. 109, 960-967.
Sanchez-Chardi, A., Ribeiro, C. A., Nadal, J., 2009b. Metals in liver and kidneys and the effects of
chronic exposure to pyrite mine pollution in the shrew Crocidura russula inhabiting the
protected wetland of Donana. Chemosphere. 76, 387-394.
Searle, J. B., Jones, C. S., Gündüz, I., Scascitelli, M., Jones, E. P., Herman, J. S., Rambau, R. V., Noble,
L. R., Berry, R. J., Giménez, M. D., Jóhannesdóttir, F., 2009. Of mice and (Viking?) men:
phylogeography of British and Irish house mice. Proceedings of the Royal Society B-Biological
Sciences. 276, 201-207.
Shields, G. F., Kocher, T. D., 1991. Phylogenetic-Relationships of North-American Ursids Based on
Analysis of Mitochondrial-DNA. Evolution. 45, 218-221.
Sholts, S. B., Korkalainen, M., Simanainen, U., Miettinen, H. M., Hakansson, H.,Viluksela, M., 2015.
In utero/lactational and adult exposures to 2,3,7,8-tetrachlorodibenzo-p-dioxin (TCDD) show
differential effects on craniofacial development and growth in rats. Toxicology. 337, 30-38.
Spjotvoll, E., Stoline, M. R., 1973. Extension of T-Method of Multiple Comparison to Include Cases
with Unequal Sample Sizes. Journal of the American Statistical Association. 68, 975-978.
Swiderski, D. L., Zelditch, M. L., 2013. The complex ontogenetic trajectory of mandibular shape in a
laboratory mouse. Journal of Anatomy. 223, 568-580.
Talmage, S. S., Walton, B. T., 1991. Small mammals as monitors of environmental contaminants. Rev
Environ Contam Toxicol. 119, 47-145.
Tamura, K., Stecher, G., Peterson, D., Filipski, A., Kumar, S., 2013. MEGA6: Molecular Evolutionary
Genetics Analysis Version 6.0. Molecular Biology and Evolution. 30, 2725-2729.
Tanzarella, C., Degrassi, F., Cristaldi, M., Moreno, S., Lascialfari, A., Chiuchiarelli, G., Ieradi, L. A.,
2001. Genotoxic damage in free-living Algerian mouse (Mus spretus) after the Coto Donana
ecological disaster. Environmental Pollution. 115, 43-48.
Tapisso, J. T., Marques, C. C., Mathias, M. L., Ramalhinho, M., 2009. Induction of micronuclei and
sister chromatid exchange in bone-marrow cells and abnormalities in sperm of Algerian mice
(Mus spretus) exposed to cadmium, lead and zinc. Mutation Research-Genetic Toxicology and
Environmental Mutagenesis. 678, 59-64.
Theodorakis, C. W., Bickham, J. W., Lamb, T., Medica, P. A., Lyne, T. B., 2001. Integration of
genotoxicity and population genetic analyses in kangaroo rats (Dipodomys merriami) exposed
to radionuclide contamination at the Nevada Test Site, USA. Environ Toxicol Chem. 20, 317-
26.
Page 75
59
Thompson, J. D., Higgins, D. G., Gibson, T. J., 1994. Clustal-W - Improving the Sensitivity of
Progressive Multiple Sequence Alignment through Sequence Weighting, Position-Specific Gap
Penalties and Weight Matrix Choice. Nucleic Acids Research. 22, 4673-4680.
Turan, B., Bayari, S., Severcan, F., Akkas, N., 2000. A biomechanical and spectroscopic study of bone
from rats with selenium deficiency and toxicity. Biometals. 13, 113-121.
van Straalen, N. M., Timmermans, M. J. T. N., 2002. Genetic variation in toxicant-stressed populations:
An evaluation of the "genetic erosion" hypothesis. Human and Ecological Risk Assessment. 8,
983-1002.
Vecchione, L., Miller, J., Cooper, G. M., Barbano, T., Cray, J., Losee, J. E., Hamrick, M. W., Sciote, j.
J., Mooney, M. P., 2010. Age-Related Changes in Craniofacial Morphology in GDF-8
(Myostatin)-Deficient Mice. Anatomical Record-Advances in Integrative Anatomy and
Evolutionary Biology. 293, 32-41.
Velickovic, M., 2004. Chromosomal aberrancy and the level of fluctuating asymmetry in black-striped
mouse (Apodemus agrarius): effects of disturbed environment. Hereditas. 140, 112-122.
Viegas-Crespo, A. M., Lopes, P. A., Pinheiro, M. T., Santos, M. C., Rodrigues, P. D., Nunes, A. C.,
Marques, C., Mathias, M. L., 2003. Hepatic elemental contents and antioxidant enzyme
activities in Algerian mice (Mus spretus) inhabiting a mine area in central Portugal. Science of
the Total Environment. 311, 101-109.
Villesen, P., 2007. FaBox: an online toolbox for FASTA sequences. Molecular Ecology Notes. 7, 965-
968.
Wickliffe, J. K., Chesser, R. K., Rodgers, B. E., Baker, R. J., 2002. Assessing the genotoxicity of chronic
environmental irradiation by using mitochondrial DNA heteroplasmy in the bank vole
(Clethrionomys glareolus) at Chornobyl, Ukraine. Environ Toxicol Chem. 21, 1249-54.
Wickliffe, J. K., Dunina-Barkovskaya, Y. V., Gaschak, S. P., Rodgers, B. E., Chesser, R. K., Bondarkov,
M., Baker, R. J., 2006. Variation in mitochondrial DNA control region haplotypes in
populations of the bank vole, Clethrionomys glareolus, living in the Chernobyl environment,
Ukraine. Environ Toxicol Chem. 25, 503-8.
Yauk, C. L., Quinn, J. S., 1996. Multilocus DNA fingerprinting reveals high rate of heritable genetic
mutation in herring gulls nesting in an industrialized urban site. Proc Natl Acad Sci U S A. 93,
12137-41.
Page 76
60
LIST OF FIGURES
Fig. 1. Location of sampling sites: Aljustrel and Preguiça mines and the Reference site (Moura).
Fig. 2 Location and description of the 19 landmarks used in the geometric morphometric analysis
in the right hemi-mandible of Mus spretus (lingual view). The dash line divides the alveolar
module of the ascending module.
Fig. 3 Plot of the canonical variate 1 (CV1) and 2 (CV2) of symmetric component (A-Aljustrel,
R-Reference site, P-Preguiça). Diagrams of shape changes associated with the extreme values of
CV1 and CV2 are shown magnified three times.
Fig. 4 Plot of the canonical variate 1 (CV1) and 2 (CV2) of symmetric component of ascending
ramus (A-Aljustrel, R-Reference site, P-Preguiça). Diagrams of shape changes associated with
the extreme values of CV1 and CV2 are shown magnified two times.
Fig. 5 Plot of the canonical variate 1 (CV1) and 2 (CV2) of symmetric component of alveolar
region (A-Aljustrel, R-Reference site, P-Preguiça). Diagrams of shape changes associated with
the extreme values of CV1 and CV2 are shown magnified two times.
Fig. 6 Variation of Shape FA between sampling sites.
Fig. 7 Median-joining networks of the Cytb (A) and the Control region (B) haplotypes found in
Mus spretus, and of the Cytb haplotypes from Crocidura russula (C). Sampling sites are coloured
differently in a grey scale. Numbers of circles correspond to haplotypes as described in Tables 4,
5 and 6. Areas of the circles are proportional to the haplotype frequency. Each bar on the
connecting lines separates two mutational events.
Fig. 8 Nucleotide and haplotype diversities for the Cytb gene and the Control region of Mus
spretus and Crocidura russula at each sampling site. The same letter means that values are
significantly different (p<0.05). A - Aljustrel, P – Preguiça, R – Reference site. Error bars
represent s.d.
Fig. 9 Frequency distributions of the number of pairwise nucleotide differences (mismatch
distributions) between haplotypes of the Cytb gene and the Control region in Mus spretus and
Crocidura russula from each sampling site (A-Aljustrel, P-Preguiça, R-Reference site).
Page 77
61
LIST OF TABLES
Table 3 Procrustes ANOVA conducted on the entire sample to evaluate the influence of measurement
error on shape data.
Table 4 Two-factor ANOVA conducted on the entire sample to evaluate the influence of measurement
error on size data.
Table 3 Symmetric centroid size (mean ± standard deviation) of the whole mandible of Mus spretus and
of the two mandibular modules, in each sampling site.
Table 4 Mahalanobis distances between sites using size-corrected data obtained in the canonical variate
analysis of symmetric and asymmetric components.
Table 5 Distribution of haplotypes, number of haplotypes (h) and Diversity indices (Hd and ) for the
Cytb gene of Mus spretus from the three sampling sites.
Table 6 Sequence diversity values for the Cytb gene and the Control region of Mus spretus and the Cytb
gene of Crocidura russula from each sampling site. A - Aljustrel, P - Preguiça, R - Reference site.
Table 7 Fixation index and sources of variation in the Cytb gene and the Control region of Mus spretus
and in the Cytb gene of Crocidura russula. A - Aljustrel, P - Preguiça, R - Reference site.
Table 8 Pairwise ST comparisons between populations from each sampling site of Mus spretus and
Crocidura russula, for the Cytb gene and the Control region.
Table 9 Distribution of haplotypes, number of haplotypes (h) and Diversity indices (Hd and ) for the
Cytb gene of Crocidura russula from the three sampling sites.
Table 10 Number of animals of Crocidura russula with length heteroplasmy in the Control region.
Table 11 Distribution of haplotypes, number of haplotypes (h) and Diversity indices (Hd and ) for the
control region of Mus spretus from the three sampling sites.
Table 12 Number of animals of Mus spretus with an insertion or deletion at position 674 of the Control
region
Page 79
63
4. FINAL CONSIDERATIONS
AND CONCLUDING REMARKS
Page 81
Final considerations and concluding remarks
65
4. Final considerations and concluding remarks
4.1. Final considerations
Several works have warned of the risks and hazards associated with abandoned mining areas
due to the presence of heavy metals (Marques, 2008, Marques et al., 2008, 2007, Sánchez-Chardi et al.,
2008, 2007). These metals come from mine tailings and scorias, becoming unpredictable sources of
contamination. Portugal, despite having a long mining history, has verified a decline in this activity over
the last decades, with consequent abandonment of mining areas without recovery plans. The two mines
studied in this work, the Preguiça and the Aljustrel mines, are good examples of how these fluctuations
influenced exploration, leading to cyclical mining processes interrupted with new reopening and rapid
expansion of mining areas, followed by closure without planned recovery.
Although the regulation and concession of the recovery of abandoned mines date from 2001
(Decreto-Lei n.o 198-A/2001 of July 6), until then this practice of abandonment without a recovery plan
was common, leaving a heavy legacy. Currently, a strategic plan for the rehabilitation of abandoned
mining areas is in force, starting in 2014 with the concession deadline of 2020, the year in which it is
expected to have acted on the main degraded mining areas. Portugal, although it has made some efforts
to address this environmental problem, with serious risks to the health and safety of the population, still
has a long way to go, regarding the recovery of these areas.
The present work reinforces and once again warns of the importance of abandoned mines
recovery planes, and of the relevance of the rehabilitation of areas that have long been deactivated. As
mentioned by Santos Oliveira (2002), these areas could be a risk factor for human health and safety,
increasing with the time of abandonment. With the present work, we add that mines without
rehabilitation are continued sources of pollution, in which the harmful effects of mining remain active
and may present high costs to ecological communities.
The use of small mammals as environmental biomonitors allows assessing the effects of
medium-long term contaminants in real-time with a realistic measure of toxicity on wildlife populations.
The two species used in the present study had already been widely used as sentinels or biomonitors in
other studies. However, the present study strengthens not only the relevance and usefulness of Crocidura
russula and Mus spretus in toxicological studies but also its relevance in the field of evolutionary
toxicology studies, in particular in the assessment of toxicological effects at the population level. The
results of this study confirm that in addition to individual level changes, Crocidura russula and Mus
spretus populations of Aljustrel and Preguiça mine acquired alterations in other organizational levels,
having been observed variations in the genetic patterns of these populations and morphological
alterations of the mandible in Mus spretus. These results show that in a relatively short time, heavy metal
pollution is interfering with or changing the evolutionary history of the populations, with unknown
consequences.
The understanding of the response at the genetic level of the population was only possible
because previous work on biomarkers of exposure, susceptibility, and effect an individual level were
performed. The use of several biomarkers allows a holistic and more integrated view of the problem,
alerting the various levels of direct and indirect effects that contaminants can have on individuals and
populations. This type of study strengthens and enables higher-level studies, such as at the community
or ecosystem level, to be possible.
Page 82
Final considerations and concluding remarks
66
As mentioned earlier, the measurement of the effect at the population level implies biomarkers
adjusted to this organizational level. Few studies on the genetic effects of pollution on wildlife
populations were performed, especially in terrestrial territories. The present study was the first to
investigate the impact of abandoned mines on the population level in Crocidura russula and Mus
spretus. The study of genetic diversity allows us to analyze the implications that heavy metals can have
on populations. Several studies have shown that different mechanisms can disturb populations affecting
genetic variability (Bickham, 2011). As seen in the present work different characteristics of mines can
lead to different population responses. Populations exposed to heavy metals may result in population
bottleneck events; increased mutation rates due to contaminants (having a deleterious effect on
individuals' fitness); an increase in genetic diversity due to the gene flow through introducing new alleles
into the gene pool of the population; or adapt by becoming resistant populations to contaminants.
Whatever the population response to the contaminants, this can create costs at the ecological level, which
may affect other trophic levels.
Evolutionary toxicology studies are complex studies since different mechanisms may lead to
similar responses and similar mechanisms leading to different responses (van Straalen and Timmermans,
2002). The comparison of the various studies is difficult, since there are a number of variables that
determine the response of the population to: types of metals, degree of disturbance (concentration,
duration of exposure, route of entry, length of exposure, magnitude), exposure conditions (single or
metal mixtures), the marker used in the study, the different ecosystems and species susceptibility
(Mussali-Galante et al., 2014). The fact that there are few works in terrestrial mammals and several
factors that can interact and influence the response of the population makes it difficult to predict the
genetic response of the particular species to a contaminated environment.
The chronic exposure of populations can change the dynamics of populations and may have
irreversible costs. Population genetic studies allow an evolutionary view of the impact that
anthropogenic stress can have on wild populations. However, only through a growing number of studies
that it is increasingly possible to understand population responses under different conditions better. This
type of work is fundamental for the realization of environmental protection programs and reclamation
of recovery plans for areas that could be potential sources of contamination. This study reinforces the
importance of the rehabilitation of abandoned mining areas, mainly areas that do not seem to be serious
environmental problems or have been deactivated for a long time.
Several studies on the health risks of abandoned mines have been carried out but they mainly
focused on environmental compartments or the individual effect. Nonetheless, few have presented a
holistic approach, allowing a comprehensive evaluation of the effects of heavy metal exposure to
medium-long term, and this is one of the strengths of the present study. With this work, we reinforce
the importance of using sentinels to monitor the possible health risk of resident human populations near
abandoned mines, since these sites continue to have harmful effects even after several years of
inactivation. These sites may cause adverse effects on people’s health, and may in the long run translate,
for instance, into an increase in the number of cancer cases (Coelho et al., 2007). Few studies have
established a relationship between abandoned mines and the problems in human health, namely in the
number of cancers in resident populations near of these areas due to the high number of variables
influencing the analysis. However, following our findings, an effort should be made to do so to gain a
broader understanding of the real problem of long-term abandoned mines in human health.
Once again, the importance of toxicological studies should be reinforced, not only in the
preservation and conservation of wild populations but also in protection of human populations´ health
living near these sites. Since rapid changes occur in a short time with possible ecological costs, only
Page 83
Final considerations and concluding remarks
67
through continuous biomonitoring is it possible to alert and act efficiently to avoid adverse effects both
individually and at other organizational levels.
4.2. Concluding remarks
1. Major knowledge of the negative impact that long-term chronic exposure has on wildlife populations.
2. Abandoned mines deactivated over an extended period remain sources of contamination.
3. Study of two biomarkers at the population level: morphological and genetic variation.
4. The first population study on genetic diversity in Crocidura russula and Mus spretus, living in two
abandoned mines, unpredictable sources of environmental contamination.
5. The genetic structure and genetic diversity may be used as a population level biomarker to elucidate
changes in genetic patterns of exposed populations.
6. Reference values for the analysed biomarkers allowing future comparisons.
7. The first study of geometric morphometry of the mandible in Mus spretus.
8. Methodological proposal to study fluctuating asymmetry in populations with antisymmetry.
9. The fact that FA has not been observed, but rather morphological variations and genetic variations
in populations reinforce the use of more than one biomarker as a monitoring tool.
10. Apparently, the existence of antisymmetry in the mandible of Mus spretus, which may be a
characteristic of the species.
11. Strengthening the importance of monitoring sites with potential risks to wildlife and human health.
12. Potential use of Crocidura russula and Mus spretus as a species for monitoring environmental quality
since in both species genetic population responses to polluted environmental using two mtDNA
genetic biomarkers (Cytb and CR) were found, as well as morphological variation in Mus spretus.
Page 84
Final considerations and concluding remarks
68
4.3. Future perspectives
Portugal has a heavy legacy of abandoned mines. These areas are unpredictable polluted areas
of toxicological hazards which make them one of the greatest contemporary environmental problems.
Many studies on cellular, molecular and individual effect were performed to understand the adverse
effects it has on the individual’s health. There is, however, little information about the chronical
exposure effect to heavy metals on the level of other biological organizations.
In this way, to understand the impact that heavy metals may have at the population level in these
polluted sites, two levels of biomarkers were used in the present study: one genetic and other
morphological. This combination of multiple levels of biomarkers reinforces the importance of using a
battery of biomarkers to obtain a more holistic view of the problem and more suitable assessment of the
response of the populations.
Taking into count the high number of abandoned mines in Portugal and the risks that they
represent to the health and sustainability of populations, it is recommendable a continuous monitoring
of these areas. These studies must be carried out namely in mines that “apparently” does not have a
hazard or are deactivated at a long time. As seen throughout the present study, old mines without
rehabilitation continue to be an environmental problem with unpredictable ecological cost. Few works
in evolutionary toxicology on terrestrial animals were performed and much less that cover a period that
accompanies the evolutionary response of a population. Additionally, since the data from present work
have 15 years, it would be interesting to carry out a new biomonitoring adding more reference areas.
Incorporate environmental variables and ecological parameters into the data (such as population density,
reproduction, and diet), allows a better ecotoxicological characterization and interpretation of the results.
Finally, it is important to emphasize the antisymmetry found in Mus spretus. This particularity
not yet reported for this species should be confirmed through a wider sampling, including other points
of the Iberian Peninsula. The hypothesis of this asymmetry may be linked to behavior effect, reinforces
the importance that the behavioral studies have in the interpretation of the evolutionary history of the
species.
As seen throughout this work, evolutionary ecotoxicology is a well-developed science but with
some complexity due to the limited number of works carried out on wildlife populations and the many
factors that may lead to different population responses. Biomonitoring once again proved to be a useful
and crucial tool for a rapid and efficient action in species conservation as well as environmental toxicity
alert, namely to the man. This work warns for the importance of recovery plans after the mines shutdown
and remediation actions for abandoned mines to mitigate adverse impacts.
Page 85
References
69
References
Agarwal, S., Sohal, R.S., 1994. DNA oxidative damage and life expectancy in houseflies. Proc. Natl.
Acad. Sci. U. S. A. 91, 12332–5.
Ameixa, L.P., 2017. Recuperação ambiental das antigas área mineiras. Evento anual 2017 do Portugal
2020.
Andersen, J.K., 2004. Oxidative stress in neurodegeneration: cause or consequence? Nat. Med. 10
Suppl, S18-25.
Anderson, P.S.L., Renaud, S., Rayfield, E.J., 2014. Adaptive plasticity in the mouse mandible. BMC
Evol. Biol. 14, 85.
Arif, I.A., Khan, H.A., 2009. Molecular markers for biodiversity analysis of wildlife animals : a brief
review. Anim. Biodivers. Conserv. 32, 9–17.
Atchley, W., Hall, B., 1991. A model for development and evolution of complex morphological
structures. Biol. Rev. 66, 101–157.
Atchley, W.R., Plummer, A.A., Riska, B., 1985. Genetics of mandible form in the mouse. Genetics 111,
555–557.
Badyaev, A. V, Foresman, K.R., Fernandes, M. V, 2000. Stress and developmental stability: vegetation
removal causes increased fluctuating asymmetry in shrews. Ecology 81, 336–345.
Badyaev, a V, Foresman, K.R., 2000. Extreme environmental change and evolution: stress-induced
morphological variation is strongly concordant with patterns of evolutionary divergence in shrew
mandibles. Proc. Biol. Sci. 267, 371–377.
Baker, R.J., Bickham, A.M., Bondarkov, M., Gaschak, S.P., Matson, C.W., Rodgers, B.E., Wickliffe,
J.K., Chesser, R.K., 2001. Consequences of polluted environments on population structure: The
bank vole (Clethrionomys glareolus) at Chornobyl. Ecotoxicology 10, 211–216.
Baker, R.J., Dewoody, J.A., Wright, A.J., Chesser, R.K., 1999. On the utility of heteroplasmy in
genotoxicity studies: an example from Chornobyl. Ecotoxicology 8, 301–309.
Balloux, F., Goudet, J., Perrin, N., 1998. Breeding system and genetic variance in the monogamous,
semi-social shrew, Crocidura russula. Evolution (N. Y). 52, 1230–1235.
Beasley, D.A.E., Bonisoli-Alquati, A., Mousseau, T.A., 2013. The use of fluctuating asymmetry as a
measure of environmentally induced developmental instability: A meta-analysis. Ecol. Indic. 30,
218–226.
Belyaeva, E.A., Sokolova, T. V., Emelyanova, L. V., Zakharova, I.O., 2012. Mitochondrial electron
transport chain in heavy metal-induced neurotoxicity: effects of cadmium, mercury, and copper.
Sci. World J. 2012, 1–14.
Berckmoes, V., Scheirs, J., Jordaens, K., Blust, R., Backeljau, T., Verhagen, R., 2005. Effects of
environmental pollution on microsatellite DNA diversity in wood mouse (Apodemus sylvaticus)
populations. Environ. Toxicol. Chem. 24, 2898–2907.
Bickham, J.W., 2011. The four cornerstones of evolutionary toxicology. Ecotoxicology 20, 497–502.
Bickham, J.W., Sandu, S., Hebert, P.D.N., Chikhi, L., Athwal, R., 2000. Effects of chemical
contaminants on genetic diversity in natural populations : implications for biomonitoring and
ecotoxicology. Mutat. Res. 463, 33–51.
Bickham, J.W., Smolen, M.J., 1994. Somatic and heritable effects of environmental genotoxins and the
emergence of evolutionary toxicology. Environ. Health Perspect. 102, 25–28.
Blagojević, J., Vujošević, M., 2004. B chromosomes and developmental homeostasis in the yellow-
necked mouse, Apodemus flavicollis (Rodentia, Mammalia): effects on nonmetric traits. Heredity
(Edinb). 93, 249–254.
Blanckenhorn, W.U., Reusch, T., Mühlhäuser, C., 1998. Fluctuating asymmetry, body size and sexual
selection in the dung fly Sepsis cynipsea - Testing the good genes assumptions and predictions. J.
Evol. Biol. 11, 735–753.
Bookstein, F.L., 1991. Morphometric tools for landmark data. Geometry and biology, First. ed,
Cambridge University Press. Cambridge University Press, New York.
Byrne, R.A., Kuba, M.J., Meisel, D. V., 2004. Lateralized eye use in Octopus vulgaris shows
antisymmetrical distribution. Anim. Behav. 68, 1107–1114.
Cantoni, D., Vogel, P., 1989. Social organization and mating system of free-ranging, greater white-
Page 86
References
70
toothed shrews, Crocidura russula. Anim. Behav. 38, 205–214.
Carvalho, D., Goinhas, J.A.C., Schermerhorn, L.J.G., 1971. Principais jazigos minerais do sul de
Portugal. I Congresso Hispano-Luso-Americano de geologia económica Livro-Guia da Excursão
N.o4. Direcção-Geral de Minas e Serviços Geologicos, Lisboa.
Carvalho, F.P., 2017. Mining industry and sustainable development: Time for change. Food Energy
Secur. 6, 61–77.
Cheverud, J.M., Cheverud, J.M., Routman, E.J., Routman, E.J., Irschick, D.J., Irschick, D.J., 1997.
Pleiotropic effects of individual gene loci on mandibular morphology. Evolution (N. Y). 51, 2006–
2016.
Cheverud, J.M., Hartman, S.E., Richtsmeier, J.T., Atchley, W.R., 1991. A quantitative genetic analysis
of localized morphology in mandibles of inbred mice using finite element scaling. J. Craniofac.
Genet. Dev. Biol. 11, 122–137.
CMA, 2017. Geologia. Câmara Municipal de Aljustrel. http://www.mun-
aljustrel.pt/menu/188/geologia.aspx (accessed 8.13.17).
Coelho, P., Silva, S., Roma-Torres, J., Costa, C., Henriques, A., Teixeira, J., Gomes, M., Mayan, O.,
2007. Health impact of living near an abandoned mine - Case study: Jales mines. Int. J. Hyg.
Environ. Health 210, 399–402.
Cooke, M.S., Evans, M.D., Dizdaroglu, M., Lunec, J., 2003. Oxidative DNA damage: mechanisms,
mutation, and disease. FASEB J. 17, 1195–1214.
Degli Esposti, M., De Vries, S., Crimi, M., Ghelli, A., Patarnello, T., Meyer, A., 1993. Mitochondrial
cytochrome b: evolution and structure of the protein. Biochim. Biophys. Acta (BBA)-
Bioenergetics 1143, 243–271.
Depledge, M.H., 1994. Genotypic toxicity: Implications for individuals and populations. Environ.
Health Perspect. 102, 101–104.
Dumoulin, R., Sagnol, I., Ferlin, T., Bozon, D., Stepien, G., Mousson, B., 1996. A novel gly290asp
mitochondrial cytochromebmutation linked to a complex III deficiency in progressive exercise
intolerance. Mol. Cell. Probes 10, 389–391.
EDM, 2011. A herança das minas abandonadas. O enquadramento e a actuação em Portugal. Direcção
Geral de Energia e Geologia Empresa de Desenvolvimento Mineiro.
Eeva, T., Belskii, E., Kuranov, B., 2006. Environmental pollution affects genetic diversity in wild bird
populations. Mutat. Res. Toxicol. Environ. Mutagen. 608, 8–15.
Eeva, T., Tanhuanpää, S., Råbergh, C., Airaksinen, S., Nikinmaa, M., Lehikoinen, E., 2000. Biomarkers
and fluctuating asymmetry as indicators of pollution-induced stress in two hole-nesting passerines.
Funct. Ecol. 14, 235–243.
Evenden, A.J., Depledge, M.H., 1997. Genetic susceptibility in ecosystems: the challenge for
ecotoxicology. Environ. Health Perspect. 105, 849–854.
Frankham, R., 1996. Relationship of genetic variation to population size in wildlife. Conserv. Biol. 10,
1500–1508.
Fumagalli, L., Taberlet, P., Favre, L., Hausser, J., 1996. Origin and evolution of homologous repeated
sequences in the mitochondrial DNA control region of shrews. Mol. Biol. Evol. 13, 31–46.
Giska, I., Babik, W., van Gestel, C.A.M., van Straalen, N.M., Laskowski, R., 2015. Genome-wide
genetic diversity of rove beetle populations along a metal pollution gradient. Ecotoxicol. Environ.
Saf. 119, 98–105.
Graham, J.H., Freeman, D.C., Emlen, J.M., 1993. Antisymmetry, directional asymmetry, and dynamic
morphogenesis. Genetica 89, 121–137.
Graham, J.H., Raz, S., Hel-Or, H., Nevo, E., 2010. Fluctuating asymmetry: Methods, theory, and
applications. Symmetry (Basel). 2, 466–540.
Gray, N.F., 1997. Environmental impact and remediation of acid mine drainage: a management problem.
Environ. Geol. 30, 62–71.
Gray, S.J., Hurst, J.L., Stidworthy, R., Smith, J., Preston, R., MacDougall, R., 1998. Microhabitat and
spatial dispersion of the grassland mouse (Mus spretus Lataste). J. Zool. 246, 299–308.
Harshman, L.G., Haberer, B.A., 2000. Oxidative stress resistance a robust correlated response to
selection in extended longevity lines of Drosophila melanogaster? Journals Gerontol. Biol. Sci.
55, B415–B417.
Hatch, 2013. Environmental analysis of the mining industry in Canada. Canada.
Page 87
References
71
Henriques, F.S., Fernandes, J.C., 1991. Metal Uptake and Distribution in Rush (Juncus-Conglomeratus
L) Plants Growing in Pyrites Mine Tailings at Lousal, Portugal. Sci. Total Environ. 102, 253–260.
Hofmann, T., Schuwirth, N., 2008. Zn and Pb release of sphalerite (ZnS)-bearing mine waste tailings.
J. Soils Sediments 8, 433–441.
Holt, E.A., Miller, S.A., 2010. Bioindicators: using organisms to measure environmental impacts. Nat.
Educ. Knowl. 3, 1–8.
Irwin, D.M., Kocher, T.D., Wilson, A.C., 1991. Evolution of the cytochrome b gene of mammals. J.
Mol. Evol. 32, 128–144.
Ji, K., Kim, J., Lee, M., Park, S., Kwon, H.J., Cheong, H.K., Jang, J.Y., Kim, D.S., Yu, S., Kim, Y.W.,
Lee, K.Y., Yang, S.O., Jhung, I.J., Yang, W.H., Paek, D.H., Hong, Y.C., Choi, K., 2013.
Assessment of exposure to heavy metals and health risks among residents near abandoned metal
mines in Goseong, Korea. Environ. Pollut. 178, 322–328.
John, D.A., Leventhal, J.S., 1995. Bioavailability of metals. United States Geol. Surv. 2, 10–18.
Kendall, R.J., Anderson, T.A., Baker, R.J., Bens, C.M., Carr, J.A., Chiodo, L.A., Cobb, G.P., Dickerson,
R.L., Dixon, K.R., Frame, L.T., Hooper, M.J., Martins, C.F., Mcmurry, S.T., Patino, R., Smith,
E.E., Theodorakis, C.W., 2001. Toxicology: The Basic Science of Poisons. Sixth edition., in:
Klaassen, C.D. (Ed.), Casarett and Doull’s Toxicology: The Basis Science of Poisons. McGraw-
Hill Publishing, New York, pp. 1013–1045.
Kim, S., Kwon, H.J., Cheong, H.K., Choi, K., Jang, J.Y., Jeong, W.C., Kim, D.S., Yu, S., Kim, Y.W.,
Lee, K.Y., Yang, S.O., Ik, J.J., Yang, W.H., Hong, Y.C., 2008. Investigation on health effects of
an abandoned metal mine. J. Korean Med. Sci. 23, 452–458.
Klingenberg, C.P., 2016. Size, shape, and form: concepts of allometry in geometric morphometrics.
Dev. Genes Evol. 226, 113–137.
Klingenberg, C.P., 2015. Analyzing fluctuating asymmetry with geometric morphometrics: Concepts,
methods, and applications. Symmetry (Basel). 7, 843–934.
Klingenberg, C.P., 2010. Evolution and development of shape: integrating quantitative approaches. Nat.
Rev. Genet. 11, 623–635.
Klingenberg, C.P., 2003. Developmental perspective on developmental instability: theory, models and
mechanisms, in: Polak, M. (Ed.), Developmental Instability: causes and consequences. Oxford
University Press, New York, pp. 14–34.
Klingenberg, C.P., Leamy, L.., Cheverud, J.M., 2004. Integration and modularity of quantitative trait
locus effects on geometric shape in the mouse mandible. Genetics 166, 1909–1921.
Klingenberg, C.P., Navarro, N., 2012. Development of the mouse mandible: a model system for complex
morphological structures, in: Macholán, M., Baird, S.J.E., Munclinger, P., Piálek, J. (Eds.),
Evolution of the House Mouse. Cambridge University Press, Cambridge, pp. 135–149.
Levengood, J.M., Heske, E.J., 2008. Heavy metal exposure, reproductive activity, and demographic
patterns in white-footed mice (Peromyscus leucopus) inhabiting a contaminated floodplain
wetland. Sci. Total Environ. 389, 320–328.
Lopes, P.A., Viegas-Crespo, A.M., Nunes, A.., Santos, M.C., Mathias, M. da L., 2002. Influence of age
, sex , and sexual activity on trace element levels and antioxidant enzyme activities in field mice
(Apodemus sylvaticus and Mus spretus). Biol. Trace Elem. Res. 85, 227–239.
Luca, L., Roberto, D., Francesca, S.M., Francesca, P., 2003. Consistency of diet and its effects on
mandibular morphogenesis in the young rat. Prog. Orthod. 4, 3–7.
Lucky, N.S., Ihara, R., Yamaoka, K., Hori, M., 2012. Behavioral laterality and morphological
asymmetry in the cuttlefish, Sepia lycidas. Zoolog. Sci. 29, 286–92.
Marques, C.C., 2008. Small mammals as bioindicators in the assessment of toxicological effects
resulting from the exposure to heavy metals. PhD Thesis, Departamento de Biologia Animal,
Faculdade de Ciências. Universidade de Lisboa.
Marques, C.C., Gabriel, S.I., Pinheiro, T., Viegas-Crespo, A.M., Mathias, M. da L., Bebianno, M.J.,
2008. Metallothionein levels in Algerian mice (Mus spretus) exposed to elemental pollution: An
ecophysiological approach. Chemosphere 71, 1340–1347.
Marques, C.C., Sánchez-Chardi, A., Gabriel, S.I., Nadal, J., Viegas-Crespo, A.M., da Luz Mathias, M.,
2007. How does the greater white-toothed shrew, Crocidura russula, responds to long-term heavy
metal contamination? - A case study. Sci. Total Environ. 376, 128–133.
Martins, A.M.I., 2013a. Portuguese Ossa-Morena Zone Mining. mindat.org Hudson Inst. Mineral.
Page 88
References
72
https://www.mindat.org/article.php/1631/Portuguese+Ossa-Morena+Zone+Mining (accessed
8.13.17).
Martins, A.M.I., 2013b. Mining field of Preguiça and Herdade de Vila Ruiva. mindat.org Hudson Inst.
Mineral.https://www.mindat.org/article.php/1798/Mining+field+of+Preguiça+and+Herdade+de+
Vila+Ruiva (accessed 8.13.17).
Matson, C.W., Lambert, M.M., McDonald, T.J., Autenrieth, R.L., Donnelly, K.C., Islamzadeh, A.,
Politov, D.I., Bickham, J.W., 2006. Evolutionary toxicology: Population-level effects of chronic
contaminant exposure on the marsh frogs (Rana ridibunda) of Azerbaijan. Environ. Health
Perspect. 114, 547–552.
Matson, C.W., Rodgers, B.E., Chesser, R.K., Baker, R.J., 2000. Genetic diversity of Clethrionomys
Glareolus populations from highly contaminated sites in the Chornobyl region, Ukraine. Environ.
Toxicol. Chem. 19, 2130–2135.
Mavropoulos, A., Ammann, P., Bresin, A., Kiliaridis, S., 2005. Masticatory demands induce regio-
specific changes in mandibular bone density in growing rats. Angle Orthod. 75, 625–630.
Mavropoulos, A., Bresin, A., Kiliaridis, S., 2004. Morphometric analysis of the mandible in growing
rats with different masticatory functional demands: adaptation to an upper posterior bite block.
Eur. J. Oral Sci. 112, 259–266.
McDonald, E., Watterson, A., Tyler, A.N., McArthur, J., Marion Scott, E., 2014. Multi-factorial
influences on sex ratio: a spatio-temporal investigation of endocrine disruptor pollution and
neighborhood stress. Int. J. Occup. Environ. Health 20, 235–246.
McKenzie, J.A., Clarke, G.M., 1988. Diazinon resistance, fluctuating asymmetry and fitness in the
australian sheep blowfly, Lucilia cuprina. Genetics 120, 213–220.
Medina, M.H., Correa, J.A., Barata, C., 2007. Micro-evolution due to pollution: possible consequences
for ecosystem responses to toxic stress. Chemosphere 67, 2105–2114.
Meeks, H.N., Chesser, R.K., Rodgers, B.E., Gaschak, S., Baker, R.J., 2009. Understanding the genetic
consequences of environmental toxicant exposure: Chernobyl as a model system. Environ.
Toxicol. Chem. 28, 1982–94.
Meyer, J.N., Leung, M.C.K., Rooney, J.P., Sendoel, A., Hengartner, M.O., Kisby, G.E., Bess, A.S.,
2013. Mitochondria as a target of environmental toxicants. Toxicol. Sci. 134, 1–17.
Mhlongo, S.E., Amponsah-Dacosta, F., 2015. A review of problems and solutions of abandoned mines
in South Africa. Int. J. Mining, Reclam. Environ. 930, 1–16.
Michaux, J., Chevret, P., Renaud, S., 2007. Morphological diversity of Old World rats and mice
(Rodentia, Muridae) mandible in relation with phylogeny and adaptation. J. Zool. Syst. Evol. Res.
45, 263–279.
Mitton, J.B., 1993. Enzyme heterozygosity, metabolism, and developmental stability. Genetica 89, 47–
65.
Møller, A.P., 1997. Developmental stability and fitness : a review. Am. Nat. 149, 916–932.
Moller, A.P., Pomiankowski, A., 1993. Fluctuating asymmetry and sexual selection. Genetica 89, 267–
279.
Morris, M.R., 1998. Female preference for trait symmetry in addition to trait size in swordtail fish. Proc.
R. Soc. Lond. B 265, 907–911.
Morse, J.W., Luther, G.W., 1999. Chemical influence on trace metalsulphide interactions in anoxic
sediments. Geochim. Cosmochim. Acta 63, 3373–3378.
Mussali-Galante, P., Tovar-Sánchez, E., Valverde, M., Rojas del Castillo, E., 2013a. Biomarkers of
exposure for assessing environmental metal pollution: from molecules to ecosystems. Rev. Int.
Contam. Ambie. 29, 117–140.
Mussali-Galante, P., Tovar-Sánchez, E., Valverde, M., Valencia-Cuevas, L., Rojas, E., 2013b. Evidence
of population genetic effects in Peromyscus melanophrys chronically exposed to mine tailings in
Morelos, Mexico. Environ. Sci. Pollut. Res. 20, 7666–7679.
Nunes, A.C., Auffray, J.C., Mathias, M.L., 2001a. Developmental instability in a riparian population of
the Algerian mouse (Mus spretus) associated with a heavy metal-polluted area in central Portugal.
Arch. Environ. Contam. Toxicol. 41, 515–521.
Nunes, A.C., Da Luz Mathias, M., Crespo, A.M., 2001b. Morphological and haematological parameters
in the Algerian mouse (Mus spretus) inhabiting an area contaminated with heavy metals. Environ.
Pollut. 113, 87–93.
Page 89
References
73
O’Brien, D.J., Kaneene, J.B., Poppenga, R.H., 1993. The use of mammals as sentinels for human
exposure to toxic contaminants in the environment. Environ. Health Perspect. 99, 351–368.
Palmer, A.R., 1996. From symmetry to asymmetry: phylogenetic patterns of asymmetry variation in
animals and their evolutionary significance. Proc. Natl. Acad. Sci. U. S. A. 93, 14279–14286.
Palmer, A.R., Strobeck, C., 1986. Fluctuating asymmetry: measurement, analysis, patterns. Annu. Rev.
Ecol. Syst. 17, 391–421.
Palomo, L.J., Justo, E.R., Vargas, J.., 2009. Mus spretus (Rodentia: Muridae). Mamm. Species 840, 1–
10.
Parsons, P.A., 1990. Fluctuating asymmetry: an epigenetic measure of stress. Biol. Rev. 65, 131–145.
Prá, D., Franke, S.I.R., Giulian, R., Yoneama, M.L., Dias, J.F., Erdtmann, B., Henriques, J.A.P., 2008.
Genotoxicity and mutagenicity of iron and copper in mice. BioMetals 21, 289–297.
Raikwar, M., Kumar, P., Singh, M., 2008. Toxic effect of heavy metals in livestock health. Vet. World
1, 28–30.
Ramalhinho, M.G., Libois, R., Fons, R., 1999. Crocidura russula (HERMANN, 1780), the greater
white-toothed shrew, in: Mitchell-Jones, A.., Amori, G., Bogdanowicz, W., Kryštufek, B.,
Reijnders, P.J.H., Spitzenberger, F., Stubbe, M., Thissen, J.B.M., Vohralik, V., Zima, J. (Eds.),
The Atlas of European Mammals. Pyser Natural History, London, pp. 68–69.
Reif, J.S., 2011. Animal sentinels for environmental and public health. Public Health Rep. 126, 50–57.
Renaud, S., Auffray, J.C., 2010. Adaptation and plasticity in insular evolution of the house mouse
mandible. J. Zool. Syst. Evol. Res. 48, 138–150.
Rose, W., Anderson, S., 2005. Genetic ecotoxicology, in: Wexler, P. (Ed.), Encyclopedia of Toxicology
2nd Edition. Elsevier Ltd, Oxford, pp. 126–132.
Sánchez-Chardi, A., García-Pando, M., López-Fuster, M.J., 2013. Chronic exposure to environmental
stressors induces fluctuating asymmetry in shrews inhabiting protected mediterranean sites.
Chemosphere 93, 916–923.
Sánchez-Chardi, A., Marques, C.C., Gabriel, S.I., Capela-Silva, F., Cabrita, A.S., López-Fuster, M.J.,
Nadal, J., Mathias, M.L., 2008. Haematology, genotoxicity, enzymatic activity and histopathology
as biomarkers of metal pollution in the shrew Crocidura russula. Environ. Pollut. 156, 1332–1339.
Sánchez-Chardi, A., Marques, C.C., Nadal, J., da Luz Mathias, M., 2007. Metal bioaccumulation in the
greater white-toothed shrew, Crocidura russula, inhabiting an abandoned pyrite mine site.
Chemosphere 67, 121–130.
Santos Oliveira, J.M., Farinha, J., Matos, J.X., Ávila, P., Rosa, C., Canto Machado, M.J., Daniel, E.,
Martins, L., Machado Leite, M.R., Santos Oliveira, J.L., Avila, E., Machado, M.J.C., Daniel, E. 5,
Leite, L.R.M., 2002. Diagnóstico ambiental das principais areas mineiras degradadas do país., in:
Boletim Das Minas. Instituto Geológico e Mineiro, Lisboa, pp. 67–85.
Sbisà, E., Tanzariello, F., Reyes, A., Pesole, G., Saccone, C., 1997. Mammalian mitochondrial D-loop
region structural analysis: identification of new conserved sequences and their functional and
evolutionary implications. Gene 205, 125–140.
Scheirs, J., De Coen, A., Covaci, A., Beernaert, J., Kayawe, V.M., Caturla, M., De Wolf, H., Baert, P.,
Van Oostveldt, P., Verhagen, R., Blust, R., De Coen, W., 2006. Genotoxicity in wood mice
(Apodemus sylvaticus) along a pollution gradient: exposure-, age-, and gender-related effects.
Environ. Toxicol. Chem. 25, 2154–2162.
Shugart, L.R., Theodorakis, C.W., Bickham, A.M., Bickham, J.W., 2003. Genetic effects of contaminant
exposure and potential impacts on animal populations, in: Hoffman, D.J., Rattner, B.A., Jr.,
G.A.B., Jr., J.C. (Eds.), Handbook of Ecotoxicology. LewisPublisher, Boca Raton, pp. 1129–1147.
Siegel, M.I., Mooney, M.P., Taylor, A.B., 1992. Dental and skeletal reduction as a consequence of
environmental stress. Acta Zool. Fenn. 191, 145–149.
Sies, H., 1993. Strategies of antioxidant defense. Eur. J. Biochem. 215, 213–219.
Talmage, S.S., Walton, B.T., 1991. Reviews of environmental contamination and toxicology, in: Ware,
G.W. (Ed.), Reviews of Environmental Contamination and Toxicology. Springer-Verlag New
York Inc., New York, p. 143.
Tanaka, E., Sano, R., Kawai, N., Langenbach, G.E.J., Brugman, P., Tanne, K., Van Eijden, T.M.G.J.,
2007. Effect of food consistency on the degree of mineralization in the rat mandible. Ann. Biomed.
Eng. 35, 1617–1621.
Tapisso, J.T., Marques, C.C., Mathias, M. da L., Ramalhinho, M. da G., 2009. Induction of micronuclei
Page 90
References
74
and sister chromatid exchange in bone-marrow cells and abnormalities in sperm of Algerian mice
(Mus spretus) exposed to cadmium, lead and zinc. Mutat. Res. - Genet. Toxicol. Environ. Mutagen.
678, 59–64.
Theodorakis, C.W., Bickham, J.W., Lamb, T., Medica, P.A., Lyne, T.B., 2001. Integration of
genotoxicity and population genetic analyses in kangaroo rats (Dipodomys Merriami) exposed to
radionuclide contamination at the Nevada test site, Usa. Environ. Toxicol. Chem. 20, 317–326.
Theodorakis, C.W., Gordon Blaylock, B., Shugart, L.R., 1997. Genetic ecotoxicology I: DNA integrity
and reproduction in mosquitofish exposed in situ to radionuclides. Ecotoxicology 6, 205–218.
Tornos, F., 2006. Environment of formation and styles of volcanogenic massive sulfides: The Iberian
Pyrite Belt. Ore Geol. Rev. 28, 259–307.
Tovar-Sánchez, E., Cervantes, L.T., Martínez, C., Rojas, E., Valverde, M., Ortiz-Hernández, M.L.,
Mussali-Galante, P., 2012. Comparison of two wild rodent species as sentinels of environmental
contamination by mine tailings. Environ. Sci. Pollut. Res. 19, 1677–1686.
UNEP, COCHILCO, 2001. Abandoned Mine - Problems, issues and policy challenges for decision
makers. Santiago, Chile.
Valavanidis, A., Vlachogianni, T., 2010. Metal pollution in ecosystems. Ecotoxicology studies and risk
assessment in the marine environment. Sci. Adv. Environ. Toxicol. Ecotoxicol. issues 1–9.
Van Houten, B., Woshner, V., Santos, J.H., 2006. Role of mitochondrial DNA in toxic responses to
oxidative stress. DNA Repair (Amst). 5, 145–152.
Van Straalen, N., Timmermans, M., 2002. Genetic variation in toxicant-stressed populations: an
evaluation of the “genetice erosion” hypothesis. Hum. Ecol. Risk Assess. 8, 983–1002.
Van Valen, L., 1962. A study of fluctuating asymmetry. Evolution (N. Y). 16, 125–142.
Velickovic, M., 2007. Measures of the developmental stability, body size and body condition in the
black-striped mouse (Apodemus agrarius) as indicators of a disturbed environment in northern
Serbia. Belgian J. Zool. 137, 147–156.
Velickovic, M., 2004. Chromosomal aberrancy and the level of fluctuating asymmetry in black-striped
mouse (Apodemus agrarius): effects of disturbed environment. Hereditas 140, 112–122.
Viegas-Crespo, A.M., Lopes, P.A., Pinheiro, M.T., Santos, M.C., Rodrigues, P.D., Nunes, A.C.,
Marques, C., Mathias, M.L., 2003. Hepatic elemental contents and antioxidant enzyme activities
in Algerian mice (Mus spretus) inhabiting a mine area in central Portugal. Sci. Total Environ. 311,
101–109.
WHO, 2007. Health risks of heavy metals from long-range transboundary air polution, WHO.
Copenhaga.
WHO, 1996. Trace elements in human nutrition and health, Trace elements in human nutrition and
health. Geneva.
Wren, C.D., 1986. Mammals as biological monitors of environmental metal levels. Environ. Monit.
Assess. 6, 127–144.
Yalkovskaya, L.E., Borodin, a. V., Fominykh, M. a., 2015. Modular approach to studying the
fluctuating asymmetry of complex morphological structure in rodents on the mandible of the bank
vole (Clethrionomys glareolus Schreber, 1780) as an example. Biol. Bull. Rev. 5, 259–266.
Yalkovskaya, L.E., Fominykh, M.A., Mukhacheva, S. V., Davydova, Y.A., Borodin, A. V., 2016.
Fluctuating asymmetry of rodent cranial structures in an industrial pollution gradient. Russ. J. Ecol.
47, 281–288.
Yamada, K., Kimmel, D.B., 1991. The effect of dietary consistency on bone mass and turnover in the
growing rat mandible. Arch. Oral Biol. 36, 129–138.
Young, R.L., Badyaev, A. V., 2007. Evolution of ontogeny: linking epigenetic remodeling and genetic
adaptation in skeletal structures. Integr. Comp. Biol. 47, 234–244.
Zakrzewska, M., Sawicka-kapusta, K., Szarek, J., Byd, G., Baran, P., Dudzi, K., Skibniewska, K. a,
Guziur, J., 2010. Chapter 9 - Bioindication of the environment contamination by heavy metals, in:
Contemporary Problems of Management and Environmnetal Protection. Olsztyn, pp. 107–120.
Zelditch, M.L., Swiderski, D.L., Sheets, H.D., Fink, W.L., 2004. Geometric morphometrics for
biologists, Elsevier. New York and London.
Zyl, D. Van, Sassoon, M., Digby, C., Fleury, A., Kyeyune, S., 2002. Mining for the future - Main report,
Mining, Mimerals and Sustainable Development. Reno.
Page 93
77
ANEXO I – Protocol of the simmering method
Simmering method for small mammals
1. Cut the head of the specimen with the help of a scissor near the spine so as not to damage any
bones of the cranium.
2. Remove the skin from the specimen, starting the cut by the occipital part;
3. Place the specimen in a compress with the respective label. Close the compress as a “candy
package” with the help of a thread;
4. Place water in a metal container on a heat plate. Heat the water to 80o. Place the specimens in
the water for 15 to 20 minutes, maintaining the water temperature;
5. After the simmering time, remove the sample, place on a petri dish and open the “candy
package”;
6. With the aid of a lancet and abundant cool water, manually remove the meat from the bone.
The process should be performed slowly and carefully, without forcing movements so that there
is no rupture of the bone;
7. After the bone is clean, let it dry for 24 hours.
ANEXO II - Summary of cranium cleaning techniques tested on Mus spretus
Methods Skeleton with soft tissue (small mammals)
Blowflies larvae (Fig.1) No
- In a short time, the bone becomes soft, and the larvae
through the movement end up breaking the bone.
Simmering (Fig. 2) Yes
-It is necessary to control the time and temperature of the
water so as not to damage the specimen;
- Rapid method;
- Cleaning multiple specimens simultaneously.
Cold water No
- Becomes a very difficult and time-consuming task,
which can lead to the destruction of the specimens
Boil More or less
- The bones become very soft and eventually breaking.
Enzyme
(enzyme solution – Neutrase)
No
- In very low concentrations the bones break.
Page 94
78
Fig. 1 Cleaning of cranium by Blowflies larvae. A) Trapping, placing the trap in a vertical position with pig liver; B)
example of some specimens inside the trap; C) production of larvae in the laboratory; D) final cleaning of the skull.
Fig. 2 Simmering method A) Water heated between 70 and 80 ° C; B) Cranium packed in a compress and labeled; C)
perfectly cleaned mandible and skull.
A
)
B
)
C
)
A
)
B
)
C
)
D
)
Page 95
79
ANEXO III - Flowchart of the Geometric Morphometry analysis
Page 96
80
ANEXO IIII - Flowchart of the Genetic analysis


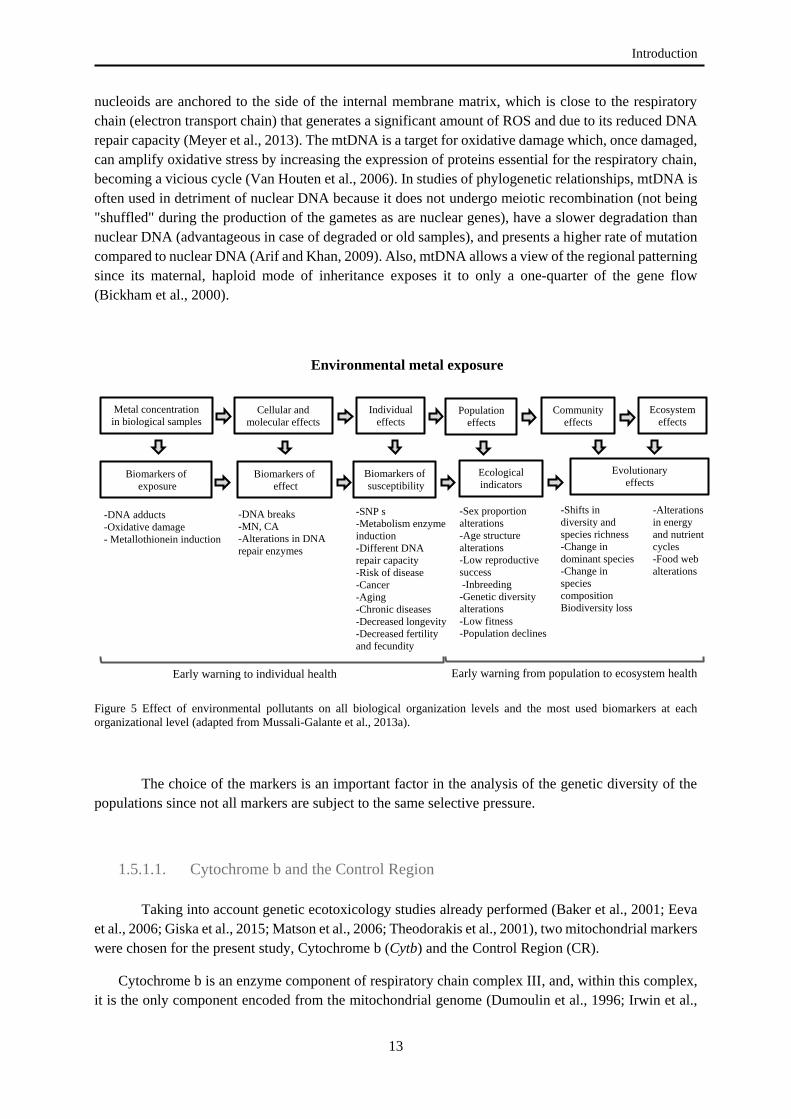


![COMUNICACIÓN/COMMUNICATION SECCIÓN/SECTION B … · 2019. 6. 16. · tido maximizar el acceso a colecciones para un público más amplio [8], especialmente si estas digitalizaciones](https://static.documents.pub/doc/80x56/602daf6622287520c162e7f0/comunicacincommunication-seccinsection-b-2019-6-16-tido-maximizar-el.jpg)


