Geophysical Characterization of a Fractured-Bedrock Aquifer and Blast-Fractured Contaminant-Recovery Trench by J.W. Lane Jr.‘, F.P. Haeni’, Susan Soloyanis’, Gary Placzek’, J.H. Williams’, C.D. Johnson’, M.L. Buursink’, P.K. Joesten’, and K.D. Knutson’ ABSTRACT Borehole- and surface-geophysical methods were used to characterize the hydrogeology and the effects of blast fracturing an in-situ recovery trench in a contaminated fractured-bedrock aquifer. The recovery trench is located at the former fire-training area of Loring Air Force Base in Aroostook County, Maine. Borehole-geophysical methods, used in six wells at the site, included video, acoustic televiewer, heat-pulse flowmeter under nonpumping and low-rate pumping conditions, natural gamma, electromagnetic induction, tluid temperature and conductivity, caliper, deviation, and borehole radar. Borehole radar was used in a single-hole reflection configuration with directional and non-directional 60-MHz (megahertz) antennas and in a cross-hole tomography configuration with 22- MHz antennas. One surface-geophysical method, azimuthal square-array direct-current resistivity, also was used. Geophysical surveys were conducted before and after blast fracturin, 0 the recovery trench. Integrated interpretation of the geophysical data collected before blasting indicates that most transmissive fractures are steeply dipping and are oriented northeast and southwest. Analysis of azimuthal square-array-resistivity data indicates that the secondary porosity of the fractured-bedrock aquifer is about I percent. The borehole-geophysical data and cross- hole radar tomography data indicate that more fractures are present in the upper 20 to 25 m (meters) of bedrock than in bedrock below this depth. Interpretation of the geophysical data collected after blast fracturing the recovery trench indicates that the blast created an intensely fractured zone about 3 m wide, 26 m deep, along the 50-m length of the recovery trench. Blast-induced porosity in the recovery trench is estimated from the borehole-radar data to be 13.5+ 5 percent at the midpoint of the trench, decreasin, u to 7.3+ 6 percent at the northwestern end. Post-blast effects on the hydrology of the area adjacent to the recovery trench include (1) a decline in static water levels, (2) order-of- magnitude increases in upward flow in two wells, (3) reversal of flow directions in two wells, (4) order-of-magnitude increases in the estimated transmissivity of three wells, and (5) an estimated increase in aquifer secondary porosity to 2 percent near the trench. The increase in secondary porosity is estimated on the basis of azimuthal square-array resistivity data collected over the recovery trench and cross-hole tomography collected parallel to but outside the trench. These effects are consistent with increased porosity and permeability in the blast-fractured recovery trench and with increased fracture transmissivity near the recovery trench. The increased fracture transmissivity resulted from an apparent hydraulic cleaning that occurred when water was ejected out of wells near the trench during the blast. ’ U.S. Geological Survey ’ The MITRE Corporation INTRODUCTION The fractured-bedrock aquifer beneath the former fire-trainin, (7area (FTA) at Loring Air Force Base in Aroostook County, Maine has been contaminated with petroleum products. The petroleum products are present in the aquifer as light nonaqueous phase liquids (LNAPLs) and as a dissolved phase in a around water. From 1952 until 1988. fire-fighting training was conducted every week. It is estimated that a total of 560.000 to I ,073,OOO liters of flammable liquids (petroleum products such as .jet fuel, waste oil, paint, and solvents) were dumped into a pit and burned. Not all the liquids were consumed in the tires, and some have migrated from the burn pit into the subsurface as LNAPLs. Remedial investigations have determined that LNAPLs are present in unknown quantities in the fractured bedrock and are a source of downgradient ground-water contamination. The areal extent of LNAPL detected in monitor wells at the site has been mapped as a “plume”. The observed direction of “plume” migration is in a north- northeast direction away from the burn pit, A pilot study to remove LNAPLs from the aquifer is being conducted by 429
Transcript
Geophysical Characterization of a Fractured-Bedrock Aquifer and Blast-Fractured Contaminant-Recovery Trench
by J.W. Lane Jr.‘, F.P. Haeni’, Susan Soloyanis’, Gary Placzek’, J.H. Williams’, C.D. Johnson’, M.L. Buursink’, P.K. Joesten’, and K.D. Knutson’
ABSTRACT
Borehole- and surface-geophysical methods were used to characterize the hydrogeology and the effects of blast fracturing an in-situ recovery trench in a contaminated fractured-bedrock aquifer. The recovery trench is located at the former fire-training area of Loring Air Force Base in Aroostook County, Maine. Borehole-geophysical methods, used in six wells at the site, included video, acoustic televiewer, heat-pulse flowmeter under nonpumping and low-rate pumping conditions, natural gamma, electromagnetic induction, tluid temperature and conductivity, caliper, deviation, and borehole radar. Borehole radar was used in a single-hole reflection configuration with directional and non-directional 60-MHz (megahertz) antennas and in a cross-hole tomography configuration with 22- MHz antennas. One surface-geophysical method, azimuthal square-array direct-current resistivity, also was used.
Geophysical surveys were conducted before and after blast fracturin, 0 the recovery trench. Integrated interpretation of the geophysical data collected before blasting indicates that most transmissive fractures are steeply dipping and are oriented northeast and southwest. Analysis of azimuthal square-array-resistivity data indicates that the secondary porosity of the fractured-bedrock aquifer is about I percent. The borehole-geophysical data and cross- hole radar tomography data indicate that more fractures are present in the upper 20 to 25 m (meters) of bedrock than in bedrock below this depth. Interpretation of the geophysical data collected after blast fracturing the recovery trench indicates that the blast created an intensely fractured zone about 3 m wide, 26 m deep, along the 50-m length of the recovery trench. Blast-induced porosity in the recovery trench is estimated from the borehole-radar data to be 13.5+ 5 percent at the midpoint of the trench, decreasin, u to 7.3+ 6 percent at the northwestern end. Post-blast effects on the hydrology of the area adjacent to the recovery trench include (1) a decline in static water levels, (2) order-of- magnitude increases in upward flow in two wells, (3) reversal of flow directions in two wells, (4) order-of-magnitude increases in the estimated transmissivity of three wells, and (5) an estimated increase in aquifer secondary porosity to 2 percent near the trench. The increase in secondary porosity is estimated on the basis of azimuthal square-array resistivity data collected over the recovery trench and cross-hole tomography collected parallel to but outside the trench. These effects are consistent with increased porosity and permeability in the blast-fractured recovery trench and with increased fracture transmissivity near the recovery trench. The increased fracture transmissivity resulted from an apparent hydraulic cleaning that occurred when water was ejected out of wells near the trench during the blast.
’ U.S. Geological Survey
’ The MITRE Corporation
INTRODUCTION
The fractured-bedrock aquifer beneath the former fire-trainin, (7 area (FTA) at Loring Air Force Base in Aroostook County, Maine has been contaminated with petroleum products. The petroleum products are present in the aquifer as light nonaqueous phase liquids (LNAPLs) and as a dissolved phase in a around water. From 1952 until 1988. fire-fighting training was conducted every week. It is estimated that a total of 560.000 to I ,073,OOO liters of flammable liquids (petroleum products such as .jet fuel, waste oil, paint, and solvents) were dumped into a pit and burned. Not all the liquids were consumed in the tires, and some have migrated from the burn pit into the subsurface as LNAPLs.
Remedial investigations have determined that LNAPLs are present in unknown quantities in the fractured bedrock and are a source of downgradient ground-water contamination. The areal extent of LNAPL detected in monitor wells at the site has been mapped as a “plume”. The observed direction of “plume” migration is in a north- northeast direction away from the burn pit, A pilot study to remove LNAPLs from the aquifer is being conducted by
429
Proceedings of the Symposium on the Application of Geophysics to Engineering and Environmental Problems, Copyright 1996 EEGS
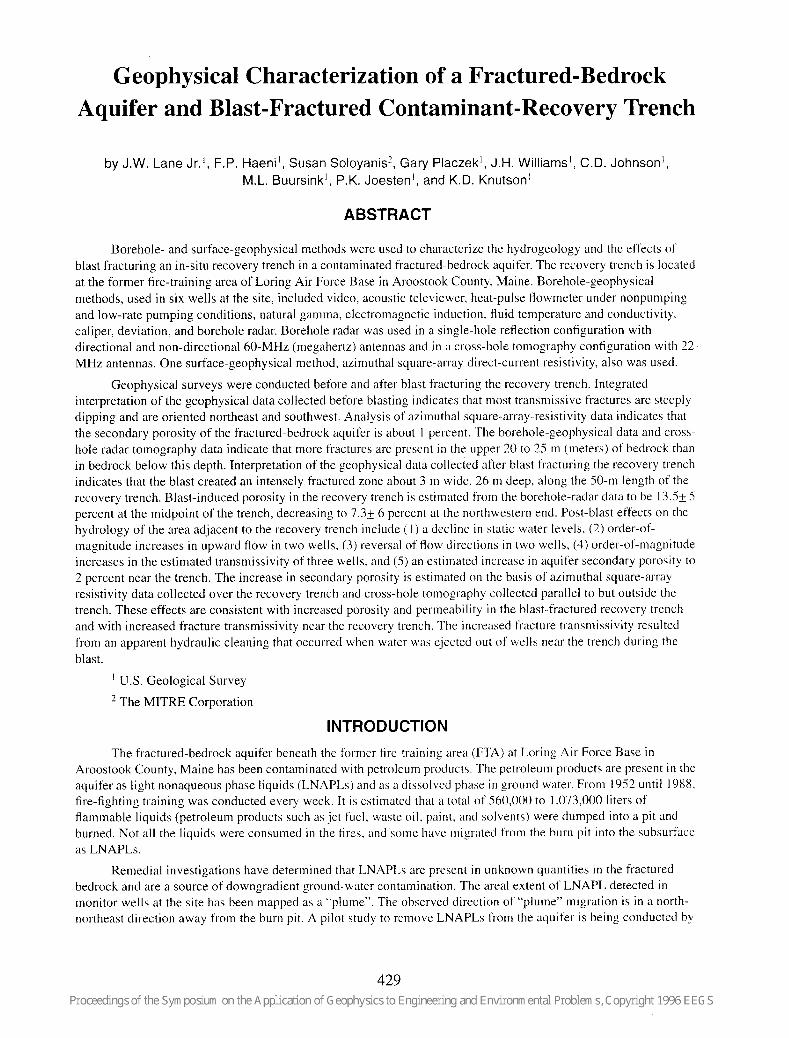
the Air Force. For this study, blast fracturin, 0 is being used to create a high hydraulic conductivity zone in the fractured bedrock. A trench was created by blasting three rows of explosive-filled boreholes along a 50-m ‘line’ (fig. I ). The rows were about 1.5 m apart, and boreholes within a row were about 1 m apart and 21 m deep. Wells installed in the blast-fractured trench will be pumped to recover LNAPLs.
In 1995, the U.S. Geological Survey (USGS), in cooperation with the U.S. Air Force, conducted geophysical surveys at the Loring site. The purpose of this report is to present the results of the geophysical surveys. Geophysical data collected before blasting were used to characterize the hydrogeologic framework of the aquifer and help determine the orientation of the trench for contaminant recovery. Geophysical characterization of the aquifer after blast fracturing was done to evaluate the effectiveness of blast containment, the extent of blast fracturing in the recovery zone, and the site-wide hydrogeologic effects of the blasting.
Site Description
The FTA is in the northeastern section of the base, approximately 100 m east of the runway (fig. I) and is underlain by till and fractured bedrock. The till consists of 3 to 6 m of dense silty sand and sandy silt. The bedrock that underlies the FTA is likely the lower member of the Carys Mills Formation (Osberg and others, 1985; Roy. 1980). The rocks are composed of interbedded layers of dark to pale gray, laminated and non-laminated micritic limestone and light gray, massive, rusty-orange weathering calcareous slate and pelites in which calcite veins are abundant. The thicknesses of these units ranges from several centimeters to several meters. The bedding exposed in nearby outcrop appears to be generally parallel and laterally continuous; however, some beds were observed to be pinched-out and (or) deformed. The top of bedrock is about 6 m below land surface, and the water table is within the bedrock. The ground-water-flow system in the fractured bedrock is complex and is affected by the size, orientation. and connectivity of the fractures. Water levels have been measured in a number of monitor wells since 1988. The hydraulic gradient in the upper bedrock is north-northeast at the site.
Standard Borehole-Geophysical Methods
A suite of borehole-geophysical logs was collected before and after blasting in six test wells at the site (fig. I) to detect and characterize fractures, quantify their hydraulic properties, and determine effects of the blast. The geophysical logs included caliper, deviation, gamma, electromagnetic conductivity, fluid resistivity, temperature, heat-pulse flowmeter, video camera, and acoustic televiewer. Test wells USGS- 1, USGS-2, USGS-3, and USGS-4, drilled specifically for use in this study, are all about 47 m deep. These wells were completed with 6 m of steel casing in the unconsolidated deposits and as open hole in bedrock. Pre-existing monitor wells URS-3 and RFW-44, which are both about 23 m deep and were constructed similarly to the other test wells, also were used in this study.
i
Geophysical logs and their application to ground-water studies are described by Keys (1990). The geophysical logs, except those made with the heat-pulse flowmeter and video camera, were collected with downhole-digital logging systems. Caliper logs record borehole diameter and were used to indicate changes related to the presence of fractures along the borehole wall. Deviation logs record the coordinate deviation of the borehole and were used in the analysis of other borehole measurements. Gamma logs record the total amount of gamma radiation emitted by the rocks surrounding the borehole. The most significant naturally occurring sources of gamma radiation are potassium- 40 and daughter products of the uranium- and thorium-decay series. Clay-rich rocks emit relatively high gamma radiation because they contain weathering products of potassium feldspar and mica and tend to concentrate uranium and thorium by ion adsorption and exchange. Electromagnetic-conductivity logs record the electrical conductivity of the rocks and water surrounding the borehole. Electrical conductivity is affected by porosity, clay content of the rocks, and total dissolved-solid concentration of the water in the rocks. Temperature logs record the water temperature in the borehole. Temperature logs were used to delineate transmissive zones and identify vertical flow between zones of differing hydraulic head. Fluid-resistivity logs record the electrical resistivity of water in the borehole. Fluid-resistivity logs were used to estimate the specific conductance of water from transmissive zones. Flowmeter logs record the direction and rate of vertical borehole flow. High-resolution measurements of borehole flow were made with a heat-pulse flowmeter under nonpumping and low-rate pumping conditions. Video-camera logs record a color optical image of the borehole. Bedrock fractures and lithology were viewed directly with the camera and recorded on video-cassettes. Acoustic-televiewer logs record a magnetically oriented, photograph-like image of the acoustic reflectivity of the borehole wall. acoustic-televiewer logs, which include the reflected amplitude and transit time, were used to identify the location and orientation of bedrock fractures and lithologic contacts.
I
430
I
Borehole-Radar Methods
Borehole-radar surveys were conducted to determine the distribution and orientation of fractures and fracture zones, detect the presence and orientation of any blast-induced fractures, and to help delineate the boundaries of the blast zone. Single-hole methods were conducted in the six test wells at the site (fig. 1) and included omni-directional surveys using 60-MHz electric-dipole transmitting and receiving antennas and directional surveys using a 60 MHz magnetic dipole directional receiver described by Falk (1992). Cross-hole tomography surveys were conducted between the four USGS test wells (fig. I) using 22-MHz electric dipole transmitting and receiving antennas. In addition to the full tomography surveys, ‘level runs’ were conducted after the blast fracturing of the recovery trench to assess the effects of the blast and to locate the bottom of the blast zone. The level-run data were collected by lowering the transmitter and receiver in parallel, equal increments down wells on opposite sides of the trench.
Azimuthal Square-Array Resistivity Method
Azimuthal square-array direct-current resistivity soundings were conducted to determine the average orientation of high-angle fractures, to provide estimates of the secondary porosity due to similarly oriented fracture sets in the bedrock, and to estimate changes in fracture orientation and secondary porosity induced by the blast. Azimuthal soundings were conducted at six locations before the blast and five locations after the blast (fig. 1). Data were collected and interpreted using procedures described in Lane and others (I 995). The array size (A-spacings) for the soundings ranged from 3 to 32 m, and each array was rotated in IS” increments about the array centerpoint.
RESULTS OF GEOPHYSICAL SURVEYS PRIOR TO BLASTING
Lithology
Analysis of the video-camera, acoustic-televiewer, caliper, gamma, and electromagnetic-conductivity logs provided information on bedrock lithology. Changes in color and texture on the video-camera logs indicated lithologic and bedding variability, including laminated and non-laminated zones in the limestone and pelitic layers. Combined interpretation of the video and televiewer logs show that bedding is parallel to subparallel to a SW-striking high-angle fracture set.
Fractures
Analysis of the video, televiewer, and caliper logs provided information on the distribution and character of bedrock fractures. The geophysical logs indicate that the upper 20 to 25 m of bedrock is more highly fractured than the deeper rock. Fractures identified on the video logs include (1) calcite-filled fractures, (2) fractures within or adjacent to calcite-filled fractures, and (3) fractures not associated with calcite fillings.
Fractures identified on the acoustic-televiewer logs consisted of planar features that showed some relief on the borehole wall. Distribution and orientation of individual fractures within fracture zones, which consist of multiple, closely spaced fractures, were not easily definable on the acoustic-televiewer logs, although the orientation of the top and (or) bottom fracture in a zone could be defined in some cases.
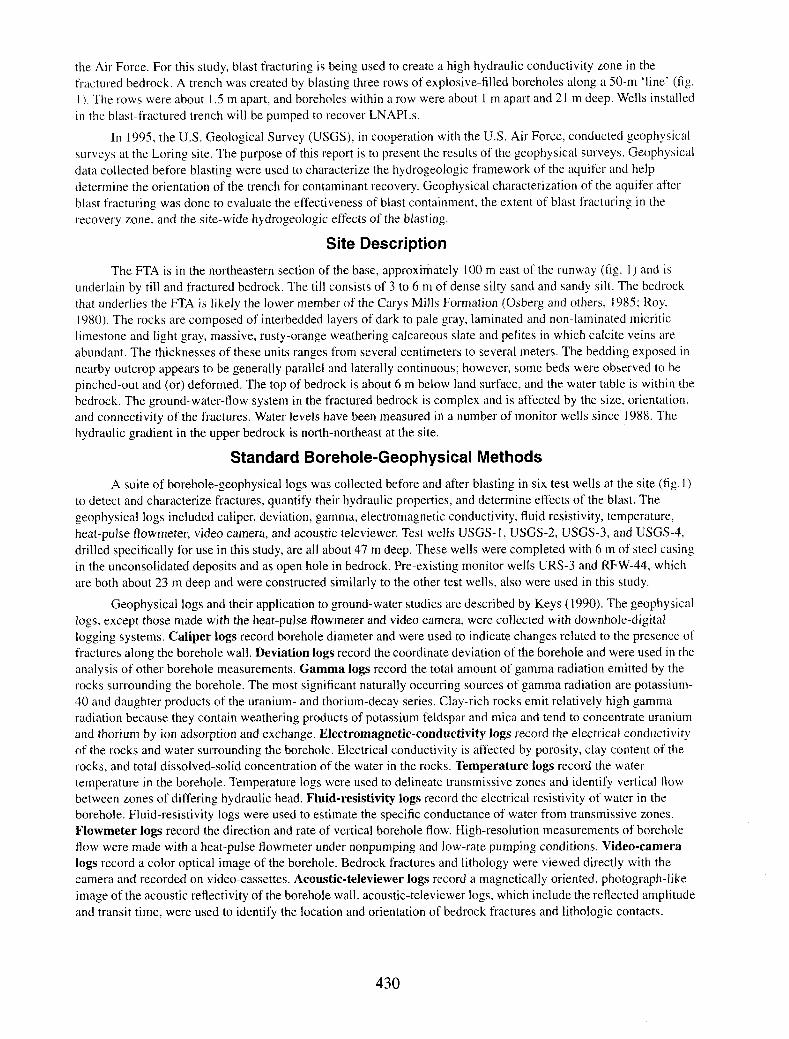
Fracture orientation determined from the televiewer logs define two conjugate sets of high-angle fractures (fig. 2). The predominant fracture set strikes S4O”W to S8O”W and dips 60” to 80” to the NW. The average dip is 70”. A secondary set strikes N50”E to N70”E and dips 50” to 80” to the SE. The average dip is 60”. The video logs show that some NE- and SW-striking high-angle fractures are associated with calcite fillings, whereas others are not. Low- angle fractures with. a broad range of orientations, which are not associated with calcite fillings, are identified on the video and acoustic-televiewer logs. The video logs show that some of the SW-striking high-angle fractures that are parallel to bedding offset the NE-striking fractures, indicating small-scale reverse faulting.
Analysis of the single-hole radar surveys provided additional information on the distribution, orientation, and areal extent of fractures and fracture zones. A total of 64 reflectors interpreted as fractures or fracture zones were delineated with the radar. Laterally continuous reflectors were identified an average distance of 8 m, up to a maximum of 18 m, from the boreholes. These fractures and fracture zones had similar orientations as the fractures determined from the acoustic-televiewer logs. One set strikes from N50”E to N70”E and dips between 45” and 70” to the SE. The average dip is 52”. Another set strikes from S3O”W to S7O”W and dips 30 to 70” to the NW. The average dip is 48” (fig. 3).
431
FIGURE 1. Location of study area, showing location of borehole- and surface-geophysical surveys, (Fire Training Area, Loring, Aroostook County, Maine)
FIGURE 2. Lower hemisphere equal-area FIGURE 3. Lower hemisphere equal-area projection projection of poles of fractures delineated of poles of fractures and fracture zones delineated on acoustic-televiewer logs from single-hole directional radar reflection surveys
. + l :
log determined to be . 0 0 transmissive from
EXPLANATION o Fracture zone delineated on
single-hole radar survey
. Fracture zone delineated on radar survey determined to be transmissive from . 0 o flowmeter log
0 0 “,80 0. co 0 0 u Oa. .
3 .
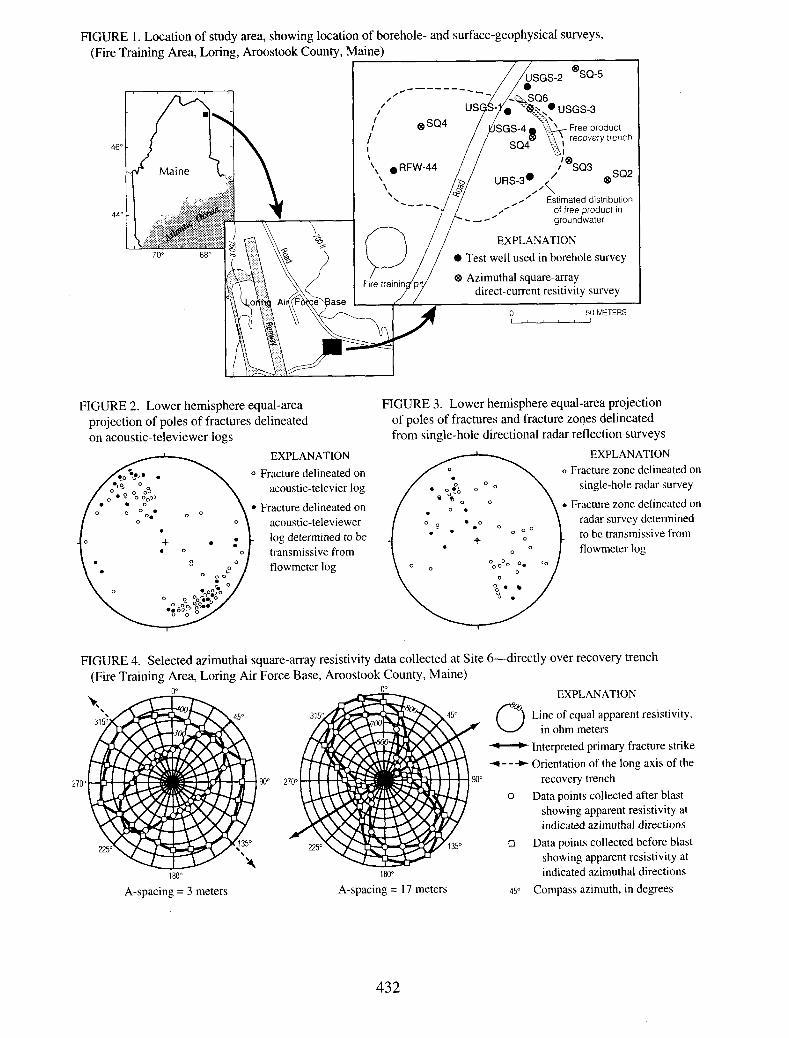
FIGURE 4. Selected azimuthal square-array resistivity data collected at Site o-directly over recovery trench (Fire Training Area, Loring Air Force Base, Aroostook County, Maine)
0 EXPLANATION
Line of equal apparent resistivity, in ohm meters
Interpreted primary fracture strike Orientation of the long axis of the
recovery trench Data points collected after blast
showing apparent resistivity at indicated azimuthal directions
Data points collected before blast showing apparent resistivity at indicated azimuthal directions
Compass azimuth, in degrees 180"
A-spacing = 17 meters
d---h
0
cl
45”
432
Differences between the distribution and orientation of fractures delineated with the acoustic televiewer and radar might be related to the scale distribution and orientation of fractures and fracture zones in the aquifer. Orientation of individual fractures that intersect the borehole are delineated by the acoustic televiewer, whereas the radar delineates reflections from fractures and fracture zones that have a large area1 extent. The acoustic televiewer samples an individual fracture that may be a small part of a larger fracture or fracture zone; thus, the orientation of a fracture as it crosses the borehole may not represent the large-scale average orientation. The borehole radar may provide a more representative large-scale spatial average of the orientation of fractures or fracture zones with large area1 extents.
Analysis of azimuthal square-array data provided information on the orientation of areally extensive, high- angle fractures and estimates of secondary porosity. Interpreted strikes are independent of the dip direction, which cannot be interpreted from the azimuthal data. Significant anisotropy was detected at all six locations where azimuthal soundings were conducted (fig. I). Two distributions of strike azimuths are interpreted from the small A- spacing data collected before the blast: N50”E to N70”E (sounding locations 1, 2, 3, and 6) and Nl5”W to N45”W (sounding locations 4 and 5). The large A-spacings show a similar distribution of interpreted strike azimuths: N50”E to N70”E (sounding locations 1, 2, 3,4, and 6) and Nl5”W to N45”W (sounding locations 2 and 5). The interpretation of data from the larger A-spacings (considered to have signilicant penetration into the bedrock) is that the anisotropy is induced by similarly oriented fractures and (or) bedding planes. Selected azimuthal resistivity data for square array sounding location 6, located directly over the blast site, is shown in figure 4. The data from the 3-m A-spacing at sounding location 6 are interpreted as indicating the presence of a relatively isotropic shallow subsurface, whereas the data from the 17-m array at sounding location 6 are interpreted as indicating the presence of N60”E striking fractures and (or) bedding planes.
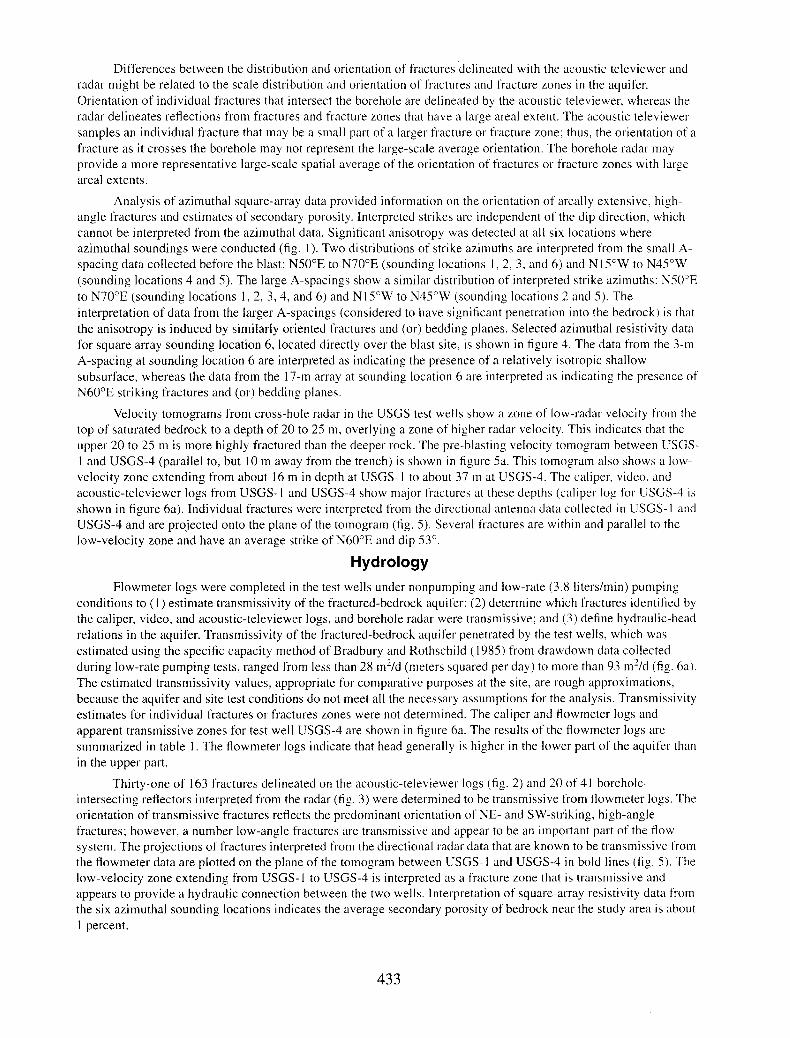
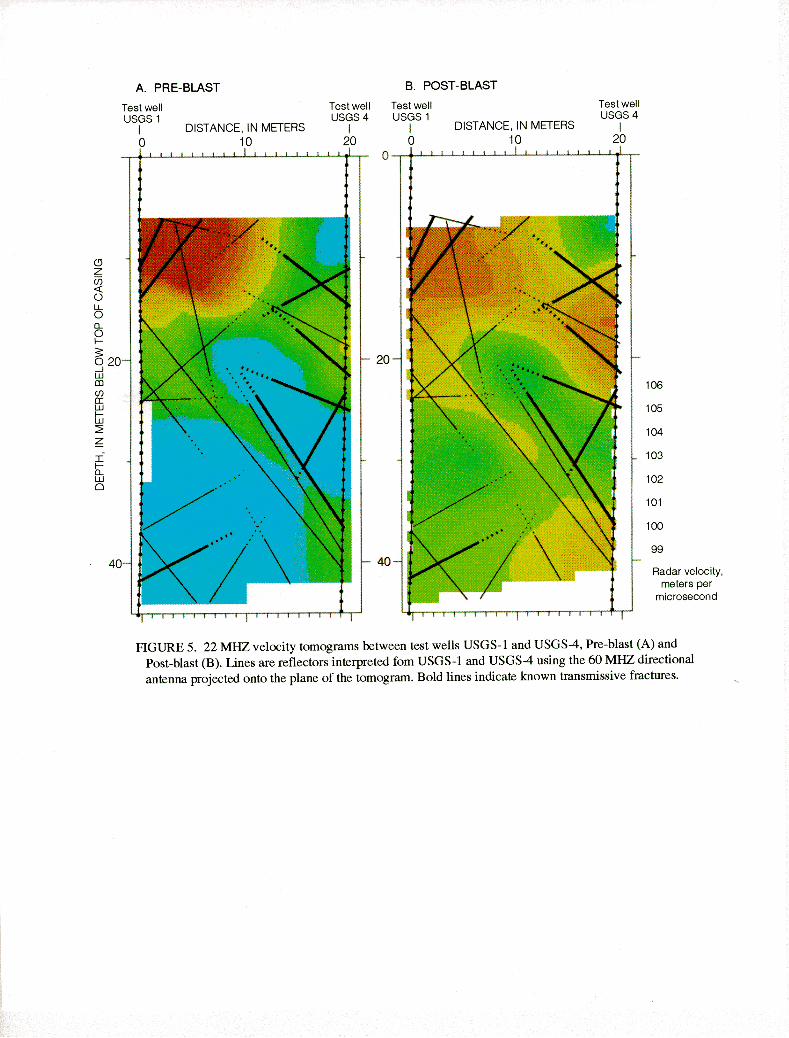
Velocity tomograms from cross-hole radar in the USGS test wells show a zone of low-radar velocity from the top of saturated bedrock to a depth of 20 to 25 m, overlying a zone of higher radar velocity. This indicates that the upper 20 to 25 m is more highly fractured than the deeper rock. The pre-blastin g velocity tomogram between USGS- 1 and USGS-4 (parallel to, but 10 m away from the trench) is shown in figure 5a. This tomogram also shows a low- velocity zone extending from about 16 m in depth at USGS- 1 to about 37 m at USGS-4. The caliper, video, and acoustic-televiewer logs from USGS- I and USGS-4 show major fractures at these depths (caliper log for USGS-4 is shown in figure 6a). Individual fractures were interpreted from the directional antenna data collected in USGS- I and USGS-4 and are projected onto the plane of the tomogram (fig. 5). Several fractures are within and parallel to the low-velocity zone and have an average strike of N60”E and dip 53”.
Hydrology
Flowmeter logs were completed in the test wells under nonpumping and low-rate (3.8 liters/min) pumping conditions to (1) estimate transmissivity of the fractured-bedrock aquifer; (2) determine which fractures identified by the caliper, video, and acoustic-televiewer logs, and borehole radar were transmissive; and (3) define hydraulic-head relations in the aquifer. Transmissivity of the fractured-bedrock aquifer penetrated by the test wells, which was estimated using the specific capacity method of Bradbury and Rothschild (1985) from drawdown data collected during low-rate pumping tests, ranged from less than 28 m2/d (meters squared per day) to more than 93 m’/d (fig. 6a). The estimated transmissivity values, appropriate for comparative purposes at the site, are rough approximations, because the aquifer and site test conditions do not meet all the necessary assumptions for the analysis. Transmissivity estimates for individual fractures or fractures zones were not determined. The caliper and flowmeter logs and apparent transmissive zones for test well USGS-4 are shown in figure 6a. The results of the flowmeter logs are summarized in table 1. The flowmeter logs indicate that head generally is higher in the lower part of the aquifer than in the upper part.
Thirty-one of I63 fractures delineated on the acoustic-televiewer logs (fig. 2) and 20 of 4 I borehole- intersecting reflectors interpreted from the radar (fig. 3) were determined to be transmissive from flowmeter logs. The orientation of transmissive fractures reflects the predominant orientation of NE- and SW-striking, high-angle fractures; however, a number low-angle fractures are transmissive and appear to be an important part of the flow system. The projections of fractures interpreted from the directional radar data that are known to be transmissive from the fowmeter data are plotted on the plane of the tomogram between USGS- I and USGS-4 in bold lines (fig. 5). The low-velocity zone extending from USGS- I to USGS-4 is interpreted as a fracture zone that is transmissive and appears to provide a hydraulic connection between the two wells. Interpretation of square-array resistivity data from the six azimuthal sounding locations indicates the average secondary porosity of bedrock near the study area is about I percent.
433
A. PRE-BLAST B. POST- BLAST
Test well USGS 1
DISTANCE, IN METERS
Test well USGS 4
Test well USGS 1
DISTANCE, IN METERS
Test well USGS 4
106
105
104
103
102
101
100
99
Radar velocity, meters per
microsecond
FIGURE 5. 22 MHZ velocity tomograms between test wells USGS-1 and USGS4, Pre-blast (A) and Post-blast (B). Lines are reflectors interpreted fom USGS-l and USGS-4 using the 60 MHZ directional antenna projected onto the plane of the tomogram. Bold lines indicate known transmissive fractures.
RESULTS OF GEOPHYSICAL SURVEYS AFTER BLASTING
The integrity of the borehole wall in test wells USGS-3 and USGS-4 was affected by blasting of the contaminant-recovery trench. After the blast. test well USGS-3 had a restriction at 12.2 m and was blocked at 18.3 m: it had to be drilled out before it could be logged. The caliper log for test well USGS-4 (fig. 6b) shows several restrictions between 6. I and 15.2 m as a result of the blast. The video logs showed these restrictions to be caused by small irregular blocks of rock that rotated from the wall into the borehole. The video logs also showed the borehole walls appear to be cleaner after the blast than before the blast. The blast, which caused water to be ejected for up to 15 seconds from USGS 1, 3, 4, and URS-3 (fig. 7), removed fine-grnined deposits from fracture surfaces and the borehole walls. An example of a comparison of the video logs collected before and after the blast in USGS- I (at IO- m depth) is shown in figure 8. No new blast-induced fractures or increases in apparent fracture apertures were recognized on the video or televiewer logs. None of the sealed calcite-tilled fractures appeared to be opened by the blast. Although no new blast-induced fractures or fracture zones were recognized in single-hole borehole-radar data after the blast (other than reflections from the ‘edge’ of the blast zone), some amplitude and phase changes of reflectors were noted that could indicate changes in fracture aperture or radar velocity.
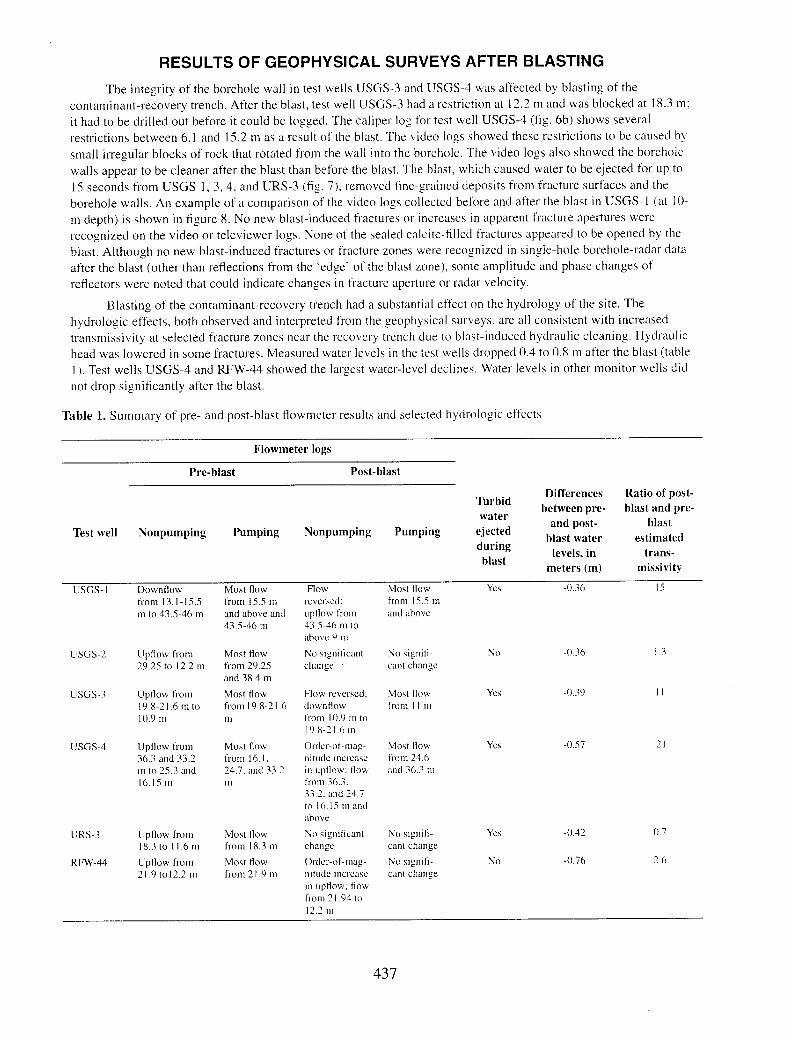
Blasting of the contaminant-recovery trench had a substantial effect on the hydrology of the site. The hydrologic effects, both observed and interpreted from the geophysical surveys, are all consistent with increased transmissivity at selected fracture zones near the recovery trench due to blast-induced hydraulic cleaning. Hydraulic head was lowered in some fractures. Measured water levels in the test wells dropped 0.4 to 0.8 m after the blast (table I). Test wells USGS-4 and RFW-44 showed the largest water-level declines. Water levels in other monitor wells did not drop significantly after the blast.
Table 1. Summary of pre- and post-blast tlowmeter results and selected hydrologic effects
Test well
USGS- I
Flowmeter logs
Pre-blast Post-blast
Nonpumping Pumping Nonpumping Pumping
DownHow Most How
from 13.1-15.5
m to 43.546 m
Most How
from IS.5 m
and above and 4X5-46 m
Flow
reversed:
upHow from
43.S.46 m IO
above 9 m
Turbid water
e,jected during blast
Yes
Differences Ratio of post- between pre- blast and pre-
blast and post- blast water estimated
levels, in trans- meters (m) missivity
-0.36 IS
from I 5.5 m
and above
USGS-2
USGS-3
USGS-4
UKS-3
RFW-44
UpHow fi-om
29.25 to 12.2 m
Most How
from 29 25
and 38.4 m
UpHow from Most How
19.X-2 I .6 m to from 19.8-2 I .6
IO.9 m m
UpHow from
36.3 and 33.2
111 to 25.3 and
16.15 m
Most How
from 16. I,
24.1. and 33 2
m
UpHow from
18.3to l1.6m
UpHow from
2 I .9 to 12.2 m
Most How
from 18.3 m
Most How
from 2 I .9 m
Flow reversed:
downHow
from IO 9 m to
19.X-2 I .6 11,
No signiticant
change
Order-of-map-
nitude Increxe
In upfow; How
from 2 I 94 to
122m
No GgniC
cant change
Mo<t How
f1-on1 I I 111
Moqt How
I~rom 24.6 and 36 3 m
No slgnifi-
cant change
No aignili-
cant change
NO
Yes
YCS
No
-0 36
-0.39
-0 s-l
-0.42
-0.76
I 3
I I
21
0.7
2.6
437
A. Pre-blast
CALIPER, IN CENTIMETERS
UPWARD FLOW, IN LlTERSiMN
0.0 1.0 20 30
Y
x
EXPLANATION 0 Non-pumpmg x Pumping
- Transmssrve zone
FIGURE 7. View of test wells during biastmg of the recovery trench, Water is ejected as much as 12 to 1.5 meters into the air from weils USGS-4, VSGS -3. USGS-i and URS-3.
B Post-blast
CALIPER.
IN CENTIMETERS 15 16 17 I8
UPWARD FLOW,
IN LITERS/MIN 30 10 2.0 3.0
I------ k
0 x
I-- 0:
:,
a mm
FIGURE 6. Caliper and flowmeter logs in test well USGS-4: A) Pre-blast and B1 Post-blast
FIGURE 8. Borehole \rideo image of USGS- 1 at about IO meters depth before <.A) and after (B,! blasting of the recovery trench. The text well appears to have kc\ aitc:aiion and fine-gained particulate deposits after blasting.
438
The estimated aquifer transmissivity after the blast in test wells USGS- I, USGS-3, and USGS-4 was an order of magnitude higher than before the blast (table 1). Simulation of idealized representations of the aquifer before and after the blast using the ground-water-flow model of McDonald and Harbaugh (1988) indicates that the presence of a high transmissivity and high porosity zone, such as the blast-fractured trench, might account for only a small percentage of the increase in transmissivity.
Post-blast flowmeter logs under nonpumping conditions in test wells USGS-4 and RFW-44 showed order-of- magnitude increases in upward flow (table 1 and fig. 6b). This indicates an increase in the difference in head between the fractures above and below 21.3 m and (or) an increase in fracture transmissivity. Test wells USGS-4 and RFW-44 showed the greatest difference in pre-blast and post-blast water levels. Test well USGS-4 showed an increase in estimated transmissivity of more than 20 times, and RFW-44 showed an increase of less than 3 times. In test well USGS- 1, flow reversed from downward to upward. This indicates a decrease in head in the shallow fractures relative to the head in fractures from 43.6 to 46 m. In test well USGS-3, flow reversed from upward to downward, indicating a decrease in head in fractures from 19.8 to 2 1.6 m relative to the head in a fracture at 11 m.
Post-blast flowmeter logs under low-rate pumping conditions showed a redistribution of flow contributions from the transmissive fractures in test wells USGS- I, USGS-3, and USGS-4 (table 1 and fig. 6b). In USGS- 1, the flow contributions from fractures at 15.5 m and above increased relative to the contribution from fractures from 43.6 to 46 m, indicating an increased transmissivity in the shallow fractures. In USGS-4, flow from fractures at 36 m increased relative to flow from other fractures, indicating a relative increase in transmissivity and (or) head gradient in this deep zone. In USGS-3, flow from a fracture at 11 m increased relative to flow from fractures from 19.8 to 21.6 m. This change in relative flow contribution may be related to the decrease in head in the fractures from 19.8 to 2 1.6 m relative to the head in the fracture at 11 m and (or) increased transmissivity in the shallow fracture.
Velocity tomograms produced after the blasting of the trench show similar velocity patterns and structures seen in the pre-blast tomography, except that the average velocity decreased. The interpreted fracture zone extending from about 16 m in USGS-l to about 36 m in USGS-4 shows a significant decrease in velocity as a result of the blast (fig. 5b). As discussed above, test wells USGS-l and USGS-4 showed order-of-magnitude increases in transmissivity and relative increases in flow contributions from fractures at 15.5 m and above in USGS- 1 and at 36.6 m in USGS-4 (table 1 and fig. h), indicating a blast-induced increase in transmissivity in the fracture zone.
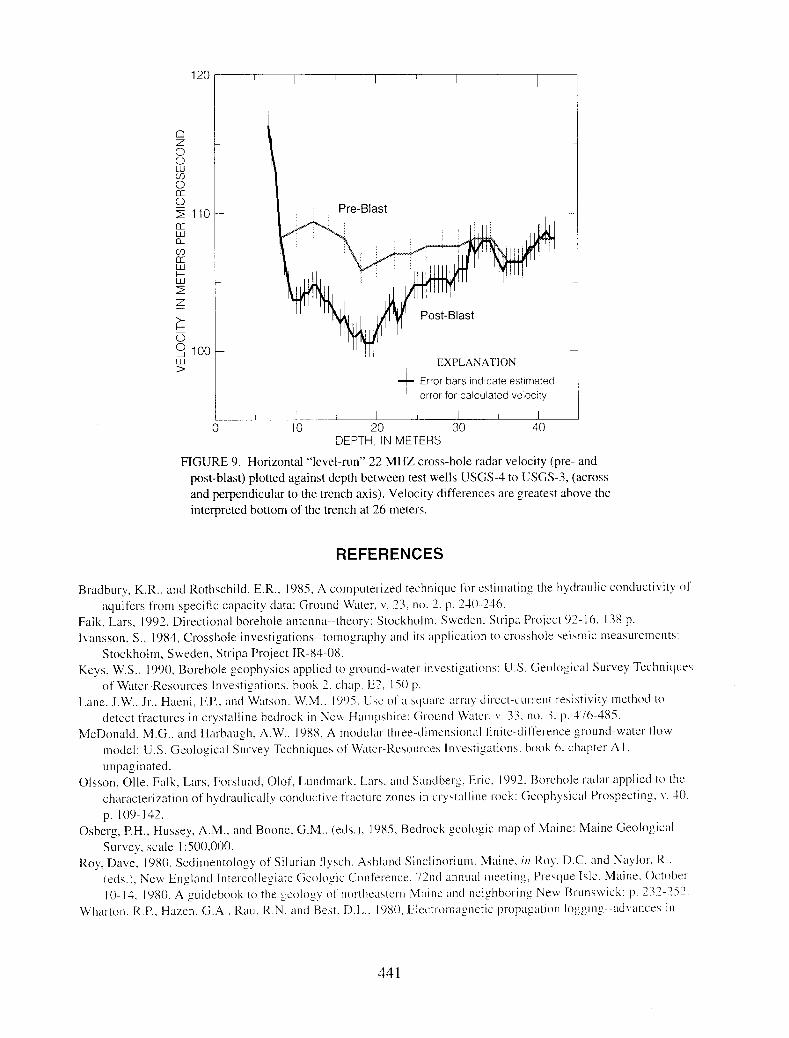
The geometry of the cross-hole tomography surveys precluded imagin, 0 the trench itself, but the level runs were analyzed to provide information on the depth of the blast effects and to provide estimates of the blast-induced porosity. Radar-velocity data between USGS-4 and USGS-3 (perpendicular to the trench axis) collected prior to and after the blast are shown in figure 9. Significant velocity changes occur above 26 m, which is the interpreted bottom of the blast-fractured trench. The width of the blast zone was estimated from reflections off the trench boundary using single-hole radar-reflection data and from the width of the ground surface elevated by the blast. Estimates of the change in porosity due to blasting were made using a modified version of the time-propagation equation for dielectric mixing (Wharton and others, 1980). This analysis uses the pre- and post-blast level-run velocities for well pairs with rays crossing the trench axis beneath the water table. The interpreted blast-induced porosity decreased from 13.5 + 5 percent at the mid-point of the long axis of the trench to 7.3 + 6 percent at the northwestern end of the trench. The predicted height changes of the land-surface elevation due to the interpreted blast-induced porosity match the surveyed changes in elevation within the range of error for the analyses.
Comparison of level-run and cross-hole tomography data collected before and after the blast from well pairs USGS-3/USGS-2 and USGS4/USGS- 1 (which are parallel to but IO m outside the blast zone) indicates the average radar velocity decreased after the blast by about 2 m&s (meters per microsecond). This velocity decrease corresponds to an increase in secondary porosity from 1 percent (pre-blast) to 2 percent (post-blast). This porosity increase is consistent with an interpretation of increased fracture connectivity and hydraulic cleaning induced by the blast.
Interpretation of square-array resistivity data collected at five locations (1, 3,4, 5, and 6) (fig. 1) after the blast indicates that the strike directions remain unchanged from the ones interpreted from small A-spacing data at sounding locations 1, 3, and 4 before the blast. Blast effects were detected in the small A-spacing data from sounding locations 5 and 6, located near the trench. At sounding location 5, an east to SSE strike was introduced in the post-blast data and is interpreted as a boundary effect of the trench. At soundin, 0 location 6. directly over the trench, a NW-SE strike was interpreted, whereas before the blast, no strike was interpreted (fig. 4). The post-blast NW-SE strike corresponds directly with the orientation of the long axis of the trench. The strikes interpreted from large A-spacing data from all squares collected after the blast show little or no change from the pre-blast data. Although the blasting of the trench
439
had no effect on strike interpreted from the large A-spacings at sounding location 6, the anisotropy increased (fig. 4), and this is interpreted as indicating an increase in secondary porosity. The calculated secondary porosity increased from I to 2 percent at sounding location 6, the only sounding location directly over the trench, but remained at pre- blast levels for all other locations.
SUMMARY AND CONCLUSION
Integration of results from borehole- and surface-geophysical surveys at the Loring Air Force Base Fire Training Area provides a conceptual understanding of the hydrogeology of the site and documents the effects of blast-fracturing the recovery trench. The geophysical logs and radar methods indicate the upper 20 to 25 m of bedrock is more intensely fractured than bedrock below these depths. The presence of NE- and SW-striking fractures is supported by acoustic-televiewer logs, single-hole directional borehole-radar surveys, and azimuthal square-array direct-current resistivity surveys. Integrated interpretation of the borehole video, acoustic televiewer, and borehole radar results allow bedding-parallel fracture sets to be distinguished from conjugate fracture sets. Combining the results from acoustic-televiewer logs and borehole-radar surveys provides insight into the possible different scales of fractures and fracture zones. Heat-pulse flowmeter logs indicate which fractures are transmissive and provide an understanding of the relative head differences between the upper and lower part of the aquifer. Interpreted transmissive fractures are predominantly oriented NE-SW.
Results from square-array direct-current resistivity surveys provide an estimate of the average bedrock aquifer secondary porosity (1 percent). Integrated interpretation of velocity tomograms and single-hole directional radar, acoustic televiewer, video, caliper, and heat-pulse flowmeter results indicates that the low-velocity zone, which apparently extends from USGS- 1 to USGS-4, is a transmissive fracture zone.
Integrated interpretation of post-blast video, acoustic-televiewer logs, and single-hole radar data indicate that no blast-induced fractures extend beyond the trench boundaries or intersect the six test wells. Estimates of the blast- induced trench porosity from cross-hole radar data indicate the porosity decreased from 13.5 + 5 percent at the mid- point of the trench to 7.3 + 6 percent at the northwestern end of the trench. Interpretation of the trench porosity required information on the trench boundaries that was provided by (I) single-hole borehole-radar reflections off the trench boundary, (2) estimates of the lower limit of significant blast-induced velocity effects from cross-hole radar level runs, and (3) observations of the dimensions of ground elevated by the blast. The porosity calculations are supported by the magnitude of surface-elevation change after the blast.
The hypothesis that hydraulic cleaning of selected fractures occurred near the recovery trench was formulated by integrating the post-blast heat-pulse flowmeter, velocity tomograms, video, and azimuthal square-array direct- current resistivity results. Order-of-magnitude increases in fracture transmissivity, decreases in head, decreases in radar velocity from tomograms and level runs, interpreted increases in secondary porosity, and the apparent cleaning of fine-grained material from fractures as seen on the borehole video,.coupled with video of the blast showing water ejection from 4 wells for up to 15 seconds after the blast, support this hypothesis.
DISCLAIMER
The views expressed in this paper do not necessarily reflect the official policy of the U.S. Air Force or the Department of Defense.
ACKNOWLEDGMENTS
We acknowledge substantial project implementation contributions by the U.S. Air Force Base Conversion Agency Operating Location M for funding the pilot study, URS Consultants for pilot study design and construction. ABB Environmental Services for remedial investigations, and the U.S. Environmental Protection Agency and Maine Department of Environmental Services Remedial Project Managers, their technical staffs, and technical consultants for participation in technical decisions. We also acknowledge Byron Best for his invaluable contributions in the field.
440
1
EXPLANATION
t Error bars indicate estimated error for calculated velocity
I I I I I I I I IO 20 30 40
DEPTH, IN METERS
FIGURE 9. Horizontal “level-run” 22 MHZ cross-hole radar velocity (pre- and post-blast) plotted against depth between test wells USGS-4 to USGS-3, (across and perpendicular to the trench axis). Velocity differences are greatest above the interpreted bottom of the trench at 26 meters.
REFERENCES
Bradbury, K.R., and Rothschild. E.R.. 1985, A computel-ized technique for estimatin= (7 the hydraulic conductivity of
aquifers from specific capacity data: Ground Water. v. 23, no. 2. p. 210-246. Falk, Lars. 1992, Directional borehole antenna--theory: Stockholm. Sweden. Stl-ipa Pt-eject 92- 16. 13X p. Ivansson. S., 1984, Crosshole investigations--tomography and its application to crosshole seismic measurements:
Stockholm, Sweden, Stripa Project IR-84-08. Keys. W.S.. 1990. Borehole geophysics applied to ground-water investI,‘ .cr,ltions: U.S. Geological Survey Techniques
of Water--Resources Investigations. book 2. chap. E2. I SO p. Lane. J.W.. Jr.. Haeni, F.P.. and Watson. W.M.. 1995. Use of ;I X~LI;LI-~-;I~IYI~ dil-ect-cul-I-ent resiativity method to
detect fractures in crystalline bedrock in NeLv Hampshire: Ground Water. v. 33. no. 3. p. 476-485. McDonald. M.G.. and Harbaugh, A.W.. 1988. A mod~~lar three-dimensional finite-differ-cnce ground-water flow
model: U.S. Geological Survey Techniques of Water-Resources In\,estl,‘ ‘“,ltions. book 6. chapter A I,
unpaginated. Olsson, Olle. Falk, Lars, Forslund. Olaf. Lundmark. Lxs. and Sandberg. El-ic. I )I-. l ‘3 Borehole radar- applied to the
characterization of hydraulically c0nductiL.e t’racturc zones in crystalline rock: Geophysical Prospecting. v. 40. p. IO9- 142.
Osberg, P.H.. Hussey. A.M., and Boone, G.M.. (eds.). 1985, Bedrock geologic map of Maine: Maine Geological
Survey, scale I :SOO,OOO. Roy, Dave. 1980. Sedimentology of Silurian tlysch. Ashland Sinclinorium, Maine. irl Roy. D.C. and Naylor, R..
(eds.). Neu England Intel-collegiate Geologic Conference. 72ntl a11n~1al meeting. Presclue Isle. Maine. October
t 0- 14. 1980. A guidebook to the geology of northeasterI Maine and neighborin, ~7 New Brunswick: p. 232-252.
Wharton. R.P.. Hazen. G.,4.. R~LI. R.N. and Best. D.L.. 19X0. Electromagnetic propqation 10~~ ~r~rin~--advances in