GEOPHYSICAL INVESTIGATION REPORT HOBOKEN WATERFRONT PROJECT HOBOKEN, NEW JERSEY Prepared for: Applied Development Company 50 Washington Street Hoboken, New Jersey 07030 Prepared by: SubTerra Geoservices LLC 217 Henley Avenue Pine Beach, New Jersey 08741 217 Henley Avenue Pine Beach, NJ 08741 June 21, 2010 STG Project1045
Transcript
GEOPHYSICAL INVESTIGATION REPORT
HOBOKEN WATERFRONT PROJECT
HOBOKEN, NEW JERSEY
Prepared for:
Applied Development Company 50 Washington Street
Hoboken, New Jersey 07030
Prepared by: SubTerra Geoservices LLC
217 Henley Avenue Pine Beach, New Jersey 08741
217 Henley Avenue Pine Beach, NJ 08741
June 21, 2010
STG Project1045
Geophysical Investigation Report STG Project No. 1039 Stapleton Project, Lot B2 May 25, 2010 May 25, 2010
1
GEOPHYSICAL INVESTIGATION REPORT
Waterfront Project Hoboken, New Jersey
June 21, 2010
INTRODUCTION On June 9, 2010 SubTerra Geoservices LLC (STG) conducted a geophysical investigation at the property identified as the Waterfront Project, Hoboken, New Jersey (herein referenced to as the site.) The purpose was to investigate the site to determine if potential voids may be present under the current brick walkway at the site. The investigation included the use of electromagnetic terrain conductivity and ground penetrating radar. METHODOLOGY AND LIMITATIONS A. Electromagnetic Terrain Conductivity Survey: Electromagnetic (EM) terrain conductivity data were collected using a Geonics EM31-DL terrain conductivity meter (EM31). The EM31 consists of a 3.66 meter transmitter (Tx)/receiver (Rx) boom unit that is carried by the operator. The Tx coil is at one end and the Rx coil at the opposite end of the boom. The Tx coil transmits an EM signal which induces eddy currents into the subsurface materials. The Rx coil then measures the secondary magnetic field associated with the eddy current. Two components of the secondary field, the in-phase and quadrature, are recorded by the unit. The in-phase component, measured in parts per thousand (ppt), is used for metal detection. The quadrature (or terrain conductivity) component, is indicative of the conductivity of subsurface materials and is measured in milliSiemens per meter (mS/m). At the site, the EM31 was operated in the vertical dipole mode while recording both the in-phase and quadrature response on an Allegro Field Computer. The effective depth of data collection was approximately 15 feet. The instrument was carried across the site along a perpendicular grid of survey lines spaced at approximately 5-foot intervals. EM data and differentially-corrected Global Positioning System (DGPS) coordinates were simultaneously recorded at 0.1 second intervals (approximately every 0.25 feet) along the survey lines. The data were downloaded to a personal computer for processing and the creation of in-phase and quadrature response maps. The data were processed using the Trackmaker 31 software package (Geomar Software Inc.), then interpolated with a Natural Neighbor gridding algorithm into a geo-referenced regular grid and plotted using the Surfer 9 surface mapping software program (Golden Software Inc.) The EM31 quadrature and inphase data maps were
Geophysical Investigation Report STG Project No. 1039 Stapleton Project, Lot B2 May 25, 2010 May 25, 2010
2
then superimposed onto an aerial photograph from Google Earth utilizing the DGPS coordinates. Refer to Figure 1 - EM31 Quadrature Data Map and Figure 2 - EM31 Inphase Data Map. In the quadrature data map, areas of higher conductivity are generally identified by significant positive EM responses (anomalies) and would be colored red and white in Figure 1. Areas of lower conductivity are generally identified by lower EM responses and are colored yellow, green, blue and purple in Figure1. In the in-phase data map, the presence of buried objects containing metallic components such as steel reinforced concrete are generally identified by significant negative EM responses (anomalies) and would be colored blue and purple in Figure 1. Near surface or surficial objects containing metallic components are identified by significant positive EM responses (anomalies) and would be colored red and white in Figure 2. B. Ground-Penetrating Radar (GPR) Survey - GPR data were collected with a Sensors and Software Inc. Nogginplus SmartCart GPR System (SmartCart) utilizing a 250 MHz antenna. The antenna, containing both a transmitter and a receiver, is rolled along the ground surface during the GPR survey. The transmitter radiates short pulses of high-frequency EM energy into the ground. When the wave encounters the interface between two materials having different dielectric constants (dielectric permittivity), a portion of the energy is reflected back. The signal is transmitted to a control unit, displayed on a monitor, and digitally recorded. The Nogginplus system records an image of the subsurface by plotting two-way travel time of the reflected EM pulse on the vertical axis with the distance traveled along the ground surface plotted on the horizontal axis. The depth of the reflecting object or stratum is then determined by using known soil velocity functions and calculating two-way way travel time values. GPR data were collected on 28 survey lines, across selected open areas of the subject property. Data was collected from the sidewalk area and from the area of the street. The maximum depth of investigation was approximately 5 feet at this site. GPR data and DGPS coordinates were simultaneously recorded at 0.1 second intervals (approximately every 0.25 feet) along the survey lines. The data were processed using GPR-Slice software to create time slice maps of GPR reflections at specified depth intervals. The sidewalk and street time slice maps are presented in Appendices 1 and 2. A combined time slice map was superimposed on the Google Earth aerial and is presented as Figure 3. Areas of red and yellow represent areas of high reflectivity which is due to changes in the dielectric constant of the subsurface materials. These areas may represent subsurface voids, structures and/or other objects. C. Limitations - Limitations encountered during the investigation included the presence of the adjacent buildings on site, landscaping, curbs, steel manholes and other utility structures, steel structures and the possibility of saline saturated soils.
Geophysical Investigation Report STG Project No. 1039 Stapleton Project, Lot B2 May 25, 2010 May 25, 2010
3
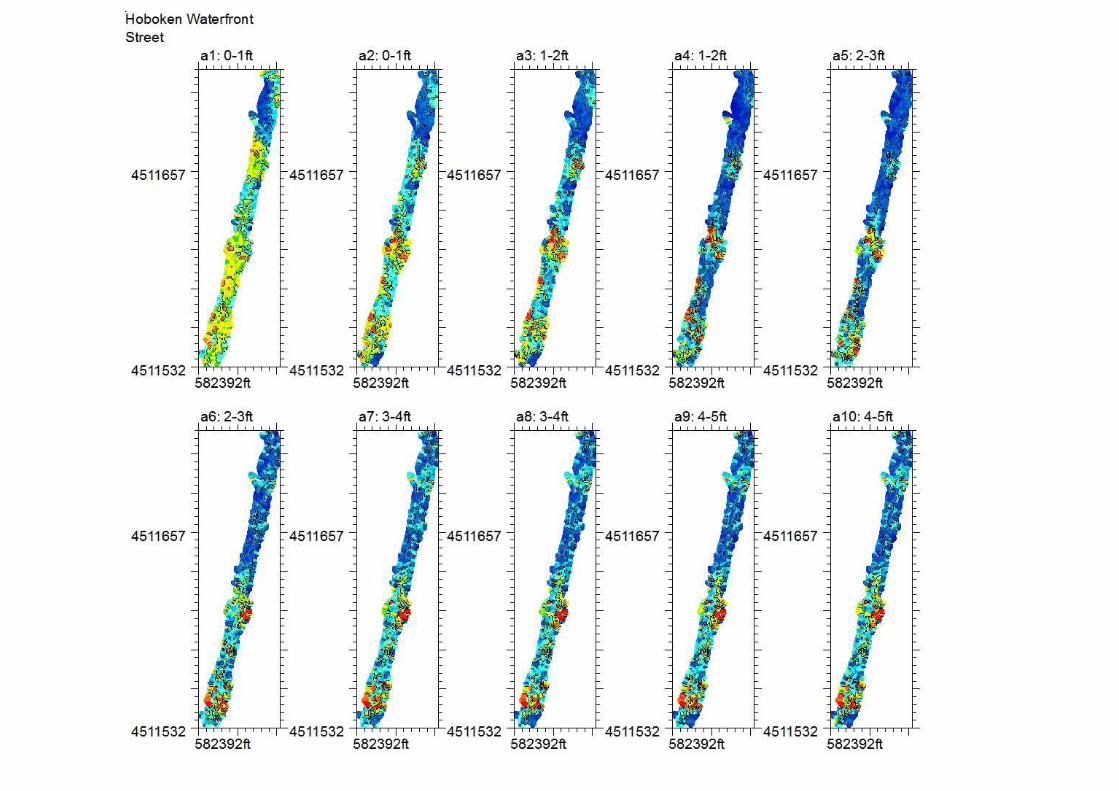
Please note that GPR and electromagnetic measurement are remote sensing methods and in some instances, due to interference or other geophysical limitations, do not reveal data which may be indicative of subsurface anomalies. The findings of this investigation should only be used as a tool in evaluating the possibility that a breakwater or other subsurface objects are or were once present on the site and should not be considered a guarantee regarding the presence or absence of subsurface objects. GEOPHYSICAL RESULTS A. EM31 Results: Two areas of anomalous change in the in-phase and quadrature response gradients were observed in the EM31 data collected from the site. The range of the in-phase data component was from -20.48 to 20.48 ppt. The EM31 data will show a strong negative response, in the range of -15 ppt to -20 ppt, when subsurface metal-containing objects have been encountered. A strong positive response, in the range of 15 ppt to 20 ppt, results when surface or near metal-containing objects have been encountered. The range of the quadrature data component was from -179.7 mS/m to 204.78 mS/m. The quadrature response will trend to higher levels when the subsurface is more conductive and lower values when less conductive. Analysis of the EM31 in-phase data found that anomalies (areas colored red and white areas in Figure 1) consistent with the presence of near surface objects such as steel reinforced concrete and/or other metallic objects underlie the site from just south of the intersection of Constitution Court and Sinatra Drive to the north. An additional anomaly consistent with reinforced concrete or other structure at depth lies just north of the planter in this same general area. Additional in-phase anomalies are noted at the southern end of the site as shown on the figure. The anomalies have been called out in Figures 1 and 2. The EM quadrature data found several areas of lower conductivity which generally correspond to areas in the EM31 in-phase data. These areas of low conductivity may represent voids, steel reinforced concrete, utilities or other subsurface objects. B. Ground-Penetrating Radar (GPR) Results - GPR data were collected from the site and analyzed for the presence of subsurface objects. GPR data at the site was limited to a maximum depth of approximately 5 feet below grade. The data was processed and 2-D depth slices were created with the GPR-Slice data program, features of relatively higher reflectivity can be seen in the depths from the surface to approximately 5 feet below grade. (Refer to Appendix 1 - GPR Data Slices and Figure 3). Depth slices from approximately 6 feet and deeper show similar data patterns suggesting that this is the maximum depth of penetration due to saturated soils and/or the base of a structure that areas of the site is built upon. Utilizing the
Geophysical Investigation Report STG Project No. 1039 Stapleton Project, Lot B2 May 25, 2010 May 25, 2010
4
DGPS coordinates, the GPR data map at 4 to 5 feet below grade was then superimposed onto an aerial photograph from Google Earth. Refer to Figure 3 - GPR Data Map. The anomalous areas in red and yellow generally appear to correspond to the in-phase and conductivity anomalies and may represent areas with potential void space and or other subsurface structures. FINDINGS On June 9, 2010 SubTerra Geoservices LLC conducted a geophysical investigation at the property identified as the Hoboken Waterfront Project, Hoboken, New Jersey. The purpose was to investigate the site to determine if voids in the subsurface may be present at the site. The investigation included the use of a Geonics EM31-DL and a Sensors and Software Inc. Nogginplus SmartCart GPR System utilizing a 250 MHz antenna. STG observed anomalous areas in both the EM31 and GPR data that appears to be indicative of the possible subsurface voids or other structures in several locations at the site. The locations of the anomalous areas have been called out on the attached figures. These findings are based upon the interpretation of the geophysical data, therefore, conclusive identification of the anomalous data will require intrusive investigation. If there are any questions regarding this report, please contact the undersigned at 732-505-0990. This report has been prepared and is respectfully submitted by
SUBTERRA GEOSERVICES LLC June 21, 2010 DRU E. WILBUR, P.G. Date Geologist/President