Geophysical Journal International Geophys. J. Int. (2015) 202, 993–1004 doi: 10.1093/gji/ggv200 GJI Geodynamics and tectonics New Insights into the present-day kinematics of the central and western Papua New Guinea from GPS A. Koulali, 1 P. Tregoning, 1 S. McClusky, 1 R. Stanaway, 2 L. Wallace 3 and G. Lister 1 1 Research School of Earth Sciences, Australian National University, Canberra ACT 0200, Australia. E-mail: [email protected]2 School of Civil and Environmental Engineering, University of New South Wales, Australia 3 Institute for Geophysics, University of Texas at Austin, Austin, TX, USA Accepted 2015 May 12. Received 2015 March 4; in original form 2014 August 7 SUMMARY New Guinea is a region characterized by rapid oblique convergence between the Pacific and Australian tectonic plates. The detailed tectonics of the region, including the partitioning of relative block motions and fault slip rates within this complex boundary plate boundary zone are still not well understood. In this study, we quantify the distribution of the deformation throughout the central and western parts of Papua New Guinea (PNG) using 20 yr of GPS data (1993–2014). We use an elastic block model to invert the regional GPS velocities as well as earthquake slip vectors for the location and rotation rates of microplate Euler poles as well as fault slip parameters in the region. Convergence between the Pacific and the Australian plates is accommodated in northwestern PNG largely by the New Guinea Trench with rates exceeding 90 mm yr -1 , indicating that this is the major active interplate boundary. However, some convergent deformation is partitioned into a shear component with ∼12 per cent accommodated by the Bewani-Torricelli fault zone and the southern Highlands Fold- and-Thrust Belt. New GPS velocities in the eastern New Guinea Highlands region have led to the identification of the New Guinea Highlands and the Papuan Peninsula being distinctly different blocks, separated by a boundary through the Aure Fold-and-Thrust Belt complex which accommodates an estimated 4–5 mm yr -1 of left-lateral and 2–3 mm yr -1 of convergent motion. This implies that the Highlands Block is rotating in a clockwise direction relative to the rigid Australian Plate, consistent with the observed transition to left-lateral strike-slip regime observed in western New Guinea Highlands. We find a better fit of our block model to the observed velocities when assigning the current active boundary between the Papuan Peninsula and the South Bismark Block to be to the north of the city of Lae on the Gain Thrust, rather than on the more southerly Ramu-Markham fault as previously thought. This may indicate a temporary shift of activity onto out of sequence thrusts like the Gain Thrust as opposed to the main frontal thrust (the Ramu-Markham fault). In addition, we show that the southern Highlands Fold-and-Thrust Belt is the major boundary between the rigid Australian Plate and the New Guinea Highlands Block, with convergence occurring at rates between ∼6 and 13 mm yr -1 . Key words: Seismic cycle; Plate motions; Continental margins: convergent; High strain deformation zones; Crustal structure; Pacific Ocean. 1 INTRODUCTION Papua New Guinea (PNG) is one of the most tectonically complex regions in the world, involving microblocks rotating rapidly about nearby poles. The general tectonic framework of this region (Fig. 1) has been related to the southwest-northeast convergence between the Australian and Pacific plates at ∼110 mm yr -1 (Johnson & Molnar 1972; DeMets et al. 1994; Tregoning et al. 1998), imply- ing a convergence of more than 70 mm yr -1 across the PNG land mass (Tregoning et al. 1998; Tregoning & Gorbatov 2004). This zone of convergence is characterized by a variety of plate boundary types including subduction zones (New Guinea and New Britain Trenches), rifting (Woodlark), collision orogenesis (Finisterre Arc collision, and the New Guinea Highlands) and a strike-slip trans- form system (Bismarck Sea Seismic Lineation, BSSL; Fig. 1). The kinematics and the partitioning of deformation within this zone are still widely debated. For example, it has been considered that the southern parts of the New Guinea Highlands are stable areas of the northern rigid Australian Plate (Hamilton 1979); however, the spatial extent of the boundary separating the Australian Plate C The Authors 2015. Published by Oxford University Press on behalf of The Royal Astronomical Society. 993 at The Australian National University on June 15, 2015 http://gji.oxfordjournals.org/ Downloaded from
Transcript
Geophysical Journal InternationalGeophys. J. Int. (2015) 202, 993–1004 doi: 10.1093/gji/ggv200
GJI Geodynamics and tectonics
New Insights into the present-day kinematics of the centraland western Papua New Guinea from GPS
A. Koulali,1 P. Tregoning,1 S. McClusky,1 R. Stanaway,2 L. Wallace3 and G. Lister1
1Research School of Earth Sciences, Australian National University, Canberra ACT 0200, Australia. E-mail: [email protected] of Civil and Environmental Engineering, University of New South Wales, Australia3Institute for Geophysics, University of Texas at Austin, Austin, TX, USA
Accepted 2015 May 12. Received 2015 March 4; in original form 2014 August 7
S U M M A R YNew Guinea is a region characterized by rapid oblique convergence between the Pacific andAustralian tectonic plates. The detailed tectonics of the region, including the partitioning ofrelative block motions and fault slip rates within this complex boundary plate boundary zoneare still not well understood. In this study, we quantify the distribution of the deformationthroughout the central and western parts of Papua New Guinea (PNG) using 20 yr of GPSdata (1993–2014). We use an elastic block model to invert the regional GPS velocities aswell as earthquake slip vectors for the location and rotation rates of microplate Euler polesas well as fault slip parameters in the region. Convergence between the Pacific and theAustralian plates is accommodated in northwestern PNG largely by the New Guinea Trenchwith rates exceeding 90 mm yr!1, indicating that this is the major active interplate boundary.However, some convergent deformation is partitioned into a shear component with "12 percent accommodated by the Bewani-Torricelli fault zone and the southern Highlands Fold-and-Thrust Belt. New GPS velocities in the eastern New Guinea Highlands region have ledto the identification of the New Guinea Highlands and the Papuan Peninsula being distinctlydifferent blocks, separated by a boundary through the Aure Fold-and-Thrust Belt complexwhich accommodates an estimated 4–5 mm yr!1 of left-lateral and 2–3 mm yr!1 of convergentmotion. This implies that the Highlands Block is rotating in a clockwise direction relative tothe rigid Australian Plate, consistent with the observed transition to left-lateral strike-slipregime observed in western New Guinea Highlands. We find a better fit of our block modelto the observed velocities when assigning the current active boundary between the PapuanPeninsula and the South Bismark Block to be to the north of the city of Lae on the GainThrust, rather than on the more southerly Ramu-Markham fault as previously thought. Thismay indicate a temporary shift of activity onto out of sequence thrusts like the Gain Thrust asopposed to the main frontal thrust (the Ramu-Markham fault). In addition, we show that thesouthern Highlands Fold-and-Thrust Belt is the major boundary between the rigid AustralianPlate and the New Guinea Highlands Block, with convergence occurring at rates between "6and 13 mm yr!1.
Papua New Guinea (PNG) is one of the most tectonically complexregions in the world, involving microblocks rotating rapidly aboutnearby poles. The general tectonic framework of this region (Fig. 1)has been related to the southwest-northeast convergence betweenthe Australian and Pacific plates at "110 mm yr!1 (Johnson &Molnar 1972; DeMets et al. 1994; Tregoning et al. 1998), imply-ing a convergence of more than 70 mm yr!1 across the PNG landmass (Tregoning et al. 1998; Tregoning & Gorbatov 2004). This
zone of convergence is characterized by a variety of plate boundarytypes including subduction zones (New Guinea and New BritainTrenches), rifting (Woodlark), collision orogenesis (Finisterre Arccollision, and the New Guinea Highlands) and a strike-slip trans-form system (Bismarck Sea Seismic Lineation, BSSL; Fig. 1). Thekinematics and the partitioning of deformation within this zoneare still widely debated. For example, it has been considered thatthe southern parts of the New Guinea Highlands are stable areasof the northern rigid Australian Plate (Hamilton 1979); however,the spatial extent of the boundary separating the Australian Plate
C# The Authors 2015. Published by Oxford University Press on behalf of The Royal Astronomical Society. 993
Figure 1. Tectonic setting of the Papua New Guinea region. Topography and bathymetry are from SRTM (http://topex.ucsd.edu/www_html/srtm30_plus.html).Faults are mostly from the East and Southeast Asia (CCOP) 1:2000000 geological map (downloaded from http://www.orrbodies.com/resources/item/orr0052).AFTB, Aure Fold-and-Thrust Belt; OSZF, Owen Stainly fault zone; GF, Gogol fault; BTFZ, Bewani-Torricelli fault zone; RMFZ, Ramu-Markham fault zone;BSSL, Bismarck Sea Seismic Lineation.
from the New Guinea Highlands Block has never been uniquelyidentified. Wallace et al. (2004) described the New Guinea High-lands as a single block extending in a northwest-southeast directionfrom the New Guinea Trench to the Owen Stanley Range boundingthe Woodlark microplate and suggested that the central part of theNew Guinea Highlands is rotating as a rigid block. The sparsity ofWallace et al.’s (2004) GPS network in the Highlands made it diffi-cult for them to determine where the boundaries of the New GuineaHighlands block are, and how far west it continues.
Plate convergence obliquity has been suggested as one of thefactors causing the partitioning of deformation in subduction zonesby increasing the amount of shear stress present in the overridingplate (McCaffrey 1992, 1996). In the context of subduction zones,the total slip may be partitioned into shear and thrust components,which are accommodated on different structural components. TheNew Guinea Trench is an example of such a structure that ac-commodates oblique convergence between the Pacific and the NewGuinea Highlands, but the precise partitioning of the activity acrossthis boundary has been widely debated. Based on seismic tomog-raphy and locations of recent thrust events, Tregoning & Gorba-tov (2004) concluded that the New Guinea Trench is an active in-terplate boundary accommodating convergence specifically alongthe Wewak segment. However, the obliquity of Pacific/Australiaconvergence at the New Guinea Trench begs the question of howmuch of the strike-slip component is accommodated in the upperplate, as is observed at other obliquely convergent plate boundaries
(McCaffrey 1992, 1996). In northwest PNG, the primary candi-date for strike-slip in the upper plate is within the Bewani-Toricelliranges (Fig. 1).
In this paper, we present an updated GPS velocity field includingnew data from 1993 to 2014. We use the new velocity field togetherwith velocities along the colliding Finisterre arc (Wallace et al.2004) to assess the kinematics of plate boundaries in western andcentral PNG extending from the New Guinea Trench to the northernmargin of the Australian Plate in the south. We use the combinedGPS velocity field to constrain an elastic block model whose bound-ing fault geometry is based on available geologic and seismic datato understand the tectonic relationships and the dynamics of thedeformation in PNG.
2 T E C T O N I C S E T T I N G O F PA P UAN E W G U I N E A
The tectonic setting of the PNG region is associated with the in-teraction of four of the Earth’s major and highly dynamic litho-spheric plates: the Australian, Pacific, Philippine Sea and Sundaplates (Bird 2003; Hill et al. 2003). The tectonic evolution of theNew Guinea region has been dominated by the convergence of theAustralian (AUST) and Pacific (PACI) plates since the Cenozoic,resulting in a series of successive collisions (Johnson & Molnar1972; Davies et al. 1987). In northwestern New Guinea, the main
Figure 2. Focal mechanism for earthquakes, from the Global CMT catalogue, with Mw > 5.5 and depth less than 100 km. Seismicity is from ISC Bulletinwith magnitudes more than 4.8 and depth between 0 and 60 km depth (1964 to April 2012).
structural units accommodating the AUST–PACI convergence arethe left-lateral strike-slip motion on an E-W fault system associatedwith the BSSL and the New Guinea Trench, where the Pacific Platesubducts beneath continental PNG (Fig. 1). Further to the east, theRamu-Markham fault zone (RMFZ) and the New Britain Trenchform the boundary separating the New Guinea Highlands and thePapuan Peninsula from the South Bismarck Plate. The latter formedin the Late Miocene when the Finisterre volcanic arc collided withthe New Guinea land mass, rapidly uplifting the Finisterre Rangesand Huon Peninsula (Abbott et al. 1994b). This southeastward prop-agating collision has been related to the closure of the Solomon Sea(Abbott et al. 1994a).
Seismological studies of the region (Abers & McCaffrey 1994;Pegler et al. 1995) delineate many major features related to NewBritain Trench Wadati-Benioff zone. The southern Highlands Fold-and-Thrust belt shallow events mark the boundary of collisionalorogenesis (Abers & McCaffrey 1988; Fig. 2). Large, shallow earth-quakes located beneath the Finisterre Ranges were attributed tothe north dipping ramp-detachment thrust system of the Ramu-Markham valley (Stevens et al. 1998). Fig. 2 shows a northeasttrending zone of shallow strike-slip events north of Madang andsouth of the Adelbert Ranges. Abers & McCaffrey (1988) suggestedthat this structure is related to many strike-slip events dividing theHuon Peninsula-Finisterre Ranges into small blocks rotating in aclockwise direction. Previous GPS results were inconclusive withrespect to this hypothesis (Wallace et al. 2004).
The largest earthquakes in our study area have occurred in thenorthern coastal region of the New Guinea and are associated with
ongoing subduction at the New Guinea Trench (Okal 1999). Manyof these earthquakes generated devastating tsunamis, such as theAitape Earthquake (Mw 7.0; 141.926$E) in 1998 and the Mw7.6 earthquake that occurred on 8 September 2002 near Wewak(142.870$E) (Davies et al. 2002; Borrero et al. 2003). Most earth-quake focal mechanisms available for this region are indicative ofthrust events, which argues for the existence of active oblique sub-duction beneath the north coast of New Guinea.
Previous GPS studies in PNG (McClusky et al. 1994; Stevenset al. 1998; Tregoning et al. 1998; Tregoning et al. 1999; Wallaceet al. 2004) have quantified the horizontal velocity field. Tregoninget al. (1998) presented a velocity field from 20 stations well dis-tributed over the New Guinean region, observed over 5 yr. They sug-gested a plate tectonic model including, in addition to the Australianand Pacific plates, the Solomon Sea Plate, the South Bismarck Plate,the Woodlark Plate as well as an additional North Bismarck Plate.Wallace et al. (2004) expanded the PNG network with an additional35 stations covering the major part of the Finisterre arc-continentcollision and continuing into parts of the New Guinea Highlands.They presented a model of six blocks, including the previously de-fined five blocks of Tregoning et al. (1998) plus a New GuineaHighland block. They suggested that edge forces, initiated by thecollision between the Finisterre Arc and the New Guinea High-lands, control the rapid clockwise rotation of the South BismarckPlate. Based on a block model constrained with GPS velocitiesand earthquake slip vectors, they also quantified the slip-deficitalong the Ramu-Markham fault and found that large portions of thisfault are locked, accommodating up to 61 mm yr!1 of convergence
between the New Guinea Highlands and Australian plates. How-ever, the convergence pattern and rate in the plate boundary zone tothe Northwest of the Finisterre collision has not been studied dueto the lack of GPS observations.
3 G P S O B S E RVAT I O N S A N D A NA LY S I S
3.1 Data processing
Our GPS velocity field is derived from data collected at GPS sitesfrom 1993 to 2014. We have reprocessed GPS data collected be-tween 1993 and 1999 and added new observations from 2000 until2014. Most of the sites were observed with Ashtech ZXII and Trim-ble 4000SSI receivers and choke-ring antennas and were occupiedat least 2 d yr!1 during the data collection period. We have used 36campaign stations and three continuous GPS stations.
GPS observations were processed with the GAMIT/GLOBK soft-ware suite (Herring et al. 2010a,b,c). GPS data from 25 InternationalGNSS Service (IGS) stations were included to tie our local networkto the ITRF2008 reference frame. We analysed the GPS data usinga three-step approach (Reilinger et al. 2006). In the first step, weused GPS phase observations to estimate daily positions, togetherwith atmospheric, orbital and Earth orientation parameters, usingloose a priori constraints. In the second step we combined these po-sitions and their covariances with global GPS solutions computedas part of MIT’s processing for the IGS. We then examined theposition time-series for outliers and offsets due to earthquakes orantenna changes and corrected these as appropriate. In a third step,we combined all of the data in a single solution, estimating posi-tions and velocities for the period 1993–2014. In both the secondand third steps we mapped the loosely constrained solution into awell-constrained reference frame by minimizing the position andvelocity differences of selected sites with respect to a priori valuesdefined by the IGS08 realization of the ITRF2008 reference frame(Altamimi et al. 2011). During this step, we used the ‘stable-site’ ap-proach of Tregoning et al. (2013), by adopting their eight carefullyselected reference sites with long-term stable behaviour that are lessaffected by earthquake deformations and hydrological loading.
Following the approach proposed by Reilinger et al. (2006), weaccounted for temporally correlated errors by including a random-walk component estimated for each continuous site using the ‘real-istic sigma’ algorithm of Herring et al. (2010c) (see also Reilingeret al. 2006). The median value of the random-walk, obtained fromcontinuous time-series, is 0.3 mm/
%yr. For campaign stations we
have set a value of 1.0 mm/%
yr for the horizontal components. GPStime-series were inspected for instrumental changes as well as pos-sible coseismic offsets from major earthquakes in the region. Sincewe did not have sufficient independent observational constraints onthe coseismic displacement for the majority of the earthquakes thathappened in the New Guinea region, we have opted to correct forcoseismic offsets by inspecting GPS time-series themselves. Wehave corrected for the 1999 Mw 6.4 event, 20 km north of Lae, andthe 2001 Mw 6.4 earthquakes near Bulolo (16 km north of Lae).The time-series of VANI and ANGS sites have been inspected forthe effect of the 1998 Aitepe earthquake and a short post-seismicrelaxation has been observed only in VANI. However, to avoid anypost-seismic contamination of the linear rate, we opted to estimatethe velocity using only the observations after 4 yr from the earth-quake, extending between 2003 and 2008. As observations of sitesnorthwest of Madang were obtained before and after the 2002 Mw7.6 Wewak earthquake, we have modelled time-series using a linear
combination of a secular interseismic rates and a logarithmic termwith 10 d decay time, in order to take into account the post-seismictransient effect. We have chosen the decay constant that reduces theWRMS of the time-series residuals. We have excluded from ouranalysis the site BUTM, because it has been observed only twiceafter the Wewak earthquake, which resulted in an unconstrained fitof a logarithmic decay function. We have verified also the possibleeffect of the Solomon Sea 2007 Mw 8.1 earthquake for sites locatedin the Aure Fold-and-Thrust Belt region, using the surface displace-ments predicted by the model of Tregoning et al. (2013). However,the expected coseismic offset estimates were less that 1 mm, so wedo not correct for this particular earthquake. We did not correct forMw 6.7 Kutubu earthquake (New Guinea Highlands) because mostof the stations that may have been influenced by this earthquake werefirst measured after the 2000 earthquake had occurred. Other sitesthat were measured before these events in the southern HighlandsFold-and-Thrust belt were too far away from this earthquake to beoffset, and no jumps were detected in their time-series. The WRMSfit of our solution with respect to the IGS08 is 0.43 mm yr!1, and0.56 mm yr!1 for the north and east components respectively. TheGPS velocities and their uncertainties are shown in Fig. 3 and givenin Table S1 of the supplementary material in an Australian-fixedreference frame.
We have combined our velocity field with the velocities pub-lished by Wallace et al. (2004), after rotating their velocities fromITRF2000 to an Australia-fixed reference frame using 16 commonsites between the two velocity solutions and located in the stablepart of the Australian and Pacific plates. For our analysis, we useonly horizontal velocities: we do not use the vertical estimates sincethey have large uncertainties with respect to the expected verticalmotion in the region and there is a considerable likelihood of heighterrors having been introduced through the use of tripod-mountedantenna at the campaign GPS sites.
3.2 Velocity field
Fig. 3 shows the derived horizontal velocity field (with 95 per centconfidence ellipses) with respect to an Australian-fixed referenceframe. The new velocity field shows many distinct patterns. It con-firms the overall NE-SW convergence between the Australian andPacific plates with a rate of "111 mm yr!1. The striking featuresof the velocity field are: (i) the high convergence on the Ramu-Markham fault accommodating under-thrusting of the New GuineaHighlands beneath the Finisterre terrane, consistent with previousstudies (Stevens et al. 1998; Tregoning et al. 1998; Wallace et al.2004), (ii) the decrease of the relative velocity magnitude from"24 mm yr!1 south of the New Guinea Trench (at sites ANGS,VANI and BEWA) to "3 mm yr!1 in the southern Highlands Fold-and-Thrust Belt (sites TELE, TABU and TAB2). However, the lackof GPS spatial coverage makes this gradient poorly constrained eastof 142$E, (iii) the tendency for rates to decrease from east to westacross the Adelbert range (3.5–4$S; Fig. 3), delineating the even-tual northeastern boundary of the New Guinea Highlands block thatextends west of the Ramu-Markham fault.
Velocities south of the Finisterre Range and north of the PapuanPeninsula show different southwestward motion, distinct from theNew Guinea Highlands block, with a likely anticlockwise rotation(Fig. S1). KAIN, BULO and KERE stations show a significantvelocity of "9.0±1.4 mm yr!1 with respect to the Australian Plate,indicating that the boundary of the rigid Australian Plate lies southof those stations, likely along the Aure Fold-and-Thrust Belt (Fig. 3).
Figure 3. The GPS velocity field and 95 per cent confidence interval ellipses with respect to the Australian Plate. Red and blue vectors are the new calculatedfield and black vectors are from Wallace et al. (2004). The dashed rectangle shows the area of Fig. 3. The blue dashed lines correspond to the location ofprofiles shown in Fig. 4. Note that the velocity scales for the red and blue vectors are different (see the lower right corner for scales). The black velocities areplotted at the same scale as the red vectors.
In order to increase our understanding of the deformation mech-anisms relative to these changes, as well as the spatial variation incrustal strain rates, we construct an elastic block model which weconstrain with GPS velocities, geologic and seismological data.
4 K I N E M AT I C I N T E R P R E TAT I O N
4.1 Modelling approach
As described previously, the tectonics of PNG involves rapid crustalblock rotations and high rates of strain accumulation in regionsadjacent to active plate boundaries. Thus, the estimation of tectonicblocks rotations from interseismic GPS velocities needs to accountfor the elastic strain due to locking on block bounding faults. Anelastic block model as described by (McCaffrey 2005; Meade &Hager 2005) is able to decompose the elastic deformation and themotion from block rotations in GPS velocities and therefore enablesdescribing faults proprieties accommodating the deformation withinthe northwestern region of PNG.
We use the block model inverse approach in DEFNODE(McCaffrey 2005; McCaffrey et al. 2013), to invert velocities andearthquake slip vectors to solve simultaneously for the angular ve-
locities of blocks and locking on block boundary faults. The opti-mization problem is solved using the simulated annealing method(Press et al. 1989) by minimizing the reduced chi-square of the misfitto the weighted data. DEFNODE adopts a backslip approach (Sav-age 1983) and the elastic half-space formulation of Okada (1985)to account for strain accumulation on block bounding faults, andthe locking on faults is parameterized by the coupling coefficient !,defined as the ratio between the short- and long-term slip rates. Thisparameter can be estimated in the inversion along with the angularblock velocities.
Here we use our newly calculated velocity field, along withthe published velocities of Wallace et al. (2004), to better con-strain the motion in the southern part of the Ramu-Markham fault.We have discarded all the velocities that have been derived fromonly two observations. We also include the velocity estimates fromTregoning et al. (1999) to constrain the motion of the South Bis-marck Plate, after aligning them to an Australian-fixed referenceframe. Because this solution was calculated in ITRF97 referenceframe, we have down-weighted the velocity uncertainties by a factorof two in order to account for errors that might be introduced fromthe discrepancies of reference frames. In addition to our regionalGPS network, we have included 25 well-distributed continuous
stations on the Australian and Pacific plates in order to constrainthe angular velocity of the large bounding plates. To the west ofthe Aure Fold-and-Thrust Belt, velocities from sites GOBE, TARI,MORA and IAGI show an inconsistent pattern of motion with theregional tectonic style, which we do not fully understand and wespeculate that might be related to frequent landslides in this region.Therefore, we have excluded them from the inversion. In addition toGPS velocities described previously, we have used 241 earthquakeslip vectors. Earthquake slip vectors azimuths were calculated fromthe global CMT focal mechanisms catalogue (Ekstrom et al. 2012)for shallow earthquakes with depths less than 40 km and we haveassigned an uncertainty of 15$ to all events (given the complexityof plate boundary in the PNG).
4.2 Blocks and fault geometries
The new GPS velocities presented in this study allow us to verify thenature of these tectonic boundaries and understand the mechanismsbehind the long-term geologic deformation.
Here, we suggest a new model geometry based on seismic-ity, mapped faults (Baldwin et al. 2012; Davies 2012) and theGPS velocity field, revising the block model published by Wallaceet al. (2004). We have augmented our blocks boundary definitionswith the mapped fault lineations from the Coordinating Commit-tee for Geoscience Programs in East and Southeast Asia (CCOP)1:2000000 geological map of SE Asia (Fig. 1). We use eight blocksto describe the regional motion. We use the previously definedWoodlark Block, extending from the Woodlark seafloor-spreadingcentre to the New Britain Trench, and we do not take include the Tro-briand microplate (Kington & Goodliffe 2008) since we do not haveGPS data from this region. The motion of this block has been con-strained using additional velocities from Wallace et al. (2014). TheSouth Bismarck Plate extends as a backarc behind the New BritainTrench in the south to the transform fault zone along the BSSL.Tregoning (2002) showed that the relative motion of sites north ofthe BSSL (KAVI, WUVU and MANU) is systematically differentfrom rigid Pacific Plate motion, favouring the hypothesis that theManus Trench is an active plate boundary, albeit at a slow rate(<1 cm yr!1). In the present study, we have included, in additionto the three campaign sites, a new campaign site (TARO) north ofWewak and the continuous GPS site (PNGM) on Manus Island,using time-series spanning over 6 yr. The estimated velocity of thissite shows a residual with respect to the Pacific Plate, after account-ing for transient post-seismic deformation associated with the 2002Mw 7.6 Wewak earthquake, of 5 ± 0.6 and 3.5 ± 0.6 mm yr!1
for the northern and eastern components respectively, in agreementwith the northward systematic pattern to the residuals shown byTregoning (2002). Therefore we included in our model the NorthBismarck microplate to the north of the BSSL and Manus Basin.
In our study, we have modelled the Papuan Peninsula as a separateblock (PPBL) from the main New Guinea Highlands block, in con-trast with previous studies (Wallace et al. 2004). In the southwestwe define the boundary between the Australian and the Highlandsblocks as the southernmost expression of the Highlands Fold-and-Thrust Belt. The northern boundary of the New Guinea Highlandsblock is defined as the Bewani-Torricelli fault zone, which linksin the east to the offshore transform faults in the Bismarck Sea(BSSL), and to the Yapen fault in the west.
We have included in our model a separate Adelbert microplate(ADBL) northwest of the Finisterre Range (Fig. 1), bounded bythe Adelbert Range to the west of Madang, and by the Gogol fault
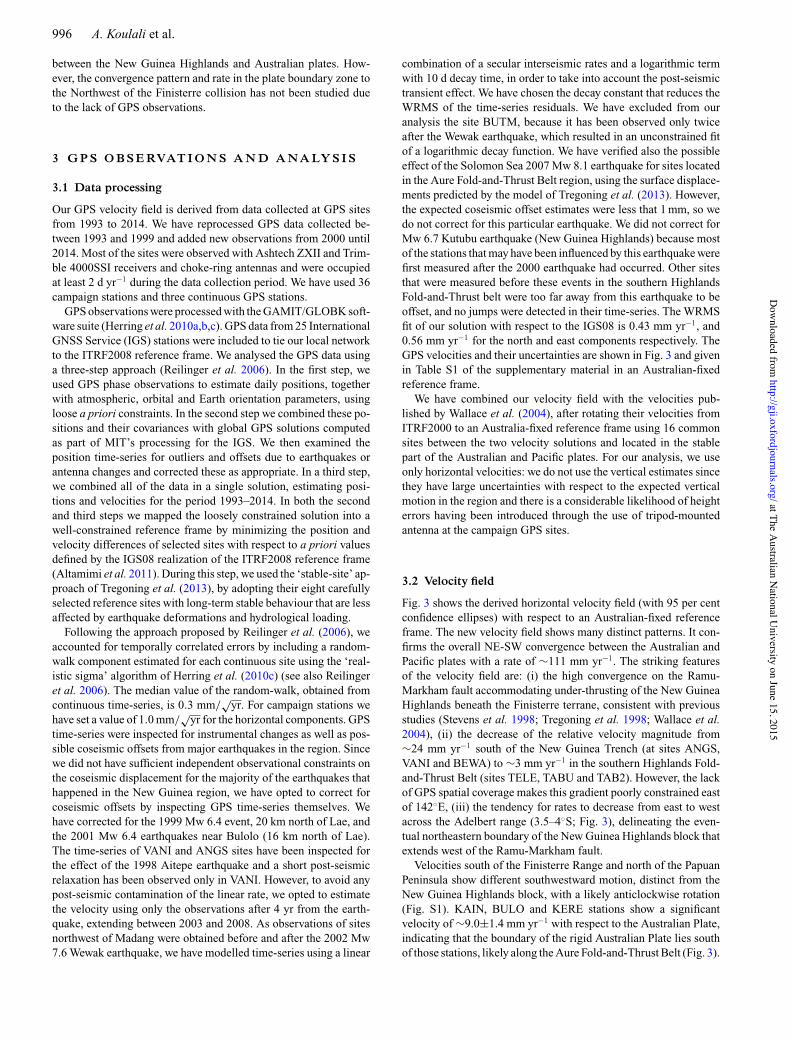
Figure 4. The GPS velocity field and 95 per cent confidence interval ellipseswith respect to the Australian Plate zoomed on the dashed rectangle in Fig. 2(blue vectors). The black vectors are from Wallace et al. (2004). For claritypurpose, we do not show uncertainties of black vectors. Faults lineaments arefrom the East and Southeast Asia (CCOP) 1:2000000 geological map. Thered lines correspond to the Gain, Wongat Thrust South and North Traces,and the Ramu Markham fault from Abbott et al. (1994a).
on the southwest flank of the Adelbert Ranges (Fig. 1). Abbott(1995) and Wallace et al. (2004) previously speculated about theexistence of this block based on geological observations and thenortheast-southwest zone of seismicity extending north of Madanginto the South Bismark Sea. Based on a plate reconstruction model,Holm & Richards (2013) suggested that the Adelbert microplate wasformed following the fragmentation of the South Bismarck Plate inresponse to the collision with the thickened crust of the Bundi-OwenStanley suture zone. Moreover, the topographic contrast between theAdelbert and Finisterre ranges may also be a result of the differentialmotion between the Adelbert microplate and the South BismarckPlate.
Unlike previous active tectonics studies in PNG (Stevens et al.1998; Wallace et al. 2004), we considered the surface expression ofthe southern part of the Ramu-Markham ramp and detachment faultto be north of Lae and the Ramu-Markham Valley, following theGain Thrust (Fig. 4). This geometry is consistent with the Out-of-Sequence (OOS) Thrust model proposed by Abbott et al. (1994a),who showed that the Gain Thrust is a likely active structure, sinceit cuts the colluvium. The lack of seismicity in the upper 10 km inthe Lae region due to the presence of 5 to 6 km weak layer of sedi-ments (Kulig et al. 1993) may suggests that this region is deformingwithout elastic stain accumulation. On the other hand, our proposedgeometry is inconsistent with inferred geological uplift in the re-gion ("2 mm yr!1 in Lae city) (Crook 1989), and the projection ofthe Atzera Anticline (an actively growing anticline) to the south ofLae, as well as the inferred projection of the RMFZ beneath Laebased on seismological studies (e.g. Kulig et al. 1993). If much ofthe relative plate motion is currently being accommodated by theGain thrust, this is also consistent with the hypothesis of Abbottet al. (1994a) that the Wongat Thrust south Trace ceased activityduring the last "100 Ka, that the Gain Thrust was initiated and isstill active to the present-day. An alternative model, which also pro-duces a good fit to the data (Wallace et al. 2004), assumes that the
Ramu-Markham fault projecting south of Lae is the major boundaryseparating the upper plate of South Bismarck Block and the NewGuinea Highlands, which is more consistent with seismological andgeomorphological evidence (Crook 1989; Kulig et al. 1993). To fitthe GPS data with this scenario, Wallace et al. (2004) assumed theRamu-Markham fault is a shallowly dipping detachment at depth(>20 km), and steepens to a ramp from "20 km depth to within1 km of the surface beneath Lae, and then shallows again to a lowangle detachment projecting beneath Lae. Full locking of the rampand shallow detachment structure provides a reasonable fit to thedata in the Lae area as well. Locking of the shallow detachmentleads to a surface deformation pattern that mimics the lower plate.
The profile B–B& in Fig. 6 shows a comparison between the twoalternative models, showing the location of the velocity magnitudechange in the SW–NE direction across the foothills line of the Finis-terre mountains. Although the fit to the GPS velocities is reasonablysimilar in both scenarios, the GPS observations are fit best whenwe use the Gain Thrust as the primary boundary, rather than theprojection of the Ramu-Markham fault south of Lae("2/dof = 1.7versus " 2/dof = 2.7 for alternate model). It is also possible thatboth structures (Gain Thrust and Ramu-Markham fault) are accom-modating active deformation, but we do not have sufficient GPSdata to reliably test this hypothesis. Based on the better fit to theGain Thrust scenario, we prefer the hypothesis that the Gain Thrustis currently accommodating a larger proportion of the plate motion.However, given the geological and seismological evidence that theRamu-Markham fault projects to the south of Lae, the higher ratesobserved for the Gain Thrust may only be temporary.
As part of the inversion, we solved for the degree of couplingalong the Ramu-Markham fault, the New Guinea Trench, the west-ern BSSL, the New Guinea Highlands thrust and the Adelbert fault.The rest of the fault segments, where we do not have good GPScoverage, have been either defined as locked to a depth of 15 kmor as freely slipping boundaries. To first order, we have chosen asimplistic geometry of the modelled fault in order to not over fit theGPS velocities and to reduce the number of estimated parameters.We estimated the coupling along the Ramu-Markham fault at eachnode (in contrast to the New Guinea Trench inversions), becausehere we have good spatial coverage of GPS sites; hence, a greaterlikelihood of being able to recover an accurate, spatially varyingslip deficit estimate. To regularize the solution of the coupling alongthe Ramu-Markham fault/Gain Thrust, we applied smoothing con-straints on the gradient of the along-strike coupling coefficient. Thebest smoothing coefficient was chosen assuming a trade-off be-tween the minimum " 2/dof statistics and reasonable distribution ofthe coupling along the fault plane.
We assume the New Guinea Trench is the boundary between thePacific/North Bismarck plates and the New Guinea mainland. Theinterface is modelled as a 25$ dipping surface beneath the PNGmainland (Tregoning & Gorbatov 2004). Seismicity clusters areconcentrated mainly east of 141$E along this trench and indicatethat active deformation extends south to 3$S (Fig. 1). As the GPSsites distribution along this trench does not allow for a resolutionof the coupling in the downdip direction, we have adopted a simpleparameterization of the coupling distribution as two uniform partsalong-strike. Then we have run a series of experiments, varyingthe coupling ratio from 0 to 100 per cent. Our results suggestedthat the best fit is reached with a coupling of 20 and 10 per centin the western and eastern segments, respectively. The relativelylow coupling observed on the New Guinea Trench coincides withmoderate seismicity along the lowest coupling area between 139$Eand 135$E (Okal 1999). The result of low coupling suggests that
the New Guinea Trench is mostly creeping, perhaps with somesmall asperities surrounded by creeping areas, which is compatiblewith the frequent, moderate seismicity observed at the New GuineaTrench.
4.3 Model results
The advantage of using a block model to represent the present-daycrustal motion arises from its flexibility to allow us to test differ-ent plate boundary geometries and check which changes providesignificant improvements in fitting the observations and thus in ourunderstanding of the kinematics of the studied region (Payne et al.2012). In order to check the significance of our proposed geometry,we have first constructed a block model assuming a single NewGuinea Highlands block as suggested by Wallace et al. (2004). Thismodel produces a " 2/dof = 3.43 and does not provide a good fit tothe velocities south of Finisterre terrain and Aure Fold-and-ThrustBelt (KWAP, MENY, KAIN, KERR, LAE1, NADZ). As we sepa-rate the New Guinea Highlands block into a Papuan Peninsula block(PPBL) and a New Guinea Highlands block (HLBL), without con-sidering a forearc block (FORE) in the north (just to the south of theNew Guinea Trench), we observe a decrease of the "2/dof to 2.56.The two sites located in the Adelbert Range (BOGI and BAMI)show a distinct motion and their velocities do not fit either the southBismarck block or the New Guinea Highlands block. A model with-out an independent Adelbert block (but with a free PPBL, HLBL,and FORE blocks) produces a slightly higher " 2/dof = 2.29, sug-gesting that the Adelbert block is a separate entity. Finally, includinga FORE block gives a much improved fit with "2/dof = 1.75. Todetermine if the improvement in fit of the model resulting from theaddition of these new blocks is statistically significant, we have usedthe F-ratio test with a confidence level of 95 per cent between thetwo models (Stein & Gordon 1984). We found that the improvementin fit after splitting the New Guinea Highlands block is significantand greater than expected by chance (Table S3 for F-test summary).Finally, for the validation of our preferred geometry of the southernboundary of the South Bismarck Plate, we compare our preferredmodel (where the Gain Thrust currently takes most of the plate mo-tion), with the geometry of Wallace et al. (2004), where the RamuMarkham fault projects to the south of Lae. The latter model pro-duces a " 2/dof value of 2.77, thus the improvement in fit from ourpreferred model is statistically significant.
Fig. 5 shows the comparison between the observed and the cal-culated velocities for our preferred model. The "2/dof misfit of ourpreferred model is 1.75 for 505 observations (132 GPS velocitiesand 241 earthquake slip vectors) and 57 estimated parameters. Theresidual GPS velocities for the most of our study area are withintheir uncertainties and do not show systematic patterns (Figs 2S and3S), with the exception of the segment south of Wewak, which wethink is due to residual post-seismic signal from 2002 Wewak earth-quake. The normalized rms for the GPS residuals is 1.39 mm yr!1
(1.32 mm yr!1 for the east component and 1.45 mm yr!1 for thenorth component) and the weighted rms are 0.49 and 0.55 mm yr!1
for the eastern and northern components, respectively.Fig. 6 shows the observed and predicted velocity profiles normal
and parallel to the main structures. In general GPS velocities agreewith the model, within their uncertainties, for both AA& and BB& pro-files. The profile AA& shows that the model reproduces the step ob-served in the GPS velocities across the two main boundaries: southof the Highlands Fold-and-Thrust Belt and the Bewani-Torricellifault. The profile BB& fits the observed velocities well except at the
Figure 5. Observed (red) and modelled (black) GPS velocities (see the text for discussion). The dashed blue box in (a) shows the region of Fig. 4(b). Errorellipses are 95 per cent confidence interval. Note that for subfigure (a), the velocity scales for the red and blue vectors are different (see the lower right cornerfor scales).
Figure 6. Profiles A–A& and B–B& from Fig. 2 showing model fit to GPS observations. Red symbols and lines are the GPS observed and modelled velocities,respectively, for the profile-normal component. Blue symbols and lines correspond to the profile-parallel component. The green and pink lines corresponds tothe model using the Ramu-Markham fault geometry from Wallace et al. (2004), south of Lae. Grey profiles show the projected topography. The seismicity isfrom the ISC catalogue for events > Mw3.5 (1960–2011).
far northeastern end of the profile where the downdip extent andgeometry of the Ramu-Markham fault is largely unconstrained.
5 D I S C U S S I O N
5.1 Slip partitioning in New Guinea
Previous studies showed some evidence of the existence of an ac-tive subduction zone where the Pacific Plate underthrusts northernPNG, known as the New Guinea Trench. Hamilton (1979) showedseismic reflection profiles along the Wewak segment indicatingsouth-dipping underthrusting. Using a more accurate data set ofP- and S-wave arrival times and hypocentre locations, Tregoning &Gorbatov (2004) supported these observations by showing a south-west dipping slab in the eastern part of the New Guinea Trench. Therelative motion across this boundary has been the subject of spec-ulation and has never been quantified. Kroenke (1984) and Clooset al. (2005) suggested that New Guinea Trench is a relict of anearlier subduction and that only the Wewak eastern segment has
been reactivated. Conversely, our model predicts oblique conver-gent motion across the trench up to "66.4 ± 1.6 mm yr!1 taken upby the subduction of the Pacific Plate at the New Guinea Trench,including the western segment between 140$E and 142$E, wherea coherent pattern of crustal deformation from GPS is available.Given the total relative motion of 111 mm yr!1 between the Pacificand Australian plates, the New Guinea Trench accounts for "59 percent for the margin normal (convergent) component and 66 per centfor margin parallel (left-lateral strike-slip) motion, while "12 percent of both of shortening as well as shear are distributed betweenthe Bewani-Torricelli fault and the west New Guinea Highlandsfault.
It has been recognized that an active fault zone (the Bewani-Torricelli fault zone) runs through the narrow band of erodedmountains known as the Bewani and Toricelli mountains. Dow(1977) interpreted the intensively faulted Pliocene sediments northof the Bewani-Torricelli mountains as an indication of recent activ-ity of this fault zone. However, the rate and kinematics of activityalong this boundary has never been quantified. Sapiie & Cloos(2004) suggested that this fault system is the major boundary which
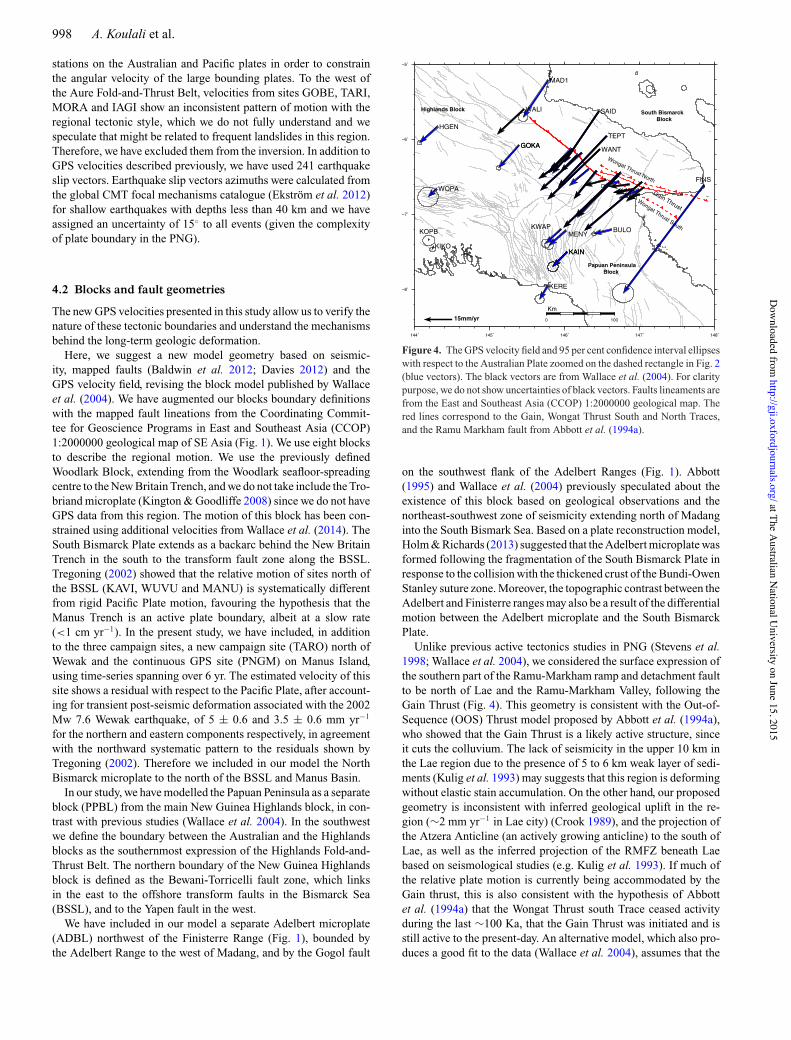
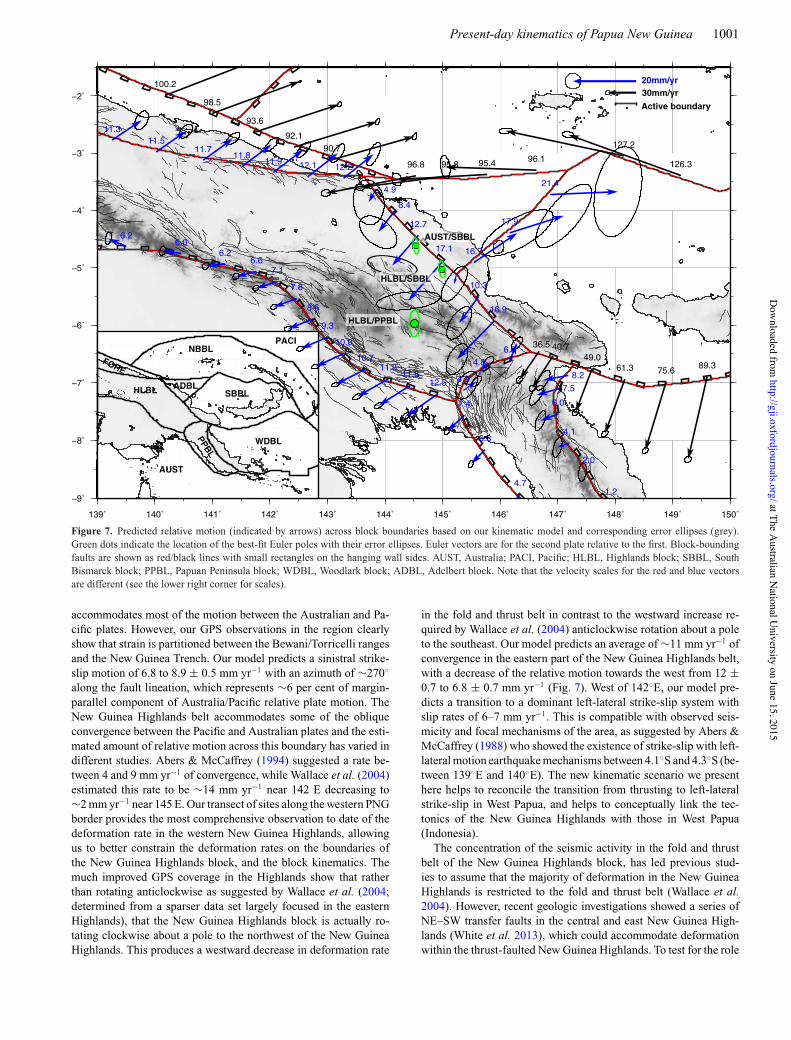
Figure 7. Predicted relative motion (indicated by arrows) across block boundaries based on our kinematic model and corresponding error ellipses (grey).Green dots indicate the location of the best-fit Euler poles with their error ellipses. Euler vectors are for the second plate relative to the first. Block-boundingfaults are shown as red/black lines with small rectangles on the hanging wall sides. AUST, Australia; PACI, Pacific; HLBL, Highlands block; SBBL, SouthBismarck block; PPBL, Papuan Peninsula block; WDBL, Woodlark block; ADBL, Adelbert block. Note that the velocity scales for the red and blue vectorsare different (see the lower right corner for scales).
accommodates most of the motion between the Australian and Pa-cific plates. However, our GPS observations in the region clearlyshow that strain is partitioned between the Bewani/Torricelli rangesand the New Guinea Trench. Our model predicts a sinistral strike-slip motion of 6.8 to 8.9 ± 0.5 mm yr!1 with an azimuth of "270$
along the fault lineation, which represents "6 per cent of margin-parallel component of Australia/Pacific relative plate motion. TheNew Guinea Highlands belt accommodates some of the obliqueconvergence between the Pacific and Australian plates and the esti-mated amount of relative motion across this boundary has varied indifferent studies. Abers & McCaffrey (1994) suggested a rate be-tween 4 and 9 mm yr!1 of convergence, while Wallace et al. (2004)estimated this rate to be "14 mm yr!1 near 142 E decreasing to"2 mm yr!1 near 145 E. Our transect of sites along the western PNGborder provides the most comprehensive observation to date of thedeformation rate in the western New Guinea Highlands, allowingus to better constrain the deformation rates on the boundaries ofthe New Guinea Highlands block, and the block kinematics. Themuch improved GPS coverage in the Highlands show that ratherthan rotating anticlockwise as suggested by Wallace et al. (2004;determined from a sparser data set largely focused in the easternHighlands), that the New Guinea Highlands block is actually ro-tating clockwise about a pole to the northwest of the New GuineaHighlands. This produces a westward decrease in deformation rate
in the fold and thrust belt in contrast to the westward increase re-quired by Wallace et al. (2004) anticlockwise rotation about a poleto the southeast. Our model predicts an average of "11 mm yr!1 ofconvergence in the eastern part of the New Guinea Highlands belt,with a decrease of the relative motion towards the west from 12 ±0.7 to 6.8 ± 0.7 mm yr!1 (Fig. 7). West of 142$E, our model pre-dicts a transition to a dominant left-lateral strike-slip system withslip rates of 6–7 mm yr!1. This is compatible with observed seis-micity and focal mechanisms of the area, as suggested by Abers &McCaffrey (1988) who showed the existence of strike-slip with left-lateral motion earthquake mechanisms between 4.1$S and 4.3$S (be-tween 139$E and 140$E). The new kinematic scenario we presenthere helps to reconcile the transition from thrusting to left-lateralstrike-slip in West Papua, and helps to conceptually link the tec-tonics of the New Guinea Highlands with those in West Papua(Indonesia).
The concentration of the seismic activity in the fold and thrustbelt of the New Guinea Highlands block, has led previous stud-ies to assume that the majority of deformation in the New GuineaHighlands is restricted to the fold and thrust belt (Wallace et al.2004). However, recent geologic investigations showed a series ofNE–SW transfer faults in the central and east New Guinea High-lands (White et al. 2013), which could accommodate deformationwithin the thrust-faulted New Guinea Highlands. To test for the role
of permanent internal block strain rate, we solved for an additionalparameter corresponding to the three components of the horizon-tal strain rate tensor within the New Guinea Highlands block, touniformly strain the block. However, this did not lead to any im-provement in the " 2/dof statistics (" 2/dof = 1.9), suggesting thatthe block, as defined in our study, is likely behaving as a largelyrigid body.
5.2 Implications for the BSSL
As mentioned in Section 4.2, we have defined the North Bismarckmicroplate as the block between the Manus Trench and the BSSL(Taylor et al. 1991; Tregoning et al. 1999). The subduction pro-cess in the Manus trench is often thought to have terminated andthere is no strong seismic or geologic available evidence of ongo-ing under-thrusting beneath the North Bismarck Plate. The earlierGPS investigations of Tregoning et al. (1998) did not find con-clusive evidence for a North Bismarck Plate. However, with moreobservations, Tregoning (2002) showed that the relative motion ofthe sites located north of the BSSL is significantly different from thePacific Plate. Our model predicts 3 to 5 ±1.4 mm yr!1 convergencealong the Manus Trench, consistent with previous geodetic studies(Tregoning 2002; Wallace et al. 2004). On the southern side of theNorth Bismarck Plate, the left-lateral fault zone BSSL takes mostof the relative motion between the Pacific and the south Bismarckplate. We predict a relative motion in the western boundary of theBSSL fault segment, east of the triple junction, with a strike-slipcomponent of "95 ± 2.0 mm yr!1, and a convergent component of"15 ± 1.9 mm yr!1 in the most western part of the lineation. Ourestimate is consistent with the predominantly shallow left-lateralfocal mechanisms that have occurred in this region (Fig. 7).
The shift from mostly strike-slip and extension on the BSSL tothe east compared with a compressional component to the westwas also observed in the block model of Wallace et al. (2004),and is related to the orientation of the BSSL there combined withanticlockwise rotation of the North Bismarck Block with respectthe South Bismarck Plate, leading to strain partitioning into mul-tiple fractures accommodating the oblique convergence across thewestern portion of the BSSL (Llanes et al. 2009).
5.3 The kinematics of the Finisterre and Adelbert collision
We set the western boundary of the ADBL to follow the topographiccontrast along the Adelbert Range, northwest of Madang (Fig. 1),while taking into account the lateral variation of the observed ve-locity field further north (Fig. 3). The difference in motion betweenBAMI and BOGI in the east and most of the site velocities westof the proposed boundary indicate that the western ADBL bound-ary is taking up the relative motion between the Adelbert and theNew Guinea Highlands blocks. Our model shows a small conver-gence between 5 and 16 mm yr!1, decreasing towards the north. Theeastern boundary of the ADBL accommodates the relative motionbetween the Adelbert and the South Bismarck Block with a rate of16 and 21 mm yr!1 of left lateral motion increasing towards thenorth. This result is still uncertain given that the ADBL motion isdefined by only two site velocities, while the slip-vectors constraintsprovide information only for the offshore segment of the Adelbertfault (Fig. 7).
Further south, our modelling results support a significant increasein the motion along the Ramu-Markham fault from 10 mm yr!1
to 40 mm yr!1 south of the Huon Peninsula and reaching
"45 ± 1.7 mm yr!1 in the junction with the New Britain Trench, andincreasing to 132 mm yr!1 at 152E along the New Britain Trench.Our estimates are consistent with those suggested by Tregoninget al. (1998) and Wallace et al. (2004).
5.4 The Papuan Peninsula Block
We modelled the Owen Stanley fault as the boundary between theWoodlark Basin and the Papuan Peninsula, following the southwestboundary of the Papuan ultramafic belt (Owen-Stanley metamor-phics) in line with Fitz & Man (2013 and Davies et al. (1987). Wepredict a convergence between "2 and 7 mm yr!1 increasing tothe northern termination at the junction with the Ramu-Markhamfault. This is slightly slower than the rate estimated by Wallace et al.(2004), due to the fact that we partition the deformation between theWoodlark Plate and the New Guinea Highlands onto two structures(the Owen Stanley FZ, and the Aure Fold-and-Thrust Belt), ratherthan a single structure. The rates we obtain for the Owen Stanleyfault are similar to those estimated by Wallace et al. (2014), usingan extensive data set focused on SE PNG.
To the southwest, the boundary of the Papuan Peninsula with theAustralian Plate corresponds with the Moresby Trough, accommo-dating a convergence on the order of 5 to 7 mm yr!1. The south-westward significant motion observed at KERE, MORE and KAINsupports the idea that significant contraction occurs on the MoresbyTrough, and this provides the first quantitative evidence for activeconvergence on this boundary. More GPS stations are needed southof the Aure Fold-and-Thrust Belt in the Papuan Peninsula in orderto better constrain this motion.
The Aure Fold-and-Thrust Belt complex shows a distinct mor-phological structure composed of a combination of arc-shaped androughly north-south striking folds and faults. The structure has beeninterpreted as the result of the westward movement of the PapuanPeninsula (Dow 1977; Wallace et al. 2004; Davies 2012). In ourbest-fit model the Papuan Peninsula (PPBL) is a separate blockfrom the New Guinea Highlands and the PPBL limit corresponds tothe E-W trending fault from the junction of the Ramu-Markham tothe western Aure Fold-and-Thrust Belt. Despite the lack of shallowseismicity in this region delineating the trend of surface faulting,there are many mapped faults aligning with the Aure escarpment(Jenkins 1974). Our model predicts a counter-clockwise rotation ofthe PPBL, with a pole with respect to the New Guinea HighlandsBlock located at 144.55$E, 5.96$S. We predict a left-lateral motionwith a 110$ azimuth and a slip rate between 3.9 and 5 mm yr!1
along the boundary between the New Guinea Highlands Block andthe Aure Tectonic belt. The location of the Euler pole and the ob-served gradual convergent motion, from GPS velocities (Fig. 3), inthe E–W direction from the termination of the Owen Stanley faultto the Aure Trough, is consistent with the geomorphological patternof easterly dipping folding structures.
Although we obtain an excellent fit to the GPS data assumingmost of the deformation is produce by interaction of crustal blocks,is possible that the pattern of the surface deformation illustrated inthe GPS velocity in eastern PNG might be influenced by deepercrust, mantle, and slab processes. More specific detailed seismo-logical imaging studies and geodynamic modelling are needed toevaluate this.
6 C O N C LU S I O N
We use our new GPS velocity field for the central and westernPNG region and have used it to estimate the present-day active
deformation, updating previous studies (Tregoning et al. 1998; Wal-lace et al. 2004) and we present new kinematic constraints. Our kine-matic modelling yields highly oblique convergence of "93 mm yr!1
across the New Guinea Trench, confirming that the New GuineaTrench is the principal active interplate boundary. We obtain a cou-pling coefficient for the New Guinea Trench of 10–20 per cent, sug-gesting that a large proportion of the plate motion is accommodatedby aseismic creep. We show also that there is some partitioning ofconvergence between the New Guinea Trench, the Bewani-Torricellifault zone and the southern Highlands Fold-and-Thrust Belt. Thelatter accommodates convergence between 6 and 13 mm yr!1, de-creasing in the West New Guinea Highlands towards a strike-slipregime, consistent with previous studies (Abers & McCaffrey 1988).We suggest that the New Guinea Highlands Block undergoes aclockwise rotation with respect to the Australian Plate in contrast toWallace et al. (2004) who suggested anticlockwise rotation. TheNew Guinea Highlands block is a separate entity from the PapuanPeninsula and we predict that the boundary between the Highlandsand Papuan Peninsula blocks accommodates 3–5 mm yr!1 left-lateral motion with normal fault convergence of "2.5 mm yr!1.We show that Gain thrust is the current active boundary betweenthe South Bismarck Plate and the New Guinea Highlands/PapuanPeninsula and we confirm the high strain gradient across the Ramu-Markham Valley associated with the Finisterre arc-continent colli-sion, which results in a convergence of up to "40 mm yr!1. Ourkinematic model shows an active convergence along the MoresbyTrough up to "7 mm yr!1, revealing a potential tsunamogenicsource in the region, which needs to be considered in future seismichazard assessment.
A C K N OW L E D G E M E N T S
We are grateful to the individuals who participated in GPS surveysover the past 20 yr in Papua New Guinea. We thank Geoffrey Abersand anonymous reviewer for their helpful reviews. This work wassupported partially by ARC Linkage project LP110100525. Wethank R. McCaffrey for providing DEFNODE.
R E F E R E N C E S
Abbott, L.D., 1995. Neogene tectonic reconstruction of the Adelbert-Finisterre-New Britain collision, northern Papua New Guinea, Journalof Southeast Asian Earth Sciences, 11, 33–51.
Abbott, L.D., Silver, E.A. & Galewsky, J., 1994a. Structural evolution ofa modern arc-continent collision in Papua New Guinea, Tectonics, 13,1007–1034.
Abbott, L.D., Silver, E.A., Thompson, P.R., Filewicz, M.V., Schneider, C. &Abdoerrias, 1994b. Stratigraphic constraints on the development and tim-ing of arc-continent collision in northern Papua New Guinea, J. Sediment,Res., Sect. B, 64, 169–183.
Abers, G. & McCaffrey, R., 1988. Active deformation in the New Guineafold-and-thrust belt: Seismological evidence for strike-slip faulting andbasement-involved thrusting, J. geophys. Res., 93(B11), 13 332–13 354.
Abers, G.A. & McCaffrey, R., 1994. Active arc-continent collision: Earth-quakes, gravity anomalies, and fault kinematics in the Huon-FinisterreCollision zone, Papua New Guinea, Tectonics 13(2), 227–245.
Altamimi, Z., Collilieux, X. & Metivier, L., 2011. ITRF2008: an improvedsolution of the International Terrestrial Reference Frame, J. Geod., 85,457–473.
Baldwin, S.L., Fitzgerald, P.G. & Webb, L.E., 2012. Tectonics of the NewGuinea region, Annu. Rev. Earth Planet. Sci., 40, 495–520.
Bird, P., 2003. An updated digital model of plate boundaries, Geochem.Geophys. Geosyst., 4(3), 1027, doi:10.1029/2001GC000252.
Borrero, J.C., Bu, J., Saiang, C., Uslu, B., Freckman, J., Gomer, B., Okal,E.A. & Synolakis, C.E., 2003. Field survey and preliminary modeling ofthe Wewak, Papua New Guinea earthquake and tsunami of September 9,2002, Seismol. Res. Lett., 74, 393–405.
Cloos, M., Sapiie, B., van Ufford, A.Q., Weiland, R.J., Warren, P.Q. &McMahon, T.P., 2005. Collisional delamination in New Guinea: the geo-tectonics of subducting slab breakoff, in Geological Society of Amer-ica Special Papers, Vol. 400, pp. 1–51, Geological Society of America,doi:10.1130/2005.2400.
Crook, K.A.W., 1989. Quaternary uplift rates at a plate boundary, Lae urbanarea, Papua New Guinea, Tectonophysics, 163, 105–118.
Davies, H.L., 2012. The geology of New Guinea: the cordilleran margin ofthe Australian continent, Episodes, 35, 87–102.
Davies, H.L. & the Wewak Survey Team, 2002. Preliminary results of thefield survey, 2002 PNG earthquake at Wewak, EOS, Trans. Am. geophys.Un., 83, 47.
Davies, H.L., Lock, J., Tiffin, D.L., Honza, E., Okuda, Y., Murakami, F. &Kisimoto, K., 1987. Convergent tectonics in the Huon Peninsula region,Papua New Guinea, Geo Mar. Lett., 7, 143–152.
DeMets, C., Gordon, R.G., Argus, D.F. & Stein, S., 1994. Events of recentrevisions to the geomagnetic reversal time scale on estimates of currentplate motions, Geophys. Res. Lett., 21, 2191–2194.
Dow, D.B., 1977. A Geological Synthesis of Papua New Guinea, Bulletin201, Bureau of Mineral Resources, Geology and Geophysics.
Ekstrom, G., Nettles, M. & Dziewonski, A.M., 2012. The global CMTproject 2004–2010: centroid-moment tensors for 13,017 earthquakes,Phys. Earth planet. Inter., 200–201, 1–9.
Fitz, G. & Mann, P., 2013. Tectonic uplift mechanism of the Goodenough andFergusson Island gneiss domes, eastern Papua New Guinea: constraintsfrom seismic reflection and well data, Geochem. Geophys. Geosyst., 14,3969–3995.
Hamilton, W., 1979. Tectonics of the Indonesian Region, US Gov. Print. Off.,345 pp.
Herring, T.A., King, R.W. & McClusky, S.C., 2010a. Introduction toGAMIT/GLOBK, Release 10.4, Dept. of Earth Atmos. and Planet. Sci.,Mass. Instit. of Technol., Cambridge, MA, 48 pp.
Herring, T.A., King, R.W. & McClusky, S.C., 2010b. GAMIT ReferenceManual, GPS analysis at MIT, Release 10.4, Dept. of Earth Atmos. andPlanet. Sci., Mass. Inst. of Technol., Cambridge, MA, 171 pp.
Herring, T.A., King, R.W. & McClusky, S.C., 2010c. GLOBK: GlobalKalman filter VLBI and GPS analysis program, Release 10.4, Dept. ofEarth Atmos. and Planet. Sci., Mass. Inst. of Technol., Cambridge, MA,91 pp.
Hill, K.C. & Hall, R., 2003. Mesozoic-Cenozoic evolution of AustraliasNew Guinea margin in a west Pacific context, Geol. Soc. Am. Spec. Pap.,372, 265–290.
Holm, R.J. & Richards, S.W., 2013. A re-evaluation of arc-continent collisionand along-arc variation in the Bismarck Sea region, Papua New Guinea,Australian Journal of Earth Sciences, 60(5), 605–619.
Jenkins, D.A.L., 1974. Detachment tectonics in western Papua New Guinea,Bull. geol. Soc. Am., 85(4), 533–548.
Johnson, T. & Molnar, P., 1972. Focal mechanisms and plate tectonics of thesouthwest Pacific, J. geophys. Res., 77, 5000–5032.
Kington, J.D. & Goodliffe, A.M., 2008. Plate motions and continental ex-tension at the rifting to spreading transition in Woodlark Basin, PapuaNew Guinea: can oceanic plate kinematics be extended into continentalrifts? Tectonophysics, 458, 82–95.
Kroenke, L.W., 1984. Cenozoic tectonic development of the southwest Pa-cific, UN Econ. Soc. Comm. Asia Pacific Tech. Bull., 6, 1–126.
Kulig, C., McCaffrey, R., Abers, G.A. & Letz, H., 1993. Shallow seismicityof arc-continent collision near Lae, Papua New Guinea, Tectonophysics,27, 81–93.
Llanes, P., Silver, E., Day, S. & Hoffman, G., 2009. Interactions be-tween a transform fault and arc volcanism in the Bismarck Sea,Papua New Guinea, Geochem. Geophys. Geosyst., 10, Q06013,doi:10.1029/2009GC002430.
McCaffrey, R., 1992. Oblique plate convergence, slip vectors, and forearcdeformation, J. geophys. Res., 97, 11 953–11 966.
McCaffrey, R., 1996. Slip partitioning at convergent plate boundaries of SEAsia, in Tectonic Evolution of SE Asia Symposium, Geol. Soc. SpecialPublication, 106, 3–18.
McCaffrey, R., 2005. Block kinematics of the Pacific-North Americaplate boundary in the southwestern United States from inversion ofGPS, seismological, and geologic data, J. geophys. Res., 110, B07401,doi:10.1029/2004JB003307.
McCaffrey, R., King, R.W., Payne, S.J. & Lancaster, M., 2013. Active Tec-tonics of Northwestern US inferred from GPS-derived Surface Velocities,J. geophys. Res., 118, 709–723.
McClusky, S., Mobbs, K., Stoltz, A., Barsby, D., Loratung, W., Lambeck,K. & Morgan, P., 1994. The Papua New Guinea satellite crustal motionsurveys, Aust. Surv., 39, 194–214.
Meade, B.J. & Hager, B.H., 2005. Block models of crustal motion in south-ern California constrained by GPS measurements, J. geophys. Res., 110,B03403, doi:10.1029/2004JB003209.
Okada, Y., 1985. Surface deformation due to shear and tensile faults in ahalf-space, Bull. seism. Soc. Am., 75, 1135–1154.
Okal, E.A., 1999. Historical seismicity and seismotectonic context of theGreat 1979 Yapen and 1996 Biak, Irian Jaya earthquakes, Pure appl.Geophys., 154, 633–675.
Payne, S.J., McCaffrey, R., King, R.W. & Kattenhorn, S.A., 2012. A newinterpretation of deformation rates in the Snake River Plain and adja- centBasin and Range regions based on GPS measurements, Geophys. J. Int.,189, 101–122.
Pegler, G., Das, S. & Woodhouse, J.H., 1995. A seismological study of theeastern New Guinea and western Solomon Sea regions and its tectonicimplications, Geophys. J. Int., 122, 961–981.
Reilinger, R. et al., 2006. GPS constraints on continental deformation inthe Africa-Arabia-Eurasia continental collision zone and implicationsfor the dynamics of plate interactions, J. geophys. Res., 111, B05411,doi:10.1029/2005JB004051.
Sapiie, B. & Cloos, M., 2004. Strike-slip faulting in the core of the CentralRange of west New Guinea: Ertsberg Mining District, Indonesia, Bull.geol. Soc. Am., 116(3–4), 277–293.
Savage, J.C., 1983. A dislocation model of strain accumulation and releaseat a subduction zone, J. geophys. Res., 88, 4984–4996.
Stein, S. & Gordon, R.G., 1984. Statistical tests of additional plateboundaries from plate motion inversions, Earth planet. Sci. Lett., 69,401–412.
Stevens, C., McCaffrey, R., Silver, E.A., Sombo, Z., English, P. & van derKevie, J., 1998. Mid-crustal detachment and ramp faulting in the MarkhamValley, Papua New Guinea, Geology, 26, 847–850.
Taylor, B., Crook, K., Sinton, J. & Petersen, L., 1991. Manus Basin, PapuaNew Guinea, SeaMARC II sidescan sonar imagery and bathymetry, scale1:250,000, Pacific Seafloor Atlas, sheets 1–6, Hawaii Institute of Geo-physics, Honolulu.
Tregoning, P., 2002. Plate kinematics in the western Pacific derived fromgeodetic observations, J. geophys. Res., 107(B1), ECV 7-1–ECV 7-8.
Tregoning, P. & Gorbatov, A., 2004. Evidence for active subduc-tion at the New Guinea Trench, Geophys. Res. Lett., 31, L13608,doi:10.1029/2004GL020190.
Tregoning, P. et al., 1998. Estimation of current plate motions in Papua NewGuinea from Global Positioning System observations, J. geophys. Res.,103(B6), 12 181–12 203.
Tregoning, P., Jackson, R.J., McQueen, H., Lambeck, K., Stevens, C., Little,R.P., Curley, R. & Rosa, R., 1999. Motion of the South Bismarck Plate,Papua New Guinea, Geophys. Res. Lett., 26, 3517–3520.
Tregoning, P., Burgette, R., McClusky, S.C., Lejeune, S., McQueen, H. &Watson, C.S., 2013. A decade of great earthquake deformation, J. geophys.Res., 118, 2371–2381.
Wallace, L.M. et al., 2004. GPS and seismological constraints on activetectonics and arc-continent collision in Papua New Guinea: implicationsfor mechanics of microplate rotations in a plate boundary zone, J. geophys.Res., 109, B05404, doi:10.1029/2003JB002481.
Wallace, L.M. et al., 2014. Continental breakup and UHP rock exhumation inaction: GPS results from the Woodlark Rift, Papua New Guinea, Geochem.Geophys. Geosyst., 15, 4267–4290.
White, L.T., Morse, M.P. & Lister, G.S., 2013. The location of lithospheric-scale transfer faults and their control on the Cu-Au deposits of NewGuinea, Solid Earth Discussions, 5(2), 1687–1720.
S U P P O RT I N G I N F O R M AT I O N
Additional Supporting Information may be found in the online ver-sion of this paper:
Figure S1. The rotational and elastic strain rate parts of the modelledvelocity field with respect to Australia.Figure S2. Velocity residuals from the best-fit model (observedminus modelled) and the 95 per cent confidence ellipses.Figure S3. Velocity residuals from the best-fit model (observedminus modelled) zoomed to the rectangle drawn in Fig. S2 and the95 per cent confidence ellipses.Figure S4. Comparison between observed and calculated slip vec-tors azimuth.Table S1. Table of east and north GPS velocity components(Ve, Vn) and 1# uncertainties (# e, # n) in an Australia-fixed ref-erence.Table S2. Table of poles of rotation for the modelled blocks relativeto Australia ($, rotation rate; a, semi-major axis of error ellipse;b, semi-minor axis of error ellipse).Table S3. Summary of F-test distribution results for different mod-els with the best fit model (P, probability that improvement to fitfrom addition of parameters is not due to chance; Dof, degree offreedom) (http://gji.oxfordjournals.org/lookup/suppl/doi:10.1093/gji/ggv200/-/DC1).
Please note: Oxford University Press is not responsible for the con-tent or functionality of any supporting materials supplied by theauthors. Any queries (other than missing material) should be di-rected to the corresponding author for the paper.