Geophysical Journal International Geophys. J. Int. (2015) 202, 1407–1418 doi: 10.1093/gji/ggv229 GJI Seismology No thermal anomalies in the mantle transition zone beneath an incipient continental rift: evidence from the first receiver function study across the Okavango Rift Zone, Botswana Y. Yu, 1 K.H. Liu, 1 M. Moidaki, 2 C.A. Reed 1 and S.S. Gao 1 1 Geology and Geophysics Program, Missouri University of Science and Technology, Rolla, MO 65409, USA. E-mail: [email protected]2 Department of Physics, University of Botswana, Gaborone, Botswana Accepted 2015 May 29. Received 2015 May 3; in original form 2014 December 20 SUMMARY Mechanisms leading to the initiation and early-stage development of continental rifts re- main enigmatic, in spite of numerous studies. Among the various rifting models, which were developed mostly based on studies of mature rifts, far-field stresses originating from plate interactions (passive rifting) and nearby active mantle upwelling (active rifting) are commonly used to explain rift dynamics. Situated atop of the hypothesized African Superplume, the incipient Okavango Rift Zone (ORZ) of northern Botswana is ideal to investigate the role of mantle plumes in rift initiation and development, as well as the interaction between the upper and lower mantle. The ORZ developed within the Neoproterozoic Damara belt between the Congo Craton to the northwest and the Kalahari Craton to the southeast. Mantle structure and thermal status beneath the ORZ are poorly known, mostly due to a complete paucity of broad- band seismic stations in the area. As a component of an interdisciplinary project funded by the United States National Science Foundation, a broad-band seismic array was deployed over a 2-yr period between mid-2012 and mid-2014 along a profile 756 km in length. Using P-to-S receiver functions (RFs) recorded by the stations, the 410 and 660 km discontinuities bordering the mantle transition zone (MTZ) are imaged for the first time. When a standard Earth model is used for the stacking of RFs, the apparent depths of both discontinuities beneath the Kalahari Craton are about 15 km shallower than those beneath the Congo Craton. Using teleseismic P- and S-wave traveltime residuals obtained by this study and lithospheric thickness estimated by previous studies, we conclude that the apparent shallowing is the result of a 100–150km difference in the thickness of the lithosphere between the two cratons. Relative to the adjacent tectonically stable areas, no significant anomalies in the depth of the MTZ discontinuities or in teleseismic P- and S-wave traveltime residuals are found beneath the ORZ. These observations imply an absence of significant thermal anomalies in the MTZ and in the upper mantle beneath the incipient rift, ruling out the role of mantle plumes in the initiation of the ORZ. We propose that the initiation and development of the ORZ were the consequences of relative movements between the South African block and the rest of the African plate along a zone of lithospheric weakness between the Congo and Kalahari cratons. An area of thinner-than-normal MTZ is found at the SW corner of the study area. This anomaly, if confirmed by future studies, could suggest significant transferring of heat from the lower to the upper mantle. Key words: Wave propagation; Cratons; Continental tectonics: extensional. 1 INTRODUCTION The mechanisms controlling the initiation and development of con- tinental rifting can be generally categorized into active and passive processes, wherein the principle distinction depends upon the driv- ing forces that promote lithospheric extension (Sengor & Burke 1978). Active rifting is broadly induced by a hot, actively upwelling asthenosphere followed by extensive magmatic diking and regional uplift, while passive rifting demonstrates crustal extension ambigu- ously accompanied by volcanism or uplift, and is commonly caused by far-field plate driving forces (Sengor & Burke 1978; White & McKenzie 1989; Schmeling 2010). Observations on the state of rifting and the geodynamic controls governing their evolution were primarily obtained, however, from relatively mature rift zones such C The Authors 2015. Published by Oxford University Press on behalf of The Royal Astronomical Society. 1407 at University of Missouri-Columbia on July 5, 2015 http://gji.oxfordjournals.org/ Downloaded from
Transcript
Geophysical Journal InternationalGeophys. J. Int. (2015) 202, 1407–1418 doi: 10.1093/gji/ggv229
GJI Seismology
No thermal anomalies in the mantle transition zone beneathan incipient continental rift: evidence from the first receiverfunction study across the Okavango Rift Zone, Botswana
Y. Yu,1 K.H. Liu,1 M. Moidaki,2 C.A. Reed1 and S.S. Gao1
1Geology and Geophysics Program, Missouri University of Science and Technology, Rolla, MO 65409, USA. E-mail: [email protected] of Physics, University of Botswana, Gaborone, Botswana
Accepted 2015 May 29. Received 2015 May 3; in original form 2014 December 20
S U M M A R YMechanisms leading to the initiation and early-stage development of continental rifts re-main enigmatic, in spite of numerous studies. Among the various rifting models, which weredeveloped mostly based on studies of mature rifts, far-field stresses originating from plateinteractions (passive rifting) and nearby active mantle upwelling (active rifting) are commonlyused to explain rift dynamics. Situated atop of the hypothesized African Superplume, theincipient Okavango Rift Zone (ORZ) of northern Botswana is ideal to investigate the role ofmantle plumes in rift initiation and development, as well as the interaction between the upperand lower mantle. The ORZ developed within the Neoproterozoic Damara belt between theCongo Craton to the northwest and the Kalahari Craton to the southeast. Mantle structure andthermal status beneath the ORZ are poorly known, mostly due to a complete paucity of broad-band seismic stations in the area. As a component of an interdisciplinary project funded bythe United States National Science Foundation, a broad-band seismic array was deployed overa 2-yr period between mid-2012 and mid-2014 along a profile 756 km in length. Using P-to-Sreceiver functions (RFs) recorded by the stations, the 410 and 660 km discontinuities borderingthe mantle transition zone (MTZ) are imaged for the first time. When a standard Earth model isused for the stacking of RFs, the apparent depths of both discontinuities beneath the KalahariCraton are about 15 km shallower than those beneath the Congo Craton. Using teleseismic P-and S-wave traveltime residuals obtained by this study and lithospheric thickness estimatedby previous studies, we conclude that the apparent shallowing is the result of a 100–150 kmdifference in the thickness of the lithosphere between the two cratons. Relative to the adjacenttectonically stable areas, no significant anomalies in the depth of the MTZ discontinuities or inteleseismic P- and S-wave traveltime residuals are found beneath the ORZ. These observationsimply an absence of significant thermal anomalies in the MTZ and in the upper mantle beneaththe incipient rift, ruling out the role of mantle plumes in the initiation of the ORZ. We proposethat the initiation and development of the ORZ were the consequences of relative movementsbetween the South African block and the rest of the African plate along a zone of lithosphericweakness between the Congo and Kalahari cratons. An area of thinner-than-normal MTZ isfound at the SW corner of the study area. This anomaly, if confirmed by future studies, couldsuggest significant transferring of heat from the lower to the upper mantle.
The mechanisms controlling the initiation and development of con-tinental rifting can be generally categorized into active and passiveprocesses, wherein the principle distinction depends upon the driv-ing forces that promote lithospheric extension (Sengor & Burke1978). Active rifting is broadly induced by a hot, actively upwelling
asthenosphere followed by extensive magmatic diking and regionaluplift, while passive rifting demonstrates crustal extension ambigu-ously accompanied by volcanism or uplift, and is commonly causedby far-field plate driving forces (Sengor & Burke 1978; White &McKenzie 1989; Schmeling 2010). Observations on the state ofrifting and the geodynamic controls governing their evolution wereprimarily obtained, however, from relatively mature rift zones such
as the Main Ethiopian and Kenyan Rifts of the northernmost EastAfrican Rift System (EARS). Meanwhile, the characterization ofthe initiation and early-stage evolution of continental rifting, ex-emplified by the amagmatic southern and southwestern EARS riftsegments such as the Malawi (Ebinger et al. 1984) and Okavangorift zones, is largely underdeveloped.
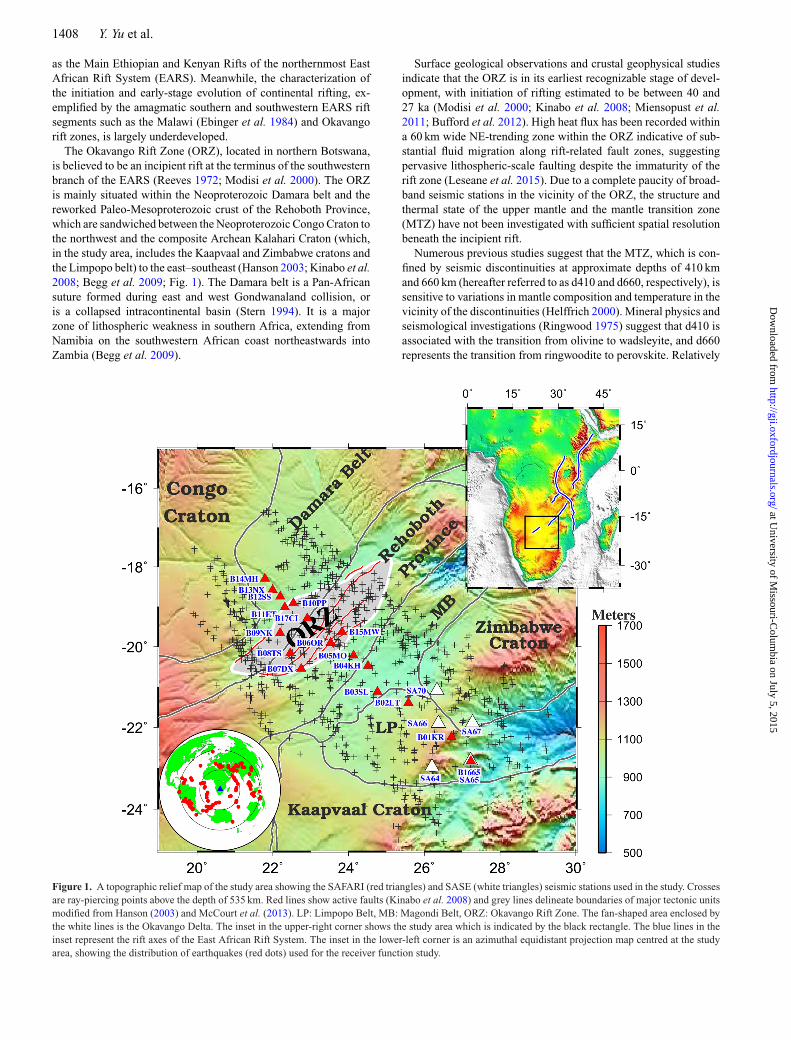
The Okavango Rift Zone (ORZ), located in northern Botswana,is believed to be an incipient rift at the terminus of the southwesternbranch of the EARS (Reeves 1972; Modisi et al. 2000). The ORZis mainly situated within the Neoproterozoic Damara belt and thereworked Paleo-Mesoproterozoic crust of the Rehoboth Province,which are sandwiched between the Neoproterozoic Congo Craton tothe northwest and the composite Archean Kalahari Craton (which,in the study area, includes the Kaapvaal and Zimbabwe cratons andthe Limpopo belt) to the east–southeast (Hanson 2003; Kinabo et al.2008; Begg et al. 2009; Fig. 1). The Damara belt is a Pan-Africansuture formed during east and west Gondwanaland collision, oris a collapsed intracontinental basin (Stern 1994). It is a majorzone of lithospheric weakness in southern Africa, extending fromNamibia on the southwestern African coast northeastwards intoZambia (Begg et al. 2009).
Surface geological observations and crustal geophysical studiesindicate that the ORZ is in its earliest recognizable stage of devel-opment, with initiation of rifting estimated to be between 40 and27 ka (Modisi et al. 2000; Kinabo et al. 2008; Miensopust et al.2011; Bufford et al. 2012). High heat flux has been recorded withina 60 km wide NE-trending zone within the ORZ indicative of sub-stantial fluid migration along rift-related fault zones, suggestingpervasive lithospheric-scale faulting despite the immaturity of therift zone (Leseane et al. 2015). Due to a complete paucity of broad-band seismic stations in the vicinity of the ORZ, the structure andthermal state of the upper mantle and the mantle transition zone(MTZ) have not been investigated with sufficient spatial resolutionbeneath the incipient rift.
Numerous previous studies suggest that the MTZ, which is con-fined by seismic discontinuities at approximate depths of 410 kmand 660 km (hereafter referred to as d410 and d660, respectively), issensitive to variations in mantle composition and temperature in thevicinity of the discontinuities (Helffrich 2000). Mineral physics andseismological investigations (Ringwood 1975) suggest that d410 isassociated with the transition from olivine to wadsleyite, and d660represents the transition from ringwoodite to perovskite. Relatively
Figure 1. A topographic relief map of the study area showing the SAFARI (red triangles) and SASE (white triangles) seismic stations used in the study. Crossesare ray-piercing points above the depth of 535 km. Red lines show active faults (Kinabo et al. 2008) and grey lines delineate boundaries of major tectonic unitsmodified from Hanson (2003) and McCourt et al. (2013). LP: Limpopo Belt, MB: Magondi Belt, ORZ: Okavango Rift Zone. The fan-shaped area enclosed bythe white lines is the Okavango Delta. The inset in the upper-right corner shows the study area which is indicated by the black rectangle. The blue lines in theinset represent the rift axes of the East African Rift System. The inset in the lower-left corner is an azimuthal equidistant projection map centred at the studyarea, showing the distribution of earthquakes (red dots) used for the receiver function study.
colder and warmer regions are expected to have thicker and thin-ner MTZ, respectively, due to their characteristic Clapeyron slopes(about +1.5 to +3.0 MPa K−1 for d410 and −4.0 to −0.4 MPaK−1 for d660; Ringwood 1975; Bina & Helffrich 1994; Litasovet al. 2005; note the significant differences in the values deter-mined by previous studies). Global and regional studies suggestthat the observed thick MTZ beneath subduction zones is associ-ated with thermal anomalies ranging between −100 and −300 K,and the deepening d410 beneath hotspots corresponds to thermalanomalies between +100 and +300 K (Tauzin et al. 2008). A +200to +300 K increase in MTZ temperature was proposed to explainthe observed depression of d410 beneath the mature sections ofthe EARS (Nyblade et al. 2000; Owens et al. 2000; Huerta et al.2009; Mulibo & Nyblade 2013). The presence of water in the MTZcan have the same effect as decreasing temperature and will sub-sequently thicken the MTZ (Litasov et al. 2005). The existenceof water has been proposed to explain the observed thicker-than-normal MTZ beneath southern Africa (Blum & Shen 2004), theNubian and Arabian plates adjacent to the Red Sea (Mohamed et al.2014), and the Afar Depression (Thompson et al. 2015). Hence,variations in MTZ thickness and depths of the MTZ discontinuitiescan behave as a proxy with which to detect the existence of ther-mal and compositional anomalies and help distinguish the mode ofrifting.
Such a tool has been applied to other regions of continental rift-ing. For instance, the Baikal rift was found to have a cold MTZ basedon an observed uplifted d410 (Liu & Gao 2006), and studies in theRio Grande rift suggested the lack of a large-scale thermal anomalyin the MTZ (Wilson et al. 2005; Gao & Liu 2014a). Beneath theKenya and Tanzania segments of the EARS, receiver function (RF)studies revealed a thin MTZ, which was interpreted to be associ-ated with the African Superplume (Huerta et al. 2009; Mulibo &Nyblade 2013). In contrast, beneath southern Africa, Gao et al.(2002) observed a normal MTZ thickness and concluded that theAfrican Superplume, if it exists, is constrained in the lower mantlebeneath the study area. This conclusion is supported by the seismictomography study of James et al. (2001). The present study repre-sents the first seismological investigations of the upper mantle andmantle transition zone beneath the ORZ using broad-band seismicdata recorded in the vicinity of the rift.
2 DATA A N D M E T H O D S
In the summer of 2012, a total of 17 broad-band seismic stationswere deployed in northern and central Botswana along a NW–SEprofile with a total length of 756 km (Fig. 1), as part of the SeismicArrays for African Rift Initiation (SAFARI) project (Gao et al.2013; Yu et al. 2013). The 17 SAFARI broad-band stations, whichwere equipped with Quanterra Q330 digitizers and Guralp CMG-3T120 s sensors, recorded continuously with a sampling rate of 50 Hzuntil the summer of 2014. Additionally, data from 5 broad-bandseismic stations from the 1997–1999 Southern African SeismicExperiment (SASE; Gao et al. 2002) are used to enhance coverageand resolution of our data set (Fig. 1).
Data from events in the epicentral distance range of 30–100◦ areselected with a cut-off magnitude of Mc as defined by Mc = 5.2 +(� − 30.0)/(180.0 − 30.0) − D/700.0, where � is the epicentraldistance in degree and D is the focal depth in km (Liu & Gao 2010).Such an empirical formula was designed to balance the quantity andquality of the data to be processed.
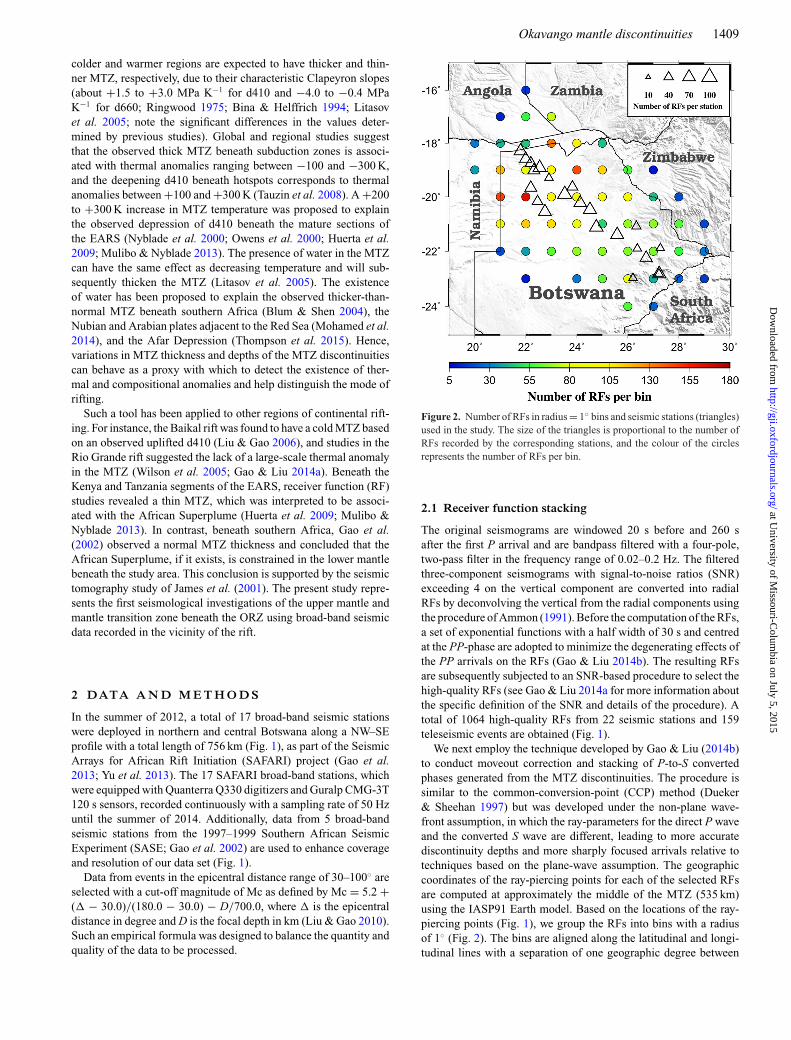
Figure 2. Number of RFs in radius = 1◦ bins and seismic stations (triangles)used in the study. The size of the triangles is proportional to the number ofRFs recorded by the corresponding stations, and the colour of the circlesrepresents the number of RFs per bin.
2.1 Receiver function stacking
The original seismograms are windowed 20 s before and 260 safter the first P arrival and are bandpass filtered with a four-pole,two-pass filter in the frequency range of 0.02–0.2 Hz. The filteredthree-component seismograms with signal-to-noise ratios (SNR)exceeding 4 on the vertical component are converted into radialRFs by deconvolving the vertical from the radial components usingthe procedure of Ammon (1991). Before the computation of the RFs,a set of exponential functions with a half width of 30 s and centredat the PP-phase are adopted to minimize the degenerating effects ofthe PP arrivals on the RFs (Gao & Liu 2014b). The resulting RFsare subsequently subjected to an SNR-based procedure to select thehigh-quality RFs (see Gao & Liu 2014a for more information aboutthe specific definition of the SNR and details of the procedure). Atotal of 1064 high-quality RFs from 22 seismic stations and 159teleseismic events are obtained (Fig. 1).
We next employ the technique developed by Gao & Liu (2014b)to conduct moveout correction and stacking of P-to-S convertedphases generated from the MTZ discontinuities. The procedure issimilar to the common-conversion-point (CCP) method (Dueker& Sheehan 1997) but was developed under the non-plane wave-front assumption, in which the ray-parameters for the direct P waveand the converted S wave are different, leading to more accuratediscontinuity depths and more sharply focused arrivals relative totechniques based on the plane-wave assumption. The geographiccoordinates of the ray-piercing points for each of the selected RFsare computed at approximately the middle of the MTZ (535 km)using the IASP91 Earth model. Based on the locations of the ray-piercing points (Fig. 1), we group the RFs into bins with a radiusof 1◦ (Fig. 2). The bins are aligned along the latitudinal and longi-tudinal lines with a separation of one geographic degree between
Figure 3. Depth series from stacking of RFs in radius = 1◦ bins along nine latitudinal profiles. The thick red lines show the mean depth series averaged overall the 50 bootstrap iterations, and the bordering thin black lines show the mean ± two standard deviations. The circles indicate the average depths of the d410and d660, and the error bars show two standard deviations of the depths. The number on the top of each trace represents the number of RFs in the bin.
adjacent bins. The RFs in a given bin are then moveout corrected andstacked for the depth range of 350–700 km with a vertical resolutionof 1 km (eq. 2 in Gao & Liu 2014b). Because a 1-D Earth model isused for the migration and stacking of the RFs, the observed MTZdiscontinuity depths are apparent rather than true depths. A boot-strap resampling approach with 50 resampling iterations (Efron &Tibshirani 1986) is applied to obtain the mean and stan-dard deviation (SD) of the MTZ discontinuity depths(Liu et al. 2003).
Figs 3 and 4 show all of the resulting depth series along latitudinaland longitudinal profiles, respectively. We also stack the RFs usingdata recorded by each of the stations (Fig. 5) for the purpose ofinvestigating data quality variations between the stations. Note thatthe existence of lateral variations in the velocity structure can reducethe stacking amplitude and broaden the peak at the estimated MTZdiscontinuity depths. In addition, the stacking results near the edgesof the study area are not as reliable as those in the interior due tothe lower number of RFs.
Figure 4. Same as Fig. 3, but for 10 longitudinal profiles. Note plot (i) contains two profiles.
2.2 Traveltime residuals
Both thermal anomalies in the vicinity of and velocity undulationsabove the MTZ discontinuities can lead to observed variations in thedepths of the discontinuities. In order to provide constraints on theinterpretation of the resulting MTZ discontinuity depths, we alsomeasure P- and S-wave traveltime residuals. P- and S-wave arrivalsrelative to the IASP91 Earth model are manually picked on thevertical and transverse components, respectively. The accuracy ofthe hand-picked residuals is dependent on the signal strength rela-tive to the background noise, as well as the sharpness of arrivals.For most of the seismograms, the uncertainty is estimated to be
about ±0.1 s, that is, within five data points from the true value.The mean residual from the event is removed to obtain relative trav-eltime residuals. The use of relative traveltime residuals minimizesthe effects of errors of hypocentral parameters and lateral velocityheterogeneities outside the study area. Events recorded by less thanfive stations are not used.
We use the following equation to correct for traveltimes due tovariations in station elevation (Nolet 2008)
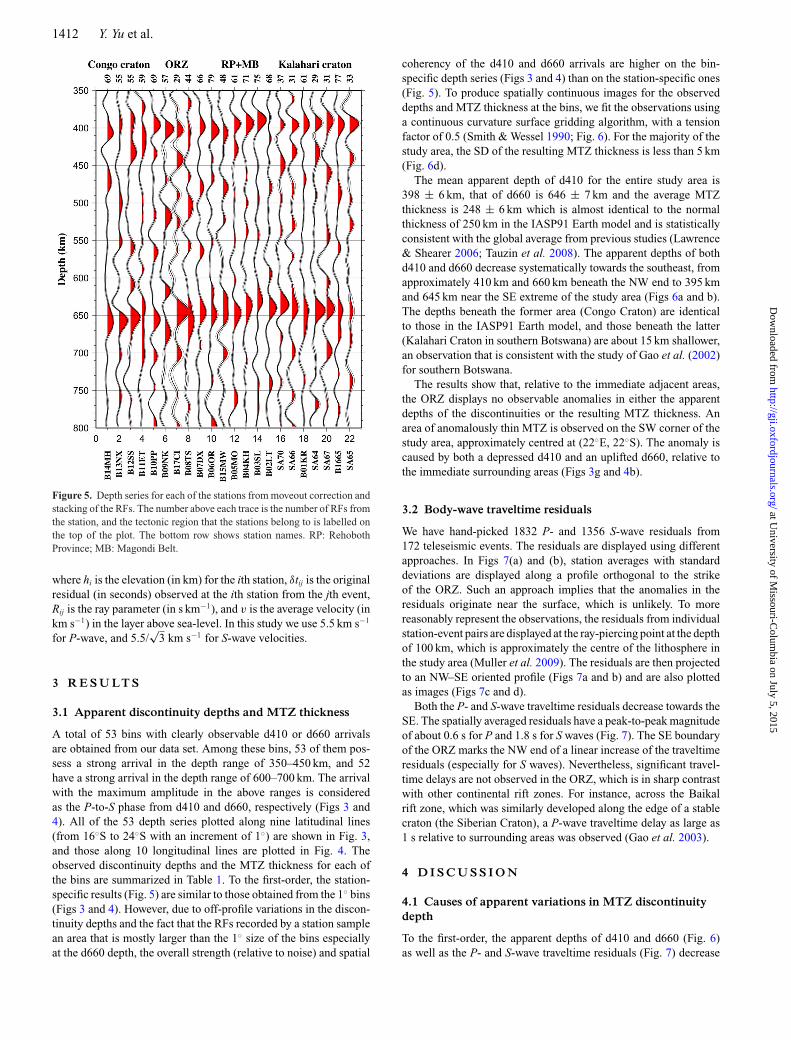
Figure 5. Depth series for each of the stations from moveout correction andstacking of the RFs. The number above each trace is the number of RFs fromthe station, and the tectonic region that the stations belong to is labelled onthe top of the plot. The bottom row shows station names. RP: RehobothProvince; MB: Magondi Belt.
where hi is the elevation (in km) for the ith station, δtij is the originalresidual (in seconds) observed at the ith station from the jth event,Rij is the ray parameter (in s km−1), and v is the average velocity (inkm s−1) in the layer above sea-level. In this study we use 5.5 km s−1
for P-wave, and 5.5/√
3 km s−1 for S-wave velocities.
3 R E S U LT S
3.1 Apparent discontinuity depths and MTZ thickness
A total of 53 bins with clearly observable d410 or d660 arrivalsare obtained from our data set. Among these bins, 53 of them pos-sess a strong arrival in the depth range of 350–450 km, and 52have a strong arrival in the depth range of 600–700 km. The arrivalwith the maximum amplitude in the above ranges is consideredas the P-to-S phase from d410 and d660, respectively (Figs 3 and4). All of the 53 depth series plotted along nine latitudinal lines(from 16◦S to 24◦S with an increment of 1◦) are shown in Fig. 3,and those along 10 longitudinal lines are plotted in Fig. 4. Theobserved discontinuity depths and the MTZ thickness for each ofthe bins are summarized in Table 1. To the first-order, the station-specific results (Fig. 5) are similar to those obtained from the 1◦ bins(Figs 3 and 4). However, due to off-profile variations in the discon-tinuity depths and the fact that the RFs recorded by a station samplean area that is mostly larger than the 1◦ size of the bins especiallyat the d660 depth, the overall strength (relative to noise) and spatial
coherency of the d410 and d660 arrivals are higher on the bin-specific depth series (Figs 3 and 4) than on the station-specific ones(Fig. 5). To produce spatially continuous images for the observeddepths and MTZ thickness at the bins, we fit the observations usinga continuous curvature surface gridding algorithm, with a tensionfactor of 0.5 (Smith & Wessel 1990; Fig. 6). For the majority of thestudy area, the SD of the resulting MTZ thickness is less than 5 km(Fig. 6d).
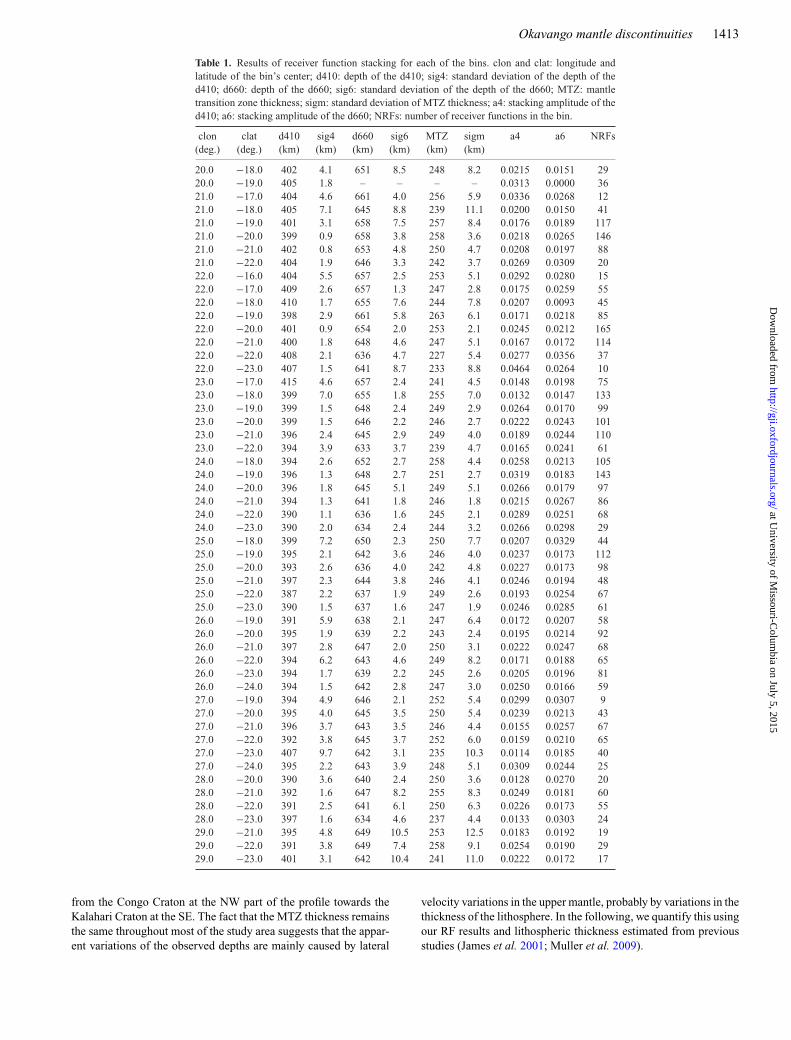
The mean apparent depth of d410 for the entire study area is398 ± 6 km, that of d660 is 646 ± 7 km and the average MTZthickness is 248 ± 6 km which is almost identical to the normalthickness of 250 km in the IASP91 Earth model and is statisticallyconsistent with the global average from previous studies (Lawrence& Shearer 2006; Tauzin et al. 2008). The apparent depths of bothd410 and d660 decrease systematically towards the southeast, fromapproximately 410 km and 660 km beneath the NW end to 395 kmand 645 km near the SE extreme of the study area (Figs 6a and b).The depths beneath the former area (Congo Craton) are identicalto those in the IASP91 Earth model, and those beneath the latter(Kalahari Craton in southern Botswana) are about 15 km shallower,an observation that is consistent with the study of Gao et al. (2002)for southern Botswana.
The results show that, relative to the immediate adjacent areas,the ORZ displays no observable anomalies in either the apparentdepths of the discontinuities or the resulting MTZ thickness. Anarea of anomalously thin MTZ is observed on the SW corner of thestudy area, approximately centred at (22◦E, 22◦S). The anomaly iscaused by both a depressed d410 and an uplifted d660, relative tothe immediate surrounding areas (Figs 3g and 4b).
3.2 Body-wave traveltime residuals
We have hand-picked 1832 P- and 1356 S-wave residuals from172 teleseismic events. The residuals are displayed using differentapproaches. In Figs 7(a) and (b), station averages with standarddeviations are displayed along a profile orthogonal to the strikeof the ORZ. Such an approach implies that the anomalies in theresiduals originate near the surface, which is unlikely. To morereasonably represent the observations, the residuals from individualstation-event pairs are displayed at the ray-piercing point at the depthof 100 km, which is approximately the centre of the lithosphere inthe study area (Muller et al. 2009). The residuals are then projectedto an NW–SE oriented profile (Figs 7a and b) and are also plottedas images (Figs 7c and d).
Both the P- and S-wave traveltime residuals decrease towards theSE. The spatially averaged residuals have a peak-to-peak magnitudeof about 0.6 s for P and 1.8 s for S waves (Fig. 7). The SE boundaryof the ORZ marks the NW end of a linear increase of the traveltimeresiduals (especially for S waves). Nevertheless, significant travel-time delays are not observed in the ORZ, which is in sharp contrastwith other continental rift zones. For instance, across the Baikalrift zone, which was similarly developed along the edge of a stablecraton (the Siberian Craton), a P-wave traveltime delay as large as1 s relative to surrounding areas was observed (Gao et al. 2003).
4 D I S C U S S I O N
4.1 Causes of apparent variations in MTZ discontinuitydepth
To the first-order, the apparent depths of d410 and d660 (Fig. 6)as well as the P- and S-wave traveltime residuals (Fig. 7) decrease
Table 1. Results of receiver function stacking for each of the bins. clon and clat: longitude andlatitude of the bin’s center; d410: depth of the d410; sig4: standard deviation of the depth of thed410; d660: depth of the d660; sig6: standard deviation of the depth of the d660; MTZ: mantletransition zone thickness; sigm: standard deviation of MTZ thickness; a4: stacking amplitude of thed410; a6: stacking amplitude of the d660; NRFs: number of receiver functions in the bin.
from the Congo Craton at the NW part of the profile towards theKalahari Craton at the SE. The fact that the MTZ thickness remainsthe same throughout most of the study area suggests that the appar-ent variations of the observed depths are mainly caused by lateral
velocity variations in the upper mantle, probably by variations in thethickness of the lithosphere. In the following, we quantify this usingour RF results and lithospheric thickness estimated from previousstudies (James et al. 2001; Muller et al. 2009).
Figure 6. (a) Smoothed spatial distribution of resulting d410 depth; (b) same as (a) but for d660; (c) MTZ thickness; (d) standard deviations of the MTZthickness measurements. Circles indicate the centre of circular areas with high-quality measurements. Note that in (a)–(c), only measurements that are 5 ormore km different from the corresponding global average are coloured.
As discussed above, relative to the Congo Craton, both d410and d660 beneath the Kalahari Craton are uplifted by about 15 km.Under the assumption that this apparent uplift is purely caused byvelocity anomalies, we estimate that a 15 km uplift corresponds to aVp anomaly of +1.2 per cent in the depth range of 0–410 km usingthe approach of Gao & Liu (2014b). If the anomalous zone is limitedto a 100 km thick layer, the required anomaly is about 5 per cent,and this value reduces to about 3 per cent if the thickness is 150 km.In addition, the velocity anomalies resulting in a 15 km apparentuplift of both d410 and d660 can produce a P-wave traveltimeresidual of about −0.6 s, which is almost exactly what was observed(Fig. 7). To estimate the predicted S-wave traveltime residual usingthe apparent depression of the discontinuities, the γ value, which isthe ratio between S- and P-wave relative velocity anomalies, that is,
γ = dln(Vs)/dln(Vp), is required. Under the assumption of γ = 1.7,which is the same as that found for the stable central and easternUnited States (Gao & Liu 2014a), the S-wave velocity anomalyis about +2 per cent and the predicted S-wave traveltime residualis −1.8 s, which is once again consistent with the observed value(Fig. 7).
We next explore the possibility that the observed velocity anoma-lies originate from lateral variations of lithospheric thicknessbeneath the study area. Seismic tomography studies indicated thatthe Kalahari Cratonic root extends to at least 250 km and perhapsas deep as 300 km (James et al. 2001). On the other hand, Mulleret al. (2009) found the lithospheric thickness in the vicinity ofthe Damara belt in the ORZ to be approximately 160 km. Thesestudies suggest that beneath the Kalahari Craton, the lithosphere is
Figure 7. Teleseismic P- and S-wave traveltime residuals displayed above the ray-piercing points at 100 km depth. (a) P-wave residuals projected on to theprofile shown in (c). Dots are individual event values, and circles with error bars are station-averaged values. (b) Same as (a) but for S-wave residuals. (c)Spatial distribution of P-wave residuals. (d) Spatial distribution of S-wave residuals. The numbers along the profile in (c) and (d) indicate the distance in kmfrom the SE boundary fault of the ORZ.
approximately 100–150 km thicker than that beneath the northwest-ern part of the study area. If we assume that this 100–150 km ex-cessive lithospheric thickness is solely responsible for the observed15 km apparent uplift of the MTZ discontinuities and variations intraveltime residuals, the required P-wave velocity contrast is 3–5per cent between the lithosphere and the asthenosphere. Velocitycontrasts of similar magnitude are commonly found in numerousprevious seismic tomography and RF studies (e.g. Gao et al. 2003;Li et al. 2003; Rychert et al. 2007; Eaton et al. 2009).
The normal apparent discontinuity depths beneath the CongoCraton and the ORZ suggest normal (relative to the IASP91 Earthmodel) upper mantle P- and S-wave velocities. This is drasticallydifferent from the mature segments of the EARS beneath whichgreater-than-normal apparent discontinuity depths (e.g. Thompsonet al. 2015) and lower-than-normal velocities (Bastow 2012) havebeen reported. Similarly, the shallow d410 and d660 beneath the
Kalahari Craton imply higher-than-normal velocities and are con-sistent with seismic tomographic studies (James et al. 2001). Wenote that considerable discrepancies in the experimentally deter-mined Clapeyron slopes were found among previous studies (seeLitasov et al. 2005 and Ghosh et al. 2013 for some examples),making it difficult to reliably convert undulations in the observedMTZ discontinuity depths into temperature anomalies. Using theClapeyron slopes of +2.9 MPa K−1 for d410 and −2.1 MPa K−1
for d660 (Bina & Helffrich 1994), the resulting MTZ thickness of248 ± 6 km corresponds to a thermal anomaly ranging between−34 K and +68 K.
The anomalously thin MTZ observed on the SW corner of thestudy area (Fig. 6c) has an estimated thickness of 235 km, corre-sponding to an estimated thermal anomaly of +127 K. This abnor-mally thin MTZ, if confirmed, could suggest significant transfer-ring of heat from the lower to the upper mantle beneath western
Botswana. Such a transfer might be related to the African Super-plume, which is thought to be confined in the lower mantle beneathsouthern Africa (James et al. 2001; Gao et al. 2002). Unfortunately,this area is located on the edge of the region sampled by a limitednumber of RFs (Figs 1 and 2).
The above discussions assume anhydrous conditions. Some pre-vious MTZ studies involved the presence of water in the MTZ toexplain the observed larger-than-normal MTZ thickness (Blum &Shen 2004; Cao & Levander 2010; Mohamed et al. 2014; Thomsonet al. 2015), and one of them (Blum & Shen 2004) investigated theMTZ beneath the Kalahari Craton. Water can uplift the d410 anddepress the d660, resulting in a thicker MTZ (Litasov et al. 2005).The addition of water also reduces seismic velocities in the MTZ(Inoue et al. 1998) and thus leads to an apparent MTZ thickening.Therefore, in order to produce the observed normal apparent MTZthickness, higher-than-normal temperature in the MTZ is requiredto reduce the thickness. While it is possible that the effects of waterand temperature can cancel each other and result in a normal MTZthickness, as observed, the chance for this to happen is not high.This is because it requires a specific combination of the amplitudeof the temperature anomaly and the amount of water through outmost of the study area where normal MTZ thickness is observed.Additionally, some studies suggested that excessive amount of wa-ter can increase the pulse width of d410 and decrease its amplitude(Smyth & Frost 2002; Van der Meijde et al. 2003). This is contra-dictory to the sharp arrivals associated with both the d410 and d660discontinuities (Figs 3 and 4). Therefore, while the pervasive exis-tence of water in the study area cannot be completely ruled out, ananhydrous MTZ with nearly normal temperature can satisfactorilyexplain the observations.
4.2 Implications for rifting mechanisms
The observed normal MTZ thickness, lack of significant traveltimeresiduals and the absence of elevated mantle conductivity (Khozaet al. 2013) associated with the incipient ORZ suggest the absenceof high-temperature anomalies in both the MTZ and the upper man-tle, ruling out contributions of one or more mantle plumes in riftinitiation and favouring a ‘passive’ origin.
A recent geodetic study (Malservisi et al. 2013) suggested thatwith respect to the African continent, the rigid South African blockrotates clockwise, probably along the Damara belt. Such differentialmovements between relatively rigid tectonic blocks can rupture thepre-existing weak zones along edges of the blocks. The fractures canthen propagate downwards through the lithosphere without mantleupwelling anomalies, and rifting processes can continue as long asthe regional dominant stresses are extensional or transtensional. Alikely environment for reactivation of shear zones adjacent to theORZ is the transcontinental Mwembeshi dislocation zone whichexperiences left-lateral transtension as the consequence of differen-tial extension between Nubia and Somalia (Daly et al. 1989). TheMwembeshi shear zone, which intersects the Luangwa and Malawirift zones farther to the northeast of the ORZ, has been suggestedto exert geometrical control on rift basin development within theEARS (Versfelt & Rosendahl 1989). Similar lithospheric-scale Pro-terozoic suture shear zones have been cited as a possible origin forthe Kenya Rift (Birt et al. 1997). Differential movements betweentectonic blocks in a relatively stable tectonic plate can originate frommany factors, such as differences in the direction and/or strengthof mantle flow (either as driving or resistant forces), uneven distri-bution of ridge push and slab pull forces across the plate, spatially
varying far-field stress from continental collision, and non-uniforminfluence of mantle upwelling or downwelling (e.g. Sabadini &Guinchi 1992; Doglioni 1993). We speculate that for the ORZ,variations of lithospheric thickness combined with the presenceof previously ruptured lithosphere give rise to one or more of theabove heterogeneities, leading to rift initiation. Such a passive rift-ing model is consistent with conclusions from the study of Leseaneet al. (2015) that the ORZ could be initiated through fluid-assistedlithospheric weakening without asthenospheric involvement. Pas-sive stretching of the lithosphere may eventually lead to active up-welling of the asthenosphere and resulting in the transition frompassive to active rifting (Huismans et al. 2001). This model couldexplain why most of the world’s continental rifts developed alongthe edges of cratonic blocks, where rapid changes of lithosphericthickness are commonly found (Keller et al. 1991).
5 C O N C LU S I O N S
This first receiver function study of the incipient ORZ reveals a nor-mal MTZ thickness, arguing against a strong thermal anomaly in theupper mantle and MTZ beneath most of the study area. The appar-ently shallower-than-normal MTZ discontinuities observed beneaththe Kalahari Craton can be explained by the existence of a litho-sphere that is 100–150 km thicker than that beneath the Congo Cra-ton and the Damara belt. In addition, the ORZ is not associated withsignificant delays in teleseismic P- and S-wave traveltime residu-als, implying the absence of significant mantle anomalies beneaththe ORZ. These observations are inconsistent with the existenceof mantle plumes or a broadly upwarped asthenosphere beneath thestudy area. Instead, they provide unprecedented supporting evidencefor a model of rift initiation involving lithospheric fracturing due todifferential movements between tectonic blocks along pre-existingzones of weakness such as edges of cratonic blocks.
A C K N OW L E D G E M E N T S
This study is part of the passive seismic component of an inter-disciplinary project funded by the United States National ScienceFoundation (NSF) Continental Dynamics Program. We appreciatediscussions with and encouragements from other participants of theproject. Careful reviews by three anonymous reviewers and Edi-tor G.R. Keller significantly improved the manuscript. We thankthe Program for Array Seismic Studies of the Continental Litho-sphere (PASSCAL) Instrument Center for equipment and logisticalsupport, and the Incorporated Research Institutions for Seismology(IRIS) Data Management Center for achieving both the SAFARIand SASE data sets used in the study. Field assistance providedby Angela M. Reusch from PASSCAL and Keletso Kaisara fromthe University of Botswana is greatly appreciated. YY was partiallysupported by the China Scholarship Council under contract No.2011645027 and CR was partly supported by the Missouri Univer-sity of Science and Technology Chancellor’s Fellowship. The fieldand data analysis tasks related to this study were supported by NSFgrant EAR-1009946 to SG and KL.
R E F E R E N C E S
Ammon, C.J., 1991. The isolation of receiver effects from teleseismic P-waveforms, Bull. seism. Soc. Am., 81, 2504–2510.
Bastow, I.D., 2012. Relative arrival-time upper-mantle tomography and theelusive background mean, Geophys. J. Int., 190, 1271–1278.
Birt, C.S., Maguire, P.K.H., Khan, M.A., Thybo, H., Keller, G.R. & Patel,J., 1997. The influence of pre-existing structures on the evolution of thesouthern Kenya Rift Valley-evidence from seismic and gravity studies,Tectonophysics, 278, 211–242.
Blum, J. & Shen, Y., 2004. Thermal, hydrous, and mechanical states of themantle transition zone beneath southern Africa, Earth planet. Sci. Lett.,217, 367–378.
Bufford, K.M. et al., 2012. Geometry and faults tectonic activity of the Oka-vango Rift Zone, Botswana: evidence from magnetotelluric and electricalresistivity tomography imaging, J. Afr. Earth. Sci., 65, 61–71.
Cao, A. & Levander, A., 2010. High-resolution transition zone struc-tures of the Gorda slab beneath the western United States: impli-cation for deep water subduction, J. geophys. Res., 115, B07301,doi:10.1029/2009JB006876.
Daly, M.C., Chorowicz, J. & Fairhead, J.D., 1989. Rift basin evolutionin Africa: the influence of reactivated steep basement shear zones, inInversion Tectonics, Vol. 44, pp. 309–334, eds. Cooper, M.A. & Williams,G.D., Geol. Soc. Spec. Pub.
Doglioni, C., 1993. Geological evidence for a global tectonic polarity,J. geol. Soc. Lond., 150, 991–1002.
Dueker, K.G. & Sheehan, A.F., 1997. Mantle discontinuity structure frommidpoint stacks of converted P to S waves across the Yellowstone hotspottrack, J. geophys. Res., 102, 8313–8327.
Ebinger, C.J., Crow, M.J., Rosendahl, B.R., Livingstone, D.A. & LeFournier,J., 1984. Structural evolution of the Malawi rift, Africa, Nature, 308,627–629.
Efron, B. & Tibshirani, R., 1986. Bootstrap methods for standard errors,confidence intervals, and other measures of statistical accuracy, Stat. Sci.,1, 54–75.
Gao, S.S. & Liu, K.H., 2014a. Mantle transition zone discontinu-ities beneath the contiguous United States, J. geophys. Res., 119,6452–6468.
Gao, S.S., Liu, K.H., Davis, P.M., Slack, P.D., Zorin, Y.A., Mordvinova, V.V.& Kozhevnikov, V.M., 2003. Evidence for small-scale mantle convectionin the upper mantle beneath the Baikal rift zone, J. geophys. Res., 108(B4),2194, doi:10.1029/2002JB002039.
Gao, S.S. et al., 2013. Seismic Arrays to Study African Rift Initiation, EOS,Trans. Am. geophys. Un., 94, 213–214.
Ghosh, S., Ohtani, E., Litasov, K.D., Suzuki, A., Dobson, D. & Funakoshi,K., 2013. Effect of water in depleted mantle on post-spinel transitionand implication for 660 km seismic discontinuity, Earth planet. Sci. Lett.,371–372, 103–111.
Helffrich, G., 2000. Topography of the transition zone seismic discontinu-ities, Rev. Geophys., 38, 141–158.
Huerta, A.D., Nyblade, A.A. & Reusch, A.M., 2009. Mantle transitionzone structure beneath Kenya and Tanzania: more evidence for a deep-seated thermal upwelling in the mantle, Geophys. J. Int., 177, 1249–1255.
Huismans, R.S., Podladchikov, Y.Y. & Cloetingh, S., 2001. Transition frompassive to active rifting: relative importance of asthenospheric domingand passive extension of the lithosphere, J. geophys. Res., 106, 11 271–11 291.
Keller, G.R., Khan, M.A., Morgan, P., Wendlandt, R.F., Baldridge,W.S., Olsen, K.H., Prodehl, C. & Braile, L.W., 1991. A comparativestudy of the Rio Grande and Kenya rifts, Tectonophysics, 197, 355–371.
Khoza, T.D., Jones, A.G., Muller, M.R., Evans, R.L., Miensopust, M.P. &Webb, S.J., 2013. Lithospheric structure of an Archean craton and adjacentmobile belt revealed from 2-D and 3-D inversion of magnetotelluric data:example from southern Congo craton in northern Namibia, J. geophys.Res., 118, 4378–4397.
Kinabo, B.D., Hogan, J.P., Atekwana, E.A., Abdelsalam, M.G. &Modisi, M.P., 2008. Fault growth and propagation during incipientcontinental rifting: insights from a combined aeromagnetic and Shut-tle Radar Topography Mission digital elevation model investigation ofthe Okavango Rift Zone, northwest Botswana, Tectonics, 27, TC3013,doi:10.1029/2007TC002154.
Lawrence, J.F. & Shearer, P.M., 2006. A global study of transition zonethickness using receiver functions, J. geophys. Res., 111, B06307,doi:10.1029/2005JB003973.
Leseane, K., Atekwana, E.A., Mickus, K.L., Abdelsalam, M.G., Shemang,E.M. & Atekwana, E.A., 2015. Thermal perturbations beneath the in-cipient Okavango Rift Zone, northwest Botswana, J. geophys. Res., 120,1210–1228.
Li, A., Forsyth, D.W. & Fischer, K.M., 2003. Shear velocity structure andazimuthal anisotropy beneath eastern North America from Rayleigh waveinversion, J. geophys. Res., 108, doi:10.1029/2002JB02259.
Litasov, K.D., Ohtani, E., Suzuki, A. & Funakoshi, K., 2005. Wet sub-duction versus cold subduction, Geophys. Res. Lett., 32, L13312,doi:10.1029/2005GL022921.
Liu, K.H. & Gao, S.S., 2006. Mantle transition zone discontinuities be-neath the Baikal rift and adjacent areas, J. geophys. Res., 111, B11301,doi:10.1029/2005JB004099.
Liu, K.H. & Gao, S.S., 2010. Spatial variations of crustal characteristicsbeneath the Hoggar swell, Algeria revealed by systematic analyses ofreceiver functions from a single seismic station, Geochem. Geophys.Geosys., 11, Q08011, doi:10.1029/2010GC003091.
Liu, K.H., Gao, S.S., Silver, P.G. & Zhang, Y., 2003. Mantle lay-ering across central South America, J. geophys. Res., 108, 2510,doi:10.1029/2002JB002208.
Malservisi, R., Hugentobler, U., Wonnacott, R. & Hackl, M., 2013. Howrigid is a rigid plate? Geodetic constraint from the TrigNet CGPS network,South Africa, Geophys. J. Int., 192, 918–928.
McCourt, S., Armstrong, R.A., Jelsma, H. & Mapeo, R.B.M., 2013.New U-Pb SHRIMP ages from the Lubango region, SW Angola: in-sights into the Palaeoproterozoic evolution of the Angolan Shield,southern Congo Craton, Africa, J. geol. Soc. Lond, 170, 353–363.
Miensopust, M.P., Jones, A.G., Muller, M.R., Garcia, X. & Evans, R.L.,2011. Lithospheric structures and precambrian terrane boundaries innortheastern Botswana revealed through magnetotelluric profiling as partof the southern African magnetotelluric experiment, J. geophys. Res., 116,B02401, doi:10.1029/2010JB007740.
Modisi, M.P., Atekwana, E.A., Kampunzu, A.B. & Ngwisanyi, T.H., 2000.Rift kinematics during the incipient stages of continental extension: evi-dence from the nascent Okavango rift basin, northwest Botswana, Geol-ogy, 28, 939–942.
Mohamed, A.A., Gao, S.S., Elsheikh, A.A., Liu, K.H., Yu, Y. & Fat-Helbary,R.E., 2014. Seismic imaging of mantle transition zone discontinuitiesbeneath the northern Red Sea and adjacent areas, Geophys. J. Int., 199,648–657.
Mulibo, G.D. & Nyblade, A.A., 2013. Mantle transition zone thinning be-neath eastern Africa: evidence for a whole-mantle superplume structure,Geophys. Res. Lett., 40, 3562–3566.
Muller, M.R. et al., 2009. Lithospheric structure, evolution and diamondprospectivity of the Rehoboth Terrane and Western Kaapvaal Craton,Southern Africa: constraints from broadband magnetotellurics, Lithos,112, 93–105.
Nolet, G., 2008. A Breviary of Seismic Tomography, Cambridge Univ. Press.Nyblade, A.A., Owens, T.J., Gurrola, H., Ritsema, J. & Langston, C.A., 2000.
Seismic evidence for a deep upper mantle thermal anomaly beneath eastAfrica, Geology, 28, 599–602.
Owens, T.J., Nyblade, A.A., Gurrola, H. & Langston, C.A., 2000. Mantletransition zone structure beneath Tanzania, East Africa, Geophys. Res.Lett., 27, 827–830.
Reeves, C.V., 1972. Rifting in the Kalahari? Nature, 237, 95–96.Ringwood, A.E., 1975. Composition and Petrology of the Earth’s Mantle,
McGraw-Hill.Rychert, C.A., Rondenay, S. & Fischer, K.M., 2007. P-to-S and S-to-P imag-
ing of a sharp lithosphere-asthenosphere boundary beneath eastern NorthAmerica, J. geophys. Res., 112, B08314, doi:10.1029/2006JB004619.
Sabadini, R. & Giunchi, G., 1992. Plate motion and dragging of the uppermantle: lateral variations of lithospheric thickness and their implicationsfor intraplate deformation, Geophys. Res. Lett., 19, 749–752.
Schmeling, H., 2010. Dynamic models of continental rifting with melt gen-eration, Tectonophysics, 480, 33–47.
Sengor, A.M. & Burke, K., 1978. Relative timing of rifting and volcanismon Earth and its tectonic implications, Geophys. Res. Lett., 5, 419–421.
Smith, W.H.F. & Wessel, P., 1990. Gridding with continuous curvaturesplines in tension, Geophysics, 55, 293–305.
Smyth, J.R. & Frost, D.J., 2002. The effect of water on the 410-km discon-tinuity: an experimental study, Geophys. Res. Lett., 29, 1–4.
Stern, R.J., 1994. Arc-assembly and continental collision in the Neoprotero-zoic African orogen: implications for the consolidation of Gondwanaland,Annu. Rev. Earth planet. Sci., 22, 319–351.
Tauzin, B., Debayle, E. & Wittlinger, G., 2008. The mantle transi-tion zone as seen by global Pds phases: no clear evidence for athin transition zone beneath hotspots, J. geophys. Res., 113, B08309,doi:10.1029/2007JB005364.
Thompson, D.A., Hammond, J.O.S., Kendall, J.-M., Stuart, G.W., Helffrich,G., Keir, D., Ayele, A. & Goitom, B., 2015. Hydrous upwelling acrossthe mantle transition zone beneath the Afar Triple Junction, Geochem.Geophys. Geosyst., 16, 834–846.
van der Meijde, M., Marone, F., Giardini, D. & van der Lee, V., 2003.Seismic evidence for water deep in Earth’s upper mantle, Science, 300,1556–1558.
Versfelt, J. & Rosendahl, B.R., 1989. Relationships between pre-rift structureand rift architecture in Lakes Tanganyika and Malawi, East Africa, Nature,337, 354–357.
White, R. & McKenzie, D., 1989. Magmatism at rift zones: the generationof volcanic continental margins and flood basalts, J. geophys. Res., 94,7685–7729.
Wilson, D., Aster, R., Ni, J., Grand, S., West, M., Gao, W., Baldridge,W.S. & Semken, S., 2005. Imaging the seismic structure of the crustand upper mantle beneath the Great Plains, Rio Grande Rift, and Col-orado Plateau using receiver functions, J. geophys. Res., 110, B05306,doi:10.1029/2004JB003492.
Yu, Y. et al., 2013. Crustal and mantle structure and anisotropy beneath theincipient segments of the East African Rift System: preliminary resultsfrom the ongoing SAFARI, AGU Fall Meet. Abstracts, 1, 2542.