science for a changing world US. ENVIRONMENTAL PROTECTION AGENCY, REGION 1 Geophysical Surveys of Country Pond and Adjacent Wetland, and Implications for Contaminant-Plume Monitoring, Kingston, New Hampshire, 1998 Open-File Report 99-51 0 100 200 300 4OO METERS U.S. Department of the Interior U.S. Geological Survey
Transcript
science for a changing world
US ENVIRONMENTAL PROTECTION AGENCY REGION 1
Geophysical Surveys of Country Pond andAdjacent Wetland and Implications forContaminant-Plume MonitoringKingston New Hampshire 1998
Open-File Report 99-51
0 100 200 300 4OO METERS
US Department of the InteriorUS Geological Survey
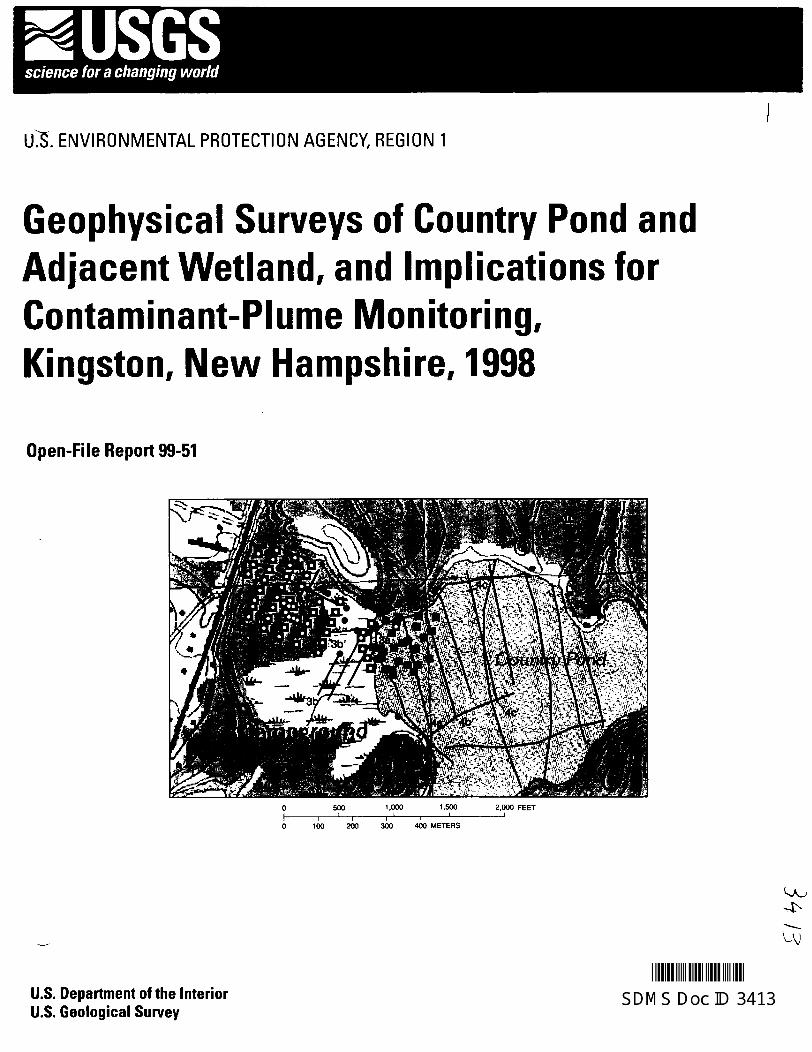
Map on cover shows location of ground-penetrating radar (GPR) profile lines (red lines) probes (black boxes with white circles) and wells (red circles are consultant monitoring wells and black squares are sites of U S Geological Survey monitoring wells) Base map is from US Geological Survey 124000 (1 inch on the map represents about a half-mile on the ground) Digital raster graph image Kingston N H 1989 Topographic contour interval is 10 feet
US Department of the Interior US Geological Survey
US ENVIRONMENTAL PROTECTION AGENCY REGION 1
Geophysical Surveys of Country Pond and Adjacent Wetland and Implications for Contaminant-Plume Monitoring Kingston New Hampshire 1998
By Joseph D Ayotte Thomas J Mack and Craig M Johnston
Open-File Report 99-51
Pembroke New Hampshire 1999
US DEPARTMENT OF THE INTERIOR BRUCE BABBITT Secretary
US GEOLOGICAL SURVEY
Charles G Groat Director
The use of firm trade and brand names in this report is for identification purposes only and does not constitute endorsement by the US Geological Survey
For additional information write to Copies of this report can be purchased from
District Chief US Geological Survey US Geological Survey Information Services New HampshireVermont District Box 25286 Federal Center 361 Commerce Way Denver CO 80225 Pembroke NH 03275-3718
or through our website at httpnhwaterusgsgov
CONTENTS
Abstract 1
Introduction 1
Purpose and Scope 1
Description of Study Area and Geohydrologic Setting 3
Previous Investigations 3
Acknowledgments 3
Geophysical Survey Methods 3
Ground-Penetrating Radar 4
Terrain Conductivity 5
Results of Geophysical Surveys 6
Ground-Penetrating Radar 6
Terrain Conductivity 9
Monitoring-Well Network 12
Summary and Conclusions 15
Selected References 15
FIGURES
1-2 Maps showing
1 Location of the study area Country Pond Kingston New Hampshire 2
2 Location of ground-penetrating radar (GPR) profile lines probes and wells 4
3 Processed ground-penetrating-radar profiles 3a-3a and 3b-3b 7
5 Elevation of organic sediments in Country Pond 10
6 Elevation of stratified drift (sand) in Country Pond and adjacent wetland 11
7 Thickness of organic sediments in Country Pond and adjacent wetland 12
8 Digital orthophoto showing EM31 (A) and EM34 (B) terrain-conductivity data-collection locations and associated values in Country Pond and adjacent wetland 13
9 Map showing terrain conductivity in an adjacent wetland (A) and Country Pond (B) 14
TABLES
1 Approximate ground-penetrating radar velocity for selected materials 5
2 Computed ground-penetrating-radar propagation velocities for organic soils near selected wells or borings in Country Pond Kingston New Hampshire 6
Contents HI
CONVERSION FACTORS VERTICAL DATUM AND ABBREVIATIONS
Multiply By To obtain
acre 04047 hectometer
foot (ft) 03048 meter
mile (mi) 1609 kilometer
meter (m) 3281 foot
Temperature in degrees Fahrenheit (degF) can be converted to degrees Celsius (degC) as follows degC = 59 (degF - 32)
Sea Level In this report sea level refers to the National Geodetic Vertical Datum of 1929 (NGVD of 1929)mdasha geodetic datum derived from a general adjustment of the first-order level nets of both the United States and Canada formerly called Sea Level Datum of 1929
ABBREVIATIONS OF WATER QUALITY AND GEOPHYSICAL UNITS USED IN THIS REPORT
dBm decibels per meter
ftns foot per nanosecond
MHz megahertz
mns meter per nanosecond
mSm millisiemens per meter
m|4s meters per microsecond
ns nanoseconds
[iscm microsiemens per centimeter at 25deg Celsius
IV Contents
Geophysical Surveys of Country Pond and Adjacent Wetland and Implications for Contaminant-Plume Monitoring Kingston New Hampshire 1998 By Joseph D Ayotte Thomas J Mack and Craig M Johnston
Abstract
Contaminants from a hazardous-waste site have moved downgradient though a wetland and beneath Country Pond in Kingston New Hampshire This pond is a recreational resource for the area and is bordered by homes and seasonal camps that use onsite wells for water supply Geophysical profiles ground-penetrating radar and electromagnetic-terrain-conductivity surveys provide information about the various lithologies and the position of the contaminant plume Contour maps of the elevations of surfaces of various lithologies indicate that the sand surface beneath the relatively flat organic sediment surface is irregular Terrain-conductivity data identify several anomalies most of which are related to the thickness of the water column and organic sediments overlying the sand One notable exception however is a large anomaly (high terrain conductivity) along the northwestern part of the wetland and pond area which probably represents a contaminant plume moving through the sand unit beneath the wetland and pond Existing test-boring data were used to confirm the results of the geophysical surveys The existing monitoring-well network does not adequately intersect the contaminant plume or provide a means to monitor plume concentration
INTRODUCTION
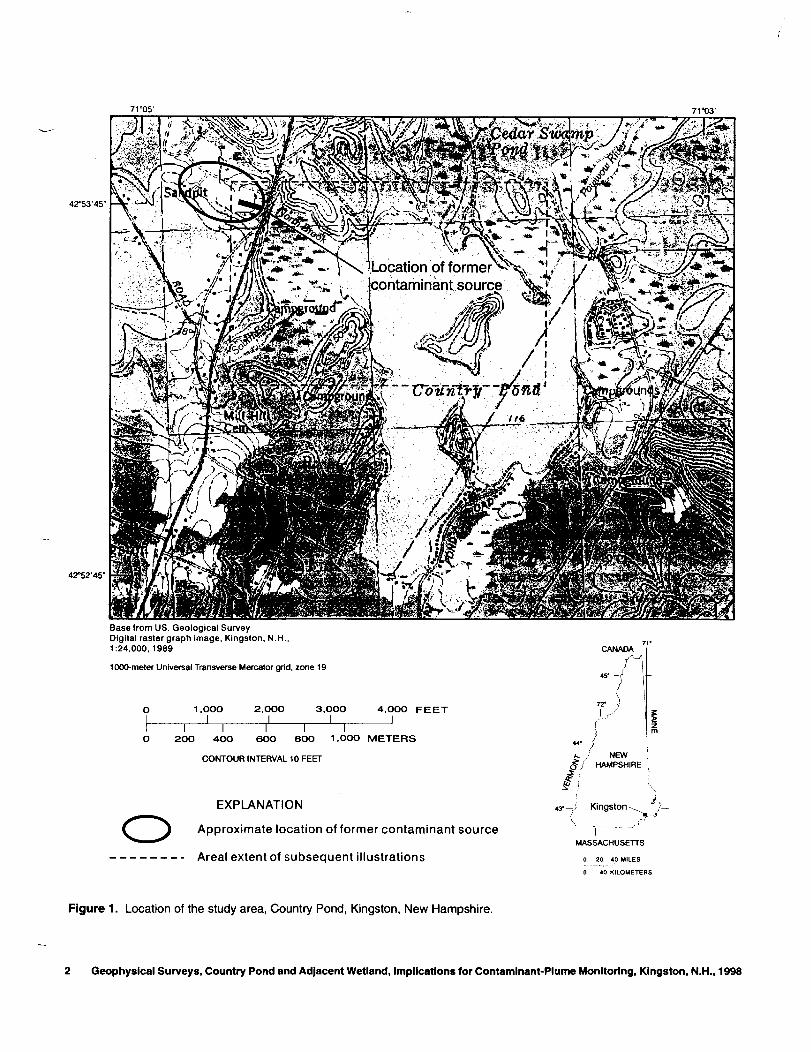
Country Pond a 280-acre pond is a recreational resource for the Kingston area and is bordered by homes and seasonal camps that use onsite wells for water supply The extent and migration of groundshywater contamination towards the pond which is immediately downgradient (east) of a hazardous-waste US Environmental Protection Agency (USEPA) Superfund site (fig 1) is a concern for local residents and those using the pond for recreational activities The US Geological Survey (USGS) in cooperation with the USEPA Waste Management Division Region I mapped subsurface sediments in the wetlands that drain to Country Pond by use of geophysical methods to determine the location of a contaminant plume and evaluate a monitoring-well network
Purpose and Scope
This report describes the results of geophysical investigations of glacial and post-glacial deposits near a former container manufacturing site The area investigated includes parts of a wetland area to the east of the former site and parts of Country Pond adjacent to the marsh Included in the report are geophysical profiles that provide information about the various lithologies and contour maps of the elevation of surfaces of various lithologic units and the thickness of an organic material layer and terrain conductivity Test-boring data were used to confirm the results of the geophysical surveys The existing monitoring-well network was evaluated in relation to the results of this study The investigation was limited to the wetland and pond east of the former container manufacturers waste-disposal site (fig 1)
Abstract
71deg05
42deg5345
42deg5245
Base from US Geological Survey Digital raster graph image Kingston NH 124000 1989
1000-meter Universal Transverse Mercator grid zone 19
O 1OOO 2OOO 3OOOI I I
I I I I I O 2OO 4OO 600 800 1 OOO
CONTOUR INTERVAL 10 FEET
EXPLANATION
71 031
Luucuiun ui lormer ^ contaminant source
^pound
4OOO I
FEET
CANADA
r45mdash f I
T )
METERS
NEW
HAMPSHIRE
43-mdash-^ Kingston shy
O Approximate location of former contaminant source
Area extent of subsequent illustrations
Figure 1 Location of the study area Country Pond Kingston New Hampshire
Geophysical Surveys Country Pond and Adjacent Wetland Implications for Contaminant-Plume
MASSACHUSETTS
0 20 40 MILES
- - - mdash - r shy
0 40 KILOMETERS
Monitoring Kingston NH 1998 2
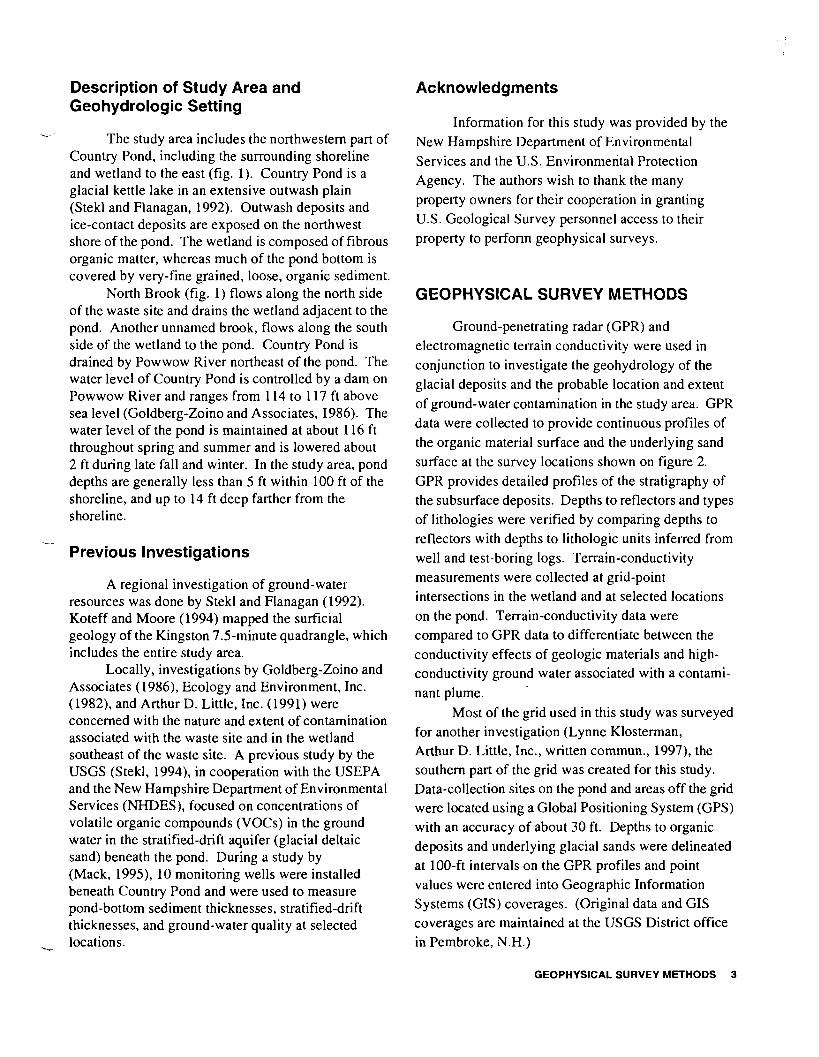
Description of Study Area and Geohydrologic Setting
The study area includes the northwestern part of Country Pond including the surrounding shoreline and wetland to the east (fig 1) Country Pond is a glacial kettle lake in an extensive outwash plain (Stekl and Flanagan 1992) Outwash deposits and ice-contact deposits are exposed on the northwest shore of the pond The wetland is composed of fibrous organic matter whereas much of the pond bottom is covered by very-fine grained loose organic sediment
North Brook (fig 1) flows along the north side of the waste site and drains the wetland adjacent to the pond Another unnamed brook flows along the south side of the wetland to the pond Country Pond is drained by Powwow River northeast of the pond The water level of Country Pond is controlled by a dam on Powwow River and ranges from 114 to 117 ft above sea level (Goldberg-Zoino and Associates 1986) The water level of the pond is maintained at about 116 ft throughout spring and summer and is lowered about 2 ft during late fall and winter In the study area pond depths are generally less than 5 ft within 100 ft of the shoreline and up to 14 ft deep farther from the shoreline
Previous Investigations
A regional investigation of ground-water resources was done by Stekl and Flanagan (1992) Koteff and Moore (1994) mapped the surficial geology of the Kingston 75-minute quadrangle which includes the entire study area
Locally investigations by Goldberg-Zoino and Associates (1986) Ecology and Environment Inc (1982) and Arthur D Little Inc (1991) were concerned with the nature and extent of contamination associated with the waste site and in the wetland southeast of the waste site A previous study by the USGS (Stekl 1994) in cooperation with the USEPA and the New Hampshire Department of Environmental Services (NHDES) focused on concentrations of volatile organic compounds (VOCs) in the ground water in the stratified-drift aquifer (glacial deltaic sand) beneath the pond During a study by (Mack 1995) 10 monitoring wells were installed beneath Country Pond and were used to measure pond-bottom sediment thicknesses stratified-drift thicknesses and ground-water quality at selected locations
Acknowledgments
Information for this study was provided by the New Hampshire Department of Environmental Services and the US Environmental Protection Agency The authors wish to thank the many property owners for their cooperation in granting US Geological Survey personnel access to their property to perform geophysical surveys
GEOPHYSICAL SURVEY METHODS
Ground-penetrating radar (GPR) and electromagnetic terrain conductivity were used in conjunction to investigate the geohydrology of the glacial deposits and the probable location and extent of ground-water contamination in the study area GPR data were collected to provide continuous profiles of the organic material surface and the underlying sand surface at the survey locations shown on figure 2 GPR provides detailed profiles of the stratigraphy of the subsurface deposits Depths to reflectors and types of lithologies were verified by comparing depths to reflectors with depths to lithologic units inferred from well and test-boring logs Terrain-conductivity measurements were collected at grid-point intersections in the wetland and at selected locations on the pond Terrain-conductivity data were compared to GPR data to differentiate between the conductivity effects of geologic materials and high-conductivity ground water associated with a contamishynant plume
Most of the grid used in this study was surveyed for another investigation (Lynne Klosterman Arthur D Little Inc written commun 1997) the southern part of the grid was created for this study Data-collection sites on the pond and areas off the grid were located using a Global Positioning System (GPS) with an accuracy of about 30 ft Depths to organic deposits and underlying glacial sands were delineated at 100-ft intervals on the GPR profiles and point values were entered into Geographic Information Systems (GIS) coverages (Original data and GIS coverages are maintained at the USGS District office in Pembroke NH)
GEOPHYSICAL SURVEY METHODS 3
71deg0430 71deg04 15 71-04 71-0345
42deg5345 mdash
42deg53 30
Base from US Geological Survey 500 1000 1 500 2000 FEET Digital raster graph image Kingston N H Ishy1 24000 1989 0 100 200 300 400 METERS
EXPLANATION
3a 3a | | GPR survey line-Cross bar and label indicates profile location
D Probe data
bull Consultant monitoring wells
bull US Geological Survey monitoring wells
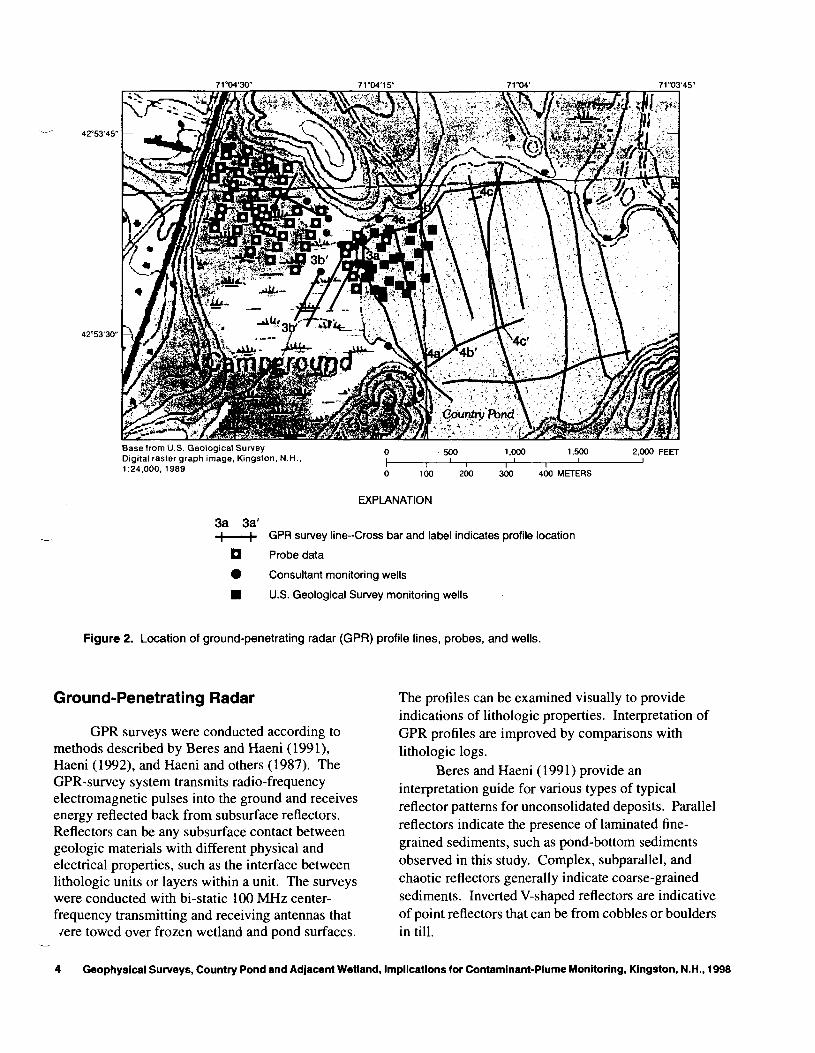
Figure 2 Location of ground-penetrating radar (GPR) profile lines probes and wells
Ground-Penetrating Radar
GPR surveys were conducted according to methods described by Beres and Haeni (1991) Haeni (1992) and Haeni and others (1987) The GPR-survey system transmits radio-frequency electromagnetic pulses into the ground and receives energy reflected back from subsurface reflectors Reflectors can be any subsurface contact between geologic materials with different physical and electrical properties such as the interface between lithologic units or layers within a unit The surveys were conducted with bi-static 100 MHz center-frequency transmitting and receiving antennas that ere towed over frozen wetland and pond surfaces
The profiles can be examined visually to provide indications of lithologic properties Interpretation of GPR profiles are improved by comparisons with lithologic logs
Beres and Haeni (1991) provide an interpretation guide for various types of typical reflector patterns for unconsohdated deposits Parallel reflectors indicate the presence of laminated fine-grained sediments such as pond-bottom sediments observed in this study Complex subparallel and chaotic reflectors generally indicate coarse-grained sediments Inverted V-shaped reflectors are indicative of point reflectors that can be from cobbles or boulders in till
Geophysical Surveys Country Pond and Adjacent Wetland Implications for Contaminant-Plume Monitoring Kingston NH 1998
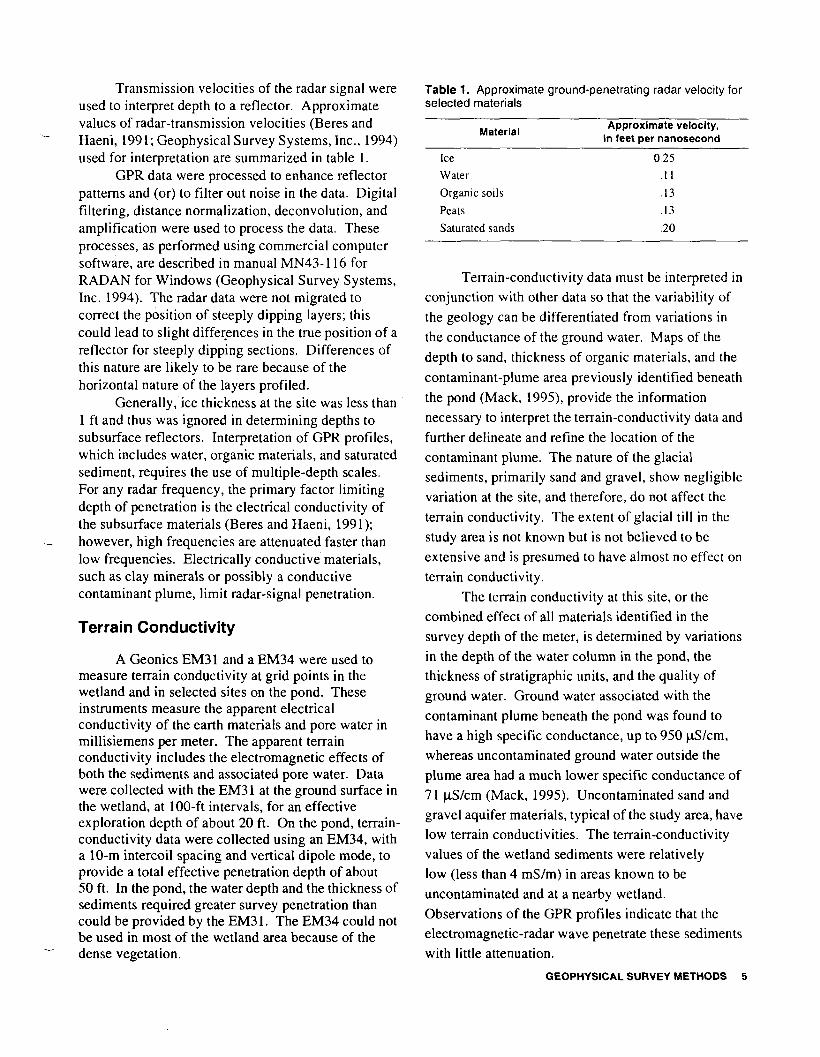
Transmission velocities of the radar signal were used to interpret depth to a reflector Approximate values of radar-transmission velocities (Beres and Haeni 1991 Geophysical Survey Systems Inc 1994) used for interpretation are summarized in table 1
GPR data were processed to enhance reflector patterns and (or) to filter out noise in the data Digital filtering distance normalization deconvolution and amplification were used to process the data These processes as performed using commercial computer software are described in manual MN43-116 for RADAN for Windows (Geophysical Survey Systems Inc 1994) The radar data were not migrated to correct the position of steeply dipping layers this could lead to slight differences in the true position of a reflector for steeply dipping sections Differences of this nature are likely to be rare because of the horizontal nature of the layers profiled
Generally ice thickness at the site was less than 1 ft and thus was ignored in determining depths to subsurface reflectors Interpretation of GPR profiles which includes water organic materials and saturated sediment requires the use of multiple-depth scales For any radar frequency the primary factor limiting depth of penetration is the electrical conductivity of the subsurface materials (Beres and Haeni 1991) however high frequencies are attenuated faster than low frequencies Electrically conductive materials such as clay minerals or possibly a conductive contaminant plume limit radar-signal penetration
Terrain Conductivity
A Geonics EM31 and a EM34 were used to measure terrain conductivity at grid points in the wetland and in selected sites on the pond These instruments measure the apparent electrical conductivity of the earth materials and pore water in millisiemens per meter The apparent terrain conductivity includes the electromagnetic effects of both the sediments and associated pore water Data were collected with the EM31 at the ground surface in the wetland at 100-ft intervals for an effective exploration depth of about 20 ft On the pond terrain-conductivity data were collected using an EM34 with a 10-m intercoil spacing and vertical dipole mode to provide a total effective penetration depth of about 50 ft In the pond the water depth and the thickness of sediments required greater survey penetration than could be provided by the EM31 The EM34 could not be used in most of the wetland area because of the dense vegetation
Table 1 Approximate ground-penetrating radar velocity for selected materials
Material Approximate velocity
in feet per nanosecond
Ice 025
Water 11
Organic soils 13
Peats 13
Saturated sands 20
Terrain-conductivity data must be interpreted in conjunction with other data so that the variability of the geology can be differentiated from variations in the conductance of the ground water Maps of the depth to sand thickness of organic materials and the contaminant-plume area previously identified beneath the pond (Mack 1995) provide the information necessary to interpret the terrain-conductivity data and further delineate and refine the location of the contaminant plume The nature of the glacial sediments primarily sand and gravel show negligible variation at the site and therefore do not affect the terrain conductivity The extent of glacial till in the study area is not known but is not believed to be extensive and is presumed to have almost no effect on terrain conductivity
The terrain conductivity at this site or the combined effect of all materials identified in the survey depth of the meter is determined by variations in the depth of the water column in the pond the thickness of stratigraphic units and the quality of ground water Ground water associated with the contaminant plume beneath the pond was found to have a high specific conductance up to 950 (JScm whereas uncontaminated ground water outside the plume area had a much lower specific conductance of 71 jxScm (Mack 1995) Uncontaminated sand and gravel aquifer materials typical of the study area have low terrain conductivities The terrain-conductivity values of the wetland sediments were relatively low (less than 4 mSm) in areas known to be uncontaminated and at a nearby wetland Observations of the GPR profiles indicate that the electromagnetic-radar wave penetrate these sediments with little attenuation
GEOPHYSICAL SURVEY METHODS 5
RESULTS OF GEOPHYSICAL SURVEYS
The results of the geophysical surveys presented in this section include selected GPR profiles maps of the thickness of the organic layer elevation of the sand surface and a contoured terrain-conductivity data
Ground-Penetrating Radar
GPR data were collected over a total distance of more than 2 mi within the study area The data-collection areas and the locations of selected profiles are shown in figure 2 Radar-signal-penetration depths were limited to about 500 to 600 ns throughout the study area The water table was equivalent to land surface in wetland and pond areas surveyed The surveys done on the pond were done on ice that was generally less than 05 ft thick with little to no snow cover
Lithologic information obtained from drilling logs (Mack 1995 Stekl 1994) and from probes pushed into the wetland (Goldberg-Zoino and Associates 1986) was used to help interpret GPR profiles Electromagnetic reflectors could be present for example at a water-columnmdashorganic-material interface at an organic materialmdashsand interface at a coarse to fine-grained interface or at a bedrock surface All of these reflectors might be represented as a dark continuous band on the GPR profile however a thin electrically conductive layer such as a clay lens also might be represented by a dark band
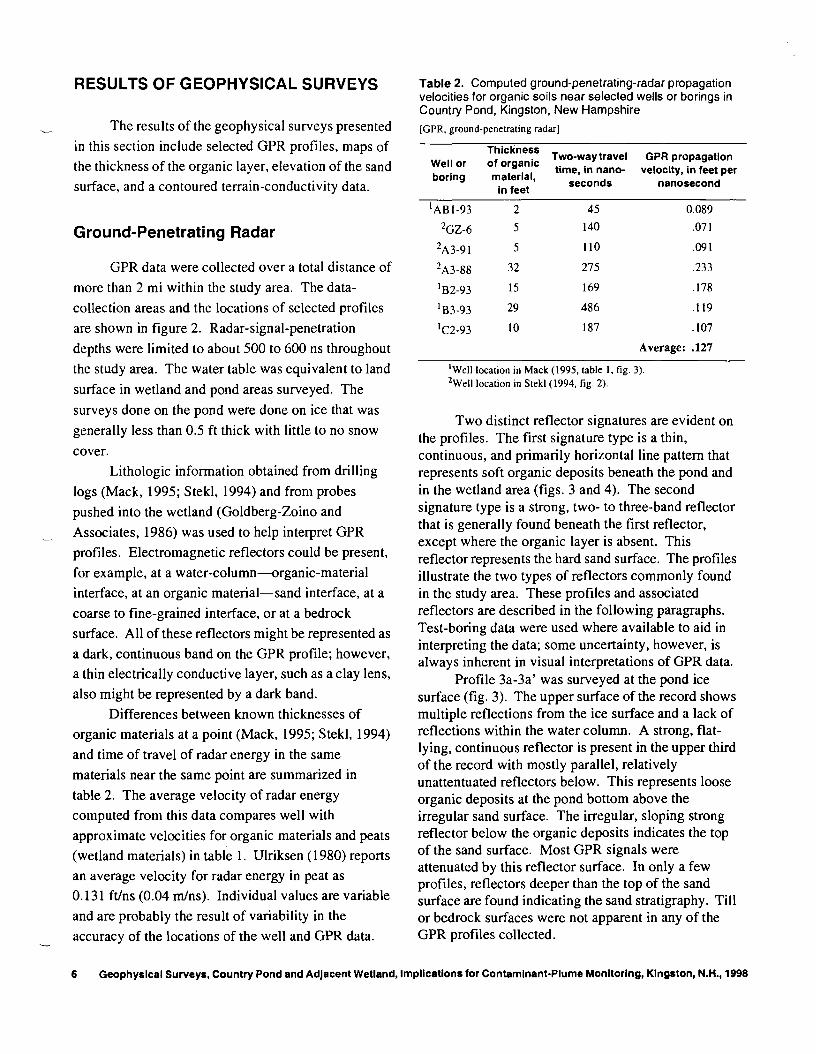
Differences between known thicknesses of organic materials at a point (Mack 1995 Stekl 1994) and time of travel of radar energy in the same materials near the same point are summarized in table 2 The average velocity of radar energy computed from this data compares well with approximate velocities for organic materials and peats (wetland materials) in table 1 Ulriksen (1980) reports an average velocity for radar energy in peat as 0131 ftns (004 mns) Individual values are variable and are probably the result of variability in the accuracy of the locations of the well and GPR data
Table 2 Computed ground-penetrating-radar propagation velocities for organic soils near selected wells or borings in Country Pond Kingston New Hampshire [GPR ground-penetrating radar]
Thickness Two-way travel GPR propagation Well or of organic time in nano- velocity in feet per
boring material seconds nanosecond in feet
AB1-93 2 45 0089 2GZ-6 5 140 071
2A3-91 5 110 091 2A3-88 32 275 233
B2-93 15 169 178
B3-93 29 486 119 lC2-93 10 187 107
Average 127
Well location in Mack (1995 table 1 fig 3) 2Well location m Stekl (1994 fig 2)
Two distinct reflector signatures are evident on the profiles The first signature type is a thin continuous and primarily horizontal line pattern that represents soft organic deposits beneath the pond and in the wetland area (figs 3 and 4) The second signature type is a strong two- to three-band reflector that is generally found beneath the first reflector except where the organic layer is absent This reflector represents the hard sand surface The profiles illustrate the two types of reflectors commonly found in the study area These profiles and associated reflectors are described in the following paragraphs Test-boring data were used where available to aid in interpreting the data some uncertainty however is always inherent in visual interpretations of GPR data
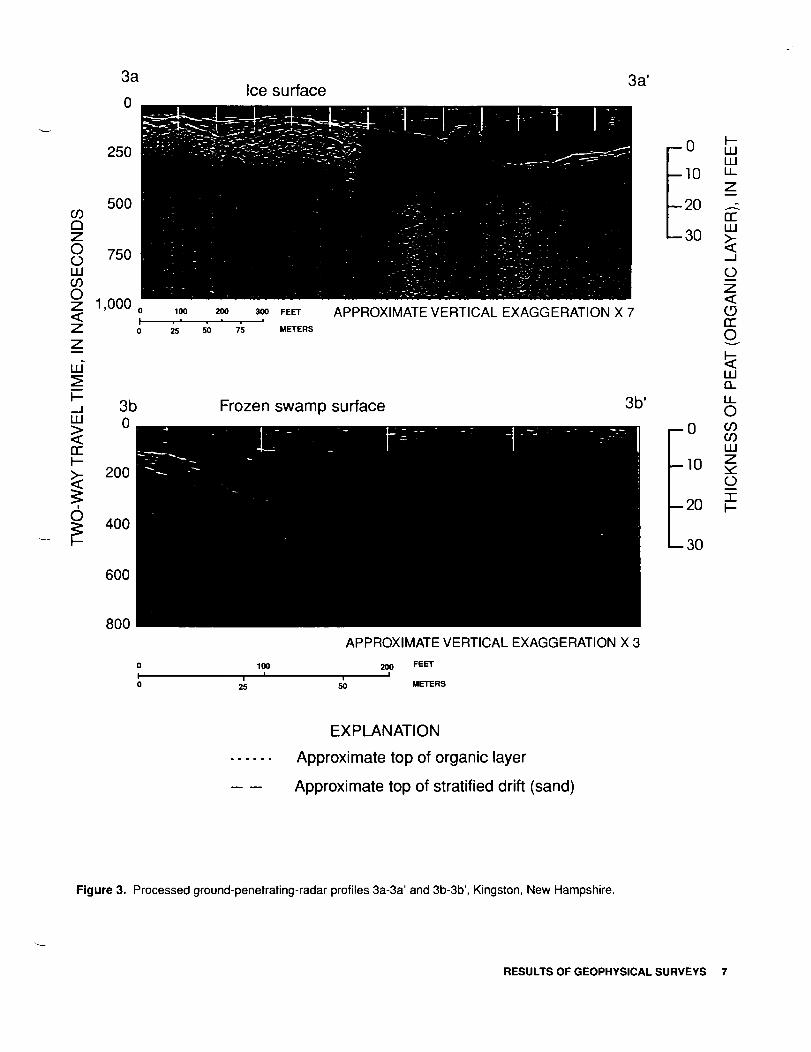
Profile 3a-3a was surveyed at the pond ice surface (fig 3) The upper surface of the record shows multiple reflections from the ice surface and a lack of reflections within the water column A strong flat-lying continuous reflector is present in the upper third of the record with mostly parallel relatively unattentuated reflectors below This represents loose organic deposits at the pond bottom above the irregular sand surface The irregular sloping strong reflector below the organic deposits indicates the top of the sand surface Most GPR signals were attenuated by this reflector surface In only a few profiles reflectors deeper than the top of the sand surface are found indicating the sand stratigraphy Till or bedrock surfaces were not apparent in any of the GPR profiles collected
Geophysical Surveys Country Pond and Adjacent Wetland Implications for Contaminant-Plume Monitoring Kingston NH 1998 6
250 bullo10
tL LU
LL
o LU CO O
500
750
1000 100
25 50 75
joo FEETMETERS
APPROXIMATE VERTICAL EXAGGERATION X 7
-20
-30 or LU
o
oc o
LU S I-_l LU
DC
I
3b 0
200
Frozen swamp surface 3b 0
-10
LU Q_ LL O
8 LU Z
o
400
L-30
600
800 APPROXIMATE VERTICAL EXAGGERATION X 3
100 200 FEET
25 50 METERS
EXPLANATION
Approximate top of organic layer
Approximate top of stratified drift (sand)
Figure 3 Processed ground-penetrating-radar profiles 3a-3a and 3b-3b Kingston New Hampshire
RESULTS OF GEOPHYSICAL SURVEYS 7
200
400 c3Q Z o LU o 600 LU CO O
LU
LU
CCIshy
I
800 100 200 300 FEET APPROXIMATE VERTICAL EXAGGERATION X 8
25 SO 75 METERS
EXPLANATION
Approximate top of organic layer - - Approximate top of stratified drift (sand)
Figure 4 Processed ground-penetrating-radar profiles 4a-4a 4b-4b and 4c-4c Kingston New Hampshire
Geophysical Surveys Country Pond and Adjacent Wetland Implications for Contaminant-Plume Monitoring Kingston NH 1998 8
Profile 3b-3b was collected on the wetland adjacent to the pond (fig 3) In the wetland the organic surface and the water table are at the land surface The strong reflector located one third of the distance below the top of the record represents the sand surface Similar to sand-surface reflections beneath the pond this layer attenuated most of the GPR signal and prevented detection of deeper reflectors The sand-surface reflector is prominent and continuous on the left side of the record but is absent on the right side of the record A sequence of parallel pond profiles (4a-4a 4b-4b and 4c-4c fig 2 and fig 4) in succession from the edge of the wetland out into the pond shows a continuous buried sand ridge that extends from the southern part of the wetland out into the pond It also shows the thick organic sediments that have accumulated between the northern shore of the pond and the buried sand ridge (fig 4)
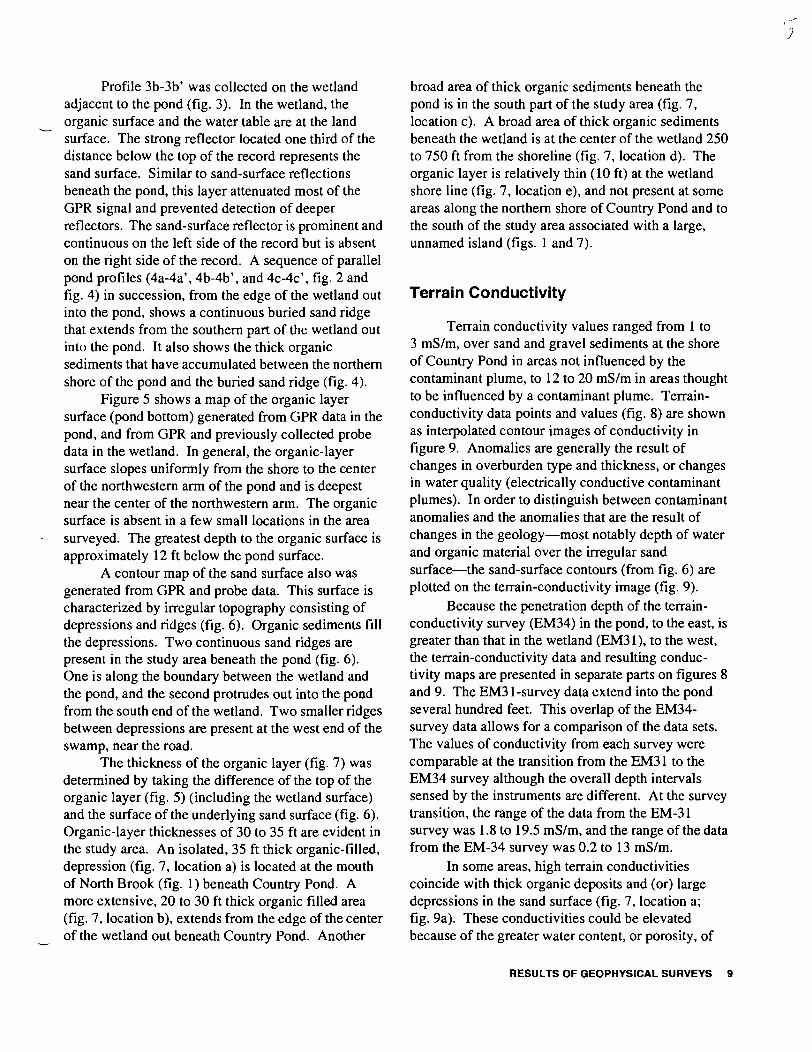
Figure 5 shows a map of the organic layer surface (pond bottom) generated from GPR data in the pond and from GPR and previously collected probe data in the wetland In general the organic-layer surface slopes uniformly from the shore to the center of the northwestern arm of the pond and is deepest near the center of the northwestern arm The organic surface is absent in a few small locations in the area surveyed The greatest depth to the organic surface is approximately 12 ft below the pond surface
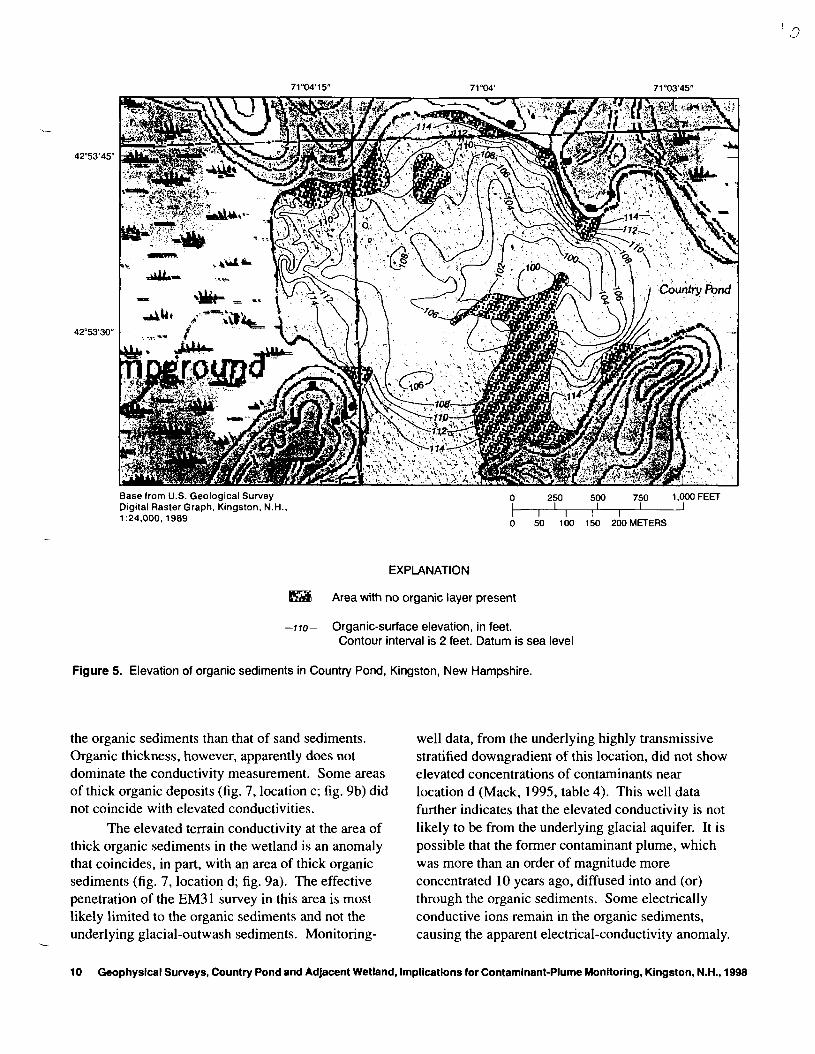
A contour map of the sand surface also was generated from GPR and probe data This surface is characterized by irregular topography consisting of depressions and ridges (fig 6) Organic sediments fill the depressions Two continuous sand ridges are present in the study area beneath the pond (fig 6) One is along the boundary between the wetland and the pond and the second protrudes out into the pond from the south end of the wetland Two smaller ridges between depressions are present at the west end of the swamp near the road
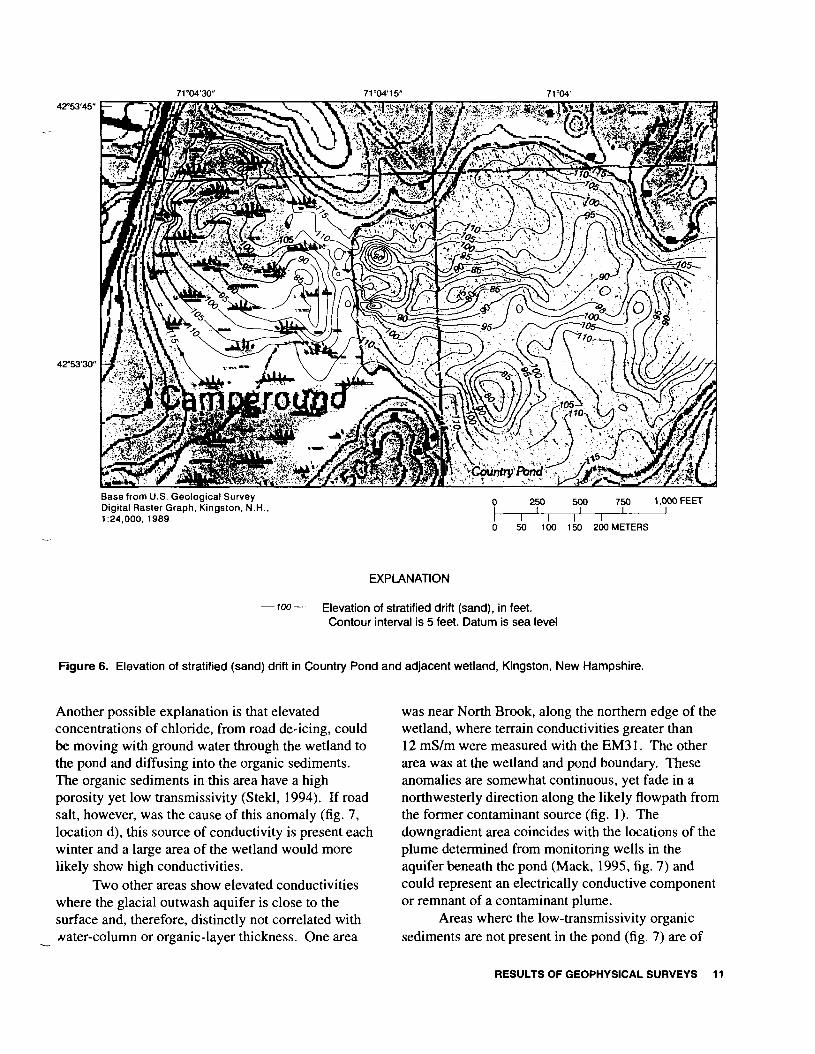
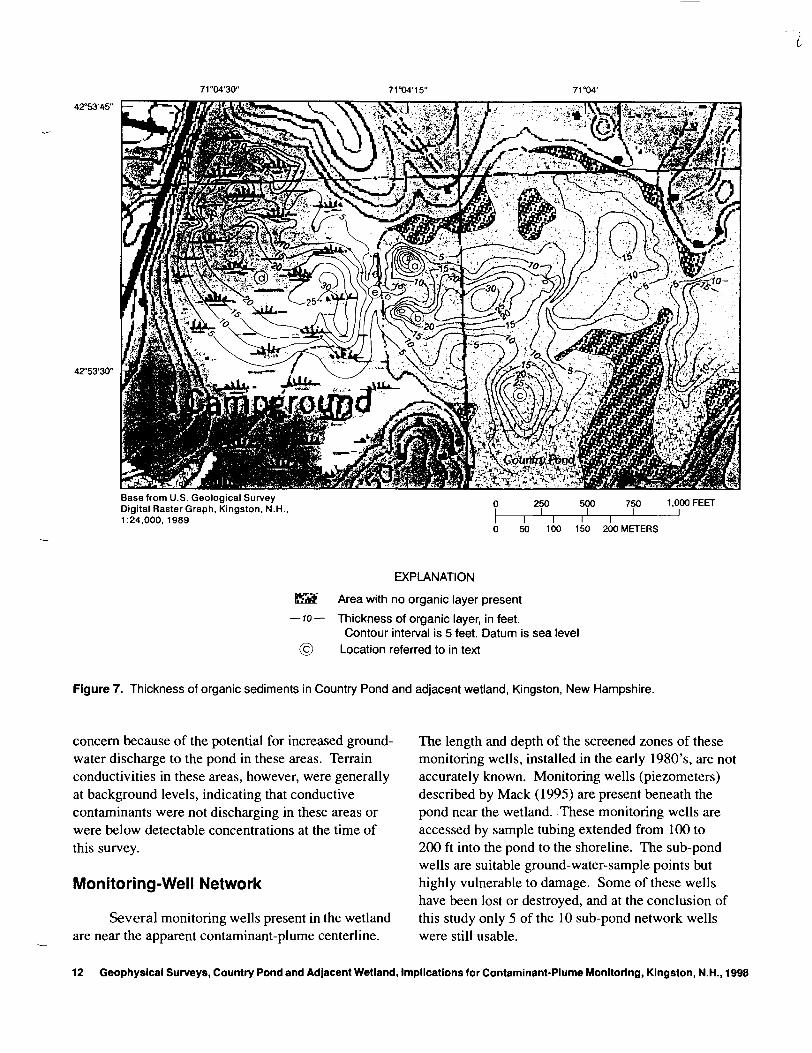
The thickness of the organic layer (fig 7) was determined by taking the difference of the top of the organic layer (fig 5) (including the wetland surface) and the surface of the underlying sand surface (fig 6) Organic-layer thicknesses of 30 to 35 ft are evident in the study area An isolated 35 ft thick organic-filled depression (fig 7 location a) is located at the mouth of North Brook (fig 1) beneath Country Pond A more extensive 20 to 30 ft thick organic filled area (fig 7 location b) extends from the edge of the center of the wetland out beneath Country Pond Another
broad area of thick organic sediments beneath the pond is in the south part of the study area (fig 7 location c) A broad area of thick organic sediments beneath the wetland is at the center of the wetland 250 to 750 ft from the shoreline (fig 7 location d) The organic layer is relatively thin (10 ft) at the wetland shore line (fig 7 location e) and not present at some areas along the northern shore of Country Pond and to the south of the study area associated with a large unnamed island (figs 1 and 7)
Terrain Conductivity
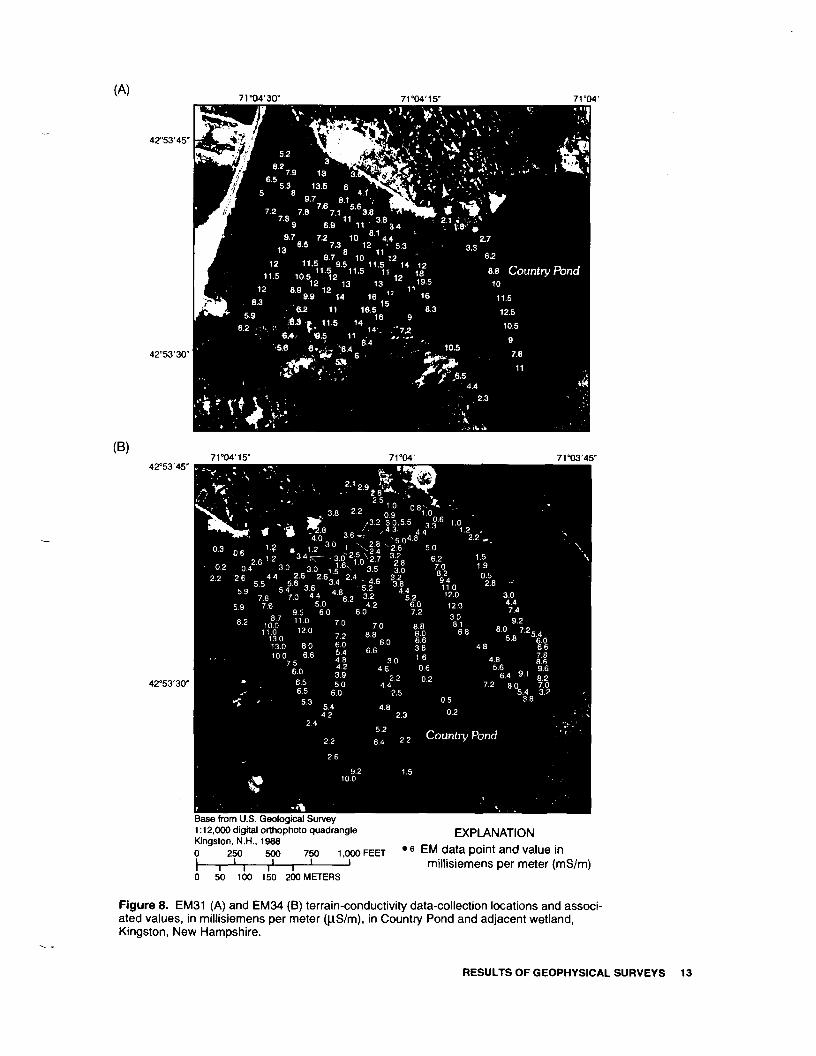
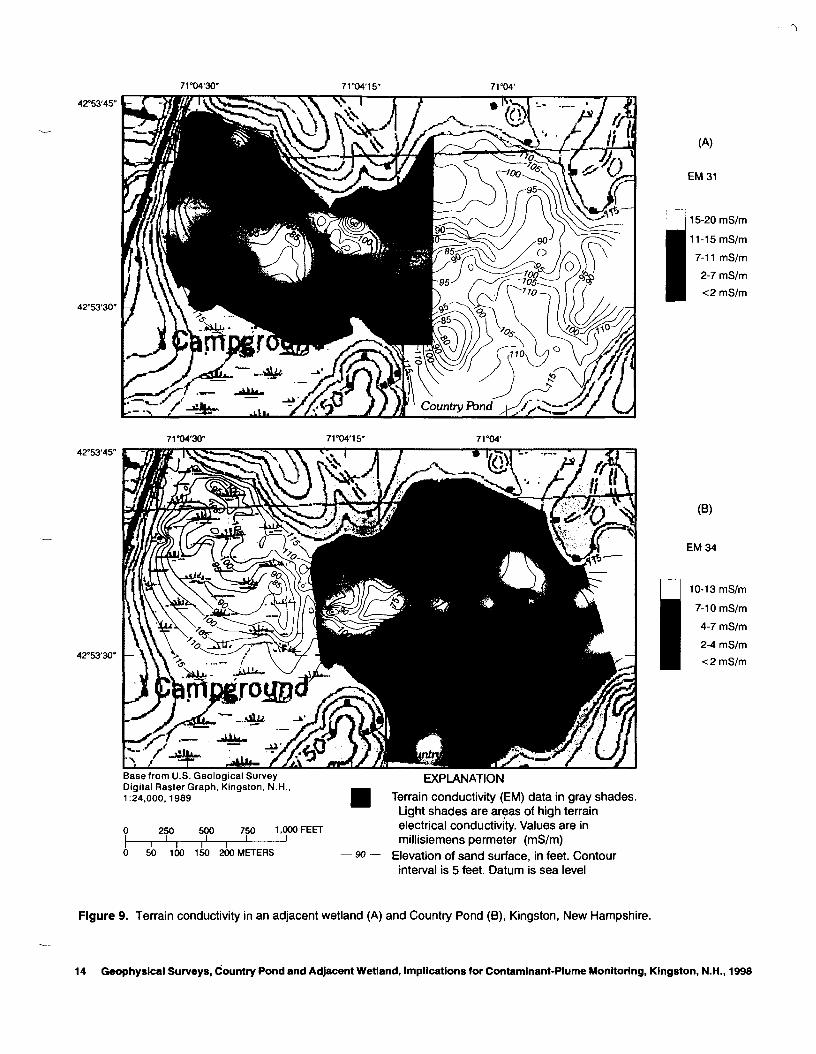
Terrain conductivity values ranged from 1 to 3 mSm over sand and gravel sediments at the shore of Country Pond in areas not influenced by the contaminant plume to 12 to 20 mSm in areas thought to be influenced by a contaminant plume Terrain-conductivity data points and values (fig 8) are shown as interpolated contour images of conductivity in figure 9 Anomalies are generally the result of changes in overburden type and thickness or changes in water quality (electrically conductive contaminant plumes) In order to distinguish between contaminant anomalies and the anomalies that are the result of changes in the geologymdashmost notably depth of water and organic material over the irregular sand surfacemdashthe sand-surface contours (from fig 6) are plotted on the terrain-conductivity image (fig 9)
Because the penetration depth of the terrain-conductivity survey (EM34) in the pond to the east is greater than that in the wetland (EM31) to the west the terrain-conductivity data and resulting conducshytivity maps are presented in separate parts on figures 8 and 9 The EM31-survey data extend into the pond several hundred feet This overlap of the EM34shysurvey data allows for a comparison of the data sets The values of conductivity from each survey were comparable at the transition from the EM31 to the EM34 survey although the overall depth intervals sensed by the instruments are different At the survey transition the range of the data from the EM-31 survey was 18 to 195 mSm and the range of the data from the EM-34 survey was 02 to 13 mSm
In some areas high terrain conductivities coincide with thick organic deposits and (or) large depressions in the sand surface (fig 7 location a fig 9a) These conductivities could be elevated because of the greater water content or porosity of
RESULTS OF GEOPHYSICAL SURVEYS 9
0
71deg0415 71deg04 71deg0345
42deg5345
42deg5330 mdash
Base from U S Geological Survey 250 500 750 1000 FEET Digital Raster Graph Kingston N H j- n r mdash - J 1 24000 1989 0 50 100 150 200 METERS
EXPLANATION
EBB Area with no organic layer present
-110- Organic-surface elevation in feet Contour interval is 2 feet Datum is sea level
Figure 5 Elevation of organic sediments in Country Pond Kingston New Hampshire
the organic sediments than that of sand sediments Organic thickness however apparently does not dominate the conductivity measurement Some areas of thick organic deposits (fig 7 location c fig 9b) did not coincide with elevated conductivities
The elevated terrain conductivity at the area of thick organic sediments in the wetland is an anomaly that coincides in part with an area of thick organic sediments (fig 7 location d fig 9a) The effective penetration of the EMS 1 survey in this area is most likely limited to the organic sediments and not the underlying glacial-outwash sediments Monitoring-
well data from the underlying highly transmissive stratified downgradient of this location did not show elevated concentrations of contaminants near location d (Mack 1995 table 4) This well data further indicates that the elevated conductivity is not likely to be from the underlying glacial aquifer It is possible that the former contaminant plume which was more than an order of magnitude more concentrated 10 years ago diffused into and (or) through the organic sediments Some electrically conductive ions remain in the organic sediments causing the apparent electrical-conductivity anomaly
10 Geophysical Surveys Country Pond and Adjacent Wetland Implications for Contaminant-Plume Monitoring Kingston NH 1998
71-0430 71deg0415 71deg04 42deg53 45
42deg53 30
Base from U S Geological Survey 250 500 750 1000 FEET Digital Raster Graph Kingston N H I J I J 1 24000 1989 r
50 100 150 200 METERS
EXPLANATION
100- Elevation of stratified drift (sand) in feet Contour interval is 5 feet Datum is sea level
Figure 6 Elevation of stratified (sand) drift in Country Pond and adjacent wetland Kingston New Hampshire
Another possible explanation is that elevated concentrations of chloride from road de-icmg could be moving with ground water through the wetland to the pond and diffusing into the organic sediments The organic sediments in this area have a high porosity yet low transmissivity (Stekl 1994) If road salt however was the cause of this anomaly (fig 7 location d) this source of conductivity is present each winter and a large area of the wetland would more likely show high conductivities
Two other areas show elevated conductivities where the glacial outwash aquifer is close to the surface and therefore distinctly not correlated with Abater-column or organic-layer thickness One area
was near North Brook along the northern edge of the wetland where terrain conductivities greater than 12 mSm were measured with the EM31 The other area was at the wetland and pond boundary These anomalies are somewhat continuous yet fade in a northwesterly direction along the likely flowpath from the former contaminant source (fig 1) The downgradient area coincides with the locations of the plume determined from monitoring wells in the aquifer beneath the pond (Mack 1995 fig 7) and could represent an electrically conductive component or remnant of a contaminant plume
Areas where the low-transmissivity organic sediments are not present in the pond (fig 7) are of
RESULTS OF GEOPHYSICAL SURVEYS 11
71deg0430 71deg0415
42deg5345
42deg5330
Base from US Geological Survey 250 500 750 1000 FEET
Digital Raster Graph Kingston NH J IL J 124000 1989 I I I
50 100 150 200 METERS
EXPLANATION
IE3 Area with no organic layer present
mdash 10mdash Thickness of organic layer in feet Contour interval is 5 feet Datum is sea level
copy Location referred to in text
Figure 7 Thickness of organic sediments in Country Pond and adjacent wetland Kingston New Hampshire
concern because of the potential for increased ground- The length and depth of the screened zones of these water discharge to the pond in these areas Terrain monitoring wells installed in the early 1980s are not conductivities in these areas however were generally accurately known Monitoring wells (piezometers) at background levels indicating that conductive described by Mack (1995) are present beneath the contaminants were not discharging in these areas or pond near the wetland These monitoring wells are were below detectable concentrations at the time of accessed by sample tubing extended from 100 to this survey 200 ft into the pond to the shoreline The sub-pond
wells are suitable ground-water-sample points but Monitoring-Well Network highly vulnerable to damage Some of these wells
have been lost or destroyed and at the conclusion of Several monitoring wells present in the wetland this study only 5 of the 10 sub-pond network wells
are near the apparent contaminant-plume centerline were still usable
12 Geophysical Surveys Country Pond and Adjacent Wetland Implications for Contaminant-Plume Monitoring Kingston NH 1998
(A) 71deg0430 71deg0415 71deg04
42deg5345
97 61 72 78 767i
789 69 11 11 34
10 8144
_ 95_1deg 115 12 14 12 88 Country fbnd
42deg5330
(B) 71deg0415 71deg04 71deg0345
42deg5345
02 04 22 26
92 70 80 72 88 5130 5860
130 80 66 100 66
30 48 86 75 46 S6 96 60 64 91 82
42deg5330 44 72 80 70 22
25 54 32 38
Country Pond
Base from US Geological Survey 112000 digital orthophoto quadrangle EXPLANATION Kingston NH 1968
EM data point and value in 0 250 500 750 1000 FEET I I I I millisiemens per meter (mSm)
50 100 150 200 METERS
Figure 8 EM31 (A) and EM34 (B) terrain-conductivity data-collection locations and associshyated values in millisiemens per meter (jlSm) in Country Pond and adjacent wetland Kingston New Hampshire
RESULTS OF GEOPHYSICAL SURVEYS 13
71deg0430 71deg0415 71deg04
42deg5345
(A)
EM 31
|l5-20mSm
|l1-15mSm
7-11 mSm
2-7 mSm
lt2 mSm 42deg5330
71deg0430 71deg0415 71deg04 42deg5345
(B)
EM 34
10-13mSm
7-10 mSm
4-7 mSm
2-4 mSm 42deg5330- shy
lt2 mSm
Base from US Geological Survey EXPLANATION Digital Raster Graph Kingston NH 1 240001989 Terrain conductivity (EM) data in gray shades
Light shades are areas of high terrain electrical conductivity Values are in 250 500 750 1000 FEET
T _J I millisiemens permeter (mSm) -H-r
0 50 100 150 200 METERS mdash 90 Elevation of sand surface in feet Contour interval is 5 feet Datum is sea level
Figure 9 Terrain conductivity in an adjacent wetland (A) and Country Pond (B) Kingston New Hampshire
14 Geophysical Surveys Country Pond and Adjacent Wetland Implications for Contaminant-Plume Monitoring Kingston NH 1998
The wetland is a topographic low which generally receives ground water from surrounding upland areas Discharge from the wetland is naturally channeled towards the pond in the direction of North and South Brook (fig 1) The conductivity surveys from this study and previous water-quality sampling indicate that a contaminant plume is concentrated along the northern part of the wetland adjacent to and along North Brook Existing monitoring wells are located approximately in the center of this plume and probably in or at the base of the glacial aquifer Screen lengths of existing monitoring wells in the wetland are not known and could be too long or in the wrong vertical locations to effectively monitor the concentrations of the contaminant plume The current monitoring wells provide limited longitudinal and no transverse coverage of the plume and do not provide information on vertical stratification of the plume The construction of monitoring wells towards the leading edge of the plume and beneath the pond are short screened and well documented (Mack 1995) but do not assess the leading edge of the plume beneath the pond Maintaining monitoring wells in the pond to address the leading edge of the plume however would not be feasible as the wells are in an area of considerable boat traffic
A well network to effectively monitor the concentration of contaminants in this plume could be constructed by establishing sampling points that bisect the axis of the plume at multiple depths This network would create a vertical plane of sampling points at a point where most of the ground-water fluxes would occur from the wetland to the pond through the underlying outwash aquifer Such a network would provide measurements of the direction and vertical gradient of ground-water flow at the wetland and pond interface and would permit sampling of the contaminant plume and uncontaminated background water If located immediately shoreward of the wetland-pond boundary the wells could be protected and maintained for a long period of time Such a network sampled at regular intervals with consistent methods would allow for monitoring of the concentration of the plume or evaluating the natural attenuation of contaminants (US Environmental Protection Agency 1998)
SUMMARY AND CONCLUSIONS
Contaminants from a former hazardous-waste site are moving downgradient though a wetland and beneath Country Pond at Kingston New Hampshire Geophysical profiles and data provide information about the various lithologies and the position of the electrically conductive part of this contaminant plume Contour maps of the elevations of surfaces of various lithologies indicate that the sand surface beneath the relatively flat organic sediment surface is highly irregular Terrain-conductivity data identify several anomalies most of which are related to the thickness of the water column and organic sediments overlying the sand One notable exception however is an elongated anomaly along the northwestern part of the wetland and into the pond where the anomaly is not related to deep depths of sand This anomaly is probably indicative of a contaminant plume moving through the sand unit beneath the wetland and pond Existing test-boring data confirm the interpretation of the geophysical surveys
SELECTED REFERENCES
Arthur D Little Inc 1991 Ground water remedial design Final report Volume 1 Ottati and Goss Site Kingston New Hampshire Cambridge Mass ADL Reference 6236348 p
Beres Milan Jr and Haeni PP 1991 Application of ground-penetrating-radar methods in hydrogeologic studies Ground Water v 29 no 3 p 375-386
Cotton IE 1977 Availability of ground water in the Piscataquog and other Coastal River basins southeastern New Hampshire US Geological Survey Water-Resources Investigations Report WRI77-70 scale 1125000 1 sheet
Ecology and Environment Inc 1982 Field investigations of uncontrolled hazardous waste sites FIT Project hydrogeologic investigation Kingston New Hampshire US Environmental Protection Agency Task Report contract no 68-01-6056
Goldberg-Zoino and Associates 1986 Remedial investigashytion of the Ottati and GossGreat Lakes Container Corporation site Kingston New Hampshire Concord NH New Hampshire Department of Environmental Services Water Supply and Pollution Control Division 229 p
SUMMARY AND CONCLUSIONS 15
Geophysical Survey Systems Inc 1994 SIR System-2 Operation Manual- Hudson N H Geophysical Survey Systems Inc 20 p
Haeni PP 1992 Use of ground-penetrating radar and continuous seismic-reflection profiling on surface-water bodies in environmental and engineering studies in Bell R S (ed) Symposium on the application of geophysics to engineering and environmental problems Oak Brook Illinois April 26-29 1992 proceedings Golden Colo Society of Engineering and Mineral Exploration Geophysicists p 145-162
Haem FP McKeegan OK and Capron D R 1987 Ground-penetrating radar study of the thickness and extent of sediments beneath Silver Lake Berlin and Meriden Connecticut US Geological Survey Water-Resources Investigations Report 85-4108 19 p
Koteff Carl and Moore RB 1994 Surficial geologic map of the Kingston Quadrangle Rockingham County New Hampshire US Geological Survey Geologic Quadrangle Map GQ-1740 scale 124000
Liebhch DA Haem FP and Lane JW Jr 1992 Integrated use of surface-geophysical methods to indicate subsurface fractures at Milford New
Hampshire U S Geological Survey Water-Resources Investigations Report 92-4506 38 p
Mack TJ 1995 Design of monitoring wells hydrogeshyology and ground-water quality beneath Country Pond Kingston New Hampshire US Geological Survey Open-File Report 95-465 16 p
Stekl PJ 1994 Data on observation wells ground-water levels and ground-water quality for stratified-dnft aquifer in the northwestern basin of Country Pond Kingston New Hampshire US Geological Survey Open-File Report 93-658 18 p
Stekl P J and Flanagan SM 1992 Geohydrology and water quality of stratified-dnft aquifers in the Lower Merrimack and coastal River Basins southeastern New Hampshire- US Geological Survey Water-Resources Investigations Report 91-4025 75 p
Ulnksen CP 1980 Investigation of peat thickness with radar Proceedings of the 6th International Peat Congress p 126-129
U S Environmental Protection Agency 1998 Monitored natural attenuation for ground water Washington DC Office of Research and Development September 1998EPA625K-98001
16 Geophysical Surveys Country Pond and Adjacent Wetland Implications for Contaminant-Plume Monitoring Kingston NH 1998
barcode 3413
barcodetext SDMS Doc ID 3413
Map on cover shows location of ground-penetrating radar (GPR) profile lines (red lines) probes (black boxes with white circles) and wells (red circles are consultant monitoring wells and black squares are sites of U S Geological Survey monitoring wells) Base map is from US Geological Survey 124000 (1 inch on the map represents about a half-mile on the ground) Digital raster graph image Kingston N H 1989 Topographic contour interval is 10 feet
US Department of the Interior US Geological Survey
US ENVIRONMENTAL PROTECTION AGENCY REGION 1
Geophysical Surveys of Country Pond and Adjacent Wetland and Implications for Contaminant-Plume Monitoring Kingston New Hampshire 1998
By Joseph D Ayotte Thomas J Mack and Craig M Johnston
Open-File Report 99-51
Pembroke New Hampshire 1999
US DEPARTMENT OF THE INTERIOR BRUCE BABBITT Secretary
US GEOLOGICAL SURVEY
Charles G Groat Director
The use of firm trade and brand names in this report is for identification purposes only and does not constitute endorsement by the US Geological Survey
For additional information write to Copies of this report can be purchased from
District Chief US Geological Survey US Geological Survey Information Services New HampshireVermont District Box 25286 Federal Center 361 Commerce Way Denver CO 80225 Pembroke NH 03275-3718
or through our website at httpnhwaterusgsgov
CONTENTS
Abstract 1
Introduction 1
Purpose and Scope 1
Description of Study Area and Geohydrologic Setting 3
Previous Investigations 3
Acknowledgments 3
Geophysical Survey Methods 3
Ground-Penetrating Radar 4
Terrain Conductivity 5
Results of Geophysical Surveys 6
Ground-Penetrating Radar 6
Terrain Conductivity 9
Monitoring-Well Network 12
Summary and Conclusions 15
Selected References 15
FIGURES
1-2 Maps showing
1 Location of the study area Country Pond Kingston New Hampshire 2
2 Location of ground-penetrating radar (GPR) profile lines probes and wells 4
3 Processed ground-penetrating-radar profiles 3a-3a and 3b-3b 7
5 Elevation of organic sediments in Country Pond 10
6 Elevation of stratified drift (sand) in Country Pond and adjacent wetland 11
7 Thickness of organic sediments in Country Pond and adjacent wetland 12
8 Digital orthophoto showing EM31 (A) and EM34 (B) terrain-conductivity data-collection locations and associated values in Country Pond and adjacent wetland 13
9 Map showing terrain conductivity in an adjacent wetland (A) and Country Pond (B) 14
TABLES
1 Approximate ground-penetrating radar velocity for selected materials 5
2 Computed ground-penetrating-radar propagation velocities for organic soils near selected wells or borings in Country Pond Kingston New Hampshire 6
Contents HI
CONVERSION FACTORS VERTICAL DATUM AND ABBREVIATIONS
Multiply By To obtain
acre 04047 hectometer
foot (ft) 03048 meter
mile (mi) 1609 kilometer
meter (m) 3281 foot
Temperature in degrees Fahrenheit (degF) can be converted to degrees Celsius (degC) as follows degC = 59 (degF - 32)
Sea Level In this report sea level refers to the National Geodetic Vertical Datum of 1929 (NGVD of 1929)mdasha geodetic datum derived from a general adjustment of the first-order level nets of both the United States and Canada formerly called Sea Level Datum of 1929
ABBREVIATIONS OF WATER QUALITY AND GEOPHYSICAL UNITS USED IN THIS REPORT
dBm decibels per meter
ftns foot per nanosecond
MHz megahertz
mns meter per nanosecond
mSm millisiemens per meter
m|4s meters per microsecond
ns nanoseconds
[iscm microsiemens per centimeter at 25deg Celsius
IV Contents
Geophysical Surveys of Country Pond and Adjacent Wetland and Implications for Contaminant-Plume Monitoring Kingston New Hampshire 1998 By Joseph D Ayotte Thomas J Mack and Craig M Johnston
Abstract
Contaminants from a hazardous-waste site have moved downgradient though a wetland and beneath Country Pond in Kingston New Hampshire This pond is a recreational resource for the area and is bordered by homes and seasonal camps that use onsite wells for water supply Geophysical profiles ground-penetrating radar and electromagnetic-terrain-conductivity surveys provide information about the various lithologies and the position of the contaminant plume Contour maps of the elevations of surfaces of various lithologies indicate that the sand surface beneath the relatively flat organic sediment surface is irregular Terrain-conductivity data identify several anomalies most of which are related to the thickness of the water column and organic sediments overlying the sand One notable exception however is a large anomaly (high terrain conductivity) along the northwestern part of the wetland and pond area which probably represents a contaminant plume moving through the sand unit beneath the wetland and pond Existing test-boring data were used to confirm the results of the geophysical surveys The existing monitoring-well network does not adequately intersect the contaminant plume or provide a means to monitor plume concentration
INTRODUCTION
Country Pond a 280-acre pond is a recreational resource for the Kingston area and is bordered by homes and seasonal camps that use onsite wells for water supply The extent and migration of groundshywater contamination towards the pond which is immediately downgradient (east) of a hazardous-waste US Environmental Protection Agency (USEPA) Superfund site (fig 1) is a concern for local residents and those using the pond for recreational activities The US Geological Survey (USGS) in cooperation with the USEPA Waste Management Division Region I mapped subsurface sediments in the wetlands that drain to Country Pond by use of geophysical methods to determine the location of a contaminant plume and evaluate a monitoring-well network
Purpose and Scope
This report describes the results of geophysical investigations of glacial and post-glacial deposits near a former container manufacturing site The area investigated includes parts of a wetland area to the east of the former site and parts of Country Pond adjacent to the marsh Included in the report are geophysical profiles that provide information about the various lithologies and contour maps of the elevation of surfaces of various lithologic units and the thickness of an organic material layer and terrain conductivity Test-boring data were used to confirm the results of the geophysical surveys The existing monitoring-well network was evaluated in relation to the results of this study The investigation was limited to the wetland and pond east of the former container manufacturers waste-disposal site (fig 1)
Abstract
71deg05
42deg5345
42deg5245
Base from US Geological Survey Digital raster graph image Kingston NH 124000 1989
1000-meter Universal Transverse Mercator grid zone 19
O 1OOO 2OOO 3OOOI I I
I I I I I O 2OO 4OO 600 800 1 OOO
CONTOUR INTERVAL 10 FEET
EXPLANATION
71 031
Luucuiun ui lormer ^ contaminant source
^pound
4OOO I
FEET
CANADA
r45mdash f I
T )
METERS
NEW
HAMPSHIRE
43-mdash-^ Kingston shy
O Approximate location of former contaminant source
Area extent of subsequent illustrations
Figure 1 Location of the study area Country Pond Kingston New Hampshire
Geophysical Surveys Country Pond and Adjacent Wetland Implications for Contaminant-Plume
MASSACHUSETTS
0 20 40 MILES
- - - mdash - r shy
0 40 KILOMETERS
Monitoring Kingston NH 1998 2
Description of Study Area and Geohydrologic Setting
The study area includes the northwestern part of Country Pond including the surrounding shoreline and wetland to the east (fig 1) Country Pond is a glacial kettle lake in an extensive outwash plain (Stekl and Flanagan 1992) Outwash deposits and ice-contact deposits are exposed on the northwest shore of the pond The wetland is composed of fibrous organic matter whereas much of the pond bottom is covered by very-fine grained loose organic sediment
North Brook (fig 1) flows along the north side of the waste site and drains the wetland adjacent to the pond Another unnamed brook flows along the south side of the wetland to the pond Country Pond is drained by Powwow River northeast of the pond The water level of Country Pond is controlled by a dam on Powwow River and ranges from 114 to 117 ft above sea level (Goldberg-Zoino and Associates 1986) The water level of the pond is maintained at about 116 ft throughout spring and summer and is lowered about 2 ft during late fall and winter In the study area pond depths are generally less than 5 ft within 100 ft of the shoreline and up to 14 ft deep farther from the shoreline
Previous Investigations
A regional investigation of ground-water resources was done by Stekl and Flanagan (1992) Koteff and Moore (1994) mapped the surficial geology of the Kingston 75-minute quadrangle which includes the entire study area
Locally investigations by Goldberg-Zoino and Associates (1986) Ecology and Environment Inc (1982) and Arthur D Little Inc (1991) were concerned with the nature and extent of contamination associated with the waste site and in the wetland southeast of the waste site A previous study by the USGS (Stekl 1994) in cooperation with the USEPA and the New Hampshire Department of Environmental Services (NHDES) focused on concentrations of volatile organic compounds (VOCs) in the ground water in the stratified-drift aquifer (glacial deltaic sand) beneath the pond During a study by (Mack 1995) 10 monitoring wells were installed beneath Country Pond and were used to measure pond-bottom sediment thicknesses stratified-drift thicknesses and ground-water quality at selected locations
Acknowledgments
Information for this study was provided by the New Hampshire Department of Environmental Services and the US Environmental Protection Agency The authors wish to thank the many property owners for their cooperation in granting US Geological Survey personnel access to their property to perform geophysical surveys
GEOPHYSICAL SURVEY METHODS
Ground-penetrating radar (GPR) and electromagnetic terrain conductivity were used in conjunction to investigate the geohydrology of the glacial deposits and the probable location and extent of ground-water contamination in the study area GPR data were collected to provide continuous profiles of the organic material surface and the underlying sand surface at the survey locations shown on figure 2 GPR provides detailed profiles of the stratigraphy of the subsurface deposits Depths to reflectors and types of lithologies were verified by comparing depths to reflectors with depths to lithologic units inferred from well and test-boring logs Terrain-conductivity measurements were collected at grid-point intersections in the wetland and at selected locations on the pond Terrain-conductivity data were compared to GPR data to differentiate between the conductivity effects of geologic materials and high-conductivity ground water associated with a contamishynant plume
Most of the grid used in this study was surveyed for another investigation (Lynne Klosterman Arthur D Little Inc written commun 1997) the southern part of the grid was created for this study Data-collection sites on the pond and areas off the grid were located using a Global Positioning System (GPS) with an accuracy of about 30 ft Depths to organic deposits and underlying glacial sands were delineated at 100-ft intervals on the GPR profiles and point values were entered into Geographic Information Systems (GIS) coverages (Original data and GIS coverages are maintained at the USGS District office in Pembroke NH)
GEOPHYSICAL SURVEY METHODS 3
71deg0430 71deg04 15 71-04 71-0345
42deg5345 mdash
42deg53 30
Base from US Geological Survey 500 1000 1 500 2000 FEET Digital raster graph image Kingston N H Ishy1 24000 1989 0 100 200 300 400 METERS
EXPLANATION
3a 3a | | GPR survey line-Cross bar and label indicates profile location
D Probe data
bull Consultant monitoring wells
bull US Geological Survey monitoring wells
Figure 2 Location of ground-penetrating radar (GPR) profile lines probes and wells
Ground-Penetrating Radar
GPR surveys were conducted according to methods described by Beres and Haeni (1991) Haeni (1992) and Haeni and others (1987) The GPR-survey system transmits radio-frequency electromagnetic pulses into the ground and receives energy reflected back from subsurface reflectors Reflectors can be any subsurface contact between geologic materials with different physical and electrical properties such as the interface between lithologic units or layers within a unit The surveys were conducted with bi-static 100 MHz center-frequency transmitting and receiving antennas that ere towed over frozen wetland and pond surfaces
The profiles can be examined visually to provide indications of lithologic properties Interpretation of GPR profiles are improved by comparisons with lithologic logs
Beres and Haeni (1991) provide an interpretation guide for various types of typical reflector patterns for unconsohdated deposits Parallel reflectors indicate the presence of laminated fine-grained sediments such as pond-bottom sediments observed in this study Complex subparallel and chaotic reflectors generally indicate coarse-grained sediments Inverted V-shaped reflectors are indicative of point reflectors that can be from cobbles or boulders in till
Geophysical Surveys Country Pond and Adjacent Wetland Implications for Contaminant-Plume Monitoring Kingston NH 1998
Transmission velocities of the radar signal were used to interpret depth to a reflector Approximate values of radar-transmission velocities (Beres and Haeni 1991 Geophysical Survey Systems Inc 1994) used for interpretation are summarized in table 1
GPR data were processed to enhance reflector patterns and (or) to filter out noise in the data Digital filtering distance normalization deconvolution and amplification were used to process the data These processes as performed using commercial computer software are described in manual MN43-116 for RADAN for Windows (Geophysical Survey Systems Inc 1994) The radar data were not migrated to correct the position of steeply dipping layers this could lead to slight differences in the true position of a reflector for steeply dipping sections Differences of this nature are likely to be rare because of the horizontal nature of the layers profiled
Generally ice thickness at the site was less than 1 ft and thus was ignored in determining depths to subsurface reflectors Interpretation of GPR profiles which includes water organic materials and saturated sediment requires the use of multiple-depth scales For any radar frequency the primary factor limiting depth of penetration is the electrical conductivity of the subsurface materials (Beres and Haeni 1991) however high frequencies are attenuated faster than low frequencies Electrically conductive materials such as clay minerals or possibly a conductive contaminant plume limit radar-signal penetration
Terrain Conductivity
A Geonics EM31 and a EM34 were used to measure terrain conductivity at grid points in the wetland and in selected sites on the pond These instruments measure the apparent electrical conductivity of the earth materials and pore water in millisiemens per meter The apparent terrain conductivity includes the electromagnetic effects of both the sediments and associated pore water Data were collected with the EM31 at the ground surface in the wetland at 100-ft intervals for an effective exploration depth of about 20 ft On the pond terrain-conductivity data were collected using an EM34 with a 10-m intercoil spacing and vertical dipole mode to provide a total effective penetration depth of about 50 ft In the pond the water depth and the thickness of sediments required greater survey penetration than could be provided by the EM31 The EM34 could not be used in most of the wetland area because of the dense vegetation
Table 1 Approximate ground-penetrating radar velocity for selected materials
Material Approximate velocity
in feet per nanosecond
Ice 025
Water 11
Organic soils 13
Peats 13
Saturated sands 20
Terrain-conductivity data must be interpreted in conjunction with other data so that the variability of the geology can be differentiated from variations in the conductance of the ground water Maps of the depth to sand thickness of organic materials and the contaminant-plume area previously identified beneath the pond (Mack 1995) provide the information necessary to interpret the terrain-conductivity data and further delineate and refine the location of the contaminant plume The nature of the glacial sediments primarily sand and gravel show negligible variation at the site and therefore do not affect the terrain conductivity The extent of glacial till in the study area is not known but is not believed to be extensive and is presumed to have almost no effect on terrain conductivity
The terrain conductivity at this site or the combined effect of all materials identified in the survey depth of the meter is determined by variations in the depth of the water column in the pond the thickness of stratigraphic units and the quality of ground water Ground water associated with the contaminant plume beneath the pond was found to have a high specific conductance up to 950 (JScm whereas uncontaminated ground water outside the plume area had a much lower specific conductance of 71 jxScm (Mack 1995) Uncontaminated sand and gravel aquifer materials typical of the study area have low terrain conductivities The terrain-conductivity values of the wetland sediments were relatively low (less than 4 mSm) in areas known to be uncontaminated and at a nearby wetland Observations of the GPR profiles indicate that the electromagnetic-radar wave penetrate these sediments with little attenuation
GEOPHYSICAL SURVEY METHODS 5
RESULTS OF GEOPHYSICAL SURVEYS
The results of the geophysical surveys presented in this section include selected GPR profiles maps of the thickness of the organic layer elevation of the sand surface and a contoured terrain-conductivity data
Ground-Penetrating Radar
GPR data were collected over a total distance of more than 2 mi within the study area The data-collection areas and the locations of selected profiles are shown in figure 2 Radar-signal-penetration depths were limited to about 500 to 600 ns throughout the study area The water table was equivalent to land surface in wetland and pond areas surveyed The surveys done on the pond were done on ice that was generally less than 05 ft thick with little to no snow cover
Lithologic information obtained from drilling logs (Mack 1995 Stekl 1994) and from probes pushed into the wetland (Goldberg-Zoino and Associates 1986) was used to help interpret GPR profiles Electromagnetic reflectors could be present for example at a water-columnmdashorganic-material interface at an organic materialmdashsand interface at a coarse to fine-grained interface or at a bedrock surface All of these reflectors might be represented as a dark continuous band on the GPR profile however a thin electrically conductive layer such as a clay lens also might be represented by a dark band
Differences between known thicknesses of organic materials at a point (Mack 1995 Stekl 1994) and time of travel of radar energy in the same materials near the same point are summarized in table 2 The average velocity of radar energy computed from this data compares well with approximate velocities for organic materials and peats (wetland materials) in table 1 Ulriksen (1980) reports an average velocity for radar energy in peat as 0131 ftns (004 mns) Individual values are variable and are probably the result of variability in the accuracy of the locations of the well and GPR data
Table 2 Computed ground-penetrating-radar propagation velocities for organic soils near selected wells or borings in Country Pond Kingston New Hampshire [GPR ground-penetrating radar]
Thickness Two-way travel GPR propagation Well or of organic time in nano- velocity in feet per
boring material seconds nanosecond in feet
AB1-93 2 45 0089 2GZ-6 5 140 071
2A3-91 5 110 091 2A3-88 32 275 233
B2-93 15 169 178
B3-93 29 486 119 lC2-93 10 187 107
Average 127
Well location in Mack (1995 table 1 fig 3) 2Well location m Stekl (1994 fig 2)
Two distinct reflector signatures are evident on the profiles The first signature type is a thin continuous and primarily horizontal line pattern that represents soft organic deposits beneath the pond and in the wetland area (figs 3 and 4) The second signature type is a strong two- to three-band reflector that is generally found beneath the first reflector except where the organic layer is absent This reflector represents the hard sand surface The profiles illustrate the two types of reflectors commonly found in the study area These profiles and associated reflectors are described in the following paragraphs Test-boring data were used where available to aid in interpreting the data some uncertainty however is always inherent in visual interpretations of GPR data
Profile 3a-3a was surveyed at the pond ice surface (fig 3) The upper surface of the record shows multiple reflections from the ice surface and a lack of reflections within the water column A strong flat-lying continuous reflector is present in the upper third of the record with mostly parallel relatively unattentuated reflectors below This represents loose organic deposits at the pond bottom above the irregular sand surface The irregular sloping strong reflector below the organic deposits indicates the top of the sand surface Most GPR signals were attenuated by this reflector surface In only a few profiles reflectors deeper than the top of the sand surface are found indicating the sand stratigraphy Till or bedrock surfaces were not apparent in any of the GPR profiles collected
Geophysical Surveys Country Pond and Adjacent Wetland Implications for Contaminant-Plume Monitoring Kingston NH 1998 6
250 bullo10
tL LU
LL
o LU CO O
500
750
1000 100
25 50 75
joo FEETMETERS
APPROXIMATE VERTICAL EXAGGERATION X 7
-20
-30 or LU
o
oc o
LU S I-_l LU
DC
I
3b 0
200
Frozen swamp surface 3b 0
-10
LU Q_ LL O
8 LU Z
o
400
L-30
600
800 APPROXIMATE VERTICAL EXAGGERATION X 3
100 200 FEET
25 50 METERS
EXPLANATION
Approximate top of organic layer
Approximate top of stratified drift (sand)
Figure 3 Processed ground-penetrating-radar profiles 3a-3a and 3b-3b Kingston New Hampshire
RESULTS OF GEOPHYSICAL SURVEYS 7
200
400 c3Q Z o LU o 600 LU CO O
LU
LU
CCIshy
I
800 100 200 300 FEET APPROXIMATE VERTICAL EXAGGERATION X 8
25 SO 75 METERS
EXPLANATION
Approximate top of organic layer - - Approximate top of stratified drift (sand)
Figure 4 Processed ground-penetrating-radar profiles 4a-4a 4b-4b and 4c-4c Kingston New Hampshire
Geophysical Surveys Country Pond and Adjacent Wetland Implications for Contaminant-Plume Monitoring Kingston NH 1998 8
Profile 3b-3b was collected on the wetland adjacent to the pond (fig 3) In the wetland the organic surface and the water table are at the land surface The strong reflector located one third of the distance below the top of the record represents the sand surface Similar to sand-surface reflections beneath the pond this layer attenuated most of the GPR signal and prevented detection of deeper reflectors The sand-surface reflector is prominent and continuous on the left side of the record but is absent on the right side of the record A sequence of parallel pond profiles (4a-4a 4b-4b and 4c-4c fig 2 and fig 4) in succession from the edge of the wetland out into the pond shows a continuous buried sand ridge that extends from the southern part of the wetland out into the pond It also shows the thick organic sediments that have accumulated between the northern shore of the pond and the buried sand ridge (fig 4)
Figure 5 shows a map of the organic layer surface (pond bottom) generated from GPR data in the pond and from GPR and previously collected probe data in the wetland In general the organic-layer surface slopes uniformly from the shore to the center of the northwestern arm of the pond and is deepest near the center of the northwestern arm The organic surface is absent in a few small locations in the area surveyed The greatest depth to the organic surface is approximately 12 ft below the pond surface
A contour map of the sand surface also was generated from GPR and probe data This surface is characterized by irregular topography consisting of depressions and ridges (fig 6) Organic sediments fill the depressions Two continuous sand ridges are present in the study area beneath the pond (fig 6) One is along the boundary between the wetland and the pond and the second protrudes out into the pond from the south end of the wetland Two smaller ridges between depressions are present at the west end of the swamp near the road
The thickness of the organic layer (fig 7) was determined by taking the difference of the top of the organic layer (fig 5) (including the wetland surface) and the surface of the underlying sand surface (fig 6) Organic-layer thicknesses of 30 to 35 ft are evident in the study area An isolated 35 ft thick organic-filled depression (fig 7 location a) is located at the mouth of North Brook (fig 1) beneath Country Pond A more extensive 20 to 30 ft thick organic filled area (fig 7 location b) extends from the edge of the center of the wetland out beneath Country Pond Another
broad area of thick organic sediments beneath the pond is in the south part of the study area (fig 7 location c) A broad area of thick organic sediments beneath the wetland is at the center of the wetland 250 to 750 ft from the shoreline (fig 7 location d) The organic layer is relatively thin (10 ft) at the wetland shore line (fig 7 location e) and not present at some areas along the northern shore of Country Pond and to the south of the study area associated with a large unnamed island (figs 1 and 7)
Terrain Conductivity
Terrain conductivity values ranged from 1 to 3 mSm over sand and gravel sediments at the shore of Country Pond in areas not influenced by the contaminant plume to 12 to 20 mSm in areas thought to be influenced by a contaminant plume Terrain-conductivity data points and values (fig 8) are shown as interpolated contour images of conductivity in figure 9 Anomalies are generally the result of changes in overburden type and thickness or changes in water quality (electrically conductive contaminant plumes) In order to distinguish between contaminant anomalies and the anomalies that are the result of changes in the geologymdashmost notably depth of water and organic material over the irregular sand surfacemdashthe sand-surface contours (from fig 6) are plotted on the terrain-conductivity image (fig 9)
Because the penetration depth of the terrain-conductivity survey (EM34) in the pond to the east is greater than that in the wetland (EM31) to the west the terrain-conductivity data and resulting conducshytivity maps are presented in separate parts on figures 8 and 9 The EM31-survey data extend into the pond several hundred feet This overlap of the EM34shysurvey data allows for a comparison of the data sets The values of conductivity from each survey were comparable at the transition from the EM31 to the EM34 survey although the overall depth intervals sensed by the instruments are different At the survey transition the range of the data from the EM-31 survey was 18 to 195 mSm and the range of the data from the EM-34 survey was 02 to 13 mSm
In some areas high terrain conductivities coincide with thick organic deposits and (or) large depressions in the sand surface (fig 7 location a fig 9a) These conductivities could be elevated because of the greater water content or porosity of
RESULTS OF GEOPHYSICAL SURVEYS 9
0
71deg0415 71deg04 71deg0345
42deg5345
42deg5330 mdash
Base from U S Geological Survey 250 500 750 1000 FEET Digital Raster Graph Kingston N H j- n r mdash - J 1 24000 1989 0 50 100 150 200 METERS
EXPLANATION
EBB Area with no organic layer present
-110- Organic-surface elevation in feet Contour interval is 2 feet Datum is sea level
Figure 5 Elevation of organic sediments in Country Pond Kingston New Hampshire
the organic sediments than that of sand sediments Organic thickness however apparently does not dominate the conductivity measurement Some areas of thick organic deposits (fig 7 location c fig 9b) did not coincide with elevated conductivities
The elevated terrain conductivity at the area of thick organic sediments in the wetland is an anomaly that coincides in part with an area of thick organic sediments (fig 7 location d fig 9a) The effective penetration of the EMS 1 survey in this area is most likely limited to the organic sediments and not the underlying glacial-outwash sediments Monitoring-
well data from the underlying highly transmissive stratified downgradient of this location did not show elevated concentrations of contaminants near location d (Mack 1995 table 4) This well data further indicates that the elevated conductivity is not likely to be from the underlying glacial aquifer It is possible that the former contaminant plume which was more than an order of magnitude more concentrated 10 years ago diffused into and (or) through the organic sediments Some electrically conductive ions remain in the organic sediments causing the apparent electrical-conductivity anomaly
10 Geophysical Surveys Country Pond and Adjacent Wetland Implications for Contaminant-Plume Monitoring Kingston NH 1998
71-0430 71deg0415 71deg04 42deg53 45
42deg53 30
Base from U S Geological Survey 250 500 750 1000 FEET Digital Raster Graph Kingston N H I J I J 1 24000 1989 r
50 100 150 200 METERS
EXPLANATION
100- Elevation of stratified drift (sand) in feet Contour interval is 5 feet Datum is sea level
Figure 6 Elevation of stratified (sand) drift in Country Pond and adjacent wetland Kingston New Hampshire
Another possible explanation is that elevated concentrations of chloride from road de-icmg could be moving with ground water through the wetland to the pond and diffusing into the organic sediments The organic sediments in this area have a high porosity yet low transmissivity (Stekl 1994) If road salt however was the cause of this anomaly (fig 7 location d) this source of conductivity is present each winter and a large area of the wetland would more likely show high conductivities
Two other areas show elevated conductivities where the glacial outwash aquifer is close to the surface and therefore distinctly not correlated with Abater-column or organic-layer thickness One area
was near North Brook along the northern edge of the wetland where terrain conductivities greater than 12 mSm were measured with the EM31 The other area was at the wetland and pond boundary These anomalies are somewhat continuous yet fade in a northwesterly direction along the likely flowpath from the former contaminant source (fig 1) The downgradient area coincides with the locations of the plume determined from monitoring wells in the aquifer beneath the pond (Mack 1995 fig 7) and could represent an electrically conductive component or remnant of a contaminant plume
Areas where the low-transmissivity organic sediments are not present in the pond (fig 7) are of
RESULTS OF GEOPHYSICAL SURVEYS 11
71deg0430 71deg0415
42deg5345
42deg5330
Base from US Geological Survey 250 500 750 1000 FEET
Digital Raster Graph Kingston NH J IL J 124000 1989 I I I
50 100 150 200 METERS
EXPLANATION
IE3 Area with no organic layer present
mdash 10mdash Thickness of organic layer in feet Contour interval is 5 feet Datum is sea level
copy Location referred to in text
Figure 7 Thickness of organic sediments in Country Pond and adjacent wetland Kingston New Hampshire
concern because of the potential for increased ground- The length and depth of the screened zones of these water discharge to the pond in these areas Terrain monitoring wells installed in the early 1980s are not conductivities in these areas however were generally accurately known Monitoring wells (piezometers) at background levels indicating that conductive described by Mack (1995) are present beneath the contaminants were not discharging in these areas or pond near the wetland These monitoring wells are were below detectable concentrations at the time of accessed by sample tubing extended from 100 to this survey 200 ft into the pond to the shoreline The sub-pond
wells are suitable ground-water-sample points but Monitoring-Well Network highly vulnerable to damage Some of these wells
have been lost or destroyed and at the conclusion of Several monitoring wells present in the wetland this study only 5 of the 10 sub-pond network wells
are near the apparent contaminant-plume centerline were still usable
12 Geophysical Surveys Country Pond and Adjacent Wetland Implications for Contaminant-Plume Monitoring Kingston NH 1998
(A) 71deg0430 71deg0415 71deg04
42deg5345
97 61 72 78 767i
789 69 11 11 34
10 8144
_ 95_1deg 115 12 14 12 88 Country fbnd
42deg5330
(B) 71deg0415 71deg04 71deg0345
42deg5345
02 04 22 26
92 70 80 72 88 5130 5860
130 80 66 100 66
30 48 86 75 46 S6 96 60 64 91 82
42deg5330 44 72 80 70 22
25 54 32 38
Country Pond
Base from US Geological Survey 112000 digital orthophoto quadrangle EXPLANATION Kingston NH 1968
EM data point and value in 0 250 500 750 1000 FEET I I I I millisiemens per meter (mSm)
50 100 150 200 METERS
Figure 8 EM31 (A) and EM34 (B) terrain-conductivity data-collection locations and associshyated values in millisiemens per meter (jlSm) in Country Pond and adjacent wetland Kingston New Hampshire
RESULTS OF GEOPHYSICAL SURVEYS 13
71deg0430 71deg0415 71deg04
42deg5345
(A)
EM 31
|l5-20mSm
|l1-15mSm
7-11 mSm
2-7 mSm
lt2 mSm 42deg5330
71deg0430 71deg0415 71deg04 42deg5345
(B)
EM 34
10-13mSm
7-10 mSm
4-7 mSm
2-4 mSm 42deg5330- shy
lt2 mSm
Base from US Geological Survey EXPLANATION Digital Raster Graph Kingston NH 1 240001989 Terrain conductivity (EM) data in gray shades
Light shades are areas of high terrain electrical conductivity Values are in 250 500 750 1000 FEET
T _J I millisiemens permeter (mSm) -H-r
0 50 100 150 200 METERS mdash 90 Elevation of sand surface in feet Contour interval is 5 feet Datum is sea level
Figure 9 Terrain conductivity in an adjacent wetland (A) and Country Pond (B) Kingston New Hampshire
14 Geophysical Surveys Country Pond and Adjacent Wetland Implications for Contaminant-Plume Monitoring Kingston NH 1998
The wetland is a topographic low which generally receives ground water from surrounding upland areas Discharge from the wetland is naturally channeled towards the pond in the direction of North and South Brook (fig 1) The conductivity surveys from this study and previous water-quality sampling indicate that a contaminant plume is concentrated along the northern part of the wetland adjacent to and along North Brook Existing monitoring wells are located approximately in the center of this plume and probably in or at the base of the glacial aquifer Screen lengths of existing monitoring wells in the wetland are not known and could be too long or in the wrong vertical locations to effectively monitor the concentrations of the contaminant plume The current monitoring wells provide limited longitudinal and no transverse coverage of the plume and do not provide information on vertical stratification of the plume The construction of monitoring wells towards the leading edge of the plume and beneath the pond are short screened and well documented (Mack 1995) but do not assess the leading edge of the plume beneath the pond Maintaining monitoring wells in the pond to address the leading edge of the plume however would not be feasible as the wells are in an area of considerable boat traffic
A well network to effectively monitor the concentration of contaminants in this plume could be constructed by establishing sampling points that bisect the axis of the plume at multiple depths This network would create a vertical plane of sampling points at a point where most of the ground-water fluxes would occur from the wetland to the pond through the underlying outwash aquifer Such a network would provide measurements of the direction and vertical gradient of ground-water flow at the wetland and pond interface and would permit sampling of the contaminant plume and uncontaminated background water If located immediately shoreward of the wetland-pond boundary the wells could be protected and maintained for a long period of time Such a network sampled at regular intervals with consistent methods would allow for monitoring of the concentration of the plume or evaluating the natural attenuation of contaminants (US Environmental Protection Agency 1998)
SUMMARY AND CONCLUSIONS
Contaminants from a former hazardous-waste site are moving downgradient though a wetland and beneath Country Pond at Kingston New Hampshire Geophysical profiles and data provide information about the various lithologies and the position of the electrically conductive part of this contaminant plume Contour maps of the elevations of surfaces of various lithologies indicate that the sand surface beneath the relatively flat organic sediment surface is highly irregular Terrain-conductivity data identify several anomalies most of which are related to the thickness of the water column and organic sediments overlying the sand One notable exception however is an elongated anomaly along the northwestern part of the wetland and into the pond where the anomaly is not related to deep depths of sand This anomaly is probably indicative of a contaminant plume moving through the sand unit beneath the wetland and pond Existing test-boring data confirm the interpretation of the geophysical surveys
SELECTED REFERENCES
Arthur D Little Inc 1991 Ground water remedial design Final report Volume 1 Ottati and Goss Site Kingston New Hampshire Cambridge Mass ADL Reference 6236348 p
Beres Milan Jr and Haeni PP 1991 Application of ground-penetrating-radar methods in hydrogeologic studies Ground Water v 29 no 3 p 375-386
Cotton IE 1977 Availability of ground water in the Piscataquog and other Coastal River basins southeastern New Hampshire US Geological Survey Water-Resources Investigations Report WRI77-70 scale 1125000 1 sheet
Ecology and Environment Inc 1982 Field investigations of uncontrolled hazardous waste sites FIT Project hydrogeologic investigation Kingston New Hampshire US Environmental Protection Agency Task Report contract no 68-01-6056
Goldberg-Zoino and Associates 1986 Remedial investigashytion of the Ottati and GossGreat Lakes Container Corporation site Kingston New Hampshire Concord NH New Hampshire Department of Environmental Services Water Supply and Pollution Control Division 229 p
SUMMARY AND CONCLUSIONS 15
Geophysical Survey Systems Inc 1994 SIR System-2 Operation Manual- Hudson N H Geophysical Survey Systems Inc 20 p
Haeni PP 1992 Use of ground-penetrating radar and continuous seismic-reflection profiling on surface-water bodies in environmental and engineering studies in Bell R S (ed) Symposium on the application of geophysics to engineering and environmental problems Oak Brook Illinois April 26-29 1992 proceedings Golden Colo Society of Engineering and Mineral Exploration Geophysicists p 145-162
Haem FP McKeegan OK and Capron D R 1987 Ground-penetrating radar study of the thickness and extent of sediments beneath Silver Lake Berlin and Meriden Connecticut US Geological Survey Water-Resources Investigations Report 85-4108 19 p
Koteff Carl and Moore RB 1994 Surficial geologic map of the Kingston Quadrangle Rockingham County New Hampshire US Geological Survey Geologic Quadrangle Map GQ-1740 scale 124000
Liebhch DA Haem FP and Lane JW Jr 1992 Integrated use of surface-geophysical methods to indicate subsurface fractures at Milford New
Hampshire U S Geological Survey Water-Resources Investigations Report 92-4506 38 p
Mack TJ 1995 Design of monitoring wells hydrogeshyology and ground-water quality beneath Country Pond Kingston New Hampshire US Geological Survey Open-File Report 95-465 16 p
Stekl PJ 1994 Data on observation wells ground-water levels and ground-water quality for stratified-dnft aquifer in the northwestern basin of Country Pond Kingston New Hampshire US Geological Survey Open-File Report 93-658 18 p
Stekl P J and Flanagan SM 1992 Geohydrology and water quality of stratified-dnft aquifers in the Lower Merrimack and coastal River Basins southeastern New Hampshire- US Geological Survey Water-Resources Investigations Report 91-4025 75 p
Ulnksen CP 1980 Investigation of peat thickness with radar Proceedings of the 6th International Peat Congress p 126-129
U S Environmental Protection Agency 1998 Monitored natural attenuation for ground water Washington DC Office of Research and Development September 1998EPA625K-98001
16 Geophysical Surveys Country Pond and Adjacent Wetland Implications for Contaminant-Plume Monitoring Kingston NH 1998
barcode 3413
barcodetext SDMS Doc ID 3413
Geophysical Survey Systems Inc 1994 SIR System-2 Operation Manual- Hudson N H Geophysical Survey Systems Inc 20 p
Haeni PP 1992 Use of ground-penetrating radar and continuous seismic-reflection profiling on surface-water bodies in environmental and engineering studies in Bell R S (ed) Symposium on the application of geophysics to engineering and environmental problems Oak Brook Illinois April 26-29 1992 proceedings Golden Colo Society of Engineering and Mineral Exploration Geophysicists p 145-162
Haem FP McKeegan OK and Capron D R 1987 Ground-penetrating radar study of the thickness and extent of sediments beneath Silver Lake Berlin and Meriden Connecticut US Geological Survey Water-Resources Investigations Report 85-4108 19 p
Koteff Carl and Moore RB 1994 Surficial geologic map of the Kingston Quadrangle Rockingham County New Hampshire US Geological Survey Geologic Quadrangle Map GQ-1740 scale 124000
Liebhch DA Haem FP and Lane JW Jr 1992 Integrated use of surface-geophysical methods to indicate subsurface fractures at Milford New
Hampshire U S Geological Survey Water-Resources Investigations Report 92-4506 38 p
Mack TJ 1995 Design of monitoring wells hydrogeshyology and ground-water quality beneath Country Pond Kingston New Hampshire US Geological Survey Open-File Report 95-465 16 p
Stekl PJ 1994 Data on observation wells ground-water levels and ground-water quality for stratified-dnft aquifer in the northwestern basin of Country Pond Kingston New Hampshire US Geological Survey Open-File Report 93-658 18 p
Stekl P J and Flanagan SM 1992 Geohydrology and water quality of stratified-dnft aquifers in the Lower Merrimack and coastal River Basins southeastern New Hampshire- US Geological Survey Water-Resources Investigations Report 91-4025 75 p
Ulnksen CP 1980 Investigation of peat thickness with radar Proceedings of the 6th International Peat Congress p 126-129
U S Environmental Protection Agency 1998 Monitored natural attenuation for ground water Washington DC Office of Research and Development September 1998EPA625K-98001
16 Geophysical Surveys Country Pond and Adjacent Wetland Implications for Contaminant-Plume Monitoring Kingston NH 1998