Geophysical Surveys With Tectonic and Interpretations of Liberia . Geologic GEOLOGICAL SURVEY PROFESSIONAL PAPER 810 Prepared in cooperation with the Liberian Geological Survey under the auspices of the Government of Liberia and the Agency fo?" International Development) U.S. Department of State
Transcript
Geophysical Surveys With Tectonic and Interpretations
of Liberia .
Geologic
GEOLOGICAL SURVEY PROFESSIONAL PAPER 810
Prepared in cooperation with the Liberian Geological Survey under the auspices of the Government of Liberia and the Agency fo?" International Development) U.S. Department of State
Surveys of Liberia Geophysical With Tectonic Interpretations
and Geologic
By JOHN C. BEHRENDT, U.S. GEoLOGICAL SuRVEY and CLETUS S. WOTORSON, LIBERIAN GEOLOGICAL SuRVEY
GEOLOGICAL SURVEY PROFESSIONAL PAPER 810
Prepared in cooperation with the Liberian Geological Survey under the auspices of the Government of Liberia and the Agency for International Development) U.S. Department of State
Airborne geophysical surve)'S provide useful results in the humid tropical environment
UNITED STATES GOVERNMENT PRINTING OFFICE, WASHINGTON 1974
UNITED STATES DEPARTMENT OF THE INTERIOR
ROGERS C. B. MORTON, Secretary
GEOLOGICAL SURVEY
V. E. McKelvey, Director
Library of Congress catalog-card No. 74-60005 8
For sale by the Superintendent of Documents, U.S. Government Printing Office Washington, D.C. 20402- Price .$3.80 (paper cover)
Summary of geology ---------------------------Liberian age province ----------------------Eburnean age province ----------------------Pan-African age province --------------------
Crustal structure -------------------Free-air anomaly map --------------Bouguer anomalies compared with
Tectonic map interpreted from geophysical and geological surveys. Total magnetic intensity map. Generalized residual total magnetic intensity map. Generalized total-count gamma-radiation map. Map showing geologic contacts inferred from gamma radiation data. Bouguer anomaly map.
Page
Generalized elevation map of Liberia ---------------------------------------------------------- 3 Histogram showing relative amounts of rock type west of long 9° W -------------------------- 4 Diagram showing reconstruction of predrift configuration of continents around the Atlantic _____ 6 Map showing location of quadrangles in Liberia__________________________________________________ 7 Aeromagnetic maps:
5. Bong Range region ------------------------------------------------------------------- 9 6. Cape Mount area --------------------------------------------------------------------- 10 7. Monrovia area ----------------------------------------------------------------------- 11 8. Nimba Range area -------------------------------------------------------------------- 12 9. Area at lat 7°15' N., long 8°30' W __ --------------------------------------------------- 13
10. Part of Eburnean age province -------------------------------------------------------- 14 11. Total-count gamma-radiation map of Bong Range area -------------------------------------- 15 12. Total-count gamma-radiation map of Monrovia area -------------------------------------------- 16 13. Gravity and residual magnetic profiles _ ____ ___ __ _ __ __ __ ___ __ _ _ _ __ _ _ __ _ _ _ _ _ _ _ ___ __ _ _ ___ __ ______ 18
14. Profiles and sections showing theoretical Bouguer gravity and magnetic anomalies for indicated
bodies ---------------------------------------------------------------------------------- 19 15. Graph showing correlation of total-count radiation data with content of K20 for several rock types __ 21 16. Free-air anomaly map of Liberia ------------------------------------------------------------- 23 17. Suggested crustal section fitted to Bouguer anomaly data ----------------------------------- 25 18. Graph showing correlation of free-air anomaly with elevation -.,----------------------------------- 27 19. Graph showing correlation of Bouguer anomaly with elevation ---------------------------------- 28
III
IV CONTENTS
TABLE
Page TABLE 1. Density of rock samples from Liberia ---------------------------------------------------------- 24
GEOPHYSICAL SURVEYS OF LIBERIA WITH TECTONIC AND
GEOLOGIC INTERPRETATIONS
By JOHN C. BEHRENDT) U.S. GEOLOGICAL SuRVEY) and CLETus S. WoTORSON) LIBERIAN GEOLOGICAL SuRvEY
ABSTRACT
Interpretation of the results of aeromagnetic, total-gamma radioactivity, and gravity surveys, combined with geologic data for western Liberia and other geologic information, allows the construction of a tectonic map of Liberia. The map approximately delineates the boundaries between the Liberian (about 2,700 m.y. (million years)) province in the northwestern two-thirds of the country, the Eburnean (about 2,000 m.y.) province in the southeastern one-third, and the Pan-African (about 550 m.y.) province in the coastal area of the northwestern two-thirds of the country. Rock foliation and tectonic structural features trend northeastward in the Liberian province, east-northeastward to northnortheastward in the Eburnean province, and northwestward in the Pan-African age province. Linear residual magnetic anomalies 20-80 km (kilometers) wide and 200-600 gammas in amplitude that follow the northeast structural trend which is typical of the Liberian age province cross the entire country and extend into Sierra Leone and Ivory Coast.
Theoretical bodies that are thicker than 10 km and have apparent susceptibility contrasts in the range of 0.0026-0.0043 emu/ cma (electromagnetic units per cubic centimeter) are required to fit the highest amplitude ( 600 gammas) anomaly which exceeds 50 km in width. These anomalies are of unknown origin but are possibly associated with the shear zones of Liberian age, inasmuch as similar associations are known elsewhere. The long-wavelength anomalies were only slightly modified by the Eburnean and Pan-African thermotectonic events and can be correlated with similar anomalies reported by other workers in Sierra Leone and Ivory Coast and the Guyana shield area in South America. Thus, the Pan-African thermotectonic event merely imprinted older rocks and did not generate new crust in the area of Liberia. Inasmuch as temperatures in these rocks exceeded the Curie isotherm during the Pan-African activity, the anomalies must be due to induced magnetization; therefore they probably are indicative of variations in the amount of magnetite in the underlying rocks.
A zone of diabase dikes, about 80-120 km wide, can be traced by magnetic data; it is about 90 km inland and parallels the coast from Sierra Leone to Ivory Coast. Another zone of diabase dikes having dates of 173 to 192 m.y. is at least 70 km wide and is located along the coastal area and beneath the continental shelf northwest of Green-
ville. These dikes probably were emplaced during the tectonic activity of about 180 m.y. ago that preceded the separation of the continents at the southern end of the North Atlantic. The magnetic data suggest basins of sedimentary rocks probably greater than 5 km thick on the continental shelf, deposited after sea-floor spreading had commenced.
The magnetic map indicates magnetic anomalies greater than 600 gammas; some anomalies are as great as 18,000 gammas over iron-formation and about 1,800 gammas over mafic and ultramafic intrusive bodies.
The radioactivity data, adjusted to an altitude of 220 m (meters), have a background level of less than 100 cps (counts per second; relative to 180 cps=1 J.tr/hr (microroentgens per hour) ) over mafic granulite-facies rocks and unmetamorphosed sedimentary rocks in the coastal area. Granitic rocks show the greatest variation. The central part of the country has the highest background radiation level; large areas show more than 250 cps. The eastern onethird of the country has a low level. In general, most of the areas having a background level above 150 cps and all areas above 250 cps are areas of granitic rocks.
Diabase sills, having radiation levels of 100-200 cps, show marked contrast to granulites and sedimentary rocks. The contact between the coastal granulite zone and the granitic gneiss inland is clearly indicated by the radioactivity data. Metasedimentary iron-formation and mafic metamorphic rocks within the predominantly granitic gneiss terrane are easily delineated. The radioactivity map shows many anomalies above 500 cps; some anomalies are more than 750 cps. Total-count radiation levels have a significant correlation with the percentage of K~O analyzed in bedrock samples, but anomalous amounts of thorium and uranium must be present to account for the highest amplitude anomalies. A few specific anomalies have been correlated with concentrations of monazite and zircon in bedrock as well as in beach deposits.
A regional gravity survey was made of the country along the coast using available roads and along tidewater rivers in western Liberia and showed a 50- to 60-mgal (milligal) positive Bouguer anomalous area extending along the coast from Sierra Leone to Ivory Coast This anomaly correlates with mafic granulites in the Monrovia region, where the gradient is too steep to be entirely due to crustal thickening at the continental margin. The only major break in this
1
2 GEOPHYSICAL SURVEYS OF LIBERIA
positive anomaly above basement rocks along the entire coast of Liberia is above granitic gneiss adjacent to (and presumably underlying) the only onshore basins of the coast. Local negative Bouguer anomalies exist over two Cretaceous basins in the coastal area. The high mean free-air anomaly of +22 mgal (exclusive of the coastal anomaly) suggests that the approximately 200-m mean elevation of Liberia is not compensated, at least over the Liberia region. A linear regression, showing a significant correlation of elevation with Bouguer anomaly, has a zero elevation intercept of + 18 mgal, again indicative of an isostatic anomaly. The standard deviation of ±14 mgal from the Bouguer anomalyelevation regression line is indicative of the amplitude range of local geologic anomalies. These include a 30-mgal anomaly above an ultramafic intrusion near Juazohn and an approximate 30-mgal anomaly associated with a mafic intrusion at Cape Mount. A suggested crustal model computed to fit observed marine and land Bouguer anomalies shows an abrupt thickening at the continental margin, several kilometers of sedimentary rock on the continental slope, uplifted dense lower crustal rocks at shallow depths beneath the continental shelf southeast of Greenville, and a high mean crustal density.
A suggested sequence of events indicates (1) thermotectonic activity about 2,700 m.y. (Liberian age) and about 2,000 m.y. (Eburnean age); (2) faulting along north-northeast trends in the apparent structural features and lineation; ( 3) emplacement of diabase dikes in northern Liberia during a period of reversed magnetic field; (4) thermotectonic activity about 550 m.y. ago (Pan-African age) in the northwestern coastal region; (5) uplift and exposure of deep crustal rocks; ( 6) deposition of Paleozoic (?) sediments; (7) emplacement of dikes and sills (176-192 m.y. ago) associated with rifting at the beginning of the separation of Mrica and North America and during a period of normal magnetic polarity in approximately the present field direction; ( 8) uplift and exposure of the coastal dikes and enclosing crystalline rocks and Paleozoic(?) sandstone; (9) deposition of Cretaceous and Tertiary ( ?) sedimentary rocks on the continental shelf and coastal area, accompanied by subsidence, block faulting, and active sea-floor spreading; ( 10) basaltic extrusion on the spreading sea floor and sedimentary deposition on the continental slop·e; and (11) uplift of Liberia to a mean elevation of about 200 m without apparent isostatic compensation.
INTRODUCTION
The Liberian Geological Survey and the U.S. Geological Survey have completed a cooperative program of reconnaissance geologic mapping of Liberia, under the auspices of the Government of Liberia and the Agency for International Development, U.S. Department of State. To assist in this program, an aeromagnetic survey and a total-count gamma-radiation survey were flown over Liberia in 1967-68. The U.S. Army Topographic Command participated in a gravity survey with the U.S. 72d Engineering Detachment and provided a gravity meter. We have discussed various aspects of the results of the geophysical investigations in previous reports (Behrendt and
Wotorson, 1969a; 1970a-c; 19·72; 1973; 1974a-r). The observed total magnetic intensity and totalcount gamma-radiation data have been published at 1:250,000 scale in 20 quadrangle sheets (Behrendt and W otorson, 197 4a-q; W otor:son and Behrendt, 197 4a-c) . This report integrates the geologic work with the geophysical data (pl. 1). The geological and geophysical interpretations presented here are only provisional and may be revised on the basis of future field investigations.
We have extensively used the reports by White and Leo (1969, 1971) and White (1969-70, 1972), who have summarized the geology of Liberia as it is known at present. Their geologic map of Liberia ( 1969) should be used to supplement the data presented here.
ACKNOWLEDGMENTS
We thank our colleagues in the Liberian Geological Survey and the U.S. Geological Survey for their assistance in this study-in particular, R. W. White, W. L. Coonrad, and Sam Rosenblum, who provided many helpful suggestions and criticisms. R. W. Bromery was instrumental in planning the airborne surveys before our participation in the program. D. E. Behrendt assisted in the gravity survey.
SUMMARY OF GEOLOGY
The geology of Liberia is difficult to study because of the few roads and the dense rain-forest vegetation resulting from a humid tropical climate (annual precipitation in certain coastal areas may exceed 500 em (centimeters)) and from the thick laterite soils mostly of at least Tertiary age (R. W. White, written commun., 1970). The terrain is rolling and the mean elevation of the country is moderately high (about 200 m). (See fig. 1). The more resistant rocks, such as iron-formation, ultramafic rocks, mafic amphibolite, and diabase, form steep ridges. Local relief in the Nimba and Wologizi Ranges (pl. 1), the highest ranges in Liberia, is about 800 m; maximum elevations are 1,380 and 1,420 m, respectively.
Hurley and others ( 1967; 1971) divided Liberia into three age provinces (pl. 1). The Liberian age province (about 2,700 m.y. (million years)) occupies the inland western two-thirds of the country; the Eburnean age province (about 2,000 m.y.) consists of approximately the eastern one-third; a narrow zone of thermotectonic activity, the Pan-African age province (about 550 m.y.), is along the coast in the western two-thirds of the country. The limits of these areas as shown on plate 1 are based in part on
FIGURE !.-Generalized elevation map of Liberia. Contours in meters; dashed where inferred.
4 GEOPHYSICAL SURVEYS OF LIBERIA
aeromagnetic data and in part on age determinations for samples analyzed by radiometric methods ( H urley and others, 1971).
Figure 2 shows the relative abundance of various rocks in western Liberia. The abundances were calculated from measured areas of geologic units shown
~·r-------------------------------------~
w 0..
70
60
~50 ~ () 0 a: LL. 040 w (!) <( 1-z ~ 30 a: w 0..
ROCK TYPE
FIG'uRE 2.-Relative amounts of rock type in Liberia west of long go W., as calculated from the geologic map of White and Leo (1969). Percentages are approximate but the preponderance of granitic gneiss over all other rock types is apparent. Diabase dikes are not included, because estimated quantity is too small to be shown in the diagram. Eastern Liberia (Eburnean age province) contains substantially more metasedimentary rock.
on White and Leo's geologic map (1969) ; granitic rocks are dominant over most of the area, but the Pan-African province contains abundant granulite.
LIBERIAN AGE PROVINCE
The following summary is taken largely from White and Leo's (1969) report which describes the Liberian age province (about 2,700 m.y., Precambrian) as consisting of gneissic rocks of granitic composition. Massive granitic rocks are known only in northernmost Liberia (White and Leo, 1969). Elsewhere, only small isolated bodies of granite are
within the gneissic terrane. Metasedimentary rocks, consisting of pelitic schist, quartzite, and amphibolite in the lower part of the sequence and oxide and silicate iron formation in the upper part, overlie the gneissic basement. These rocks were deposited on the original gneissic basement and were metamorphosed during the Liberian tectonic event (about 2,700 m.y.); they form narrow, elongate synclines within granitic gneiss. Many of the synclines are clearly indicated by anomalies on both the total magnetic intensity map (pl. 2) and the total-count gamma-radiation map (pl. 4), but they are not distinguished from other major linear structural features on plate 1.
Isolated bodies of amphibolite and small amounts of paragneiss, schist, and quartzite have an unknown age relationship to the surrounding gneissic terrane. Small bodies of peridotite and serpentinite cut the metasedimentary rock and granitic gneisses and thus are younger.
Both the foliation of the gneiss and the metasedimentary structural features trend northeast in the Liberian age province. The foliation and tectonic lineation trends continue into Guinea and Ivory Coast (White and Leo, 1969). The residual total magnetic intensity map (pl. 3) clearly reflects these trends among the broader scale features.
White and Leo ( 1969), on the basis of mineral assemblages and textures in the granitic rocks, suggested that metamorphic recrystallization occurred under amphibolite facies conditions. Because of the presence of sillimanite and andalusite, White (1970) inferred that it is a relatively low pressure hightemperature metamorphic-facies series. Undeformed granitic rocks are rare in the Liberian age province, and the magnetic data reveal short-wavelength linear anomalies generally associated with foliation in most of the granites mapped by White and Leo (1969).
EBURNEAN AGE PROVINCE
Geologic information is more sparse for the Eburnean age (about 2,000 m.y., Precambrian) province than for the Liberian province. Our summary is taken largely from data presented by Van Griethuysen (1969-1970), White 1969-70), White and Leo (1969), and Sam Rosenblum (written commun., 1970). The province contains less granitic gneiss than the Liberian age province (White and Leo, 1969), and extensive areas are underlain by isoclinally folded biotite-rich paragneiss and migmatite. Some iron-formation (but less than in the Liberian province) and amphibolite also are present, and undeformed intrusive granite and pegmatite are pres-
SUMMARY OF GEOLOGY 5
ent along the coast. P. Dion (oral commun., 1970) observed evidence of faulting along the geologic boundary shown as trending generally northeastward from Greenville (pl. 1). Dion and H. V. Van Griethuysen (written commun., 1970) also reported that graphite-bearing paragneiss is associated with some of the migmatite.
The trend of short-wavelength magnetic anomalies indicates that foliation and the structural trends of the folded paragneisses and migmatite curve northeast to north-northeast (pl. 1). The layers dip 40°-700 SE. (H. V. Van Griethuysen, oral commun., 1970), and the structural trends of the folds can be traced for long distances by use of data from the magnetic maps. (For example, see pl. 2.) H. V. Van Griethuysen and P. Dion (oral commun., 1970) observed prominent layering in traverses normal to the structural grain. They also reported some evidence of rock foliation within the ba,sement rocks parallel to the inland dike zone in areas where the Eburnean province is cut by the dike zone.
PAN-AFRICAN AGE PROVINCE
Much of the Pan-African age (about 550 m.y.) province (pl. 1) is underlain by mafic and pelitic rocks which have been metamorphosed to the granulite facies (White and Leo, 1969) ; amphibolite, biotite-garnet paragneiss, pelitic schists, ironformation, and granitic gneisses are also present. Lesser amounts of migmatite, pegmatite, and massive granitic rocks are also present in this zone, but the proportion of felsic rocks is much less than in the Liberian age province. This deduction is made from generalized radiometric data (compare pls. 1 and 4) which generally show a lower radiation level in the Pan-African province. White and Leo ( 1969) noted that the differences in average composition between rocks of the Pan-African and Liberian age provinces indicate that the original crystalline PanAfrican rocks were unlike the rocks exposed at present in the Liberian province. The Pan-African granulites have not been retrogressively remetamorphosed, possibly because of deep burial in the crust where available water was insufficient. The structural grain in the Pan-African belt generally trends northwest, in contrast to that in the Liberian age province which trends northeast.
SEDIMENTARY ROCKS
\Vhite ( 1972) has divided the unmetamorphosed sedimentary rocks along the coast between Monrovia and Buchanan (pl. 1) into Paleozoic ( ?) Paynesville Sandstone, Lower Cretaceous Farming-
ton River Formation, and Tertiary ( ?) Edina Sandstone. The Paynesville Sandstone, less than 1 km (kilometer) thick, occurs in faulted basins near Robertsfield and on the coast near Long Reef Point. It is overlain by graywacke, arkose, and conglomerate of the Farmington River Formation, which in turn are locally overlain by the Edina Sandstone. The basins probably subsided during the deposition of the Lower Cretaceous rocks. They were discovered during the study of the data from the aeromagnetic survey over the continental shelf (Beh:rendt and Wotorson, 1969a). The discovery stimulated petroleum exploration on the shelf: extensive seismic reflection surveys were made by private companies and exploratory drilling was started in 1971.
DIABASE DIKES
Diabase dikes are the most common of the various mafic intrusive rocks in Liberia. White and Leo (1969) and White (1969-70) mapped the dikes in three zones: a northern zone in the Voinjama region, a northwest-trending zone parallel to the coast 90 km inland, and a coastal zone extending from Sierra Leone to the vicinity of Greenville. The aeromagnetic data indicate many dikes in these zones, as shown on plate 1. The northern zone trends roughly east; the inland zone, about 80-120 km wide, can be traced from Sierra Leone to the Ivory Coast border; and the coastal zone has been inferred (Behrendt and Wotorson, 1970c) to extend beneath the continental shelf. Sills associated with the coastal dike zone have been dated within the range 173 and 192 m.y. (Gromme and Dalrymple, 1972). Behrendt and Wotorson (1969a) suggested that these sills were emplaced during the tectonic activity that was associated with the beginning of the separation of Africa from North America. (See fig. 3.) No reliable ages have been determined for the dikes about 90 km inland, but similar manetization directions suggest that these dikes may be similar in age to the dikes of the coastal zone, and Gromme and Dalrymple (1972) state that all the dikes are early Jurassic.
Most observed dikes are vertical and commonly are between 5 and 30 m thick, but the thickness ranges from a few centimeters to about 100 m (White and Leo, 1969; R. W. White, written commun., 1970). The dikes in the coastal zone and those about 90 km inland (pl. 1) are strongly magnetic and are associated with negative magnetic anomalies. Preliminary results indicate remanent magnetizations which average 0.001 and 0.0034 emu/cm3
6
+
+
GEOPHYSICAL SURVEYS OF LIBERIA
i--J\ro~ i-1'1f
'I ~At~~!. c~
i-
><
)(
'f..
'f.-
>< i {..., )(.
t-~/1; I ~~~ ...,
+
+ + -\-
sou-r\\ ~lA£RlC~ +
+ -r
EXPLANATION
----- Present coastline
----- 1000-m bathymetric contour
'f..
'f.-
'f.. '1-'f.-
'f.. «<p~ 'I- ~c..,
'}.
EZJ Area of overlap of fit
Area of under lap of fit
FIGURE 3.-Reconstruction of predrift configuration of parts of continents around the Atlantic, taken from Bullard, Everett, and Smith (1965). Note the good fit in the eastern one-third of Liberia and the poorer fit in the western two-thirds. The coastal zone of diabase dikes in Liberia does not continue along the eastern one-third of the coast.
GEOPHYSICAL SURVEYS 7
(electromagnetic units per cubic centimeter) in the present field direction for the coastal and inland zones, respectively, and which have negligible susceptibility (C. S. Gromme, written commun., 1969). Six dike samples from the coastal zone, however, have reversed magnetization (without negative anomaly) . Diabase sills in the coastal area commonly intrude the Paynesville Sandstone (White, 1972). Other bodies, which appear to be sills at the surface, must have vertical extent substantial enough to cause the several-hundred-gamma magnetic anomalies (fig. 7) associated with them (Behrendt and Wotorson, 1969a).
White and Leo (1969) reported several thin short kimberlite dikes of unknown age in westernmost Liberia that trend north-northeast, cutting obliquely across the foliation of the gneissic rocks. These dikes have no apparent associated magnetic anomalies.
GEOPHYSICAL SURVEYS
Aeromagnetic and total-count gamma-radiation surveys (pls. 2, 4), flown simultaneously during the 1967-68 dry season, consisted of approximately 140,000 km of traverse, mostly along north-south lines 0.8 km apart over land and 4 km apart over the continental shelf. Continuous photography and Doppler navigation provided horizontal control. Flight altitude was 150 m above terrain. Individual quadrangle maps showing the aeromagnetic data and the aeroradioactivity data at 1:250,000 scale are being published (Behrendt and W otorson, 197 4a-q; Wotorson and Behrendt, 1974a-c). (See fig. 4.)
AEROMAGNETIC SURVEY
Time variations in the magnetic field measured with a fluxgate magnetometer were removed by adjustment at crossings of east-west control lines. Various contour intervals of 10, 50, 250, and 1,000 gammas were used, depending on horizontal gradient. The data were compiled at 1:40,000 scale and were reduced to various scales.
Subsequent to compilation of the survey, we digitized the 1: 40,000-scale maps on a 1-minute grid. USNS Kane absolute total-intensity data (Lowrie and Escowitz, 1969), overlapping our survey of the continental shelf, allowed a datum adjustment of + 25,980±35 gammas to our survey, neglecting secular change (the two surveys were made about 6 months apart). With the assistance of Gordon Andreasen and Paul Zabel of the U.S. Geological Survey, we removed J. C. Cain's "Field G" (Cain and others, 1965) and automatically contoured the residual maps at 1:250,000 scale. These maps were joined at 1:500,000 scale, and the contours were generalized over the entire country at a 100-gamma
FIGURE 4.-Location of quadrangles for which aeromagnetic and radioactivity data will be published. Numbers are those of Miscellaneous Geologic Investigations Maps published by the U.S. Geological Survey.
interval. The very high amplitude anomalies were eliminated in this compilation. Plate 2 is the total magnetic intensity map and plate 3 is the residual total magnetic intensity map, both at a scale of 1:1,000,000.
DISCUSSION
SHORT-W A \'ELENGTH ANOMALIES
Steep gradients associated with the shallow magnetic basement are apparent over most of the area shown on plate 2. The predominant northeast magnetic grain associated with the Liberian age province changes to a generally northwest trend in the coastal area over the Pan-African age rocks; thus the magnetic pattern parallels the structural grain in these provinces. The boundary between the Liberian and Pan-African provinces shown on plate 1 also is apparent on plate 2 from the change in direction of short-wavelength anomaly trends from northeast in the Liberian province to northwest in the PanAfrican.
We interpret the prominent break in the magnetic fabric that extends northeast from the vicinity of Greenville to represent the western limit of sediments deposited in a trough immediately prior to the Eburnean event. If this magnetic break could be identified in South America, it would be a good marker to aid in predrift reconstructions. The dividing line between the Liberian and Eburnean age provinces is probably 50-60 km farther northwest,
8 GEOPHYSICAL SURVEYS OF LIBERIA
as suggest by Hurley, Leo, White, and Fairbairn (1971), but it has no obvious magnetic expression; however, any of several small changes in the magnetic pattern may be indicative of the LiberianEburnean province boundary.
A band of northwest-trending anomalies about 90 km inland clearly delineates the dike zone that can be traced from Sierra Leone to Ivory Coast. (For example, see anomalies shown in fig. 5.) The diabase dikes in the coastal area also are clearly indicated on plate 2 by northwest-trending linear anomalies. The magnetic maps by Behrendt and Wotorson (1969a) indicate that these dikes extend seaward beneath the continental shelf. The magnetic anomalies associated with these dikes become sparse southeast of Greenville and apparently cease to exist beyond Sass town. Their absence, however, may be illusory inasmuch as they would be difficult to detect in this area of high-amplitude northeast-trending anomalies. Geologic traverses along the beach revealed only one dike east of Greenville (about 7 m wide near long 8°30'W.) (R. W. White, written commun., 1970). We suggest that the coastal diabase dikes are more closely associated with the opening of the southern extremity of the North Atlantic than with the later (perhaps 130 to 150-m.y. B.P.) opening of the South Atlantic. R. W. White (written commun., 1970) collected limestone beach pebbles near Monrovia which he says "are definitely lacustrine, and are tentatively dated at Late Jurassic to Early Cretaceous. They place a maximum age on the marine transgression of roughly 150 m.y." The coastal dikes predate the limestone, and if they are associated with rifting in the North Atlantic, they were probably precursors to active drift and separation of the continents. The reconstruction by Bullard, Everett, and Smith (1965) of the continents around the Atlantic (fig. 3) shows a poor fit in the area of the Liberian coast where the edge of the continent, as indicated by the 200-m bathymetric contour (pl. 1), curves from a southeast trend to an east trend into the Gulf of Guinea east of Liberia. We suggest that this point, where the trend changes, is the southern limit of intrusions that are associated with the early opening of the North Atlantic in this area of Africa.
Small positive anomalies associated with the eastwest dikes in the northern part of the country suggest a reversed field direction that would indicate an age different from that of the other dikes; many of these anomalies are easily located on large-scale magnetic maps. The weak metamorphism and alteration of some dikes in this zone (White, 1969-70)
suggest that the east-west dikes may be older than the others.
The character of the magnetic field changes dramatically offshore over the shallow water on the continental shelf in the area northwest of Greenville. We have interpreted this change to be the effect of fault-bounded basins containing sedimentary rocks of Cretaceous and Tertiary age, in which depth to magnetic basement is probably greater than 5 km. Contours showing depth to magnetic basement are shown on plate 1.
Figures 5 through 10 are large-scale maps of parts of the magnetic map (pl. 2) that illustrate some of the features discussed in this report. Figures 11 and 12 show the radiometric data that overlap data of figures 5 and 7, respectively. Figure 5 shows northwest-trending anomalies that are associated with the inland dike zone where it crosses northeast-trending anomalies associated with iron-formation. Figure 6 shows the anomaly caused by the mafic intrusion near Cape Mount and part of the magnetic field offshore. Figure 7 shows part of the field in the coastal area near Monrovia. The northwest-trending linear anomalies are due to the coastal dike zone. The other high-amplitude anomalies are also the result of diabase intrusions (Behrendt and Wotorson, 1969a). The effects of the deepening magnetic basement offshore are very apparent. Figure 8 shows the magnetic field over the Nimba Range where there are iron-ore deposits. Figure 9 illustrates the magnetic anomalies caused by a structural feature (fault?) associated with magnetic metasedimentary rocks. Figure 10 shows the strongly linear magnetic field over the isoclinally folded and faulted ( ?) paragneiss in the Eburnean age province.
EXPLANATION FOR FIGURES S-10
~
MAGNETIC CONTOURS - Showing total intensity magnetic field of the earth in gammas relative to arbitrary datum. Regional magnet-ic gradient not removed. Hachured to indicate areas of lower magnetic intensity. Contour intervals are 10, 50, 250, and 1.000 gammas
FLIGHT PATH-- Showing flightline number and positioning photograph numbers
Aeromagnetic survey tlown at 150 meters above terrain in l 96 7 and 1968. North-south tlightline spacing was 0.8 km over land and 4 km over the continental shelf
Base coordinates from Hotines rectified skew orthomorphic projection, U.S. Coast and Geodetic Survey, 1956
GEOPHYSICAL SURVEYS
0
I I 5 MILES
10 Kl LOM ETERS I
FIGURE 5.-Bong Range region. Note northwest-trending magnetic anomalies due to diabase dikes (single arrows) crossing northeast-trending iron-formation (double-shafted arrows) of the Bong Range. Contour interval in the southwest is 10 gammas and in the northeast 50 gammas. Flightline tracks (including east-west control lines), numbers, and position locations are shown. (See p. 8 for explanation.)
9
10
0
I 0
GEOPHYSICAL SURVEYS OF LIBERIA
I 5MILES
10 KILOMETERS I
FIGURE 6.-Cape Mount area. Note wider flightline spacing offshore. The high-amplitude anomaly is caused by a gabbro-norite complex (arrow). Note deepening of magnetic basement offshore. Contour interval 10 and 50 gammas. (See p. 8 for explanation.)
10° 40'
6°10'
0 10 KILOMETERS I I I I I I I I I I I I I I I I
0 5 MILES
FIGURE 7.-Monrovia area. Note deepening of magnetic basement offshore. Most of the high-amplitude anomalies are due to diabas·e intrusions; those with linear northwest trends indicate dikes. Contour interval mostly 50. gammas. Arrow indicates anomaly ·associated with diabase outcrop which has been mapped as sill (White, 1972) but which must have substantial thickness to cause observed anomaly. (See p. 8 for explanation.)
C) tzj 0
~ ~ UJ 1-4 C"l > t:-4 UJ q ~ < tzj ~ UJ
~ ~
ff40' 35' 8°30'
0 10 KILOMETERS I I I I I I I I I I I I I I I I
0 5 MILES
FIGURE 8.-Nimba Range area. The high-amplitude anomalies are caused by iron-formation. Several examples are indicated by arrows. Note variable contour intervals. (See p. 8 for explanation.)
1-' l"
C'l tz:j 0 "tl :X: ~ 00 ....... (")
> t"' 00 c:: ~ < t_:'lj
~ 00
0 ~
t"' ....... IJj t_:'lj ~ ....... >
GEOPHYSICAL SURVEYS 13
~--~~I_LI __ ~I~--~--~--~~--~--~--~---~ 0 I 1 I I 10 KILOMETERS
FIGURE 9 A I I .- rea at lat 7o15
, N 5 MILES
representin ., long 8o30' W T tion g a structural featur . he prominent linea . Contour interval 50 ~ (fault?) associated "th r anomaly (shown b gammas m north and 10 WI metasedimentary k y arrows) gammas in south. ( Se . roc s that include e p. 8 for explanation.)
is interpreted as some iron-forma-
0 10 KILOMETERS I I I I I I I I
I I I I I 0 5 MILES
FIGURE 10.-Part of the Eburnean age province illustrating linear anomalies characteristic of isoclinal folds (and faults?) in paragneiss. The strong linear anomaly (arrows) in the northern part is suggested as rep,resen ting a possible fault shown on plate 1. Iron-formation is probably associated with the highest amplitude anomalies. Contour interval mostly 50 gammas. (See p. 8 for explanation.)
joooo&
~of:::>.
0 t?:1 0 1-0 1:1:: ~ UJ. ~
0 > t"' UJ. d ~ < t?:1 ~ UJ.
0 ~
t"' ~
b:1 t?:1 ~ ~
>
GEOPHYSICAL SURVEYS
0
I 0
I 5 MILES
10 Kl LOM ETERS I
FIGURE 11.-J'otal-count gamma-radiation of the Bong Range region (same area as that of fig. 5). Contour interval 50 cps (counts peP second). Note coincidence of low background (<150 cps; patterned) radiation level associated with iron-formation (double-shafted arrows) having high-amplitude magnetic anomalies as shown in figure 5. The northeast-trending lineation of rocks is reflected in the trend of the radiation contours. The diabase dikes visible in the magnetic data have no apparent effect here (compare fig. 12). (Seep. 17 for explanation.)
15
16
.0
I 0
GEOPHYSICAL SURVEYS OF LIBERIA
I 5 MILES
10 KILOMETERS I
FIGURE 12.-Total-count gamma radiation of the Monrovia area (compare fig. 7). The coastline coincides with the 25-cps contour. Contour interval is 25 cps. Comparison with geologic map of White (1969) shows correlation of diabase sills (for example, D) with levels from 100 to 200 cps (patterned). Alluvial deposits vary widely from
GEOPHYSICAL SURVEYS 17
EXPLANATION FOR FIGURES 11 AND 12
ISORADS - Showing aeroradioactivity in cps (counts per second; 180 cps= 1 microroentgen per hour) relative to arbitrary datum. Cosmic radiation component was removed. Hachured to indicate areas of lower radioactivity. Interval 50 cps (fig. 11) and 25 cps (fig. 12)
Aeroradioactivity survey flown at 150 meters above mean terrain in 196 7 and 1968. North-south flightline spacing was 0.8 km over land. Data corrected to 220-m elevation
Base coordinates from Hotines rectified skew orthomorphic projection, U.S. Coast and Geodetic Survey, 1956
Because of the difficulty in studying the contours in detail at 1: 1,000,000 scale, we have indicated on plate 2 the relative amplitudes of all the anomalies greater than 600 gammas. In a virtually horizontal magnetic field, a more magnetic rock would in general have a negative anomaly (Vacquier and others, 1951). Where magnetizations are reversed remanent and structural features are complex, positive anomalies also occur over magnetic rocks. The amplitudes shown here were measured peak to trough and are shown without regard to sign, although the positive and negative portions of anomalies are generally apparent. We have attempted to indicate all the highamplitude anomalies in the country, with the qualification that in the very high amplitude anomaly zones associated with iron-formation, only selected amplitudes are shown.
Although we cannot identify the sources of all these anomalies, several generalizations can be made. Virtually all anomalies having amplitudes greater than 2,000 gammas are due to iron-formation, which in Liberia consists of magnetite-itabirite (White and Leo, 1969) (figs. 5, 8) and a very little hematite-itabirite (R. W. White, written commun., 1970). Much of the ore that is mined is hematite or martite formed by oxidation and leaching of the magnetiteitabirite. Inasmuch as no magnetic anomaly would
mostly <100 cps to 250- and 375-cps anomalies that probably are associated with "black sand" (BS) containing monazite. The sinuous ljne of 125- to 250-cps anomalies perpendicular to the coast in the north coincides with mapped clay deposits (Blade, 1970) along the St. Paul Rive:r (for example, CL). A positive anomaly northwest and southwest of St. Paul River correlates with granitic gneiss (GN), which also has a negative Bouguer anomaly (pl. 6). Several negative anomalies associated with diabase dikes are indicated by arrows. (See p. 17 for explanation.)
result from hematite-martite, the large anomalies over mining areas evidently are not caused by the ore but by the underlying magnetite-itabirite, which must extend to considerable depths. Drilling at Nimba and elsewhere has shown that the ore bodies are smaller than the enclosing itabirite (R. W. White, written commun., 1970). At the one mine (Bomi Hills) where the ore is predominantly magnetite (as high as 70 percent Fe), our 1968 magnetic data show no decrease in amplitude as compared with unpublished data obtained in 1953, although most of the ore was removed from 1953 to 1968; this maintenance of magnetic level also illustrates that the anomalies are not caused by ore bodies. The highest amplitude anomalies are 18,000 gammas in the Nimba Range (fig. 8); 18,000 gammas in the ~ea Mountains; 12,000 gammas in the W ologizi Range; 12,000 gammas about 25 km northeast of Gahnpa; and 9,000 gammas in the Putu Range. The locations of the Mano River, Bomi Hills, Bong, and Nimba iron mines are shown on plate 2.
Many of the 1,000- to 2,000-gamma anomalies are over iron-formation, but others are possibly associated with mafic or ultramafic intrusions. One of these, over an ultramafic ( ?) body near J uazohn, also has an associated 30-mgal (milligal) positive gravity anomaly. Preliminary investigations of the feature indicate the presence of anomalous amounts of nickel and cobalt in laterite (H. Cruijs, W. H. Muller Co., oral commun., 1969). Other high-amplitude anomalies similar to the anomaly over the composite gabbro and norite pluton near Robertsport (fig. 6) (White and Leo, 1969) are probably caused by mafic intrusions.
The relatively high amplitude ( 1,000 gammas or less), strongly linear anomalies in the Eburnean age province (fig. 10) probably result from isoclinally folded paragneiss layers, including amphibolite and iron-formation; such rocks and structural features have been identified along the coastline in the area (R. W. White, written commun., 1969; S. Rosenblum, written commun., 1969). In Ivory Coast, manganese has been found along trends of, and in association witb, these magnetic anomalies in the area east of Harper (Bagarre and Tagini, 1965). Some of the anomalies should be investigated as potential targets for mineral exploration.
RESIDUAL MAGNETIC MAP
The residual magnetic map (pl. 3) shows several anomalies not apparent on plate 2; these and other features can best be interpreted by comparison of plate 3 with plates 1 and 2. We attach no geologic
18 GEOPHYSICAL SURVEYS OF LIBERIA
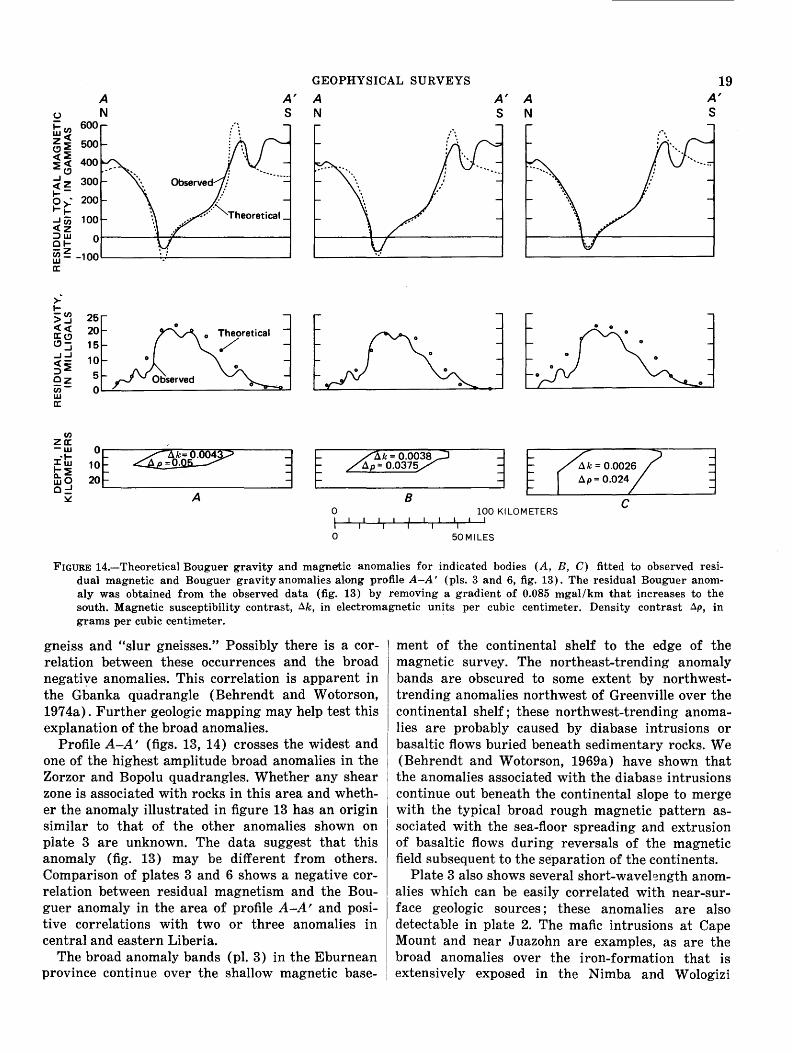
significance to the regional 400-gamma level observed throughout the map. The most striking features are the several-hundred-gamma, 20- to 80-km-wide, northeast-trending anomalies that cross the entire country. Profile A-A' (fig. 13) crosses one of the anomalies and shows a good correlation of a residual magnetic anomaly with a 25-mgal gravity anomaly.
FIGURE 13.-Gravity and residual magnetic profiles along section A-A' Location of profile shown on plates 3 and 5. See figure 14.
These broad anomalies in Liberia are continuous with similar anomalies in western Ivory Coast and Sierra Leone (Strangway and Vogt, 1970), as indicated by surveys made in those countries adjacent to the Liberian borders. Similar anomalies exist over Precambrian basement rocks in Guyana and Surinam and were used by Strangway and Vogt (1970) to place constraints on predrift continental reconstructions. These authors also show profiles in eastern Ivory Coast and conclude that the linear anomalies do not continue across the entire country.
The major break in the Eburnean age province trending northeast from the Greenville area is visible on plate 3 but is less conspicuous than on plate 2. Another indicated boundary (pl. 1) farther east shows several hundred gammas of relief and suggests a major geologic discontinuity.
The broad northeast-trending anomalies, which are so apparent on plate 3 in the Liberian age prov-
ince, also exist in the Eburnean province, but are obscured by superimposed linear shorter wavelength anomalies parallel to them.
Comparisons of plate 3 with plates 1 and 2 and the geologic map by White and Leo ( 1969) show the coincidence of near-surface and residual magnetic and geologic trend directions in the Liberian age province. Therefore, we can infer that the origin of the anomaly bands dates back at least to the Liberian-age thermotectonic activity about 2, 700 m.y. ago. Subsequent tectonic activity in the Eburnean province has only modified their general character. Several of the broad anomalies shown on plate 3 are coincident with linear short-wavelength anomalies shown on plate 2 suggesting that the sources (or edges of sources) of the broad features approach the surface in these areas. The gravity and magnetic profiles in figures 13 and 14 illustrate this. The masses of rock having the magnetization contrasts that cause the broad anomaly bands must be .of substantial vertical extent to produce the amplitudes observed, as discussed below. In some of the wider anomalies, such as the anomaly shown in figure 13, the thickness of the anomaly-producing bodies must be a significant part of the crust above the Curie isotherm, as discussed below. (See fig. 14.)
Strangway and Vogt's (1970) results in South America, as compared with data published by Hurley and others (1967), showed that the anomaly bands occur primarily over rocks equivalent to the E~burnean age (of Africa), although one date of 2, 700 ± 300 m.y. (corresponding to the Liberian-age thermotectonic activity in West Africa) falls in the area of the anomaly bands in Guyana. Thus, comparisons of these various data show that these anomaly bands are associated with tectonic activity in some of the oldest rocks known in the predrift continental nucleus which later separated into Africa and South America.
The origin of these long-wavelength northeasttrending anomalies is unknown. Behrendt and Wotorson (1969b), Behrendt, Brinkworth, and Popenoe (1968), and Zietz and others (1969) correlated similar anomalies over Precambrian terrane in the Colo-rado Rocky Mountains with shear zones. On this basis we suggest the possibility of a similar correlation in Liberia. Small shear zones are common in the gneiss of the Liberian age province and have trends parallel to the regional foliation (White and Leo, 1969).
Geologic maps of central Liberia (Offer berg and Tremaine, 1961) show large mapped areas of augen
A
GEOPHYSICAL SURVEYS
A' A A' A S N
19 A'
u N ~(I) 600 w<( z:!: <!):!: <( <( 400 :!:<!)
~z 300 ~-0 . ~~ ...J-<(~ 5~ 0
S N
-z ~- -100L---____;~-------....I a:
s
(I)
za: -w -~ ::z:w
~:!: 0..0 w...J o_
~~~---~----~-~-05-o-.o~-04--------~~ ~~---//ii--d_:_!_o_.~_3~-~~-3a--------~~~ ~--~~---~_;=_=o_~o-~~;~~6--------~~ A 8 c ~
0 100 KILOMETERS
I 0
jl lj jl lj I I
50 MILES
FIGURE 14.-Theoretical Bouguer gravity and magnetic anomalies for indicated bodies (A, B, C) fitted to observed residual magnetic and Bouguer gravityanomalies along profile A-A' (pls. 3 and 6, fig. 13). The residual Bouguer anomaly was obtained from the observed data (fig. 13) by removing a gradient of 0.085 mgal/km that increases to the south. Magnetic susceptibility contrast, D.k, in electromagnetic units per cubic centimeter. Density contrast D.p, in grams per cubic centimeter.
gneiss and "slur gneisses." Possibly there is a correlation between these occurrences and the broad negative anomalies. This correlation is apparent in the Gbanka quadrangle (Behrendt and Wotorson, 1974a). Further geologic mapping may help test this explanation of the broad anomalies.
Profile A-A' (figs. 13, 14) crosses the widest and one of the highest amplitude broad anomalies in the Zorzor and Bopol u quadrangles. Whether any shear zone is associated with rocks in this area and whether the anomaly illustrated in figure 13 has an origin similar to that of the other anomalies shown on plate 3 are unknown. The data suggest that this anomaly (fig. 13) may be different from others. Comparison of plates 3 and 6 shows a negative correlation between residual magnetism and the Bouguer anomaly in the area of profile A-A' and positive correlations with two or three anomalies in central and eastern Liberia.
The broad anomaly bands (pl. 3) in the Eburnean province continue over the shallow magnetic base-
ment of the continental shelf to the edge of the magnetic survey. The northeast-trending anomaly bands are obscured to some extent by northwesttrending anomalies northwest of Greenville over the continental shelf; these northwest-trending anomalies are probably caused by diabase intrusions or basaltic flows buried beneath sedimentary rocks. We (Behrendt and Wotorson, 1969a) have shown that the anomalies associated with the diabase intrusions continue out beneath the continental slope to merge with the typical broad rough magnetic pattern associated with the sea-floor spreading and extrusion of basaltic flows during reversals of the magnetic field subsequent to the separation of the continents.
Plate 3 also shows several short-wavel~ngth anomalies which can be easily correlated with near-surface geologic sources; these anomalies are also detectable in plate 2. The mafic intrusions at Cape Mount and near J uazohn are examples, as are the broad anomalies over the iron-formation that is extensively exposed in the Nimba and Wologizi
20 GEOPHYSICAL SURVEYS OF LIBERIA
Ranges. In general, however, we caution against using the residual magnetic map to study shortwavelength anomalies, because of the coarse 1-minute (1.8 km) grid interval used in digitization and the generalization and smoothing used in the contouring of plate 3. The larger scale magnetic maps (for example, figs. 5-10) (Behrendt and Wotorson, 1973a-q; Wotorson and Behrendt, 1973a-c) should be used for detailed examination of anomalies.
The Pan-African thermotectonic event (about 550 m.y. ago) did not obliterate the northeastern trends of the broad anomaly bands, although it altered the northeast-trending foliation observed in the surface geology and the short-wavelength magnetic-anomaly patterns illustrated on plates 1 and 2. The diabase dike zone 90 km inland is not apparent from data on the residual map (pl. 3), but there are suggestions of a westward curving of the anomaly bands within and southwest of the dike zone. This curving is continuous onto the continental shelf across the 176- to 192-m.y.-old coastal dike zone. Therefore, we conclude that the Pan-African age thermotectonic activity "imprinted" previously existing Liberian age rocks and did not generate new crust.
Because most of the basemeht rocks in the PanAfrican province are granulite facies (but include some amphibolite facies) metamorphic rocks, the temperature associated with the Pan African event must have been above the Curie isotherm. Inasmuch as it would be unlikely that remanent magnetization acquired about 550 m.y. ago would produce anomalies similar to those produced by remanent magnetism acquired about 2,700 m.y. ago, we conclude that the source of the long-wavelength anomalies, having Liberian age trends, is not remanent magnetization and must reflect variations in bulk magnetite concentration in the upper kilometers of the crust. Possibly detailed sampling and analyses of magnetite concentration in areas of positive and negative residual anomalies might aid in the under .. standing of the origin of the anomalies.
We have computed three theoretical, two-dimensional models to help explain the residual magnetic and gravitational effect associated with one of these long-wavelength anomalies. Figure 14 illustrates calculated and observed anomalies along profile A-A' (pis. 3, 6; fig. 13). The theoretical bodies range in thickness from 10 to 30 km with susceptibility contrast from 0.0043 to 0.0026 emu and density contrast from 0.05 to 0.024 g/cm3 (grams per cubic centimeter).
These models represent the limits within which the geologic origin of this anomaly probably lies.
The base of the thickest body (fig. 14C) n1ust approach or exceed the Curie isotherm depth, and although this model appears to give the best magnetic fit, it is somewhat unreasonable geologically. The calculated Bouguer anomaly for model C has a gradient flatter than that observed, suggesting that the model is too thick. Even the thinnest model (A) is thick from geologic considerations but represents about the limit for the magnetic models. A body thinner than those shown would have even more anomalous edge effects. The magnetic susceptibility, though high for all the models, would be questionable for anything thinner than model A. The density contrasts are low and reasonable for all models. (Compare with table 1.)
Lindsley, Andreasen, and Balsley ( 1966) showed relationship between magnetic susceptibility and magnetite content. On the basis of their graph, the susceptibilities in the computed models are those that suggest a magnetite content of 0.5 to 1 percent. This seems high for metamorphic rocks, but the susceptibilities are within the range for metamorphic rocks reported by Lindsley, Andreasen, and Balsley (1966).
The anomaly that we selected to fit has the highest amplitude of the broad anomalies in Liberia (it also has a good gravity traverse across it). The other long-wavelength magnetic anomalies could be fitted to similar bodies having smaller dimensions and lower magnetizations, that would be more easily explained geologically, Therefore, we conclude from the simple models in figure 14 that the long-wavelength magnetic anomalies can be accounted for by variations in magnetization (probably induced) of the metamorphic rocks extending to considerable depths in the crust.
AERORADIOACTIVITY SURVEY
The total-count gamma radiation data secured during flights made at a mean terrain clearance of 150 m simultaneous with the magnetic survey were automatically corrected for altitude variations and were then adjusted to a level of 220 m. The eastwest control lines allowed reduction to a common datum. Cosmic radiation background was removed by extending the flightlines over the Atlantic Ocean and' assuming zero radiation level over the water. Three thallium-activated sodium iodide crystals, 12 em in diameter and 5 em thick, were used. The original data were contoured at intervals of 25 and 50 cps referred to 180 cps per flr /hr. The data were compiled and reduced at the same scales as those of the aeromagnetic survey. Figures 11 and 12 show examples of about 1: 125,000 scale. The contour maps
GEOPHYSICAL SURVEYS 21
were generalized as shown on plate 4 to permit presentation at 1: 1,000,000 scale. The occasional, several flightline-wide radiation-level changes shown in the 1: 250,000-scale maps (Behrendt and Wotorson, 1974i-q; Wotorson and Behrendt, 1974c) were probably the result of rain suppression of gamma radiation, and they have been subjectively smoothed out in the 1: 1,000,000-scale map shown on plate 4. Plate 4 and the large-scale radiometric maps (for example, figs. 11 and 12) illustrate many changes in radiation level which we interpret as caused by geologic contacts between contrasting rock units. Some of these are indicated on plate 5.
DISCUSSION
In general, the higher the radioactivity background, the more felsic the terrane. (See fig. 15.)
6
5 0
1- 4 z w 0 u a: w Q. 3 0
z EXPLANATION
0 0 x Surface clay sample ~2 o Granitic rocks
A • Iron-formation X
A Granulite
• Diabase
0 100 200 300 400 500 600 TOT~L GAMMA RADIATION, IN COUNTS PER SECOND
FIGURE 15.-Content of K~O for Reveral rock types and surface clay samples from Liberia compared with radioactivity data. The least squares regression line has the equation: percent K20 = -0.45+ 0.0108R, where R is total gamma count. ThE> standard deviation is ±0.79 percent K20; correlation coefficient is 0.81.
Most mafic granulite-facies rocks and unmetamorphosed sedimentary rocks in the coastal areas have low amplitudes ( < 100 cps). Granite and granitic gneiss, which compose most of the mapped bedrock in the country (fig. 2), have a high and variable radioactivity background. We interpret this to be the result of great variation of potassium feldspar and biotite content in granitic rocks in Liberia. Sam Rosenblum (written commun., 1970) and G. W. Leo
(written commun., 1968) gave an average content of 20-30 percent and a range of 0-60 percent for potassium feldspar, and an average content of 10-15 percent and a range of 0-30 percent for biotite. Biotite would commonly contain concentrations of thorium and uranium, as well as potassium. Although abundances of potassium, thorium, and uranium in Liberian rocks are not known, available analyses of K20 from bedrock samples do show a general straight-line relationship to total-count gamma radiation below 500 cps (fig. 15).
The correlation coefficient r= 0.81 indicates a significant correlation, because a correlation coefficient of r= 0.47 is required at the !-percent significance level for a sample this size. Inasmuch as we would expect a general correlation between mostly nonradioactive potassium and the radioactive elements thorium and uranium (Clark and others, 1966), the correlation in figure 15 is not surprising, but it iS encouraging that this survey, flown over thick forest and deeply weathered rock with very few outcrops, reflects bedrock properties. Figure 15 suggests that the high-amplitude anomalies shown on plate 4 indicate anomalously high amounts of thorium and uranium, inasmuch as improbably high K20 concentrations would be required to explain the anomalies on the basis of potassium alone.
Figure 15 illustrates the general relation of several rock types to radiation level. This graph should be considered in using the radioactivity data (pl. 4) for geologic mapping. Granite and granitic gneiss are not distinguishable radiometrically and have a high variability in potassium (2-5 percent K 20) and in radiation level (100-500 cps). Comparison of plate 4 with White and Leo's (1969) geologic map shows that most of the variation on the radioactivity map is within areas of granitic rock. Various units within these terranes can in places be mapped at reconnaissance scale on the basis of the radioactivity data (pl. 5). Plates 4 and 5 and the large-scale maps can be of assistance, if carefully compared with geologic field data. In general, all the areas shown as above 250 cps on plate 4 are granitic terrane, as well as are most between 100 and 250 cps. (See also fig. 2.)
The radioactivity map shows a good contrast between the granitic terrane, the more mafic terrane, and the metasedimentary rocks. The iron-formation and other metasedimentary rocks show an obvious contrast to the granitic rocks, and their general trends are apparent (compare pls. 1, 4, and 5; figs. 5 and 12). The contact between the granulite belt in the coastal area and the granitic gneiss is evident, and it is indicated as contact A on plate 5. The break
22 GEOPHYSICAL SURVEYS OF LIBERIA
trending northeast from Greenville within the Eburnean age province, interpreted as the west edge of the paragneisses (pls. 1, 2, 3), also is readily apparent on plate 4.
The radioactivity data, even at the small scale shown here, indicate positive anomalies of more than 100 cps over the thin diabase sills mapped by White (1972) and White .and Leo (1969) (fig. 12), whereas the magnetic effect is negligible. For example, much of the area that shows more than 100 cps, within the low background radiation level over the indicated sedimentary rocks on plate 1, is diabase. (See fig. 12.) Diabase dikes in several places show negative anomalies where they cut high-radiationlevel terrane. (See fig. 11.) Clay deposits mapped along the St. Paul River (Blade, 1970) and along the Farmington River (R. W. White, written commun., 1970) also show moderately high radiation levels (fig. 12) ; obviously, additional information is required to make effective use of the radioactivity data for geologic mapping in specific areas.
Plate 5, which shows geologic contacts inferred from radioactivity data, is an example of one type of geologic interpretation that can be made from the radioactivity maps. (Compare with pl. 4.) Hypothetical interpretations of this kind must be evaluated against geologic and magnetic mapping. For additional discussion of the radiometric data, we refer the reader to the individual reports on the various quadrangles (Behrendt and Wotorson, 1974i-q; Wotorson and Behrendt 1974c).
The central area of Liberia, which contains most of the high-amplitude anomalies, exhibits the highest background radiation levels. Plate 4 shows that in this area the background averages are at least two and perhaps three times higher than they are in adjacent areas. The geologic map (White and Leo, 1969) indicates nothing to explain this difference; the terrane is granitic gneiss over most of the interior of the country west of long 9° W. (the eastern limit of the geologic map). A heat flow significantly higher in the high-radiation-level area than in the low area might be expected; the U.S. Geological Survey began a program of heat-flow measurements in Liberia in 1970.
The east-west linear anomaly about 80 km long, located just south of lat 7° N. between long 10°15' and 11 °15' W. (pls. 4, 5), is of interest. Samples of laminated paragneiss and laterite containing unusually large amounts of monazite and zircon (Sam Rosenblum, written commun., 1970) were collected from the areas of the east-trending linear anomaly. The 250- to 375-cps anomalies in the northwest
coastal area (pl. 4, fig. 12) are known to be associated with beach deposits of black sand containing concentrations of monazite and zircon (Sam Rosenblum and S. P. Srivastava, written commun., 1970). The ultimate source of these and other radioactive minerals probably is the higher background regions of the interior; the minerals are transported by rivers from the source and are concentrated by wave action. Such concentrations may be of economic significance and therefore are worthy of further exploration. Detailed work on specific magnetic and radiometric anomalies should be guided by the use of the larger scale maps (1: 40,000 and 1: 250,000).
GRAVITY SURVEY
We have made a gravity survey comprising approximately 1,300 stations in the easily accessible areas of Liberia as the basis for compilation of freeair anomaly and Bouguer anomaly maps. The data points are along roads having level lines and photogrammetrically determined elevations, along the coast and tidewater rivers, and along some roads where altimeters were used for elevation control. Approximately 80 percent of the stations have elevations accurate to within ± 2 m ( ± 0.4 mgal, Bouguer anomaly error) ; the rest are probably accurate to within ± 5 m ( ± 1.0 mgal, Bouguer anomaly error). Positions were obtained from modern 1:40,000 planimetric maps which were available in preliminary form for the entire western area and from 1:125,000 planimetric maps for the eastern area; consequently, position errors are believed to be negligible. A base-station net was established and tied to the North American gravity base network. Terrain corrections could not be made owing to the lack of topographic maps, but all corrections should be less than 1 mgal in this flat region, inasmuch as none of the data reported here were from the high ridges underlain by iron-formation and associated rocks. Thus, the errors are considerably less than the contour intervals shown. Data in Ivory Coast are from ORSTOM ( 1965). Additional offshore gravity data (fig. 16, pl. 6) were available from the USCGS D£scoverer 1968 cruise (H. R. Myers, written commun., 1969). The offshore area was not contoured, owing to the lack of adequate control caused by steep regional gradient associated with the continental margin. A density of 2.67 g/cm3 was used throughout in the Bouguer reduction. A map at 1:250,000 scale shows the Bouguer data for the Monrovia quadrangle (Behrendt and Wotorson, 1974r).
FIGURE 16.-Free-air anomaly map of Liberia. Offshore data and from USCGS Discoverer 1968 cruise. Contours dashed where uncertain. Interval is 10 mgal.
24 GEOPHYSICAL SURVEYS OF LIBERIA
DISCUSSION
HOUGUER ANOMALY MAP
The most apparent feature in the Bouguer anomaly map (pl. 6) is the 40- to 50-mgal positive anomaly along the coast from Sierra Leone to Ivory Coast. This feature has a gradient of 3-4 mgal/km in the area between Sierra Leone and Buchanan, which is too steep to be more than partly the result of crustal thickening at the continental margin. In the western part of Liberia this coastal anomaly is positive over terrane of granulite-facies metamorphic rocks, as mapped by White and Leo (1969) but is negative over quartzo-feldspathic gneiss. Sam Rosenblum (written commun., 1969) measured average densities of about 3.0 g/cm3 for granulite and 2.7 g/cm3
for granite gneiss (table 1). Hurley, Leo, White, and Fairbairn (1971) are uncertain of the age of the granulite inasmuch as they have dated samples at about 2,600 and about 550 m.y. (pl. 1). Probably the granulites were deep in the crust and were uplifted before deposition of the Paleozoic ( ?) sedimentary rocks. A computed model of the area inland from Monrovia (Behrendt and Wotorson, 1969a) suggests that about 2 km of relative displacement of the granulite and granite gneiss would be required to explain the residual anomaly, assuming a density contrast of 0.3 g/cm3
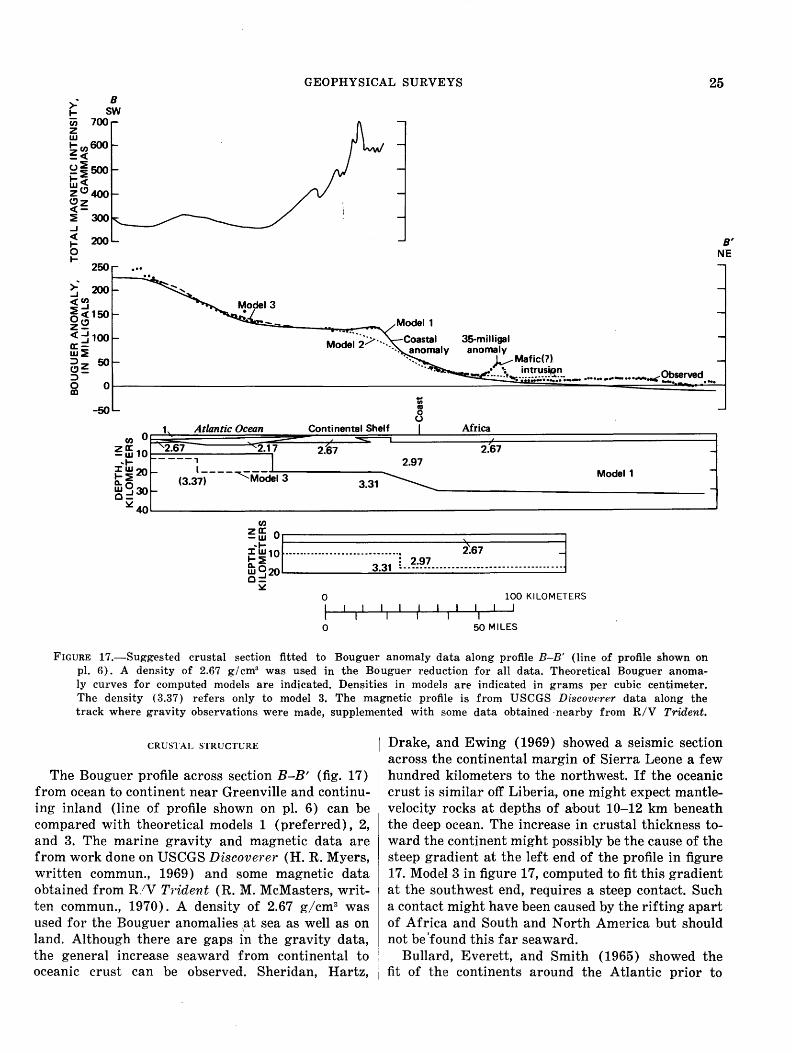
• Figure 17 suggests that the zone of uplifted granulite may exist offshore beneath the continental shelf in the Greenville area. Recent data we collected on a geophysical cruise in N ovember 1971 confirm that the positive coastal anomaly extends the length of the Liberian continental shelf.
A negative Bouguer anomaly is superimposed on the above-mentioned coastal positive anomaly roughly over the Cretaceous sedimentary rocks just north of Marshall (Behrendt and Wotorson, 1969a); a second negative anomaly to the southeast (pl. 6) also overlies Cretaceous sedimentary rocks. This relationship indicates that the Cretaceous rocks within the onshore fault-bounded basins are of low density and of substantial thickness. In contrast, the possible gravity effect of the thin Paleozoic ( ?) sedimentary rocks (White, 1972) is masked by basement gradients. The negative anomalies over these Cretaceous basins are complexly distorted, not only by the positive coastal anomaly, but by another negative basement anomaly which interrupts the coastal anomaly in the area of the sedimentary rocks. This distortion makes quantitative interpretation difficult. The complexity is indicated by the position of the 25-mgal contour east of Bassa Point where it is over Precambrian granitic basement rocks rather than granulite. Along the entire Liberian coast the only major break in this positive coastal anomaly exists over and adjacent to the only downfaulted onshore basins of the Liberian coast. If the hypothesis suggested for the coastal positive anomaly is correct, this negative basement anomaly would represent an area of the basement that was not uplifted and that was not relieved of its lighter basement rocks by erosion. Plate 6 suggests an average amplitude of -15 to -20 mgal, which corresponds to the effect of a slab 1.1-1.6 km thick of granitic rock having an assumed dens.ity contrast of 0.3 g/cm3 (table 1) as compared to granulite.
2.62 2.57 Pegmatite and aplite are local intrusives in granite
gneiss. 2.62 Do. 2.68 Undifferentiated metasedimentary gneiss, generally
laminated. 2.70 Abundant almandite-sillimanite-iron ore locally. 2.70 The major rock type in Liberia. 2.79 2.98 Partly to mo-stly altered to serpentine and amphibole
minerals with relict olivine and pyroxene. Highest value, 3.16, is for a pyroxenite.
2.97 Locally granophyric near coast. 2.94 3.08 Locally rich in almandite and some pyroxene. 3.07 Generally has almandite and (retrograde) hornblende;
pyroxenes are salite and bronzite. 3.47 Generally contains quartz and grunerite-almandite-
pyroxene-magnetite-pyrite. 4.12
GEOPHYSICAL SURVEYS 25 >- B ~ sw u; 100 z w ~ UJ600 ~< o::E500 -::E t:i< ze> 400
~-~ of ,, j :I: w 10 ·-·············---------------· 2.67 ~~20- 3.31 l..?:~.~ ............... , .............. .. o:::! ~
0 I I
100 KILOMETERS I I I I I
0 50 MILES
FIGURE 17.-Suggested crustal section fitted to Bouguer anomaly data along profile B-B' (line of profile shown on pl. 6). A density of 2.67 g I cm3 was used in the Bouguer reduction for all data. Theoretical Bouguer anomaly curves for computed models are indicated. Densities in models are indicated in grams per cubic centimeter. The density (3.37) refers only to model 3. The magnetic profile is from USCGS Discoverer data along the track where gravity observations were made, supplemented with some data obtained ·nearby from R/V Trident.
CRUSTAL STRUCTURE
The Bouguer profile across section B-B' (fig. 17) from ocean to continent near Greenville and continuing inland (line of profile shown on pl. 6) can be compared with theoretical models 1 (preferred), 2, and 3. The marine gravity and magnetic data are from work done on USCGS Discoverer (H. R. Myers, written commun., 1969) and some magnetic data obtained from R/V Trident (R. M. McMasters, written commun., 1970). A density of 2.67 g/cm3 was used for the Bouguer anomalies ,at sea as well as on land. Although there are gaps in the gravity data, the general increase seaward from continental to oceanic crust can be observed. Sheridan, Hartz,
Drake, and Ewing ( 1969) showed a seismic section across the continental margin of Sierra Leone a few hundred kilometers to the northwest. If the oceanic crust is similar off Liberia, one might expect mantlevelocity rocks at depths of about 10-12 km beneath the deep ocean. The increase in crustal thickness toward the continent might possibly be the cause of the steep gradient at the left end of the profile in figure 17. Model 3 in figure 17, computed to fit this gradient at the southwest end, requires a steep contact. Such a contact might have been caused by the rifting apart of Africa and South and North America but should not be 'found this far seaward.
Bullard, Everett, and Smith (1965) showed the fit of the continents around the Atlantic prior to
26 GEOPHYSICAL SURVEYS OF LIBERIA
drifting. Figure 3 shows the construction at about the 1000-m (500-fathom depth contour where the fit is best. In figure 17 this contour is about 45 km toward the continent from the step shown in model 3. The fit of Bullard, Everett, and Smith (1965) is good in southeastern Liberia and would have been better if the data showing the location of the 200-and 2000-m isobaths (pl. 1) had been available to them. Our magnetic interpretation and unpublished seismic data show that the continental shelf has little or no sedimentary cover in the area of profile B-B'; the crustal model, therefore, was computed for that area rather than the Monrovia area. In contrast, the Teledyne sparker profile shown by Behrendt and Wotorson ( 1969b) indicates that there are several kilometers of sedimentary rocks on the continental slope in this area of Liberia. The USNS Kane seismic profiles (Lowrie and Escowitz, 1969) also show sedimentary rocks on the continental slope there. The magnetic profile in figure 17 supports this interpretation.
On the basis of these considerations and information from unpublished seismic data that show velocities as low as 2 km/sec in some of the basins on the continental shelf, we suggest model 1 (fig. 17) as a reasonable crustal section across the continental margin of Africa near Liberia.
The coastal anomaly can be seen near the center of profile B-B' (fig. 17). On the basis of the two calculated models shown, we believe that a source at a relatively shallow depth in the crust is required to explain this anomaly. Model 2 shows the effect of a 7.5-km vertical step at the crust-mantle boundary at the unreasonably shallow depth of 10-17.5 km. Even this extreme model cannot explain the gradient of the anomaly, and a shallow source within the crust, as is shown in model 1, is required. As mentioned previously, we correlated (Behrendt and Wotorson, 1969a) the coastal anomaly with the mafic granulite zone mapped by White and Leo (1969) in the Monrovia area. Their map shows only granite gneiss near Greenville, but we suggest that dense rocks, possibly granulite or amphibolite, are uplifted to a shallow depth beneath the continental shelf. We do not imply that the shape of the anomalous mass used in model 1 is geologically realistic, but rather that some mass in this location is necessary to explain the observed data. The suggested crustal thickening on the continent side of model 1 is uncertain at best. A greater density contrast, which one might expect at the crust-mantle boundary, would result in an even
thinner continental crust relative to the 10-12 km likely for the oceanic crustal thickness. The high mean crustal density suggested by the model is consistent with known surface densities (table 1). The gravity datum of the computed models was arbitrarily chosen to fit the observed data.
The 35-mgal positive anomaly inland from the coast shown in figure 17, which did not fit the models, is caused by a mass of ultramafic intrusive rock that has an associated magnetic anomaly. No measured densities are available, but the amplitude suggests thicknesses of the intrusive mass of 2.8 and 1.7 km for density contrasts of 0.3 and 0.5 g/cm3
, respectively. Probably the actual density contrast is within this range.
FREE-AIR ANOMALY 1\IAP
The most apparent feature in the free-air anomaly map of Liberia (fig. 16) is the coastal anomaly that also appears on the Bouguer anomaly map. The broad low over granite gneiss centered about lat 6°30' N., long 10°15' W., seen in the Bouguer anomaly map also is the only area having values less than 0 mgal. The overall free-air gravity is high and suggests a lack of isostatic compensation. Figure 18 correlates the free-air anomalies with elevations at 530 stations that are approximately evenly distributed throughout the country (many of the stations in the Monrovia region were omitted). Although the scatter is large, the high free-air anomaly is obvious. The correlation with elevation is most apparent above 300-m elevation, but a regression line was not computed to fit the free-air anomalies.
We calculated a mean free-air anomaly over Liberia by estimating average values over 15-minute squares, based on the contours of figure 15 in areas covered by data. Using these values we computed mean values for 1-degree squares. The calculated mean for the entire country is + 26 mgal. Inasmuch as the coastal anomaly biases this value, the area over the steep gradient was omitted in figure 16, and the resultant mean is + 22 mgal. The mean free-air anomaly over an area of the large size and low topographic relief of Liberia should be a good approximation of the isostatic anomaly. If this premise is acceptable, then the mean of + 22 mgal would be equivalent to the effect of an uncompensated slab of granitic material of density 2.67, averaging 200-m thickness over the entire country. Comparison of this value with figure 1 shows that this is close to
FIGURE 18.-Correlaton of free-air anomalies with elevation. Note effect of coastal anomaly and general increase in freeair anomalies with elevation.
the regional elevation of Liberia. This comparison implies that the uplift resulting in the relatively high average elevation of Liberia is not compensated, at least over the region of Liberia. Surface densities for West Africa, computed from satellite observations, show anomalously high values over Liberia and nearby areas (Koch, 1970), which support our interpretation.
BOUGUER ANOMALIES COMPARED WITH ELEVATION
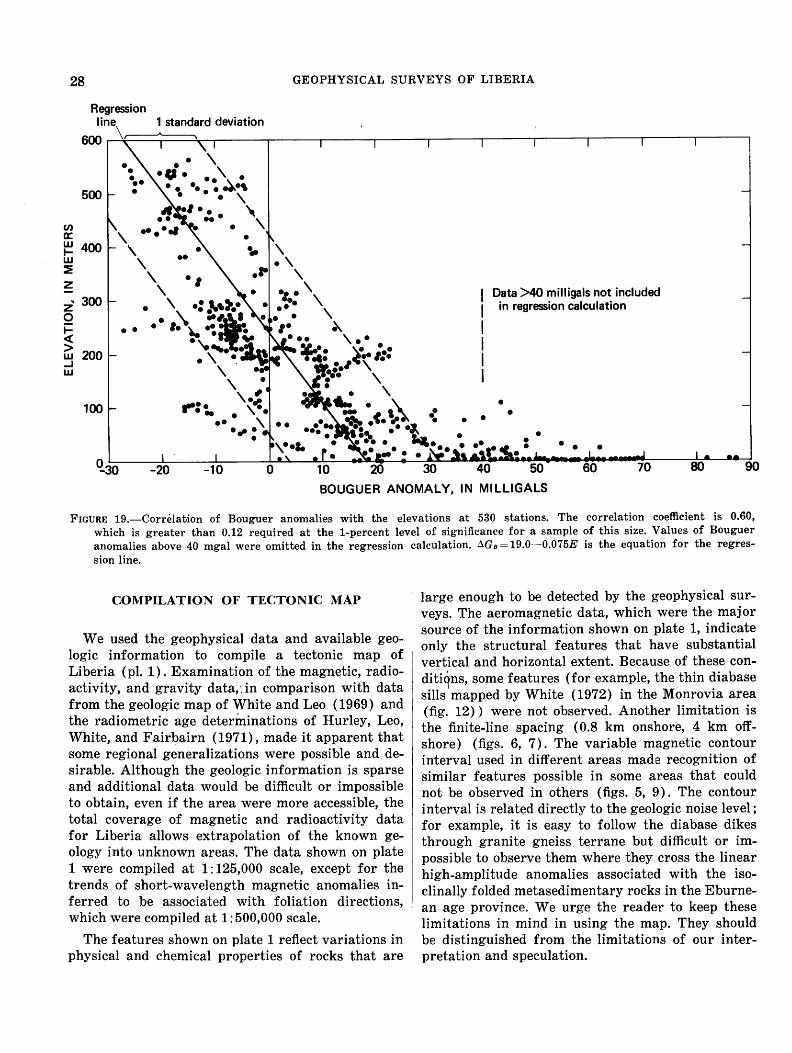
Figure 19 compares Bouguer anomalies with the elevation at 530 stations. At these stations correlation with elevation is more evident than it is for free-air anomalies. The computed regression line has the equation LlGn =--= 18.0- 0.075E, where LlGn is the Bouguer anomaly value and E is the station elevation. The calculated standard deviation of ± 13.9 mgal, which is an indication of the amplitude of local geologic anomalies, is a reasonable value for most of Liberia, as can be seen on plate 6. In calcula-
tion, all Bouguer values greater than 40 mgal were omitted to avoid bias from the coastal anomaly. The correlation coefficient of the regression line in figure 19 is 0.60; 0.12 is the value required for significance at 1-percent significance level. Mabey (1966) compared elevation with Bouguer anomalies in Nevada and determined a slope of -72 mgal/km which compares well with the value -75 mgal/km observed over Liberia. The zero elevation intercept in Nevada is -54 mgal as compared with the zero intercept in Liberia of + 18 mgal, which may be another indication of the presence of a positive isostatic anomaly. Mabey (1966) also compared regional elevation over varying radii out to distances of 128 km. It is unfortunate that this calculation cannot be made in Liberia at present because of the lack of adequate topographic maps. Figure 19 does suggest that we could predict regional Bouguer anomalies within an error of about 14 mgal on the basis of elevation in areas inland from the coast.
28 GEOPHYSICAL SURVEYS OF LIBERIA
Regression line 1 standard deviation
600 \,-------A-----,
500
en • a: • w 400 \t 1-w •• ::?! z
., .. 300 z
0 i= • • <( > 200 w ...J w
,_ .. ·- • •
Data >40 milligals not included in regression calculation
• • •
BOUGUER ANOMALY, IN Ml LLIGALS
FIGURE 19.-Correlation of Bouguer anomalies with the elevations at 530 stations. The corr~lat~on coefficient is 0.60, which is greater than 0.12 required at the 1-percent level of significance for a sample ?f this size. :Values of Bouguer anomalies above 40 mgal were omitted in the regression calculation. ~Gn = 19.0--0.075E IS the equation for the regression line.
COMPILATION OF TECTONIC MAP
We used the geophysical data and available geologic information to compile a tectonic map of Liberia (pl. 1). Examination of the magnetic, radioactivity, and gravity data;. in comparison with data from the geologic map of White and Leo ( 1969) and the radiometric age determinations of Hurley, Leo, White, and Fairbairn (1971), made it apparent that some regional generalizations were possible and desirable. Although the geologic information is sparse and additional data would be difficult or impossible to obtain, even if the area were more accessible, the total coverage of magnetic and radioactivity data for Liberia allows extrapolation of the known geology into unknown areas. The data shown on plate 1 were compiled at 1: 125,000 scale, except for the trends of short-wavelength magnetic anomalies inferred to be associated with foliation directions, which were compiled at 1:500,000 scale.
The features shown on plate 1 reflect variations in , physical and chemical properties of rocks that are I
large enough to be detected by the geophysical surveys. The aeromagnetic data, which were the major source of the information shown on plate 1, indicate only the structural features that have substantial vertical and horizontal extent. Because of these conditi~ns, some features (for example, the thin diabase sills
1
mapped by White (1972) in the Monrovia area (fig. 12)) were not observed. Another limitation is the finite-line spacing (0.8 km onshore, 4 km offshore) (figs. 6, 7). The variable magnetic contour interval used in different areas made recognition of similar features possible in some areas that could not be observed in others (figs. 5, 9). The contour interval is related directly to the geologic noise level; for example, it is easy to follow the diabase dikes through granite gneiss terrane but difficult or impossible to observe them where they cross the linear high-amplitude anomalies associated with the isoclinally folded metasedimentary rocks in the Eburnean age province. We urge the reader to keep these limitations in mind in using the map. They should be distinguished from the limitations of our interpretation and speculation.
COMPILATION OF TECTONIC MAP 29
FOLIATION
The short-wavelength magnetic-anomaly trends on plate 1 were compiled from magnetic data only, even though many linear trends were determined from the radiometric data. Because of the possible surface effects on the gamma-ray data, the three-dimensional picture presented on the magnetic map (pl. 2) better represents the rock foliation as inferred from the magnetic grain. The foliation symbols were drawn on axes of elongate closed anomalies or along gradients of the many long linear anomalies. The anomalies associated with the diabase dikes were specifically excluded in compilation of foliation directions and are discussed separately. This exclusion probably has introduced a bias against foliation parallel to the dike zone.
STRUCTURAL TRENDS
The magnetic lineations shown on plate 1 could indicate structural elements such as limbs, or axes of folds and faults, or steep contacts between rock bodies of contrasting magnetic properties. Generally, it is difficult or impossible to distinguish between the alternatives without additional geologic information (for example, figs. 9, 10). Anomaly amplitudes of 1,000 gammas or more are probably due to iron-formation, as we have discovered in comparing the known iron-formation with the anomalies (for example, figs. 5, 8).
The direction and location of the structural trends indicated on plate 1 conform to the magnetic contours and some may be different from the trends of the surface features. This could be due to any of several reasons; the most likely are: (1) the magnetic field is the integrated effect, observed at 150-m altitude, of the structural features that extend to an appreciable depth beneath the surface; (2) the contours for the extremely high amplitude anomalies were difficult to draw when features only one or two flightlines wide were considered and when the gradients were very steep (for example, fig. 8) ; and (3) topography affects the magnetic data.
Iron-formation in some places is not indicated as such, because lower amplitude anomalies make distinguishing it from other magnetite-containing metasedimentary rocks difficult (for example, fig. 10). In many places, the magnetite in iron-formation is too sparse to produce high-amplitude anomalies. Nevertheless, all the known major iron-ore concentrations in Liberia have high-amplitude magnetic anomalies caused by associated magnetite iron-formation; we are reasonably certain that our inter-
pretation has not excluded any sizable, previously unknown deposits.
DIABASE DIKES
A separate symbol was used on plate 1 for linear anomalies that are associated with the magnetic diabase dikes because of the relative ease in distinguishing these bodies on the magnetic map (for example, fig. 5 and pl. 2) and because of their importance to an understanding of Liberia's tectonic history. Most of the anomalies are negative and vary in amplitude from tens of gammas to a few hundred gammas. We have previously pointed out (Behrendt and Wotorson, 1970c), on the basis of comparison of observed and computed anomalies, that many, or most, of the known dikes correlated with magnetic anomalies were too narrow where measured to account for the observed anomaly widths; it is also likely that many dikes that crop out and can be seen in the field are too thin to produce an observable or contourable magnetic anomaly. We have examined many of the observed magnetic profiles over known outcrops and can correlate the outcrops with low-amplitude anomalies to the data resolution limit of a few gammas. The dikes causing anomalies shown on the aeromagnetic map could be thicker at depth, but this is geologically unlikely; more probably, the magnetic anomalies are caused by several narrow dikes in a zone that approximates a thick dike when observed at a survey height of 150 m. If the latter is true, possibly only one of the several dikes actually crops out or some of them crop out only along a part of the indicated length.
The diabase dikes indicated over the continental shelf probably are beneath the Cretaceous or younger sedimentary rocks in the basins and are the sources of many of the anomalies (for example, figs. 6, 7) that were used to calculate the depth to magnetic basement.
FAULTS
On the basis of magnetic data, faults are difficult or impossible to distinguish from the synclinal folds known to be commonly associated with the metasedimentary rocks in the Eburnean age province (fig. 10). Many of the linear structures (as opposed to the suggested faults) mapped on plate 1 are probably faults, but we cannot make the distinction. In some places these lineations are indicated as possible faults, and in a few places where geologic evidence indicates faults in the vicinity, as probable
30 GEOPHYSICAL SURVEYS OF LIBERIA
faults. Other faults are inferred from apparent offsets in trends which suggest strike-slip movement.
Block faults are inferred from the pattern indicated along the coastal area and continental shelf in figures 6 and 7. In those localities, the existence of near-vertical faults was interpreted on the basis of displacements in the magnetic basement. In son1e places, these inferred faults can be correlated with known faults that extend onshore where they displace Cretaceous sedimentary rocks. In other places faults are indicated in sections of seismic reflection records that cross the basins (Behrendt and Wotorson, 1970c, and our unpublished data). The seismic data lead us to believe that the block faults on the continental shelf are more complex than shown on plate 1, and that the indicated probable faults may possibly be considered as fault zones. This may be true of most or all of the possible faults shown on the tectonic map.
AGE PROVINCE BOUNDARIES
The boundary separating the Liberian and PanAfrican age provinces shown on plate 1 was determined from the structural grain as indicated by the magnetic data and by the known trends within the provinces. The ages published by Hurley, Leo, White, and Fairbairn ( 1971) and Bagarre and Tagini (1965) are shown on plate 1. The boundary between the Liberian and Eburnean provinces is probably 50-60 km west of the geologic boundary trending eastward from Greenville (pl. 1). The latter geologic boundary is indicated on the basis of the pronounced break in the magnetic data (pl. 2), whereas no such break exists at the age boundary which can only be provisionally located (pl. 1) on the basis of the radiometric age data shown.
DISCUSSION
The structural patterns characteristic of the Liberian, Eburnean, and Pan-African thermotectonic events are apparent on plate 1. Within the provinces many structural lineations of probable syntectonic origin are parallel to the general trends. Other tectonic lineations of a different age have a crosscutting relation to the general trends.
Throughout the map are features shown as possible faults that trend north-northeast. None of these has been positively identified as a fault, but the general similarity of trend suggests that the trends of the magnetic anomaly patterns on which these are based are caused by tectonic activity younger than the Eburnean event of about 2000 m.y. ago.
None of these possible faults shows any offset where it crosses the inland dike zone. Probably the linear features that trend north-northeast are also older than the dikes in the Voinjama area. However, interpretation of these north-northeast trends is highly speculative, and they may not be faults.
Most but not all of the dikes associated with positive anomalies trend east and cut across the Liberian-age lineations in the Voinjama area. Although no determinations have been made, the positive anomalies probably indicate reversed magnetization, whereas the negative anomalies associated with the dikes indicate normal magnetization. Some dikes in the Voinjama area have negative anomalies similar to the anomalies of dikes closer to the coast, and of these, some are weakly metamorphosed (R. W. White, written commun., 1970). These relations suggest different ages of intrusion.
The major dike zone about 90 km inland, which is probably syntectonic with the coastal dike zone, is a striking feature of plates 1 and 2. This zone, which is parallel to the coast, may indicate the tensional fracturing that was a precursor to rifting (fig. 3). Right-lateral shear in this dike zone is indicated by
. curves and more easterly trends in linear anomalies. As has been mentioned previously, basement-rock foliation parallel to the dike~ has been observed in outcrop in southeastern Liberia. The residual magnetic and Bouguer anomaly maps (pis. 3, 6) show no effect of this dike zone. The coastal dike zone dated at 176 and 192 m.y., extends beneath the continental shelf about as far as Greenville. The dikes shown on plate 1 in the area of the basement contours, particularly offshore, are at various depths (as indicated by the contours) and do not necessarily crop out at the land surface or sea bottom. This is in contrast to the other dikes indicated on plate 1, which are at or near the land surface.
A mafic granulite belt or amphibolite may be present at a shallow depth in the area of the continental shelf southwest of Greenville. Plates 1, 2, and 3 show a change in magnetic character that suggests a fault terminating the isoclinal fold belt offshore in this area. This is the area of the postulated uplifted block of dense rock (granulite?) shown in the model, figure 17. The Pan-African age zone roughly correlates with the granulite belt in the coastal area of western Liberia.
SUMMARY
The following sequence of tectonic events is indicated by the combined geophysical and geological information now available for Liberia:
SUMMARY 31
1. Thermotectonic activity during the Liberian age period about 2,700 m.y. ago caused folding, faulting, and shearing of granitic and metasedimentary rocks and a resultant northeasterly structural trend. Probably considerable amounts of synkinematic granitic rocks were produced by partial anatexis of metasediments during this activity, and all rocks were strongly metamorphosed. Granulites were probably first formed, and ultramafic rocks in the Liberian province may date from this time (R. W. White, written commun., 1970). Long-wavelength, northeast-trending magnetic anomalies originated.
2. Thermotectonic activity during the Eburnean age (about 2,000 m.y. ago) in eastern Liberia caused isoclinal folding, some faulting, and metamorphism in a region chiefly underlain by sedimentary rocks and caused partial anatexis of those rocks to migmatite. Older crystalline rocks (in the northwestern part of the Eburnean province) were remetamorphosed. Long-wavelength magnetic anomalies of Liberian age were modified but not obliterated by this activity. Some crosscutting granitic intrusives were emplaced (R. W. White, written commun., 1970).
3. Tectonic activity of unknown age produced faults ( ?) that trend north-northeast throughout Liberia.
4. East-northeast to east-trending dikes were emplaced in northern Liberia during a period of reversed magnetic field. The ages of these dikes are uncertain ; they might have formed after events described in paragraphs 5, 6, or 7, or later. Some of the dikes were weakly metamorphosed at a later time. Some of the dikes in this area were possibly emplaced at a different time during a normal field polarization.
5. Pan-African age (about 550 m.y.) thermotectonic activity in the coastal area of western Liberia resulted in a change of some smallscale magnetic lineations associated with foliation from the Liberian-age northeast trend to a northwest direction. Long-wavelength residual magnetic anomalies were largely unaffected, but there is some suggestion of shearing in a northwest direction. (This event could be associated with the intrusion described in paragraph 8 of this list.) Remetamorphism (partly to granulite),
anatexis, and emplacement of granitic rocks occurred.
6. Granulite-facies rocks of relict Liberian ( ?) age and (or) of Pan-African ( ?) age in the coastal area of the Pan-African age province were uplifted and exposed. A positive gravity anomaly is associated with the granulite belt but no long-wavelength magnetic anomaly is obvious. The part of the coastal area covered by later sedimentation (events 7 and 10) was apparently not uplifted.
7. Paleozoic ( ?) sandstone was deposited and is observed in the coastal area from Monrovia to about 70 km southeast.
8. Emplacement of diabase dikes in a zone about 90 km inland, across the entire country parallel to the coast, took place during a period of normal magnetization in present field direction. Possible shearing of basement rocks in the dike zone is suggested by magnetic data and sparse field geologic evidence, but no large horizontal offsets are known. No noticeable long-wavelength magnetic or gravity anomalies are associated with the dike zone. This dike zone probably is of the same age as the coastal zone. Emplacement of diabase dike zone in coastal area and continental shelf, with associated sills from 173 to 192 m.y. ago, cut Paleozoic ( ?) sandstone during period of normal magnetization in present field direction. Some basalt was extruded at this time. This dike zone apparently does not extend far east of Greenville. Possibly it is associated with rifting and the opening of the North Atlantic and was a precursor to the separation of North America from Africa. Six dikes in this zone have reversed polarization of magnetization (S. Gromme, written commun., 1969) suggesting a different time of emplacement of some of the dikes. Kimberlite dikes of unknown age were emplaced.
9. Uplift resulted in exposure of diabase dikes, enclosing crystalline rocks, and Paleozoic ( ?) sandstone.
10. Seafloor spreading started in the area off Liberia northwest of Greenville (North Atlantic).
11. Lower Cretaceous sedimentary rocks were deposited in coastal area and on continental shelf; deposition was accompanied by subsidence, block faulting along west-northwest and northwest trends, and active sea-floor spreading.
32 GEOPHYSICAL SURVEYS OF LIBERIA
12. Rifting apart of Africa and South America occurred ; sea-floor spreading began in the area of the Gulf of Guinea about 140 m.y. ago. Probably the Liberian continental shelf southeast of Greenville was involved in this activity.
13. Tertiary ( ?) sedimentary rocks were deposited on the continental shelf and slope.
14. Continued sea-floor spreading was accompanied by extrusion (and intrusion) of basaltic rocks on the sea floor.
15. Liberia was uplifted to present mean elevation of about 200 m; this uplift is apparently associated with an isostatic anomaly equivalent to the uplifted mass.
In summary, the geophysical surveys have contributed valuable information to the geologic mapping program in Liberia. They have been found to be particularly useful in the interpretation of geologic features that are impossible to observe in inaccessible areas or even in accessible surface exposures. The available large-scale aeromagnetic and radioactivity maps should also prove useful in unraveling geologic problems that will come to light in future field mapping. Similarly, future geologic mapping will furnish a better base for interpreting the geophysical data.
The data presented here illustrate the general usefulness of geophysical studies in humid tropical areas. Although at the planning stage there was no doubt about the potential usefulness of the aeromagnetic survey, the usefulness of the radioactivity data was not as predictable. We believe we have demonstrated that radioactive elements at the surface of the residual soil overlying a thick weathered zone reflect their proportional content in the underlying bedrock. On the basis of present results we recommend the use of gamma-ray spectral surveys for future work, where costs and objectives justify this approach. Conversely, we would not hesitate to use total-count gamma surveys in conjunction with aeromagnetic surveys for reconnaissance geologic mapping programs similar to that in Liberia, if the cost were significantly lower.
Although the gravity coverage is sparse, the results presented here do illustrate the usefulness of this approach, not only for obvious problems such as the study of the Cretaceous sedimentary rocks, but for problems related to crystalline bedrock such as the transition between the granulite and granitic gneiss or the mafic plutons. Gravity surveys in inaccessible tropical areas such as Liberia are much more expensive to conduct for broad areal coverage
than the airborne programs, particularly because of problems of elevation control.
Other airborne geophysical techniques, such as electromagnetic surveys, might prove useful in mineral exploration in areas selected on the basis of the magnetic survey, but they probably are too expensive at present for routine reconnaissance geologic mapping of a large area.
REFERENCES CITED
Bagarre, E., and Tagini, B., 1965, Carte Geologique de la C8te d'Ivoire: Abidjan, Direction des Mines et de la Geologie du Government de C8te d'lvoire, 1:1,000,000 scale.
Behrendt, J. C., Brinkworth, G., and Popenoe, P., 1968, Geophysical investigations in the Colorado mineral belt rabs.]: Geophysics, v. 33, no. 6. p. 1030.
Behrendt, J. C., and Wotorson, C. S., 1969a, Aeromagnetic and gravity investigations of the sedimentary basins on the continental shelf and coastal area of Liberia, West Africa: U.S. Geol. Survey open-file rept.; Liberian Geol. Survey Memo. Rept. 50, 11 p., 10 figs.
--- 1969b, Aeromagnetic, aeroradioactivity and gravity surveys in Liberia, West Africa [abs.]: Am. Geophys. Union Trans., v. 50, no. 4, p. 320.
--- 1970a, Total-intensity aeromagnetic map of Liberia including the continental shelf: U.S. Geol. Survey openfile rept., map with text, scale 1:500,000; Liberian Geol. Survey Memo. Rept. 55.
--- 1970b, High-amplitude radioactivity anomalies in Liberia, West Africa: U.S. Geol. Survey open-file rept., map, scale 1: 1,000,000; Liberian Geol. Survey Memo. Rept. 54.
--- 1970c, Aeromagnetic and gravity investigations of the coastal area and thg continental shelf of Liberia, West Africa, and their relation to continental drift: Geol. Soc. America Bull., v. 81, p. 3563-3574.
--- 1972, Aeromagnetic and gravity investigations of the :::edimentary ba~infi on the -continental--sh-elf and coastal area of Liberia, West Africa: Liberian Geol. Survey Spec. Paper 2, 13 p., 4 pl.
--- 1973, An aeromagnetic and aeroradioactivity survey of Liberia: Geophysics, v. 36, no. 3, p. 590-604.
--- 1974a, Aeromagnetic map of the Voinjama quadrangle, Liberia: U.S. Geol. Survey Misc. Geol. Inv. Map 1-771-B, scale 1:250,000. (In press.)
--- 1974b, Aeromagnetic map of the Bopolu quadrangle, Liberia: U.S. Geol. Survey Misc. Geol. Inv. Map I-772-B, scale 1:250,000. (In press.)
--- 1974c, Aeromagnetic map of the Zorzor quadrangle, Liberia: U.S. Geol. Survey Misc. Geol. Inv. Map 1-773-B, scale 1:250,000. (In press.)
--- 1974d, Aeromagnetic map of the Sanokole quadrangle, Liberia: U.S. Geol. Survey Misc. Geol. Inv. Map 1-774-B, scale 1:2l)O,OOO. (In press.)
--- 1974e, Aeromagnetic map of the Gbanka quadrangle, Liberia: U.S. Geol. Survey Misc. Geol. Inv. Map I-776-B, scale 1:250,000. (In press.)
--- 1974£, Aeromagnetic map of the Buchanan quadrangle, Liberia: U.S. Geol. Survey Misc. Geol. Inv. Map 1-778-B, scale 1:250,000. (In press.)
REFERENCES CITED 33
1974g, Aeromagnetic map of the Harper quadrangle, Liberia: U.S. Geol. Survey Misc. Geol. lnv. Map 1-780-B, scale 1:250,000. (In press.)
--- 1974h, Aeromagnetic map of the Monrovia quadrangle, Liberia: U.S. Geol. Survey Misc. Geol. Inv. Map 1-775-B, scale 1:250,000. (In press.)
--- 1974i, Total-count gamma radiation map of the Voinjama quadrangle, Liberia: U.S. Geol. Survey Misc. Geol. Inv. Map 1-771-C, scale 1:250,000. (In press.)
--- 1974j, Total-count gamma radiation map of the Bopolu quadrangle, Liberia: U.S. Geol. Survey Misc. Geol. Inv. Map I-772-C, scale 1:250,000. (In press.)
--- 1974k, Total-count gamma radiation map of the Zorzor quadrangle, Liberia: U.S. Geol. Survey Misc. Geol. Inv. Map 1-773-C, scale 1:250,000. (In p·ress.)
--- 19741, Total-count gamma radiation map of the Sanokole quadrangle, Liberia: U.S. Geol. Survey Misc. Geol. Inv. Map 1-774-C, scale 1:250,000. (In press.)
--- 1974m, Total-count gamma radiation map of the Gbanka quadrangle, Liberia: U.S. Geol. Survey Misc. Geol. Inv. Map 1-776-C, scale 1:250,000. (In press.)
--- 197 4n, Total-count gamma radiation map of the Buchanan quadrangle, Liberia: U.S. Geol. Survey Misc. Geol. Inv. Map 1-778-C, scale 1:250,000. (In press.)
--- 1974o, Total-count gamma radiation map of the Harper quadrangle, Liberia: U.S. Geol. Survey Misc. Geol. Inv. Map I-780-C, scale 1:250,000. (In press.)
--- 1974p, Total-count gamma radiation map of the Monrovia quadrangle, Liberia: U.S. Geol. Survey Misc. Geol. Inv. Map 1-775-C, scale 1:250,000. (In press.)
--- 1974q, Total-count gamma radiation map of the Juazohn quadrangle, Liberia: U.S. Geol. Survey Misc. Geol. Inv. Map I-779-C, scale 1:250,000. (In press.)
--- 1974r, Bouguer gravity map of the Monrovia quadrangle, Liberia: U.S. Geol. Survey Misc. Geol. Inv. Map I-775-E, scale 1:250,000. (In press.)
Blade, L. V ., 1970, Geology of the Bushrod Island-New Georgia clay deposit near Monrovia: U.S. Geol. Survey open-file rept., 35 p.; Liberian Geol. Survey Memo. Rept. 34, 35 p.
Bullard, E. C., Everett, J. E., and Smith, A. G., 1965, The fit of the continents around the Atlantic, in A symposium on continental drift: Royal Soc. London, Phil. Trans. 1088, ser. A, v. 258, p. 41-51.
Cain, J. G., Daniels, W. E., Hendricks, S. J., and Jensen, D. C., 1965, An evaluation of the main geomagnetic field, 1940-1962: Jour. Geophys. Research, v. 70, no. 15, p. 3647-3674.
Clark, S. P., Jr., Peterman, Z. E., and Heier, K. S., 1966, Abundances of uranium, thorium, and potassium in Clark, S. P., Jr., ed., Handbook of physical constants [revised ed.]: Geol. Soc. America Mem. 97, p. 522-541.
Gromme, Sherman, and Dalrymple, G. B., 1972, K-Ar ages and paleomagnetism of dikes in Liberia [abs.]: EOS, Am. Geophys. Union Trans., v. 53, p. 1130.
Hurley, P. M., de Almeida, F. F. M., Melcher, G. C., Cordani, U. C., Rand, J. R., Kawashita, K., Vandoros, P., Pinson, W. H., Jr .. and Fairbairn, H. W., 1967, Test of continental drift by comparison of radiometric ages: Science,v. 157, p. 495-500.
Hurley, P. M., Leo, G. W., White, R. W., and Fairbairn, H. W., 1971, The Liberian age province (ca. 2,700 m.y.) and adjacent provinces in Liberia and Sierra Leone: Geol. Soc. America Bull., v. 82, p. 3483-3490.
Koch, K. R., 1970, Surface densH.y values for the earth from satellite and gravity observations: Royal Astron. Soc. Geophys. Jour., v. 21, p. 1-12.
Lindsley, D. H., Andreasen, G. E., and Balsley, J. R., 1966, Magnetic properties of rocks and minerals, in Clark, S. P., Jr., ed., Handbook of physical constants [revised ed.]: Geol. Soc. America Mem. 97, p. 543-552.
Lowrie, A., and EEcowitz, E., eds., 1969, Kane 9, Global ocean floor analysis and research data series; U.S. Naval Oceanog. Office, v. 1, 971 p.
Offerberg, J., and Tremaine, J., 1961, Re·port on LAMCO .Joint Venture's geological investigations in Liberia between Nimba and Lower Buchanan along the railroad concession area: W-Reklam/Caslon Press Boktr. AB, Stockholm, 74 p.
ORSTOM, 1965, Carte gravimetrique de la C6te d'lvoire ( anomalie de Bouguer) , in Atlas de la C6te d 'I voire: Societe pour le Development Minier de la C()te d'lvoire, 1: 1,000,000 scale.
Mabey, D. R., 1966, Relation between Bouguer gravity anomalies and regional topography in Nevada and the eastern Snake Plain, Idaho, in Geological Survey research 1966: U.S. Geol. Survey Prof. Paper 550-B, p. B108-B110.
Sheridan, R. E., Houtz, R. E., Drake, C. L., and Ewing, l.\1:., 1969, Structure of continental margin off Sierra Leone, West Africa. Jour. Geophys. Research, v. 74, no. 10, p. 2512-2530.
Strangway, D. W., and Vogt, P. R., 1970, Aeromagnetic tests for continental drift in Africa and South America: Earth and Planetary Sci. Letters, v. 7, p. 429-435.
Vacquier, V., Steenland, N. C., Henderson, R. G., and Zietz, Isidore, 1951, Interpretation of aeromagnetic maps: Geol. Soc. America Mem. 47, 151 p.
Van Griethuysen, H. V., 1969-1970, Mineral exploration of W. H. Muller and Co. in eastern Liberia: Geol., Mining and Metall. Soc. Liberia Bull., v. 4, p. 88-95.
White, R. W., 1969-70, Reconnaissance mapping of weathered crystalline rocks in Liberia: Geol., Mining and .Metall. Soc. Liberia Bull., v. 4, p. 1-25 [1971].
--- 1971, Geologic summary of age provinces in Liberia: Geol., Mining and Metall. Soc. Liberia Bull., v. 4. p. 96-106.
--- 1972, Stratigraphy and structure of basins on the coast of Liberia: Liberian Geol. Survey Spec. Pape·r 3, 14 p., 2 pl.
White, R. W., and Leo, G. W., 1969, Geological reconnaissance in western Liberia: Liberian Geol. Survey Spec. Paper 1, 18 p., 1 pl. [1971].
Wotorson, C. S., and Behrendt, J. C., 1974a, Aeromagnetic map of the Zwedru quadrangle, Liberia: U.S. Geol. Survey Misc. Geol. Inv. Map I-777-B, scale 1: 250,000. (In press.)
--- 197 4b, Aeromagnetic map of the J uazohn quadrangle, Liberia: U.S. Geol. Survey Misc. Geol. Inv. Map 1-779-B, scale 1:250,000. (In press).
--- 1974c, Total-count gamma radiation map of the Zwedru quadrangle, Liberia: U.S. Geol. Survey Misc. Geol. Inv. Map I-777-C, scale 1:250,000. (In press.)
Zietz, I., Bateman, C., Case, J. E., Crittenden, M. D., Jr., Griscom, A., King, E. R., Roberts, R. J., and Lorentzen, G. R., 1969, Aeromagnetic investigation of crustal structure for a strip across western United States: Geol. Soc. America Bull., v. 80, p. 1703-1714.
*U.S. GOVERNMENT PRINTING OFFICE: 1974 0-543-586/107