18
Geoprocessing for the NYC Solar Map G. Green, PhD Student Center for the Advanced Research of Spatial Information Prof. Sean C. Ahearn City University of New York

Geoprocessing for the NYC Solar Map
G. Green, PhD StudentCenter for the Advanced Research of Spatial Information
Prof. Sean C. AhearnCity University of New York

Solar Map• Displays solar energy generation potential for NYC, including solar
potential by rooftop or user-drawn polygon, and financial estimates

Source Data• Lidar digital surface model at 1ft resolution• Monthly solar radiation from ESRI model• Building footprints
Sample monthly solar radiation as modeled by the ESRI area solar radiation tool

Methodology• Pre-calculate monthly solar radiation• Extract insolation information for each building
into database• Estimate usable roof area based on lidar• Summarize per-pixel solar radiation information
for user-drawn polygons• Use insolation information as basis for solar
energy potential and energy costs, adjusting for system size, type, tilt angle, system costs, financial incentives, and other factors.
Insolation = incident solar radiation

Issues / Outline• Performance: Area solar radiation calculation is slow,
and there are over 1000 1km2 tiles
• Tile boundaries: Shadows may be cast across tile boundaries
• Calibration and Validation: Solar radiation ground truth for calibration and validation is scarce
• Usable roof area: estimate involves factors that cannot be easily discerned using an automated process; manual process is not possible on over 1 million buildings

Solar Radiation - Performance• Solar radiation calculated at 1 m resolution rather than 1
ft. Per-building results are similar but can be calculated more quickly.

Solar Radiation - Performance• Solar radiation tool run in parallel on a multi-core Linux
machine (courtesy of CUNY High-Performance Computing Center), using ArcGIS server
• Time per tile slightly better than Windows PC, but parallel processing reduces time dramatically (~30 hours total versus estimated ~500 hours)
• Easy to run using python scripts – tiles partitioned into per-processor scripts, each script in its own session.
• For user-drawn polygons, efficiency boosted using pre-calculated solar radiation tiles – no real time geoprocessing.
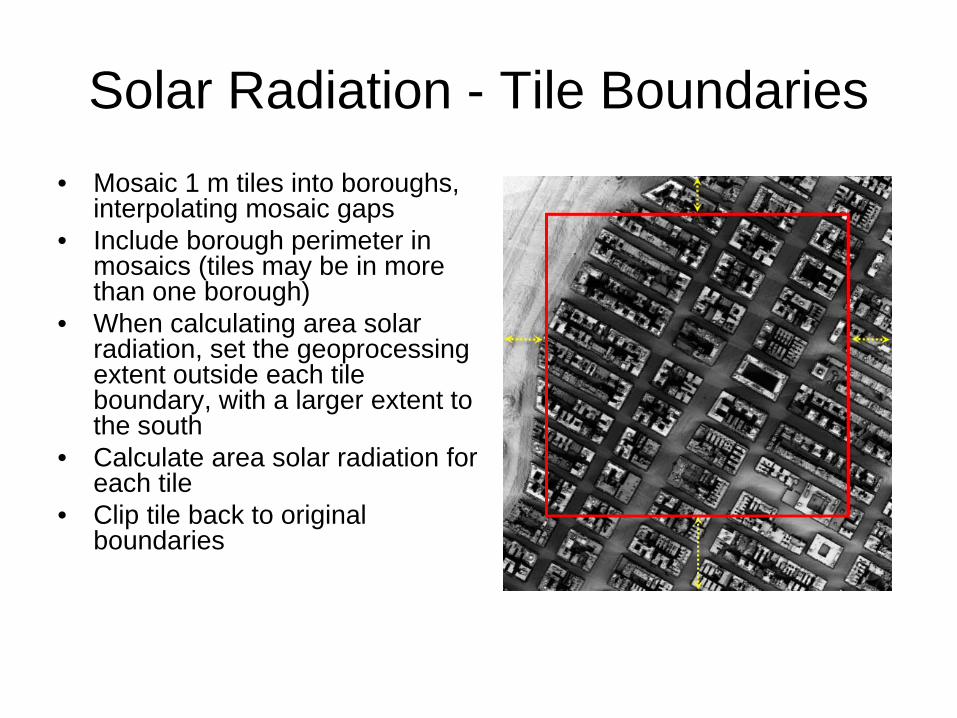
Solar Radiation - Tile Boundaries• Mosaic 1 m tiles into boroughs,
interpolating mosaic gaps• Include borough perimeter in
mosaics (tiles may be in more than one borough)
• When calculating area solar radiation, set the geoprocessing extent outside each tile boundary, with a larger extent to the south
• Calculate area solar radiation for each tile
• Clip tile back to original boundaries

Solar Radiation - Calibration• Adjusted model parameters to match Typical
Meteorological Year data for unshaded flat surfaces• Next, calibrated flat surface results to match TMY3.
Calibration applied to all output.• Problem – little reference data for shaded or sloped
areas.

Solar Radiation - Calibration• Hunter College weather station
• Hemispheric rooftop radiation calculations (Solar Pathfinder)
Solar Radiation - Calculation• Results show fairly good agreement, but we
need more reference data to increase confidence in the estimates
• Solar panel data acquisition systems often include solar radiation measurements, as well as actual power generated
• Next phase of map will incorporate data from these systems
• This will allow map to be more thoroughly validated

Usable Roof Area
• Candidate areas for PV panels must meet requirements based on:– Slope– Obstructions– Minimum insolation– Fire department setback rules– Rooftop doors– Minimum contiguous usable area
• These factors are each difficult to discern even using high-resolution lidar

Usable Roof Area• Solution:
– Manually calculate usable roof area for a sample set of buildings based on aerial photography
– Use some of this data to train a usable roof area algorithm– Use the remainder to test the algorithm
• Factors most useful for the algorithm:
– Building footprints, buffered to approximate setback requirements
– Height, slope, and slope standard deviation thresholds (roughness)
– Insolation threshold– Minimum contiguous area Sample slope raster
Usable Roof Area
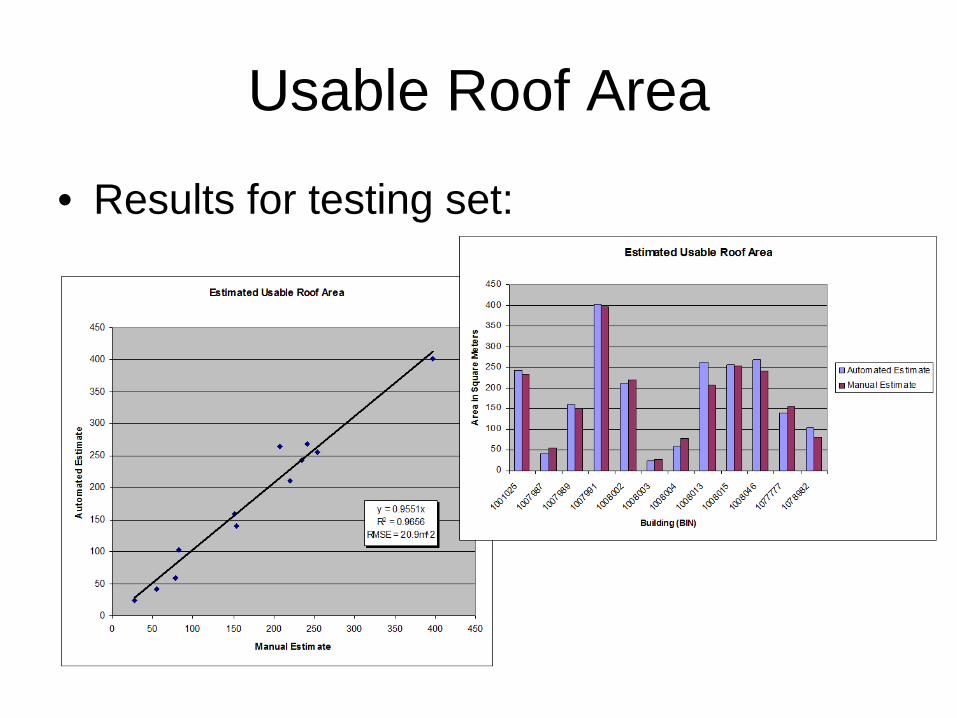
• Results for testing set:

Usable Roof Area
Manual (blue) versus automated (white) estimates
Automated estimates
Calculator
• Estimates used as input for calculator• Shading derate factor - ratio of modeled
solar radiation to TMY3 reference solar radiation for usable area
• Shading combined with PV Watts generation and usable area for (editable) estimated system size
• These drive financial calculations

Other Adjustments• Estimated baseline power generation factors from PV Watts (NREL)
web service for different tilt and azimuth angles.• Distribution of building shading factors reflecting minimum insolation
threshold
NREL = National Renewable Energy Laboratory

Thank you for listening!
Calculation results


