Py EVALUATION OF SEISMIC RISK IN THE TONGA-FIJI-VANUPTU REGION OF THE SOUTHWEST PACIFIC A COUNTRY REPORT: REPUBLIC OF VANUATU , Prepared by: Joyce L. Kruger-Knuepferl, Jean-Luc Chatelain 1 ,2 Michael W. Hamburger , Bryan L. Isacks I , Muawia Barazangi 1 George Hae I , Richard Pr~vot 2 , John Kelleher 4 iDepartment of Geological Sciences Cornell University Ithaca, New York 14853 21nstitut Fraugais de Recherche Scientifique pour le Ddveloppement en Cooperation (ORSTOM) BP A5 Nouma, New Caledonia 3 Department of Geology Indiana University Bloomington, Indiana 47401 4 Redwood Research Inc. 801 N. Humboldt St. 407 San Mateo, California 94401 Report submitted to Office of U.S. Foreign Disaster Assistance; Grant No. PDC-0000-G-SS-2134-00, Evaluation of Seismic Risk in the Tonga-Fiji-Vanuatu Region of the Southwest Pacific 1986
Transcript
Py
EVALUATION OF SEISMIC RISK IN THE TONGA-FIJI-VANUPTU REGION OF THE SOUTHWEST PACIFIC
A COUNTRY REPORT REPUBLIC OF VANUATU
Prepared by Joyce L Kruger-Knuepferl Jean-Luc Chatelain1 2
Michael W Hamburger Bryan L IsacksI Muawia Barazangi1 George Hae I Richard Pr~vot 2 John Kelleher4
iDepartment of Geological Sciences
Cornell University Ithaca New York 14853
21nstitut Fraugais de Recherche Scientifique
pour le Ddveloppement en Cooperation (ORSTOM) BP A5
Nouma New Caledonia
3Department of Geology Indiana University
Bloomington Indiana 47401
4Redwood Research Inc 801 N Humboldt St 407
San Mateo California 94401
Report submitted to Office of US Foreign Disaster Assistance Grant No PDC-0000-G-SS-2134-00 Evaluation of Seismic Risk in the Tonga-Fiji-Vanuatu Region of the Southwest Pacific
REGIONAL BACKGROUND INFORMATION 13 Historical Earthquakes in the Vanuatu Region 13
SUMMARY OF FACILITIES AND PROGRAMS 19 Critical Facilities 19 Earthquake Preparedness Programs 21 Seismological Facilities 21 Strong-Motion Accelerographs 23 Related Research Programs 24
PREVIOUS STUDIES 24 Seismicity Studies Along the New Hebrides Arc 24 Seismic Potential Studies Along the New Hebrides Arc 45
ASSESSMENT OF EARTHQUAKE HAZARD 50 Seismotectonic Provinces 50 Ground Motion 54 Tectonic Uplift 61 Tsunamis in Vanuatu 61 Volcanic Eruptions in Vanuatu 66
IMPLICATIONS FOR MITIGATION OF EARTHQUAKE RISK 66 Earthquake Education 67 Building Codes 68 Emergency Civil Defense Procedures 68 Long-term Seismicity Observations 70 International Cooperation 70
REFERENCES 76
APPENDIX I DEFINITIONS 81
APPENDIX II MODIFIED MERCALLI INTENSITY SCALE (1956 VERSION) 84
APPENDIX III EARTHQUAKE EDUCATION PAMPHLET PUBLISHED BY FIJI MINERAL RESOURCES DEPARTMENT 86
APPENDIX IV TSUNAMI SAFETY RULES 98
APPENDIX V TSUNAMI SAFETY RULES 118
ii
EXECUTIVE SUMMARY Overall Program
This country report is a summary of our contribution to a long-term program to evaluate earthquake risk to the islaid countries of Tonga Fijiand Vanuatu in the Southwest Pacific These countries are located within one of the most active belts of seismicity in the world and seismic hazard in these countries has been largely neglected in national planning and development programs The fundamental contributions of our inv7estigations include (1) analysis of regional seismicity and seismotectonic data (2) maintenance and improvement of seismological facilities in the region(3) establishment of a regional network of strong-notion accelerographs (4) initiation of regional cooperation between national and international agencies working in this region and (5) training of national technical and scientific personnel Our investigations in Vanuatu have been carried out through cooperative work with ORSTOM
Earthquake Potential We have subdivided the New Hebrides Island Arc into four zones of
seismic potential based on the available seismicity data Zone 1 is the central portion of the arc where no trench is present and is assigned a maximum probable magnitude of M 7 34 Zone 2 and Zone 3 include the northern and southern portions of the arc where the trench is present and are assigned a maximum magnitude of Ms 8 Zone 4 is the back-arc region and is assigned a maximum magnitude of Ms 7 12 Other zones of potential in the region are Zone 5 which refers to the Hazel-Holmes Fracture Zone which is assigned a maximum magnitude of Ms 7 and the North Fiji Basin which is assigned a maximum magnitude of Ms of 6 12
Tsunami Hazard
The history of earthquake-generated tsnamis in Vanuatu indicates a possible hazard to Vanuatus population Tsunamis are of particular concern in low-lying coastal areas with concentrations of population While tsunamis are not generated by all earthquakes they must be considered a possible effect of all major earthquakes that occur in submarine areas that lie near the islands Real-time monitoring of seismic activity combined with an active tsunami education program cculd significantly aid in tsunami risk mitigation
Conclusions and Recommendations We recommend that (1) an earthquake and tsunami education program be
adopted and combined with other disaster preparedness programs (eg hurricane floods and so on) (2) adoption of more stringent building codes for all of Vanuatu is strongly recommended (3) long-term seismicity and strong motion observations be continued in order to refine estimates of seismic potential (4) regional cooperation among the island countries of the Southwest Pacific be encouraged in order to assist in Vanuatus earthquake preparedness piogram
INTRODUCTION
The island countries of the Southwest Pacific are subject to natural
disasters including earthquakes volcanic eruptions and tsunamis which
threaten human life and property every year Geological and geophysical
observations indicate that these natural disasters are manifestations of
continuous geological processes the inexorable movements of ti- earth
guarantee that they will continue to occur in the future
The Southwest Pacific region is the source area for a large percentage
of the worlds seismicity Approximately seventy percent of the worlds
intermediate and deep earthquakes occur in this region A large number of
great shallow earthquakes have taken place along the convergent plate
boundaries that affect New Zealand Kermadec Islands Tonga Vanuatu
Solomon Islands and Papua New Guinea
Normally public attention focuses on emergency and rescue operations
once a disaster has taken place While little can be done to prevent
earthquakes or volcanic eruptions from occurring significant steps may be
taken to minimize the destructive effects of such disasters Scientists
are striving to better understand what causes these phenomena and to learn
what measures might be taken to mitigate their destructive nature This
report is a summary of the available scientific data tihat help constrain
the potential for destructive earthquakes that may affect the populated
areas of Vanuatu The report is by no means the final analysis of
earthquake hazards in Vanuatu it is however a synthesis of available
seismic information that provides a basis for judicious engineering
planning and civil decisions in the years to come Definitions of some of
2
the technical terms that will appear in this report are contained in
Appendix I
The ultimate aim of earthquake hazard programs--mitigation of human
and economic losses due to earthquakes--involves prediction of the
frequency of occurrence and intensity of strong ground motion produced by
future earthquakes of specific magnitudes in the vicinity of any given
site These predictions are often summarized in the form of seismic zoning
maps and microzonation which give th spatial distributions of the
following parameters maximum intensity of shaking engineering design
codes maximum acceleration of ground motion (velocity displacement) for
given return periods of earthquakes of a particular size or seismic risk
(which relates to the expected human and property losses from
earthquakes) In this report we focus on the fundamental seismological
observations that will provide the basis for more applied engineering
studies of earthquake risk in Vanuatu
The Republic of Vanuatu is located close to a major seismic zone with
an historical and instrumental history of earthquakes with magnitudes as
large as 80 (Isacks et al 1981 Marthelot 1983) In this tectonic
environment we are mainly concerned with the large shallow thrust-type
earthquakes which accompany major rupture of the plate iaterface While
this type of faulting is responsible for the worlds largest earthquakes
(eg Aleutian 1957 Chile 1960 Alaska 1964) there appear to be
tectonic limitations on the maximum size of the thrust events These
limitations appear to be related to coupling between plates and lateral
heterogeneities in the plate interface (Kelleher et al 1973 Lay and
Kanamori 1981) In the Vanuatu region the rupture length may be limited
3
by major lateral variations on both the upper and lower plates (Isacks et
al 1981 Chatelain et al in press)
Although Vanuatu is not heavily populated or industrialized its
proximity to a seismic zone leaves it particularly vulnerable to the risk
of earthquake damage Most of the damaging earthquakes come from the
inter-late zone beneath and trenchward of the islands although back-arc
and intermediate depth earthquakes are also felt The capital city of Port
Vila is now uder increasing development pressures The construction of
multi-storied buildings to accommodate the increasing urban populations and
tourism as well as other essential structures such as dams and power
plants pipelines schools and hospitals adds to the immediacy of the
problem of earthquake risk
Past disaster associated loss of life in the Republic of Vanuatu
resulting from earthquake hazard has been relatively limited but the
increasing urban concentration and industrial development raises the
potential human and economic losses brought on by a large earthquake
occurring in the immediate vicinity These losses are usually the result of
the collapse of man-made structures and can be substantially reduced by
adequate engineering precautions To date more deaths in Vanuatu have been
caused by cyclones than by earthquakes although material damage has been
fairly severe from shaking landslides or tsunamis produced by earthquakes
TECTONICS AND GEOLOGY
Plate Tectonic Setting
The Republic of Vanuatu lies along a portion of what is commonly
called the Pacific Ring of Fire The concentration of earthquakes
(Figure 1A) and volcanoes (Figure 1B) along this trend were used to
- -
- i
UA
- 4
w SI or
Figure1 World distribution of tA) earthquakes and (B) volcanoes (C)
Configuration of the major tectonic plates on the earths surface (Turcotteand Schubert 1982)
5
establish the boundaries of the lithospheric plates in the modern view of
plate tectonic theory (Figure 10) These plates which are relatively
rigid cover the surface of the earth like a mosaic of rigid caps and move
against each other by sliding (1) past at a transform fault (2) over at a
convergent margin (such as subduction at a deep sea trench) or (3) apart
from one another at a divergent margin (such as spreading at a mid-ocean
rift) Figure 2 shows schematically the spatial relationship of these
different types of boundaries Convergent plate boundaries are responsible
for the majority of the worlds large earthquakes and most of the worlds
tsunamis Many volcanic arcs form parallel to these deep-sea trenches
above the point where the subducted plate reaches about 100 km depth
(Isacks and Barazangi 1977) The relative motion of two convergent
lithospheric plates may be accumulated over a time period of tens to
hundreds of years and then released in large earthquakes or aseismic creep
(motion without earthquakes) may occur instead of earthquakes The area
over which the descending and over-riding plates interact the age of the
sea floor the topography of the sea floor and many other factors appear to
influence the recurrence interval and the size of earthquakes along the
interplate zone
The New Hebrides island arc trends linearly south-southeastward from
IIdegS to approximately 20degS (Figure 3) The northern end of the trench
bends sharply westward to merge with the east-west trending Solomon Trench
The southern end of the trench curves around eastward to merge with the
east-northeast trending Hunter Fracture Zone The arc is a component of
the Melanesian Borderlands that form the boundary between the
Indo-Australian and Pacific lithospheric plates (Figure 4) This
6
AS
M E S
T H
0
E
S
N
P
0 S
H
P H
E R
R
E
ridge
trnsIr
trench
Noauii
-
bull
q
transom al
Figure2 (A) Sketch of the different types of plate tectonic boundariesand their relationships (Isacks et al 1968) (B) Diagrams of the threetypes of boundaries in three dimensional view (Calder 1972)
1600
SOLOMON IS
1650
-
1700 E 1750
PACIFIC OCEAN
1800
100 o
0
-~ ~
1jN~CH
~ A
Ko
$SATA CRUZ IS
-10- K~10
J-shy
ltK14
TitCASTECS
is
k)tANKS
S A ME O
L AMBRY MALEKULA V
FI JI PLATEAU
150
FIJI is
~o eANGO d
250 3 ATT E UNTE PJC
160c 1650 1700 E 1750 1800
Figure 3 Bathymetric map of the New Hebrides Island arc and thesurrounding region taken from Mammerickx et al 1971 The filledtriangles denote Quaternary volcanoes Contours are in fathoms
1600 E 170 1800 W 170 deg 8
CENTRAL PACIFIC BAIN
S040
NOTH2
0
AMOA 0
200
BASIN
bull
o 0
BASIN
FIJI
f d
S 0 BASIN a O
INDV USTIRAL
oamp PLATE
0 ASA
BASIN
r
0
NEW t~Z EALAND
CHAT 11A M
R S
150 160 E 170 180
-a A S
0
30 PACIFIC PL ATE
SOUTHWESiT
PACIFIC 0
BASIN 0
40shy
1700 W Figure 4 Regional setting of the Southwest Pacific Tectonic and morphoshylogic features of the PacificIndo-Australian plate boundary Open arrows indicate direction of relative plate convergence Contour line shows 2-km isobath Holocene volcanoes are indicated by open triangles Data on bathymetry seismicity volcanoes and plate motions are taken from the Circum-Pacific Council for Energy and Mineral Resources (1981) map
9
intra-oceanic arc is unusual in that the subducting slab dips toward the
Pacific Basin The Indo-Australian plate is being subducted at a rate of
approximately eleven centimeters per year (Dubois et al 1977 Pascal et
al 1978 Isacks et al 1981) in a direction perpendicular to the trench
(Isacks et al 1969 Johnson and Molnar 1972 Pascal et al 1978)
Relative to other convergent plate boundaries (eg Chile and Alaska) the
width of the zone of interaction between these two plates is limited to
approximately 50 km in extent because the subducting (Indo-Australian)
degplate is steeply downbent (70 ) at intermediate depths This geometry
produces a narrow ribbon of potentially damaging seismicity rather than a
large region of seismicity The northern and southern portions of the arc
are typical of arc-trench systems but the central portion exhibits several
unusual features (1) The bathymetric expression of the trench is obscured
between 13degS and 17degS where a submarine ridge known as the dEntrecasteaux
Fracture Zone intersects it at approximately 16degS (2) The upper plate
protrudes westward in this central portion of the arc such that the western
coast of Malekula Island is located where the inner slope of the trench is
normally positioned (Karig and Mammerickx 1972 Isacks et al 1981 see
Figure 3)
Shallow Vanuatu earthquakes (Figure 5) are located in the interplate
zone between the two plates They are associated with slippage of the
Indo-Australian Plate as it descends beneath the Pacific Plate Intraplate
earthquakes also occur within the descending and overlying plates in the
trench region and behind the island arc in what is known as the back-arc
region An actual and a schematic vertical cross section near Tanna
perpendicular to the trend of the arc is representative of the
10
1600 E 1700 180 W 1700
I 0 s ee 0 0o
2e 01
6 S
20
30S $
S4b
0
3040 30
4S
400
1 2 40
150 1600 E 1700 I80 170 W
Figure 5 Regional setting of the Southwest Pacific associated with the plate boundaries in this region
Shallow seismicity
relationship of the seismicity to the trench islands and back-arc region
(Figure 6) In Vanuatu earthquakes occur from near the surface to
approximately 300 km depth The earthquakes systematically deepen
eastward from the New Hebrides Trench forming a narrow dipping plane
under islands located in the central portion of the arc and intermediate
depth earthquakes occur-progressively farther eastward Large (Ms gt 7)
earthquakes but few great (Ms 7 34) earthquakes have occurred along
the island arc as a result of the subduction of the Indo-Australian plate
In spite of the anomalous protrusion of the upper plate in the central
part of the arc the Benioff zone and convergent plate boundary appear to
be relatively uniform in configuration and continuous along the entire
length of the arc (Pascal et al 1978 Isacks et al 1981) The linear
distribution of the islands of Vanuatu and their location so close to the
main interplate thrust zone of the convergent plate margin result in a
geometry that is uniquely suited for subduction zone studies in comparison
to most other subduction zones on earth This also results in a unique
earthquake hazard in central Vanuatu Behind and eastward of the New
Hebrides island arc lies the North Fiji Basin (Figure 4) where the presence
of shallow seismicity (Figure 5) fresh basalts little sedimentation
(Karig and Mammerickx 1972 Luyendyk et al 1974) and high values of
heat flow (Sclater End Menard 1967) indicate active tectonism The Vitiaz
Trench forms the northern boundary of the North Fiji Basin and represents
the site of an old subduction zone that existed before the modern New
Hebrides arc formed Subduction (of the Pacific Plate) ceased at the
Vitiaz Trench sometime in mid-Miocene (Falvey 1978) or earlier (Chase
12
NEW HEBRDES VOLCANIC TRENCH ARC CORIOLIS
SW 4 TROUGH NE 00Z_shy
- _shy 2
-vQ 100- DESCENDING
PLATE ~ ~SEISMICf
ZONE -Ishy
200shy
300 00 100 200
DISTANCE KM
Figure 6 A schematic cross secion showing the region where shallow and intermediate-depth earthquakes were recorded (inclined lines) and the inferred geometry of the descending plate beneath the southern New Hebrides arc The inferred geometry of the interplate thrust zone is partly based on the slip vectors (short solid lines) of the shallow thrust-type focal mechanisms The Moho discontinuity of the overriding plate estiated from refraction and gravity studies is also shown (Condert et a 1981)
13
1971 Mitchell and Warden 1971 Karig and Mammerickx 1972) and resumed at
the modern New Hebrides Trench with the opposite polarity (Indo-Australian
Plate underthrusting beneath the Pacific Plate) Deep earthquakes are
still recorded near Vanuatu that result from this episode of subduction
The New Hebrides arc has migrated away from the trend of the older Vitiaz
Trench to its present position (Hamburger 1986)
Geolc-ical Setting
The islands of Vanuatu are volcanic in origin with older islands
fringed or capped with reefal limestones In the central region of the
arc the single chain of islands gives way to a more complex structure
(Figure 7) (1) the eastern Miocene-Pliocene chain with tholeiitic and
calc-alkaline volcanoclastics includes the islands of Maewo Pentecost
Efate and parts of Epi (2) the slightly older western Oligocene-Miocene
chain includes the islands of Santo Malekula and the Torres and (3) the
central late Pliocene-Recent portion contains active aerial and subaerial
alkaline volcanics (Mitchell and Warden 1971) The volcanic rocks of the
western chain are similar to slightly more acidic composition than the
eastern chain Local outcrops of ultramafic rocks are found in several
places in the eastern chain
REGIONAL BACKGROUND INFORMATION
Historical Earthquakes in the Vanuatu Region
An accurate evaluation of the earthquake hazard for a particular
region includes a survey of historical seismicity in the region in
question Historical earthquakes are important because they help to better
determine the potential size frequency of occurrence and possible effects
of future earthquakes
14
170
Tinakula
xd
Torres Is e
Vat Gonoi
Vanua Lava
b Gauagp Merig
- --- -4
- --- Santo Moewo NOR TH
DENTRECASTEAUX FZ ===== Pentecost FIJI
-- tMae ku v Ambry m BASIN
-p -E
0 ioo 200 Km
o Erromang -A IWA
U) TANNA FUTUNA -A
~ANEITYUMOVOLCANIV ASSOCIATIONS 7 UPliacene- Recen- (Central Chain) UMiocene- L Pliocene
Effi (Eastern Belt) ~UOIlgocene - MMiocene
1plusmnZ (Western Belt) Di ofDip ofTune Matthow TECTONIC ELEMENTS selomic zoneHunter
1r~7Uplifted volcanic ridge
~B c- bsn Major fracture zone - -Bock -aorc basin NF -
Zone of flexuring Sedimentary basin and faulting
I I K KIRI
Figure 7 Geology of New Hebrides Arc (Carney and Macfarlane 1979)
15
The earliest reports of earthquakes in the Vanuatu region is a series
of earthquakes which began on 28 March 1875 and were felt on Anatom
(Mercalli intensity VIII-IX for the largest event) and Erromango and in the
Loyalty Islands of Lifou Mare and Ouvea (lida et al 1967) On 10
January 1878 a tsunamigenic earthquake associated with the eruption of
Yasowa Volcano Tanna was felt in Port Resolution Tanna Another strong
tsunamigenic earthquake occurred on 11 February 1878 associated with
another eruption of Yasowa Volcano
Since 1900 5 great earthquakes (Ms gt 7 34) and 52 major earthquakes
(7ltMs lt 7 34) have occurred along the arc (McCann 1980) However the
great earthquakes that occurred near the turn of the century are not
well-constrained in size or place and their magnitudes were probably overshy
estimated (due to the way in which the magnitudes were calculated)
Moderate-sized earthquakes are distributed throughout the arc (Figure 8C)
but the largest events are more clustered especially in the northern
portion of the arc (Figure 8B Marthelot 1983 and Figures 9A and 9B
McCann 1980) There is a distinct gap in the seismicity at the point
where the dEntrecasteau Ridge intersects the line of the trench
Because the occurrence of shallow earthquakes near population centers
are of greatest concern for earthquake hazard in this report we have
focussed on shallow earthquakes near the main islands of Santo Malekula
and Efate in the central portion of the arc Maps of shallow seismicity
(depth lt 70 km) of the region based on the US Geological Surveys
Preliminary Determination of Epicenters (PDE) catalog for the period
1961-1981 are shown in Figure 8B and 8C (from Marthelot 1983) This
with bewen70 and10 Kin sqars betee 10deth andK2N00Kin FriaguresMpete island)arceV00anuat (ail) hongnrhto the argha
std itriagebetween00 and 3e0vkn locte (1) the acnceaoneo largesxise of thereshlwents nthe trnhahrcal diappeanras i thetareshalwents nthe norheialof the arnhh ih thetarch thapconraspuato he acthe reanqig mapis ho the dstrutiorn oaf2thepuxaprton ofearcTive reanqiet regis inothe dsorutrnhaf2the
haviencanue largetthand5an3) earthquakeintermediate-depthofrnestshanppresencanue of intermediate-depth3 ctivitye
17
9 194 (74) s-AFTERSHOCK ZONE
ft 1 (827 _RECOMFUTED OR 2RECENT EVENT
1914 ) EPICENTER
1944(7) 0-FROM
GUTENBERG AND (73) RICHTER
1 7 bull__ EPICENTER FROM RICHTER
192 (7O)(21 ( i9 1945()2)
j50 21926 (71)150 01928(71)
1946(70) 1927 (71)
1903(75)
1944(73) 1925 (76) 2 18754
~ 1878
200 1920(80O 94943(72)
4875 1923(70) 1944(72)
70737 1z945 I941943(757372) shy
1904 (84)
1928(75) 1926(70)
1917 (71)
250 6 I 165 0E 1700 1750
Figure 9A Map showing locations of large (Ms gt 7) and great (Ms gt 7 34)historical earthquakes along the New Hebrides Trench for the time period1900 to 1950 (McCann 1980)
18
I I
Io 953 1963 (73 73)
1966(7473)
19617(70)
9195304) 20 I 1972 (71)
651965(70)197
7150 (7 7 2 1958 (72)
--- 1965 197(71)-
F7873s) od
19616 1 A
2 00 1950 (70727072)
ID
165degE deg170c 1750 Fig~ure 9B Map showing locations of large (Ms gt 7) and great (Ms gt 7 34)historical earthquakes along the New Hebrides Trench for the time period1950 to 1979 (McCann 1980)
19
figure illustrates the dense concentration of interplate events close to
and landward of the New Hebrides Trench
Very little information exits concerning the effects of strong
earthquakes prior to 1961 apart from a few sketchy damage reports The
location accuracy of earthquakes was improved in 1961 Before this time
locations were located to the nearest tenth of a degree and magnitudes were
considerably over-estimated The last major seismic episode of interplate
slippage in central Vanuatu occurred in a sequence of earthquakes in August
1965 (Figure 10) which accumulated a total seismic moment equivalent to a
single magnitude Ms - 77 event (Isacks et al 1981) The 1965 Santo
earthquakes caused significant damage to buildings wharves and bridges in
Luganville on Santo Island and major damage to buildings and water tanks in
Norsup and Sarmet on Malekula Island (Pr6vot and Chatelain 1983)
Coseismic tectonic uplifts on Malekula Island were also measured in
association with the 1965 earthquakes (Figure 10) Over 1 meter of uplift
was detected for the 1965 earthquake sequence (Taylor et al 1980)
Only one sequence of earthquakes has been relatively damaging since
the Cornell-ORSTOM network began operating in 1978 The Mere Lava
earthquake (Ms 61) occurred on 12 May 1980 at 14800S and 16782degE and a
depth of 23 km The worst damage from this event was caused by landslides
SUMMARY OF FACILITIES AND PROGRAMS
Critical Facilities
Port Vila with a population of 15088 in 1979 is the administrative
and commercial center of the country There are a number of multistory
buildings in the capital and most of Vanuatus tourist industry is located
2
1970
140- )O AN OCT
JAN 19731974 0 00-
MAY 0
0--- 1965
S 9000 97150K 15deg AU61973 NOVV
1974
600 x OCT
4 1971 AUG 01966
171965
160shydeg 1 - - 2000
Ms S73 -77
63 -67
0
0
58-62170 1- 1 -_0 1660 1670 E 1680
Figure10 August 1965 earthquake sequence (from Isacks et al 1981)
21
in and near Port Vila A large shipping wharf is located near the center
of the city on Vila Bay
Apart from Port Vila the only significant development in Vanuatu is
at Luganville on Santo Island (pop 5116 in 1979) It remains an
important economic center for the country with agricultural processing and
shipping facilities located there There are several three- and four-story
buildings in the center of Luganville
Earthquake Preparedness Programs
As of late 1983 the Government had requested the assistance of a
consultant from New Zealand to help provide uniform building codes for the
country The Public Works Department enforces New Zealand seismic zone B
codes to construction of public buildings Large buildings for the most
part are designed by overseas engineering firms and generally comply with
the earthquake design standards Smaller buildings are generally designed
close to the New Zealand loading specifications but there continues to be
great difficulty in supervising construction projects
There is no large-scale earthquake education program in Vanuatu
Materials have been prepared by ORSTOM seismologists for distribution to
teachers public officials and planners involved in earthquake hazards
(eg Prdvot and Chatelain 1983)
Seismological Facilities
Seismological observations are necessary to the accurate location
study and ultimate prediction of earthquakes Seismic stations were first
established in Vanuatu in the mid-1960s by the French Office de la
Recherche Scientifique et Technique Outre-Mer (ORSTOM) Staion PVC in
Port Vila has operated continuously from 1964 to the present while LUG in
22
1680 1700140 1660 1670 1690 deg 140
GAUAP FIJI
PLATEAU 0
deg ~ HOG MAEWO -15 150 AOBA
2000 SANTO AB
MAP PENTECOST
160 A MT AM8160A= A 13AMBRYM-16
DENTRECASTEAUX OJi= LMP EPIP1FRACTURE ZONE
170 EME 170 EMAINGOUNA
NGAoS L E_ EFATE
RTVDvpP 18o 0shy180 -
o -180 z 0
o ERROMANGO
190 - Rk90R-190
TAN AN~o 4 FUTUNA
AUSTRALIAN oshy0 0TANNA
200 PLATE ANATOM 0 200
0 0
1650 1660 1670 E 1680 1690 1700
Figure 11 Map showing the seismograph stations in Vanuatu Circles arestations telemetered to the base station PVC on Efate island andunderlined stations have two components--one horizontal and one vertical The triangles are older ORSTOM stations INH and LUG are no longeroperational Strong motion instruments are located at SWB and LMP onMalekula island DVP and PVC on Efate island and LUG on Santo island
Luganville Santo operated through 1980 A third station on Tanna Island
(INH) operated through 1978 Cornell University began cooperative field
programs with ORSTOM in 1975 with a microearthquake experiment on Santo
Island An ocean-bottom seismograph experiment was carried out in southern
Vanuatu in 1977 and in central Vanuatu in 1978 The Cornell-ORSTOM
telemetered seismic network was established in 1978 and has operated
continuously since that time The seismic network now includes 19
telemetered stations (Figure 11) to date over 20000 earthquakes have
been recorded by the network A permanent ORSTOM mission is now based in
Port Vila and takes primary responsibility for day-to-day maintenance of
the network The availability of continuous earthquake monitoring in
Vanuatu is an important component of any earthqi-ke or -arthquake hazard
study for the country Figure 12 shows the seismicity level (magnitudes gt
4) recorded by the Worldwide Seismograph Station Network (WWSSN) Compare
these results with the increased sensitivity (magnitude gt 25) and location
accuracy of the regional Cornell-ORSTOM network which is shown by better
definition of seismic zones in Figure 13 These network data clearly
define the heterogeneous distribution of seismic activity in the central
portion of the arc
These seismological facilities are complemented by studies of ground
deformation using seven bubble-level tiltmeters a two-component longshy
baseline water tube tiltmeters and two levelling arrays
Strong-Motion Accelerographs
As part of the present program of seismic hazard evaluation in
Vanuatu Cornell and ORSTOM have installed five strong-motion
accelerographs on the islands of Efate Malekula and Santo (Figure 11)
__
5 t~j24
0 - 70km
o0 a 0 70-150km 0 C J
5 S S - 0 0 shy
-150-300km
a 0 o 300-700km
0
15S 4 -
bull7 -06 ----
SS
bull bull S
bull iilIIle
Figure I9 1p 4D JE l o shybull =r-
5 NO a~ 40
20 1 a
~ ~- 20Smbull 5m
- S r S st
16 E5 170 E~
165EI bull =W
Figre 2 Epcenresde sesme lcasspa er ea onia de sttos-16-1) PDE ocaionsofvent (167-182) vtand 1983)-- ha-la
25
PROFONDEUR - DEPTH 0 - 70 Km
E
05 0
EE
03 4 3
0I
Figur 13Siete e ~se bulloai~pa le rieuOSO-ONEL(918)
00i
oA
Fi3r1N
a
0--
E iete e e Icls sp rl dspeuOR T M C R E L(9 8 1 8 )
26 These acce2erographs complement the other instruments being used to study the seismicity in the region The accelerographs record the ground accelerations at a particular site fiom an earthquake strong enough to trigger the instrument To date these instruments have already been triggered by five moderate-sized shallow events and will be used to provide a basis for prediction of local ground motion induced by large interplate earthquakes in Vanuatu The high level of seismicity along this plate boundary suggests that a valuable baseline of strong-motion data can be collected in a relatively short period of time
Related Research Programs
The seismology program is carried out in cooperation with the Vanuatu Department of Mines Geology and Rural Water Supplies They are responsible for regional geology studies resource assessment detailed mapping and hydrological activities In addition ORSTOMs geology and geophysics department based in New Caledonia carries out an extensive
program of investigations covering submarine morphology marine geology and geophysics island geology and crustal structure The US Geological Survey has undertaken a series of detailed marine studies in the central and northern portions of the island arc using the research vessel SP Lee (1982 and 19F4) A detailed hydrographic survey was carried out in coastal waters by Australian researchers A tide gauge is maintained by the ORSTOM
mission in Port Vila (Pr6vot and Chatelain 1983)
PREVIOUS STUDIES
Seismicity Studies Along the New Hebrides Arc
Seismicity studies of the New Hebrides Arc by Isacks et al (1981) found that major bathymetric and structural complexities divide the central
27 part of the arc into segments approximately 100 km long The segment near
Santo and northern Malekula islands ruptured during two complex sequences
of events occurring in August 1965 and in late December 1973 through early
January 1974 (Table 1) In contrast the segments near the southern part of Malekula and Efate islands may not have ruptured during the past 75
years Moreover between southern Malekula and Efate islands the
orientation of the horizontal compressive stress within the upper plate
changes from a direction perpendicular to the arc to a more complex and
variable pattern found in the southern portion of the arc
Since the Cornell-ORSTOM network was established in 1978 10 moderate
(58 lt Ms lt 7) earthquakes have occurred within the network (Table 2) A
description of the seismicity recorded by the network follows
(A) Fore- and Aftershock Sequences of the August 1979 and July 1981 Main
shocks
(1) 17 August 1979 Sequence Figures 14A and 14B show earthquakes in the foreshock sequence of the 17 August 1979 earthquake The spatial and
temporal development of this activity was described by Isacks et
al [1981] This section provides a more detailed analysis of a longer
period of time A small zone near the epicenter of the 17 August
earthquake was intermittently active during late June - early July 1979
(Figure 14A) The more immediate foreshock sequence (Figure 14B) started
eight days before the main shock and consisted of five groups of events
Each group of foreshocks began with an earthquake having a magnitude
between 42 and 49 and each was followed by a number of small
aftershocks The first foreshock cluster was located just landward of the
trench Each successive cluster migrated in time northeast toward the
Relocations with all available teleseismic and local data for 1978-1981events except 27 Jan 1979 [Bulletin of the International SeismologicalCentre (ISC) location] remaining locations based on local data only 2Ms surface-wave magnitude taken from Monthly Bulletins of the PreliminaryDetermination of Epicenters (PDE)3MO seismic moments reported by Chinn and Isacks [1982] or in Monthly
Bulletins of the PDE (1981-1985 events)
4Mw is calculated from M0 by Mw - (115) x (log(Mo)-161)
17
0 0 0
0CD 00 aVm01 83 0 0 0
00 0 00 3
0 00 0
000 0 0
167 E 168 0 E
169 167 E
168 0 0
169 167 E 0 1
168 169
Figure 14 (A) Early foreshocks of the 17 August 1979 main shock (shown as a filled square) that occurredat the end of June to the beginning of July 1979 Island contours and 6 km bathymetry are shown (B) Lateforeshock activity preceding the 17 August 1979 earthquake Foreshocks migrated from the trench toward thelocation of the main shock (C) Foreshocks preceding the 15 July 1981 earthquake 0o
31 epicenter of the main shock The foreshock sequence ended with a very
intense concentration of seismicity near the 17 August 1979 main shock
epicenter The final foreshock cluster began eight hours before the main
shock and continued until the region became seismically quiet three hours
before the main shock The main shock occurred at the northeastern end of
these clusters
The development of the aftershock activity in Figure 15 is shown for
two time intervals during the nine days following the main shock During
the first day the aftershocks were initially located close to the epicenter
of the mainshock and rapidly expanded towards the west At the end of this
day aftershocks occurred as far north as the site of the 26 August main
shock and as far south as about 181degS (Figure 15A) Most of the increase
in the aftershock area occurred during the first day as can be seen by
comparing Figures 15A and 15B To the north the expansion of the aftershy
shock zone stopped near the epicenter of the next main shock of the
sequence that occurred nine days later on 26 August In the south aftershy
shocks were located in the same zone defined by the early foreshocks (also
see Figures 18C and 18D)
(B) 26 August 1979 sequence The development of the 26 August
aftershock zone (Figure 16) shows very similar patterns to the development
of the 17 August aftershock zone The activity developed very rapidly
during the first two days following the main shock (26 -- 27 August)
Then as in the case of the 17 August aftershock sequence the cumulative
sequence occupied an area larger by a factor of 2 or 3 than the one
expected for an earthquake of such magnitude [Isacks et al 1981] The
main shock was located on the southern edge of the aftershock zone -- the
aftershock activity developed to the north east and west only while the
aftershock zone of the 17 August event was nearly inactive (Figures 16A
16B) By 27 August aftershocks were located as far north as the epicenter
of the future 15 July 1981 earthquake and as far west as the New Hebrides
32
17
oA B
00
00
18 - 0o - 0 0
0 0
00
167 E 168 169 167 E 168 169
Figure 15 Maps of epicenters showing the development of the 17 August1979 aftershock sequence Format as in Figure 14 (A) 12H59M 17 August1979 to 12H59M 18 August (B) 13HOOM 18 August to 11H46M 26 August(to just before the 26 August main shock)
17
180 0 ogI0
0 00 o0
CP 00 000
0
0 0 0 8V
0 00 0 0(0 0
0 0
C0 0
C 0
167 E 168 I0
159 167 E 168
0
169 167 E
e l 0
168
_o
169
Figure 16 Maps of epicenters showing the development of the 26 August 1979 aftershock sequence Formatas in Figure 14 (A) 11H47M 26 August 1979 to IIH47M 27 August (B) IIH48M 27 August to IIH47M4 September (C) 1lH47M 4 September to IIH47M 26 October 1979
34
trench The aftershock zone ends very abruptly to the north along a
sharply defined east - west trending line which passes close to the
epicenter of the 1 September 1978 earthquake (Figure 18A) After the first
two days the level of aftershock activity decreased rapidly During the
entire period from the main shock to 14 September the aftershock zone of
the 17 August earthquake remained relatively quiet (Figures 16A 16B)
From 15 September to about mid - October both the 17 August and the 26
August aftershock zones were reactivated (Figure 16C) although the level of
activity was much lower than that during the days immediately following
each of the main shocks During this later period some activity occurred
in the back-arc region Northeast of Efate Island a small intense cluster
occurred in 1979 followed by shallow events spread around Efate Island
(Figure 16C) The level of activity then decreased and by the end of
October was back to a more normal background level of seismicity in the
entire region
The two aftershock zones of the 17 and 26 August 1979 earthquakes are
contiguous with some overlap in the area between the two epicenters (Isacks
et al 1981 Chatelain et al 1986) Chatelain et al (1986) show tiat
this area plays a key role in the development of the seismicity in ne
Efate region
(3) The 15 July 1981 earthquake In contrast to the 17 August 1979
earthquake no outstanding foreshock activity occurred prior to the 15 July
event Small clusters occurred on 5-6 and 12 July (see Figure 14C) Both
clusters included few events although each started with a magnitude (mb)
50 earthquake The larger of the two occurred on 12 July near the pending
main shock epicenter In contrast to the 17 August 1979 case no unusual
35
concentration of activity was noticed in the epicentral region during the
months immediately preceding the main shock Possible long-term precursory
activity may be the clusters observed in March and June 1980 and are
discussed in the next section
Figure 17 illustrates several outstanding features of the aftershock
sequence of the 15 July earthquake First an intense zone of activity
develops during the first day and continues throughout the sequence (Figure
17A) This zone is coincident with the aftershock zone of the preceding 26
August 1979 event (compare Figures 17A and 16) The southern boundary of
this activity is quite sharp and coincides with the region between the two
August 1979 epicenters this again emphasizes the importance of the area of
the two 1979 epicenters The epicenter of the main shock is located on the
northern boundary of the region of intense activity
Second the aftershock activity expands in size during the succeeding
nine days primarily northwards [see also Chatelain et al 1983] To the
northwest significant activity develops within the oceanic plate beneath
the trench axis (Figure 17B) This activity is concentrated beneath the
ORSTOM seamount [see USGS map by Chase et al 1983] near 173degS and
1672degE During the second through the ninth days activity continues to
develop in the area west of Epi Island and south of Malekula Island (Figure
17B) while in the succeeding 50 days the area of southern Malekula is
activated with a remarkable cluster occurring beneath the southern coast
(Figure 17C) The region of southern Malekula and Epi has been notably
quiet for much of the period prior to the July 1981 earthquake Back-arc
activity is also notable with a cluster occurring on 29 July east of
16 06 A B deg
0
O0
0 0
0~
o
000
0 0
0
00
0o~$
S 0 08 S
16E0
167 E
1 - C
0 0
168
0
16
0--
0
169 16
t
E
4P0
16
168
_ _ _ _ _ _ _ _
167
16 1o6
0
E 0
o S 0O
0 0
66
o5
0 6
0 24 Ju
q-o
0
6
1G 8HOM(C) 240 in~~ ~~
08OM24 JulJul toto 075M Figur 14
M Setme 1981 ()0H5M1Juy11to0H5M16Jl()0HO16uyto 1515 Setmbr191
I shy37
9Mo 4 o
uy
ON
37
Efate and increased activity in the region of Ambrym and Epi islands
(Figure 17C)
The aftershocks of the 15 July 1981 event thus affected four distinct
regions (1) the former 26 August 1979 aftershock zone presumably on the
interplate boundary (2) a region of the suboceanic plate near the ORSTOM
seamount (3) the region between South Malekula and 172degS presumably also
part of the interplate boundary and (4) upper plate crust cast of Efate
Island The total area affected by this earthquake was about 10 times
larger than the area expected for the rupture zone of an earthquake with
magnitude of the July 1981 event [Chatelain et al 1983]
(B) Prominent Clusters
Aside from aftershocks of the August 1979 and July 1981 events the
Efate -Malekula region also experienced several remarkable earthquake
clusters Some of these have the characteristics of an aftershock
sequence with the initiating event having the largest magnitude (and
sometimes preceded by a few foreshocks) Others have characteristics
intermediate between an aftershock sequence and a swarm [Mogi 1963] where
there may be several dominant shocks within the sequence and a more
symmetric shape to temporal variation of the number of events per unit
time The clusters are shown together with the larger aftershock sequences
in the summary of seismicity presented in Figure 18 For clarity the
aftershocks of the August 1979 and July 1981 events are represented by the
first nine days of activity
(A) Clusters in the forearc region The first cluster recorded by the
local network occurred in late September and early October 1978 near the 1
38
September mainshock (Figure 18A) and can be considered as a late part of
the aftershock sequence of the 1 September event The location of this
cluster however is activated again in later clusters (December 1979
August 1983 and April 1984) Figure 18A shows the next significant
activity in the region a cluster of earthquakes in December 1978 located
west of the August 1979 aftershock zone beneath the New Hebrides trench
The region was then fairly quiet until March 1979 when an intense cluster
of earthquakes occurred over a period of five days (Figure 18B) Activity
in the same area resumed again in April 1979 for a period of two days The
most active parts of both clusters are located at the same place which
defines an east - west trending zone located near the epicenter of the 26
August 1979 event and at the junction of the 17 August and 26 August
aftershock zones
After the August 1979 shocks three clusters occurred in December
1979 March 1980 and June 1980 (Figure 18G and 18H) near the epicenter of
the 1 September 1978 main shock (and also near the mid September 1978
cluster noted above) This location is on the eastern edge of the future
1981 aftershock zone The three clusters also tended to migrate toward the
July 1981 main shock epicenter (Figure 18G) A smaller cluster occurred in
August 1980 beneath Malekula Island (not shown on Figures) Actually the
entire region was rather quiet during 1980 The three 1980 clusters were
relatively small
In February 1981 a cluster of earthqukes occurred just west of the
location of the March -April 1979 clusters between those clusters and the
location of the December 1979 cluster (Figure 18H and 181) This location
39
Figure 18 Maps of epicenters in aftershock zones and clusters located bythe Cornell-ORSTOM network shown sequentially in time Epicenters of main shocks are shown by filled squares In each successive frame the next cluster overlays the preceding one for comparison Only successive clusters are shown in each frame All the activity recorded for the periods chosen is plotted Ten days of aftershock activity are shown for the August 1979 and July 1981 earthquakes
(A) 1 September 1978 main shock with September-October 1978 cluster (open circles) and December 1978 cluster (open squares)
(B) 27 January 1979 mainshock (no aftershock activity) with clusters of March-April 1979 (filled circles)
(C) Foreshock sequence for 17 August 1979 (open circles) (D) 17 August 1979 mainshock and aftershok sequence (filled circles)(E) 26 August 1979 mainshock and afters]ock sequence (open circles)
back-arc activity in September 1979 (crosses) (F) Cluster in December 1979 (filled circles) (G) Clusters in March 1980 (open circles) June 1980 (open squares) and
February 1980 on Efate island (plus signs) (H) Cluster in February 1981 (filled circles) (I) 15 July 1981 foreshocks (open circles) and June 1981 back-arc cluster
(plus signs) (J) 15 July 1981 aftershock sequence (filled circles) and back-arc activity
during July 1981 (plus signs) (K) Clusters in September-October 1981 (open circles) and activity on Efate
island in December 1981 (plus signs) (L) 12 March 1983 earthquake and aftershock sequence (filled circles) (M) Cluster in June 1983 (open circles) (N) 3 August and 5 August 1983 events and aftershock sequence (filled
circles) (0) Clusters in April 1984 (open circles) and in the back-arc near Epi
Island in March 1984 (plus signL) (P) Cluster in October 1984 (filled circles) (Q) Clusters in February 1984 (open circles) and April 1984 (open squares) (R) 3 July 1985 aftershock sequence (filled circles)
17
deg A B c
o 0W
0
03
0
00
(0C
0
00
00
0cn9
0
13g
0
o
000
o
0 000
0 0
0
0o 0
0 o 0S
(So
0
0
17
17 sclo
deg D c
p 0 0-
F
O 0 0 1800
O00 0
000
0 0 00 0
0 +
167 E 168 1690 167 E0 0
168 169 167 E 00
168 169
0 0
17
S
18
a I
0deg0Ck G
06+04
13 degp
~ - Ho
-to+00 0 o0o0o
0+1
I
0 0 +
18-
0
0O
A- V
J
+
- 00 B +o
K0 00 o0
L 0
0
0~
+
17 0
0
0j AbullB
0
0 0 0
0
0e
0 06
0 000
0
g oo
000
0+ 0olo
9
00
f 000
00 eFo 0 Q000
01
0 0
0 o00 1 0
o 0
1 7 E1 8116767E 168 169 167 E 168 169
I-0
16
7
0 o k3 ~
00
00
0 0
o 00
_o-I -
00 0 0
0 00
0
00
17s IP
0
00 00
13
01
0
0
00
000 0shy18
1868
CP 0 0t
00
169 167o
8
0
00
00
3
17E168 169 167 E 168 0 0 169 167 E 168 169
43
is part of the overlapping aftershock zones of the August 1979 events and
is also at the southern limit of the 15 July 1981 aftershock zone
The clusters thus have a very close spatial relationship to the
aftershock zones of the main shocks They occurred near the boundaries of
the aftershock zones and appear to be related to features delimiting or
defining the spatial development of the aftershock zones (see also
Chatelain et al 1986)
From February 1981 until August 1982 except for the aftershock
sequence of the July 1981 earthquake not a single fore arc cluster was
detected in the Efate Malekula region- Starting in September 1982
clusters began to occur around the former July 1981 immediate aftershock
zone In September and October 1982 four clusters occurred south of and
beneath Malekula Island (Figure 18K) Besides the aftershocks of the 15
July 1981 earthquake the September - October 1982 clusters were the most
prominent activity in the Malekula region during the entire 1978-1984
period These clusters did not occur at random places The first one was
located beneath Malekula Island at the site of the previous cluster in
1980 The second cluster is lcated southwest of Epi Island in an area
which experienced significanc activity during the aftershock sequence of
the 15 July 1981 earthquake (compare Figure 17C and 18L) The third
cluster shows a very linear pattern trending southwest - northeast right
along the extension of the northern edge of the 15 July aftershock zone
The fourth cluster then occurred beneath southern Malekula Island
In March and June 1983 two clusters occurred in the southern part of
the Efate zone The March 1983 cluster (Figure 18L and 18M) occurred near
the January 1979 epicenter and comprised a relatively small aftershock
44
sequence of a magnitude (Ms) 58 earthquake The June 1983 cluster
occurred just south of the July 1981 aftershock zone (Figure 18M and 18N)
This cluster affected the same zone which had already been affected by both
foreshocks and aftershocks of the 17 August 1979 mainshock Most of the
cluster occurred after a magnitude (mb) 54 shock which was the largest
event in the cluster The cluster thus has the charactistics of an
aftershock sequence but one with an abnormally large area for the main
shock magnitude The main shock was also preceded by a small foreshock
sequence that started a day before and stopped six hours before the main
shock
In August 1983 a dense cluster following a Ms - 56 and a Ms - 57
event occurred northwest of Efate Island (Figure 18N and 180) The latest
cluster recorded in the region occurred in April 1984 again activating the
same zone (Figure 180)
(2) Clusters in the back-arc region Although the back-arc region is
usually relatively aseismic there were clusters of earthquakes located
east of Efate Island and beneath Efate Island itself The clusters were
shallow and located in the island arc crust The areas affected were much
smaller than those in the forearc clusters Three of the clusters occurred
just before or after the August 1979 and July 1981 main shocks (Figures
18E 18F 181 and 18J) The August 1979 event was followed in September
1979 by a cluster east of Efate and in February 1980 beneath Efate The
July 1981 main shock was preceded in June - July 1981 by a swarm occurring
just south of the cluster following the August 1979 events Another
cluster occurred shortly after the July 1981 event at the same place The
July 1981 main shock was also followed by a swarm on Efate Island at about
45
the same place as the one following the August 1979 earthquakes No
clusters have been located in the Efate back-arc region from December 1981
when the last swarm occurred on Efate Island up to the most recent data
available October 1984 thus giving support to the close temporal
relationship between these clusters and the 1978 - 1983 sequence (see also
Chatelain et al 1986) In December 1980 a larger cluster occurred
farther east near the Coriolis trough (not shown on figures) The only
other back-arc activity occurred in March 1984 farther north just south of
Epi Island (Figure 180)
(3) Summary of Results from the Cornell-ORSTOM Network Investigation
of the patterns of seismicity associated with the earthquakes which have
occurred within the Cornell-ORSTOM network has shown that (1) not all
medium to large size events are associated with foreshock activity (2)
long term precursory activity sometimes occurs but not with enough
consistency to use in forecasting an impending event and (3) some zones
are activated before and after the main shocks without defining any clear
cycle (Chatelain et al in press) These earthquakes and their associated
seismicity suggest that specific features along the interplate zone
produced by the interaction of structures in the overriding and subducted
plates appear to control the seismicity in the Efate region (Chatelain et
al in press Isacks et al 1981)
Seismic Potential Studies Along the New Hebrides Arc
The earthquake hazard from the interplate zone is generally high
because of the rate of relative motion of the two plates (approximately 11
cmyr) and the stick-slip nature of the boundary However in addition to
large to great earthquakes along the plate interface moderate to large
46
magnitude events can occur within either plate and cause considerable
damage locally
One approach to determining the seismic potential of a region is to
identify a seismic gap or portion of an arc that has not produced a large
earthquake for some period of time The identification of a seismic gap
does not mean that a large earthquake will necessarily occur in a given
region because not all gaps will produce large earthquakes The gap may
indicate that (1) the section of the plate boundary is locked stress is
accumulating along the interface and will be the site of a future
earthquake or (2) the relative plate motion is being accommodated by
continuous slippage (aseismic creep andor by slip during small and
moderate events) such that sufficient stress to generate large earthquakes
along that section of the plate boundary does not accummulate Historical
information regarding the occurrence of earthquakes in a particular region
and regional tectonic constraints are necessary to clarify which of these
two possibilities is valid for the region in question In many cases
however the historical record may be incomplete or too short to accurately
determine which option is correct
Evaluation of the recurrence history of a particular region can be
investigated using (1) Teleseismically recorded earthquakes (2)
recurrence relations of smaller earthquakes recorded by seismograph
networks (3) pre-instrumental historical records of large earthquakes and
(4) evidence of prehistoric and historic large earthquakes observable in
the geological record Recurrence relations may help determine return
periods for certain sizes of earthquakes Recurrence intervals are
dependent upon the observations of seismograph networks and-are incomplete
47
since the period of record keeping is short compared to the time necessary
to develop these relationships Indirect evidence of large earthquakes can
sometimes be found in the geologic record in the form of uplift rates and
used to address the problem of recurrence intervals However information
obtained from the geologic record is necessarily limited in accurracy
McCann (1980) has divided the New Hebrides arc into different zones
and assigned values of seismic potential to these zones (Figure 19) based
on his study of historical and instrumental seismicity He has assigned 6
different divisions based on his study of the historical record (1) site
of a great (Ms 7 34) earthquake more than 100 years ago (2) site of a
great earthquake within the past 100 years but more than 30 years (before
1978) (3) incomplete historical record but indication that the region may
have the potential for a large earthquake (4) plate motion is subparallel
to the arc (5) no historical record of a great earthquake and the region
may not have the potential for one and (6) site of a large earthquake
within the past 30 years and presumably the lowest seismic potential
Marthelot (1983) used PDE data to determine some general segmentations
in the seismicity of the New Hebrides arc and the patterns of seismic
activity that characterize these segments (Figure 20) Marthelot (1983)
found that coupled interplate large (Ms lt 79) thrust earthquakes which
are preceded by intense activity dominate the northern end of the New
Hebrides arc near the Santa Cruz islands (between IIdegS and 13degS) Moderate
(Ms lt 72) thrust events concentrate between 13degS and 14degS Coupled
moderate (Ms lt 75) interplate thrust earthquakes occur near Santo and
northern Malekula islands (14degS to 165degS) The southern end of Malekula
and slightly south (165 0S to 1750S) exhibit coupled interplate thrust
48
14 S
2
19
24 I 165 E 170
Figure 19 McCanns seismic potential for New Hebrides island arc (McCann1980 See text for discussion of numbers
____
49
1650 1650 2 6 63 - 41 100
0 COUPLED INTER-INTRAPLATE THRUST
7467 e34 34
w
= EVENTS PRECEDED
BY INTENSE 24
AACTIVITY U I 44 CONCENTRATION
OF THRUST EVENTS
64-72 21O210
3
COUPLED 2061 73 0 _00
s INTERPLATE - 0 0C w THRUST EVENTS 78
PRECEDED BY 45t58C-150
DONUT PATTERNS 16 46 I S
81 03Q STEADY HIGH RATE L2 062 501 4 4
02ONLY ONE THRUST EVENT 61 025 INTRAPLATE200 ACTIVITY A 43
81 _0 2 O V CLUSTERS OF 72 73
RECURRING 76 150Q20 THRUST EVENTS 200
SLOW EXPANSION 4 OI01
OF ACTIVITY 8I 80 26 43 IN 198081- 13Do NO PRECURSORY
PATTERN 0 66 26
170 0 E 1720 170 0E 1720
Figure 20 Summary of the characteristics of the distribution of shallow earthquakes along the New Hebrides island arc The dashed line representsthe axis of the trench The trench disappears in the central part of the arc Horizontal lin separate regions characterized by distinct seismicity patterns Middle figure shows years of occurrence of large(Ms gt 70) and moderate-sized events (ms gt 60) 1961-1981 Right figureshows the large earthquakes that occurred from 1900 through 1960 (Marthelot and Isacks 1984)
50 earthquakes that are not quite as large (Ms lt 72) The zone west of Efate
(175degS to 18degS) exhibits a steady high rate of seismicity with magnitudes
(Ms ) less than or equal to 72 Between 18degS and 20degS intraplate activity
(Ms lt 72) dominates South of Anatom (eg south of 20degS) the seismicity
is characterized by clusters of recurring thrust events that do not exhibit
any precursory activity
In another study utilizing the PDE data set Wyss et al (1983) and
Habermann (1984) have used the shallow New Hebrides seismicity in order to
(1) identify areas of higher and lower strength within the plate interface
which might control the rupture length of future earthquakes and (2) test
for changes in the rate of seismicity prior to large earthquakes using a
statistical procedure The trend toward low stress drops in the central
portion of the arc near the intersection of the dEntrecasteaux Fracture
Zone with the New Hebride Trench is consistent with other studies which
indicate that this region is anomalous However a region of high or low
strength does not indicate anything about the nature of the region and
these regions do not help pinpoint when a large destructive earthquake
will occur within or near them
ASSESSMENT OF EARTHQUAKE HAZARD
Seismotectonic Provinces
We propose the following seismotectonic provinces and the maximum
probable (but not absolute) sizes of earthquakes be considered for the
subregions within Vanuatu when considering a design earthquake for these
regions (Figure 21) These provinces are based on the instrumental history
of earthquakes near Vanuatu The northern end of the New Hebrides Trench
is a complex zone of deformation where the interplate motion is changing
51
M612
13
S 0 0
18
231 165 E 170
Figure21 Earthquake potential for Vanuatu
--
--
52 from thrusting in the southern portion to mostly strike-slip motion in the
northern portion and has the potential for great (Ms 8) earthquakes The
central portion of the New Hebrides Trench here called the Santo
Malekula segment exhibits characteristics different from the rest of the
arc as the result of the dEntrecasteaux ridge interaction and has the
potential for Ms 7 34 earthquakes The southern end of the New Hebrides
Trench here called the Efate Tanna segment may have the potential for
Ms 8 earthquakes The extreme southern end of the New Hebrides Trench is
another complex zone where the interplate motion is changing from thrusting
in the north to strike-slip motion in the south and may be limited to
infrequent moderate (M 7 12) earthquakes Other sources of seismicity
include back-arc spreading east of the New Hebrides Trench (Ms 7 12) and
diffuse shallow activity along the Hazel-Holme Ridge (Ms 7) in the North
Fiji Basin (Ms 6 12)
One method for estimating the maximum possible magnitude earthquake in
a region is to look at the amount of deformation that has accumulated from
past earthquakes The deformation is assumed to be proportional to the
square root of the energy released by a powerful earthquake The energy
(E in joules) of each earthquake can be calculated from its magnitude (Ms)
using a formula developed for the region Pr~vot and Chatelain (1983) have
used the formula
Log E - 48 + (15 x Ms)
to calculate the amount of energy which has been released since 1965 in the
central portion of the arc (Figure 22) The calculated values tend to fall
within a range of values which can be bounded by two parallel lines since
deformation occurs more or less uniformly in time The maximum possible
E1 2 106 600 (joules )
500
400
300
200
136 shy
100
65 70 75 80 82 ANNEES - YEARS
Figure 22 Seismic energy release along the New Hebrides Arc since 1965 (Chatelain and Pr~vot 1983)
54
magnitude earthquake calculated by this method is Ms - 76 Prdvot and
Chatelain (1984) computed a similar result using all of the earthquakes
which have occurred since 1900
Ground Motion
Once the location and magnitude of potential earthquakes have been
determined for a region the next step is to determine the characteristics
of the ground shaking at a particular site This accomplished by the
condsideration of such quantities as earthquake source mechanism
epicentral distance and geometry and physical properties of the geologic
structures located between the source and the site
Strong-motion records provide one measure of site response To date
a relatively large number of strong-motion records have been generated in
the far-field of large earthquakes especially in California and Japan In
contrast relatively few near-field records of moderate and large shocks
have been recorded in island arcs These few have shown large scatter with
unpredictable results The 3 March 1985 Chilean and 19 September 1985
Mexican earthquakes constitute the most important exceptions and are
invaluable additions to the library of strong motion data for subduction
zones Nor-theless these two events do not constitute a databank of
information especially for intraoceanic tectonic settings such as Vanuatu
A major difficulty arises in trying to translate past earthquake size
(intensity values) which are based on cultural effects or magnitudes
derived from widely varying instrumental parameters into values of ground
motion The development of earthquake resistant design is usually based on
intensity of ground motion at a particular site The most widely applied
standard of comparison for strong motion data is the peak ground
55
accelereation (PGA) Figure 23 shows a general relationship between peak
acceleration and distance from hypocenter which has been derived from
worldwide earthquake data Some earthquakes generate relatively high
single peaks of ground accleration which represent little ground energy
Therefore on an absolute basis the use of PGA can be misleading for
smaller events
Peak ground accelerations are easily obtained from accelerogram
records however most historical information consists of earthquake
intensities Numerous relationships between ground acceleration and
Modified Mercalli intensities have been developed (Table 3) Two of these
proposed relationships are shown in Figure 24 For worldwide data Murphy
and OBrien (1977) have computed statistical correlations between Modified
Mercalli intensity values and ground accelerations (horizontal and
vertical) Theresultant relationships and the geometrical standard
deviation (s) are
log Av - 028 Imm - 040 s - 253
log Ah - 024 Imm- 026 s - 219
where -Av peak vertical ground acceleration
Ah - peak horizontal ground acceleration
Imm - Modified Mercalli intensity
Using the relationship of earthquake intensity to distance and size of
Fiji earthquakes Everingham (1984) has produced a plot for the Fiji region
(Figure 25) Although these results are for a nearby region they give a
general indication of what might be expected for Vanuatu Figure 26
(Prdvot and Chatelain 1983) shows the recurrence of Modified Mercalli
intensities per number of earthquakes
56
1000 1 I l I I eO58 M(R 5 -X A= 1320 e R+25)152
5
MEAN + a =2N01 - STANDARD 2-
oe DEVIATIONbullbull- ~0 MEAN + 2
tbull 0o - STANDARD - oo o DEVIATIONS Jf E N o 0
LU0
U 01 0_ o o 0-oo n 00 bull
L) em a00
- MEAN - shy - 4ra 00 L 0 W STANDARD 0-~DEVIATIONWL 000 to
0 ME N -2 1 STANDARDUx 0
DEVIATIONS
101- 10 - 000
D N O oENTE K - 1 so-
10 100 1000
DISTANCE FFROM HYPOCENTEFR IN KILOMETEFRS
Figure 23 Acceleration-attenuation relations derived from worldwide earthquakes (Hays 1980)
57
Table 3 Characteristics of the data samples used in selected studies of the correlation of ModifiedMercalli intensity and peak ground acceleration (modified fom OBrien et al 1977)
Number and Range of location Number Modified Mercalli Distance Acceleration
Study of earthquakes of recordings intensity
Gutenberg and 61 Western 167 n-VIII Richter 1942 United States 1956
Neumann 1954 10 do
Hershberger 1956 60 do Coulter Waldron dodo
and Devine (Not based 1973 entirely on
observed data)
Trifunac and 57 do Brady 1975c
10 V-VIII
108 J-Vil IV-X
187 IV-X
range (kin) range (cms2)
3-450 1-300
Averages of 40-300 25 and 160 (distance dependent) - 1-300 Short distance 6-3000
(Dependent on site geology and local amplification)
Figure 24 Proposed relationships between earth quake intensities and peack accelerations
59
DEPTH 20KM
7shy
6- 6 0
075 502
61 h0
DISTANCE KM
Figure 25 Modified Mercalli earthquake intensities observed in Fiji as a function of magnitude and epicentral distance (Everingham 1984)
60
10
0
5CI I-C)
0i
0
o
01 a)o
PORTVILA = SANTO
00
E
0212
000
E
z
Degres Mercali _ Mercalli degrees
Fiue-2 Frequency of Modified Mercalli earthquake intensities felt in Port Vila and Santo (Chatelain and Prfivot 1983)
61
Tectonic Uplift
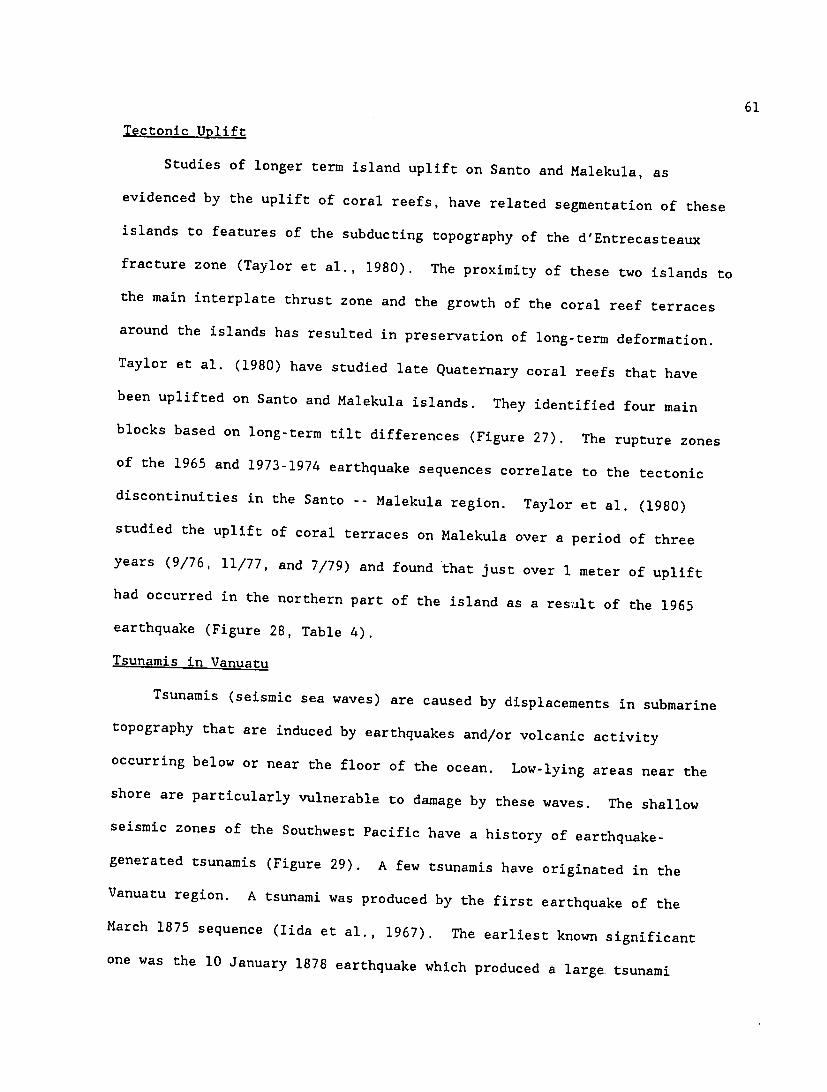
Studies of longer term island uplift on Santo and Malekula as
evidenced by the uplift of coral reefs have related segmentation of these
islands to features of the subducting topography of the dEntrecasteaux
fracture zone (Taylor et al 1980) The proximity of these two islands to
the main interplate thrust zone and the growth of the coral reef terraces
around the islands has resulted in preservation of long-term deformation
Taylor et al (1980) have studied late Quaternary coral reefs that have
been uplifted on Santo and Malekula islands They identified four main
blocks based on long-term tilt differences (Figure 27) The rupture zones
of the 1965 and 1973-1974 earthquake sequences correlate to the tectonic
discontinuities in the Santo -- Malekula region Taylor et al (1980)
studied the uplift of coral terraces on Malekula over a period of three
years (976 1177 and 779) and found that just over 1 meter of uplift
had occurred in the northern part of the island as a resalt of the 1965
earthquake (Figure 28 Table 4)
Tsunamis in Vanuatu
Tsunamis (seismic sea waves) are caused by displacements in submarine
topography that are induced by earthquakes andor volcanic activity
occurring below or near the floor of the ocean Low-lying areas near the
shore are particularly vulnerable to damage by these waves The shallow
seismic zones of the Southwest Pacific have a history of earthquakeshy
generated tsunamis (Figure 29) A few tsunamis have originated in the
Vanuatu region A tsunami was produced by the first earthquake of the
March 1875 sequence (Iida et al 1967) The earliest known significant
one was the 10 January 1878 earthquake which produced a large tsunami
62
1167030E
AK-A 150 30 S
Tasmaloum Arkialo
NORTH MALEKULA
X Direction of tilt inferred from reef terraces 16000S
Tilt discontinuity
Pliocene and Quaternary shy sedimentary rocks mostly
coral limestone
r Pre-Pliocene sedimentaryand igneous rocks SOUTH
MALEKULA
160305
Figure 27 Tectonic uplift associated with the 1965 Santo earthquakes (Taylor et al 1980)
63
Contour Interval =02 m 02--- 04 - hp
0-6- shy08 xx16 000Sshy
08 9
06
02 i
00
160 30S a
167 0 00E 167 030E
Figure 28 Measurements (meters) of 1965 uplift made in September 1976November 1977 and July 1979 The letters on the figure represent the places and amounts of uplift given in Table 2 The contours of uplift(contour interval - 02 ) represent one of the simplest interpretations of the uplift pattern consistent with the measurements (Taylor et al 1980)
64
TABLE 4 Uplift Measured Along the Coast of Northern Malekula
Year Number ofStation Place Name Measured Measurements a Southwest Bay 1977 observationb Bamboo Bay 1977 observation c Dixon Reef 1977 Id Lambubu Bay 1976 15 e West Bay 1976 5f Horrok 1976 Ig Brenwe 1976 4h Liwout Point 1976 1979 50i East Leviamp 1976 4j West Leviamp 1976 6k Elephant Point 1976 17I Win 1979 24 m Wihet Bay 1979 23 n Rambak 1979 30 o Npennanavet 1976 10P Matanvat 1976 4 q Potovrou 1977 1 r Atchin Island 1977 observations Wala Island 1977 observation t Norsup 1977 I u Lamp 1977 observation
Insufficient measurements for a standard deviation to be useful
Figure 29 Tsunami history of the Southwest Pacific Filled circles indicate locations of tsunaznigenic events dashed circles indicate inferred locations of tsunamigenic events
66
(12-17 m lida et al 1967) and 6 meters of uplift of the harbor at Port
Resolution (Warden and Mitchell 1974) Other earthquake generated
tsunamis have occurred in 1961 1965 and 2 in 1967 (lida et al 1967)
While major Pacific-wide tsunamis such as those generated along the South
American or Alaskan plate margins apparently do not affect Vanuatu
significant local tsunamis may be generated by large shallow earthquakes
occurring within the region
Volcanic Eruptions in Vanuatu
Volcanic activity is concentrated in the central belt of the Vanuatu
island arc Much of the present activity is confined to solfataric
eruptions however explosive eruptions are known (eg the 1878 Yasowa
eruptions)
In general the potential effects of a volcanic eruption on the
inhabitants of the islands of Vanuatu are small except for those people
who are living in the immediate vicinity of an active volcano However
evacuation of inhabited volcanic islands may be necessary in larger
eruptions Even distant volcanic eruptions such as those at Home Reef in
the Kingdom of Tonga during March 1984 produced large quantities of pumice
some of which rafted across large portions of the Southwest Pacific The
floating pumice interfered with shipping throughout the Southwest Pacific
region (SEAN Bull 1984)
IMPLICATIONS FOR MITIGATION OF EARTHQUAKE RISK
Several significant steps may be taken that will significantly
mitigate the loss of life and property from future earthquakes in Vanuatu
The following five steps provide suggestions for mitigation of the
earthquake risk
67
Earthquake Education
First an earthquake education program such as that adopted in Fiji
or Papua New Guinea is strongly recommended At minimal cost to the
Government such a program may be mounted through the schools Red Cross
programs and through the news media In other countries earthquake
education programs have taught simple methods of strengthening house
construction and minimizing hazardous conditions within the home they
have warned of tsunami hazards to coastal dwellers they have instructed on
proper behavior during an earthquake they have helped to encourage storage
of emergency food water and equipment in many households and
importantly they have helped avoid panic during an earthquake and
stimulated cooperation with government officials following such a disaster
Earthquake education programs are effectively combined with other disaster
preparedness programs (eg cyclones floods and so on) An example of
educational materials prepared by the Fiji Mineral Resou-ces Department is
included in Appendix IV
A few simple measures can be taken to reduce the likelihood of damage
to personal property A system of baffles in water reservoirs can reduce
the chances of seiches being set up in the tanks and the ultimate collapse
of the towex if the motion is large enough Large heavy objects should
not be put in high places where they can be easily dislodged unless they
are anchored in place This would apply to things like stereo speakers and
other objects that might be on shelves Products on shelves in stores and
books in offices can be restrained with wire retainers along fronts of
shelves Heavy objects that could tip over (such as hot water heaters and
gas tanks) can be fastened with anchoring bands This is especially a
68
concern with gas tanks which could fall over rupture lines and result in
fire
Building Codes
Second adoption of building codes for Vanuatu is imperative There
is a real danger of a large earthquake occurring very close to Port Vila or
Luganville In general the adequacy of construction is a major factor
controlling the damage and loss of life brought on by such an earthquake
Building codes designed for areas of similar earthquake hazard such as New
Zealand Code A California Building Codes or Papua New Guinea Codes 1 or
2 would be appropriate for Vanuatu Observation of such codes is most
crucial for public multistory buildings in the major towns of Port Vila
Efate and Luganville Santo As important as the design of such buildings
are the construction methods and guality of construction material used to
implement building design Careful monitoring of construction by competent
engineers is important for critical facilities The traditional houses
have kept down past losses of life and property but increasing population
and rapid urbanization can result in higher potential damage if
earthquake-resistant designs are not implemented One of the primary
reasons for property damage resulting from the Mere Lava earthquakes was
related to the siting of newer homes Houses located on steep slopes
suffered damage when they were not situated on competent substrate (Figure
30) The shaking of the fill and loose soils by the earthquakes caused
unconsolidated materials to shift under the foundations
Emergency Civil Defense Procedures
Third development of specific Civil Defense plans for emergency
procedures following an earthquake or tsunami should be initiated Of
69 a ) Poorly - situated house
and terrace e
house built too far over slope Rear
0 R
near cutting vertical and too backwall of house
bull e
b ) Earthquake- induced slope movements
-7 Rear cutting collapses pushingForward terrace edge - house orward
subsidesunder mining huefrad house foundation shy
Landslippage here
c) Well- situated house and terrace Good distancebetween house and
Good between
distance house
cutting
ond sopr I Rear cutting slope back and planted with natural vegetation
Figure 30 Sche7atic representation of causes of damage to poorly sited houses and suggestions for future house contruction in areas of loosely consolidated soil
70 course earthquake preparedness plans have much in common with hurricane or
other natural disaster planning but specific effects of earthquake
occurrence must be considered structural damage to multistory buildings
interruption of water supply disruption of electrical and gas lines
secondary geological effects such as ground liquefaction or landslides in
the near-source region complicating effects of aftershocks in the days and
weeks following a major earthquake The primary structure for such civil
defence plans already is in place in Tonga Programs specific to the
earthquake hazard may be added following similar programs in Fiji Papua
New Guinea and New Zealand
Long-term Seismicity Observations
Fourth long-term seismicity and strong motion observations should be
continued In the long-term such information will help to refine
estimates of seismic potential along the New Hebrides plate boundary they
will help to more directly and accurately assess the ground motion
parameters of direct concern to engineers for building design in
Vanuatu--ground acceleration frequency spectra horizontal and vertical
components of ground motion local amplification effects and so on
Furthermore seismicity patterns may provide a key to long-term forecasting
and short-term prediction of the location and size of future earthquakes
that may affect Vanuatus population
Internationa Cooperation
Fifth international cooperation among the island countries of the
Southwest Pacific and foreign agencies (eg US Geological Survey
ORSTOM etc) may significantly help in Vanuatus earthquake preparedness
program All of the countries affected by earthquakes (Vanuatu Western
71
Samoa Fiji Tonga Solomon Islands Papua New Guinea and New Zealand)
have to varying degrees developed earthquake preparedness programs
Vanuatu may take advantage of the previous current and any future efforts
of the other countries in the region
72-76
References
Atkin R J (1968) On volcanoes in the New Hebrides and Banks Islands Quarterly J of the Geologvical Society of London 24 305-307
Calder N 1972 The Rescless Earth A Report on the New Geology The Viking Press New York N Y
Carney J N and A Macfarlane (1979) Geology of Tanna AneityumFutuna and Aniwa New Hebrides Geological Survey Regional Report 71 pp Carney J N and R Campillo (1980) An investigation into damage causedby seismic activity on Mere Lava during May 1980 Geological Survey DeptOf Vanuatu Report
Chase C G (1971) Tectonic history of the Fiji Plateau Geol Doc Amer Bull 82 3087-3110
Chase T E B A Seekins J Daniel and J Y Collot (1983)Topography of the Vanuatu region map US Geological Survey Alexandria VA
Chatelain J L R K Cardwell and B L Isacks (1983) Expansion ofthe aftershock zone following the Vanuatu (New Hebrides) earthquake on 15July 1981 Geophys Res Lett 10 385-388
Chatelain J L B L Isacks R K Cardwell R Pr6vot and M Bevis (inpress) Patterns of seismicity associated with asperities in the centralNew Hebrides Island Arc J Geophys ResChinn D S (1982) Accurate source deths and focal mechanisms ofshallow earthquakes in western South America and in the New Hebrides island arc PhD Thesis Cornell University Ithaca NY
Chinn D S and B L Isacks (1983) Accurate source depths and focalmechanisms of shallow earthquakes in western South America and in the NewHebrides island arc Tectonics 2 529-563
Chiu J-M (1982) Structural features of subduction zone determined bydetailed analysis of short period seismic waves from earthquakes recordedin the New Hebrides island arc PhD Thesis Cornell University
Collot J Y J Daniel and R V Burne (1985) Recent tectonicsassociated with the subductioncollisioi of the DEntrecasteaux zone in thecentral New Hebrides Tectonophys 112 325-356
Coudert E B L Isacks M Barazangi R Louat R Cardwell A Chen JDubois G Latham and B Pontoise (1981) Spatial distribution andmechanisms of earthquakes in the southern New Hebrides arc from atemporary land and ocean bottom seismic network and from worldwide observations J Geophys Res 86 5905-5925
77
Dubois J J Lauray J Recy and J Marshall (1977) New Hebrides trench Subduction rate from associated lithospheric bulge Canadian J Earth Sci 14 250-255
Ebel J E (1980) Source processes of the 1965 New Hebrides Islands earthquakes inferred from teleseismic waveforms Geophys J Royal Astron Soc 63 381-403
Everingham I B (1984) Provisional list of felt earthquakes reports in Fiji 1941-1981 Min Resources Dept Fiji Note BP 338 17 pp
Falvey D A (1978) Analysis of paleomagnetic data from New Hebrides Bull Austr Explor Geophys 9 117-123
Geological Map of the New Hebrides Condominium scale 11000000 (1975)Ministry of Overseas Development (Directorate of Overseas Surveys) DOS 1196 British Residency Port Vila New Hebrides
Gilpin L M A L Bloom B L Isacks and M Bevis F W Taylor and C Jouannic (1982) Late Pleistocene coral reef terraces as tiltmeters on Santo Island Vanuatu (New Hebrides) EOS Trans Amer Geophys Union 63 430
Gutenberg B and C F Richter (1954) Seismicity of the Earth 2nd ed Princeton NJ Princeton University Press
Habermann R E (1984) Spatial seismicity variations and asperities in the New Hebrides seismic zone J Geophys Res 89 5891-590
Hamburger M W (1986) Seismicity of the Fiji Islands and Tectonics of the Southwest Pacific PhD thesis 312 pp Cornell University Ithaca NY
Hays W W (1980) Procedures for estimating earthquake ground motions U S Geological Surv Prof Paper 1114 77 pp
Ibrahim A K B Pontoise G Latham M Larue T Chen B Isacks J Recy and R Louat (1980) Structure of the New Hebrides arc-trench system J Geophys Res 85 253-266
lida K D Cox and G Pararas-Carayannis (1967) Preliminary Catalog of Tsunamis Occurring in the Pacific Ocean HIG University of Hawaii
International Seismological Centre (ISC) 1978-1979 Bulletin of the International Seismological Centre Newberry Berkshire United Kingdom
International Seismolog4 cal Centre (ISS) 1918-1963 International Seismoshylogical Summary Newbury Berkshire UK
78
Isacks B L and M Barazangi (1977) Geometry of Benioff zones Lateralsegmentation and downwards bending of the subducted lithosphere in IslandArcs Deep Sea Trenches and Back-Arc Basins Talwani M and W C Pitmaned Maurice Ewing Series 1 Amer Geophys Union Washington D C 99shy114
Isacks B L G Hade R Campillo M Bevis D Chinn J Dubois JRecy and J L Saos (1978) Measurements of tilt in the New Hebrides island arc in Proceedings of Conference VII Stress and StrainMeasurements Related to -Prthquake Prediction US Geological SurveyOpen-rile Report 79-370 176-221
Isacks B L R Cardwell J-L Chatelain M Barazangi J-M MarthelotD Chinn and R Louat (1981) Seismicity and tectonics of the central NewHebrides Island Arc in Earthquake Prediction An International ReviewMaurice Ewing Ser 4 edited by D W Simpson and P G Richards AGUWashington DC 93-116
Johnson T and P Molnar (1972) Focal mechanisms and plate tectonics ofthe southwest Pacific J Geophys Res 77 5000-5032
Karig D E (1971) Origin and development of marginal basins in the western Pacific J Geophys Res 76 2542-2561
Karig D E and J Mammerickx (1972) Tectonic framework of the New Hebrides island arc Marine Geology 12 187-205
Kelleher J J Savino H Rowlett and W McCann (1974) Why and where great thrust earthquakes occur along island arc J Geophys Res 794889-4898
Kroenke L (1984) Cenozoic Tectonic Development of the SouthwestPacific United Nations Econ and Social Commission for Asia and the Pacific Technical Bull 6
Lay T and H Kanamori (1981) An asperity model of large earthquakesequences in Earthquake Prediction An International Review Maurice EwingSer 4 edited by D W Simpson and P G Richards AGU Washington DC 579-592
Luyendyk B P W B Bryan and P A Jezek (1974) Shallow structure ofthe New Hebrides Island Arc Geol Soc Amer 85 1287-1300
Louat R J Daniel and B Isacks (1982) Seismicitd de larc desNouvelles Hebrides in Equipe de GOologie-GOophysique du Centre ORSTOM deNoumda Contribution Aletude godvnamique du Sud-Ouest Pacifique Travau et Documents de lORSTOM 1147 179-186
Mammerickx J T E Chase S M Smith and I L Taylor (1971)Bathymetry of the South Pacific map Scripps Inst of Oceanogr La Jolla Calif
79 Marthelot J-M (1983) Patterns of seismicity in the Vanuatu (NewHebrides) arc Regional variations and systematic evolution PhD Thesis Cornell University
Marthelot J-M J-L Chatelain B L Isacks R K Cardwell and ECoudert (1985) Seismicity and attenuation in the central Vanuatu (NewHebrides) islands A new interpretation of the effect of subduction of theDEntrecasteaux Fracture Zone J Geophys Res 90
McCann W R (1980) Large and moderate size earthquakes Theirrelationship to the tectonics of subduction Ph D thesis Lamont-DohertyGeol Observ of Columbia Univ Palisades NY
McCann W R S P Nishenko L R Sykes and J Krause (1979) Seismicgaps and plate tectonics Seismic potential for major boundaries Pure Appl Geonhys II_7 1082-1147
McGuire R K (1977) Effects of uncertainty in seismicity on estimateof seismic hazard for the East Coast of the United States Bull Seis Soc Amer 67 827-848
Mitchell A H G and A J Warden (1971) Geological evolution of the NewHebrides island arc J Geol Soc London 127 501-529
Mogi K (1963) Some discussions on aftershocks foreshocks andearthquake swarms--The fracture of a semi-infinite body caused by an innerstress origin and its relation to the earthquake phenomena (third paper)Bull Eartho Res Tnst Tokyo Univ 41 615-658
Monzier M J Y Collot and J Daniel (1984) Carte bathymetrique desparties centrale et meridionale de larc insulaire des Nouvelles-Hebridesmap Office de la Recherche Scientifique et Technique Outre-Mer (ORSTOM) Paris
Murphy J R and L J OBrien (1977) Analysis of a worldwide strongmotion data sample to develop an improved correlation between peakacceleration seismic intensity and other physical parameters ComputerSciences Corporation Rept NUREG-0402 to US Nuclear RegulatoryCommission 68 pp
Pascal G B L Isacks M Barazangi and J Dubois (1978) Preciserelocations of earthquakes and seismotectonics of the New Hebrides island arc JGeophys Res 83 4957-4973
Preliminary Determination of Epicenters (PDE) 1961-1981 MonthlyBulletin National Earthquake Information Service US Geological SurveyAlexandria Va
Pr~vot R and J L Chatelain (1982) Seismicity and seismic risk inVanuatu Report No 5-83 Centre ORSTOM Nouma New Caledonia
Richter C F (1958) Elementary Seismology W H Freeman and CompanyInc San Francisco
80
Rothe J (1965) The Seismicity of the Earth 1953-1965 Paris UNESCO 336 ppSanto T (1970) Regional study of the characteristic seismicity of theworld Part III New Hebrides island region Bull Earthquake Res Inst Tokyo Univ 48 1-18
SEAN (Scientific Event Alert Network) Bulletin 9
Taylor F W B L Isacks C Jouannic A L Bloom and J Dubois(1980) Coseismic and Quaternary vertical tectonic movements Santo andMalekula islands New Hebrides-island arc J Geophys Res 85 5367-5381
Taylor F W C Jouannic and A L Bloom (1985) Quaternary uplift ofthe Torres Islands northern New Hebrides frontal arc Comparison withSanto and Malakula Islands central New Hebrides frontal arc J of Geol 93 419-438
Trifunac M D (1976) Preliminary analysis of the peaks of strongearthquake ground motion--dependence of peaks on earthquake magnitudeepicentral distance and recording site condition Bull Seism Soc Amer 66 189-220
Trifunac M D and A G Brady (1975a) Correlations of peakacceleration velocity and displacement with earthquake magnitude andsite condition Intl J Earthquake Engr Struc Dynamics 4 455-471
Trifunac M D and A G Brady (1975b) On the correlation of seismicintensity scales with the peaks of recorded ground motion Bull Seism Soc Amer 65 139-162
Turcotte D L and G Schubert (1982) Geodynamics John Wiley amp Sons New York
US Geological Survey 1961-1985 Preliminiry Determination of Epicenters Denver Colo
Vidale J and H Kanamori (1983) The October 1980 earthquake sequencenear New Hebrides Geophys Res Lett 10 1137-1140
Wellington Seismological Observatory Geophysics Division 1953-1960 NZDept Scientific and Industrial Research Catalog of Earthuakes 1953-1960
Wray S T R K Cardwell B L Isacks E Cudert and J-L Chatelain(1983) Detailed seismicity observations in the forearc region of aconvergent plate boundary Malekula Island Vanuatu (abstract) EOS Trans Am Geophys Union 62 945
Wyss M R E Habermann and C Heiniger (1983) Seismic quiescencestress drops and asperities in the New Hebrides arc Bull Seismol Soc Am 23 219-236
81
APPENDIX I DEFINITIONS
Two measures of the size of an earthquake are magnitude and intensity
Magnitude is a measure of the energy from an earthquake source to indicate the
strength of an earthquake In comparison intensity is a measure of the amount
of ground shaking caused by the earthquake at a particular site Thus an
earthquake of a given magnitude will produce a wide range of intensities
depending largely on distance from the source
In general a small earthquake with a magnitude less than 5 may be felt
only in the area near the source and a moderate earthquake with a magnitude
between 5 and 7 will be felt over a wider area and may produce significant
damage in the area very close to the source A large earthquake refers to an
earthquake with a magnitude greater than 7 Such events are often very desshy
tructive if they are located near population centers A major earthquake
refers to magnitudes between 7 and 7 34 and a great earthquake refers to
magnitudes greater than 7 34 These great earthquakes cause widespread desshy
truction and possible regional tsunamis Generally the potential damage from
earthquakes is multiplied by the secondary effects of earthquake occurrence
such as ground faulting generation of tsunamis landslides slumping or
liquifaction
The depth of earthquakes range from the surface to approximately 700 km
depth Shallow earthquakes refer to those with depths between the surface and
70 km Intermediate earthquakes refer to those with depths between 70 km and
250 km depth Deep earthquakes refer to those with depths greater than 250 km
(but less than 700 km) Intermediate depth earthquakes occasionally produce
damage at the earths surface only if the earthquake is very large Deep
events are generally not felt
82
The seismic (earthquake) potential of a particular region is defined as
the likelihood of that region to experience a (destructive) earthquake within
particular magnitude range within a particular time period The seismic
(earthquake) hazard of a particular location refers to the amount of ground
motion that might be expected from an earthquake within or near that region
Adequate data on seismotectonic features instrumental (strong-motion) and
macroseismic (intensity) records of near-field effects of large earthquakes
source parameters of large earthquakes earthquake spectra and ground attenuashy
tion or amplification are necessary in order to reasonably evaluate earthquake
hazard for any region The seismic potential is the integration of all of
these bits of information The average length of time between earthquakes of a
particular size (recurrence interval) and the amount of time elapsed since the
last earthquake of that size help to define the probability of future earthshy
quake occurrence along a particular seismogenic zone hence the seismic
potential of that zone
Seismic risk of a particular region refers to the expected degree of
losses of people and their property which result from the seismic hazard and
the vulnerability in the region One method that has been widely used for this
risk determination (and is used here) involves the determination of a maximum
probable earthquake (design earthuake) that is likely to occur in the imshy
mediate region Calculations of seismic hazard which are based on design
earthquakes generally yield conservative estimates of risk
The most important conclusion of historical studies of seismicity is to
define the seismogenic zones of a region and extrapolate what the future earthshy
quake potential is for those zones Seismically quiescent regions refer to
regions with a lower level of seismic activity which are surrounded by more
83
active regions Portions of major plate boundaries that have not experienced a
major or great earthquake during a particular time interval are seismic Raps
This time interval is taken to be a significant portion of the earthquake
recurrence interval for a large earthquake An estimate to within several
decades of the location and size (magnitude) of a large earthquake constitutes
a forecast If a precise calculation of the time and probability of occurrence
can be added to the location and size information then the estimation is a
prediction
84
APPENDIX II MODIFIED MERCALLI INTENSITY SCALE (1956 VERSION)
Masonry A B C D To avoid ambiguity of language the quality of masonry brick or otherwise is specified by the following lettering whichhas no connection with the conventional Class A B C construction)
Masonry A Good workmanship mortar and design reinforced especiallylaterally and bound together by using steel concrete etc designed to resist lateral forces
Masonry B Good workmanship and mortar reinforced but not designed in detail to resist lateral forces
Masonry C Ordinary workmanship and mortar no extreme weaknessez likefailing to tie in at corners but neither reinforced nor designed againsthorizontal forces
Masonry D Weak materials such as adobe poor mortar low standards ofworkmanship weak horizontally
DESCRIPTION (INTENSITY VALUES RANGE FROM I TO XII)
I Not felt Marginal and long-period effects of large earthquakes
II Felt by persons at rest on upper floors or favorably placed
III atlt indoors Hanging objects swing Vibration like passing oflight trucks Duration estimated May not be recognized as an earthquake
IV Hanging objects swing Vibration like passing of heavy trucks orsensation of a jolt like a heavy ball striking the wallsStanding motor cars rock Windows dishes doors rattle Glassesclink Crockery clashes In the upper range of IV wooden walls and frames creak
V Felt outdoors direction estimated Sleepers wakened Liquidsdisturbed some spilled Small unstable objects displaced or upset Doors swing close open Shutters pictures move Pendulum clocks stop start change rate
iOriginal 1931 version in Wood H 0 and F Newmann 1931 Modified
Mercalli Intensity Scale of 1931 Bull Seis Soc Amer 53 979-9871956 version prepared by Charles F Richter in Elementary Seismology(1958) 137-138 W H Freeman and Company
VI Felt by all Many frightened and run outdoors Persons walk unsteadily Windows dishes glassware broken Knickknacks booksetc off shelves Pictures off walls Furniture moved or overshyturned Weak plaster and masonry D cracked Small bells ring(church school) Trees bushes shaken (visibly or heard to rustle--CFR)
VII Difficult to stand Noticed by drivers of motor cars Hangingobjects quiver Furniture broken Damage to masonry D includingcracks Weak chimneys broken at roof line Fall of plasterloose bricks stones tiles cornices (also unbraced parapets andarchitectural ornaments--CFR) Some cracks in masonry C Waves on ponds water turbid with mud Small slides and caving in alongsand or gravel banks Large bells ring Concrete irrigationditches damaged
VIII Steering of motor cars affected Damage to masonry C partialcollapse Some damage to masonry B none to A Fall of stucco and some masonry walls Twisting fall of chimneys factory stacks monuments towers elevated tanks Frame houses moved onfoundations if not bolted down loose panel walls thrown outDecayed piling broken off Branches broken from trees Changes inflow or temperature of springs and wells Cracks in wet ground and steep slopes
IX General panic Masonry D destroyed masonry C heavily damagedsome times with complete collapse masonry B seriously damaged(General damage to foundaticns--CFR) Frame structures if notbolted shifted off foundations Framed cracked Serious damageto reservoirs Underground pipes broken Conspicuous cracks inground In alluviated areas sand and mud ejected earthquakefountains sand craters
X Most masonry and frame structures and bridges destroyed Seriousdamage to dams dikes embankments Large landslides Water thrown on banks of canals rivers lakes etc Sand and mudshifted horizontally on beaches and flat land Rails bent slightly
XI Damage nearly total Large rock masses displaced Lines of sightand level distorted Objects thrown into the air
86 APPENDIX III EARTHQUAKE EDUCATION PAMPHLET PUBLISHED IN FIJI
EARTHQUAKE What to do how to help
-
bull - -C II
deg
Damage at Suva wharf caused by the 1953 -earthquakelw hich was followed by a tidal wave within 30 seconds
1 411_0- shy
87 from theA message Minister for Lands
Recent earthquakes in Waya tsunamis might be the most Island and the even more recent one effective means of mitigating which rocked the city of Suva short- the worst effects of a sudden ly after 9am on Decanber 171975 calamity in these two potentshyand the ensuing panic reaction of ially dangerous forms is to the people are sharp reminders to us know more about them that although Fiji is situated in an
Indeed the suddennessearthquake zone there is little in-the severity of a wideshyformation available to the public on and
spread disaster could disruptearthquakes and tsunamis (tidal which are often associated all communications and paralysewaves)
with the type of earthquakes we have even the most efficient and experienced in Fiji well-drilled emergency organishy
sation it is hopeZ that the infor-
Survival in those cirshymation pamphlet prepared by myministry on earthqkes and tsunamis Ceatnces would depend on
will allay some of the natural alarm each individuals own knowshy
which people exp -ence during even
the minor tremor- Because we are in an
It has been brought to my earthquake belt it would be
notice that at least one expert has prudent for people living in Fiji to make themselvespredicted the chance of a serious
earthquake in Fiji as 140 years thoroughly familiar with the
one earthquake every 40 years information contained in this pamphlet
However with the exception of the earthquake and tidal waves in I wish to take This 1953 we are fortunate not to have opportunity to appeal for your suffered a more serious earthquake full co-operation in answeringthe questionnaire on earth-
They are probably the most quakes and tsunamis which terrifying and devastating phenomena appears on page nine of known to man this pamphlet as accurately
Unlike other natural disas- as possible
ters such as hurricanes and flood- The aim of the ing the tragedy of earthquakes is questionnaire is to locate that there is no forewarning of their and map the fault-line zones coming from which it is suspected
The very recent earthquake that most of our earthquakes in Hawaii is an obvious in- originatedisaster
dicator that the science of predicting The success and the earthquakes is still in the early efficiency of any kind of stages of development emergency relief system may
Although the recent occurrence depend on your co-operation in Hawaii might not rank among the in providing the informationworlds most serious earthquakes we sought- SNWqanivavalagi
orldssrios msteathqakes weMinister for Lands and Mineralknow from the experiences of other Resources countries that earthquakes can be totally devastating
However remote the possibishyity of a serious earthquake and
2
88
7 -
Part of the damage to the Suva Harbour reef caused by the 1953 earthquake
70 per cent from FIJI area About 70 per cent of the masonry landslides or drowning
worlds deep earthquakes are recorded in the tsunami from the Fiji area Most of them are Another earthquake with not felt because they occur at great an intensity of four to five was depths of about 400 to 600 kilometres ecperienced in Suva in 1961but (24845 to 37267 miles) beneath thecasdolmirdmget
surfac of te ebuildings
These types of earthquakes are not dangerous or damaging because of the depths at which they occur ButOtra they ore scientifically interesting
because they help geologists to deduce
the structure of the crust
The types of earthquakes which can be very damaging are those of large magnitude which occur in thebecase tey Todedueelp eolgist top 50 kilemetres (3106 miles) of the earths crust
The 1953 earthquake which hcd on epicentre (origin) 15 miles west of Suva was of this type That earth-quake had an intensity of seven out of a Mercalli scale of 12 and result-ed in a tsunami (tidal wave) which occurred 30 seconds after the quake and affectedoiSuva and davu About seven people were killed by falling
Several smaller shocks have been reported since then
w here re oftenearthquake fe arrtua aaso avun
fhlare laldes odrwi savu Taveuni and recentlythe WayA - Nadi - Lautoka area
Reports received after the 1953 earthquakes also show f l itle dmage incstes t that several very strong earthshyquakes have been felt in the
Fiji area since the early 1800s A o the
caused lthu d thse in tha the increasing density of popushyltion and buildings would make the area more prone to damage unless buildings are properly reinforced to withstand strong lateral motions from earthrukes
89 Quakes come In two main types
Volcanic earthquakes are asso-ciated with the movement of molten rocks underground usually at depths of less than 30 kilometre5 near active or inactive (at surface) volcanoes
These volcanic earthquakes are
often called tremors because they tend to occur frequently and almost continuously and are often associat-ed with possible forthcoming erupt-ions of volcanoes
Fortunately it has been over a million years since volcanoes erupted in most parts of Fiji al-though the most recent volcano was probably active less than 2000 years ago in the Taveuni area
Because of the long period of
time since previous eruptions vol-
canoes in most parts of Fiji can be or least inshyconsidered extinct at
active
The possibility of another
eruption occurring at some future time cannot be totally discounted
But it should be reassuring to note that with modern advances in instru-mentation it is becoming increasing-ly possible to predict the likeli-hood of impending volcanic activity
Tectonic earthquakes the other
major (and more common) type are due
to the movements of relatively solid parts of the earths crust against each other
Such motions c 3n be in the form of the swallowing of a large portion (or plate) of the crust into a trench area
For example the Eastern Pacific plate is postulated to be drifting westward at the rate of about 10 centimetres (roughly 394
inches) a year and is being swallowed or subducted under the Western Pacific plate in the Tonga trench area
The subduction of one plate under another causes friction between the plates and causes numerous earthquakes fortunately at great depthsshyabout 500 to 600 kilometres (31056 to 37267 miles)
Tectonic earthquakes occur also along fault lines which are zones of weakness in the earths crust usually at fairly shallow crustal depth
Geologists have mapped a number of fault areas in Fiji where it is apparent that one rock mass has been moved (or displaced) relative to an
adjacent rock mass through the release of stresses and strainsbrought about during the geoshylogca dvlp n the islands
Fortunately again most
of the faults which have been mapped are thought to be inshyactive
But there are some fault zones which could be active and it is quite likely that the strong 1953 earthquake was caused by fault movement offshyshore from the Kalokolevu shyso ara
The recent earthquakes felt in the Waya - Nadi -Lautoka area could be due to fault movements several miles offshore south-west of Waya
In 1976 the Mineral Reshysources Division intends to do
detailed mapping of these possibly active fault-zone areas near Suva and in the west of Waya
Other plans are for the division to make greater use of instruments and become inshyvalved in the recording of earthquakes
9
THE MAIN DANGERS Collapse of buildings due to
lack of reinforcement poor building materials (eg adobe type) or un-satisfactory foundations
Broken overJ ead power lines can
occur quite easily and are partishy
cularly dcnprous because many people have the inclination to run outdoors when they feel a strong earthquake
Landslides are possible alongLandlidsposibe aongofae fault zones or very wet areas pbrti-cularly where hillsides are steep
One person was killed in the Namosi area by landslides during the 1953 earthquake
Earth movements and chasms People naturally tend to have a very strong fear that the earth will open up and swallow them during an earth-quake However there is only one pro-perly documented case in recorded history of a person being crushed in a fissure Basically the danger of falling into chasms is minimal and the natural terroz of people from this is apparently the result of ex-
Fire can be one of the most dangerous effects of earthquake as evidenced by the disasters in Son Francisco in 1906 and Tokyo in 1923 Perhaps the worst problem from fires caused by earthquakes is that water pipes are often broken and firemen are forced to use less accessible alternative sources such as a river or the sea
Tsunamis are a particular kind
of sea wave which can build up follow-ing an earthquake In the past they have devastated cities and small settlements along the coasts of Chile Peru Alaska Hawaii Japan and other countries These waves travel across the Pacific Ocean at jet speed (more than 600 miles an hour)
In shallow wters t5unamis become a threat to life and property because they can reach up to miore than 100ft high at wave crest levels and strike with devastating force
5
We have no official record of any extensive tsunamis in Fiji except for the one caused by the 1953 earthquake which claimed some lives in Suva andKadavu
Other tsunamis are likely to have occurred in earlier times but were not identified especially as tsunamis becauseour lack of experience with them
The barrier reef round much of the islands helps to dissipate some of the wave
energy and therefore some ofthe dangers
But we should realise that we can still bevulnerable to waves especially from a southerly direction where our reef systems are less extensive
If a very strong earthshyquake is felt in Fiji you should prudently assume that it has originated within the Fiji group and is likely to have generated a tsunami
In the 1953 case the tsunami was about csft high when it hit the reef outside Suva within 10 seconds after the earthquake
A 6ft wave then travelled across the harbour and hit the waterfront about three to four minutes later causing only
slight damage and leaving many
But the tide was low at that time If it had been high tide the waves could have been about 9ft high and the effects could have been disastrous
Waves 5ft to 6ft high
also hit Lami Deubq Be--Island and Koro Island and a 15ft-high wave claimed two lives at Nakasaleka Kadavu Smaller waves were felt at Ovalauthe southern coast of Vanua Levu and in the western Lou Group
Precautons to take Because earthquakes occur
suddenly and without warning there ore only a few precouton5 people can take such as ensuring that houses are on firm foundations and are suitably reinforced to withstand earthquakes
The following modified version of on earthquake notice is reproduc-ed from a California Geology article published in October 1975
When an earthquake occurs For a minute or two the earth may pitch and roll like the deck of a ship The motion is frighteningbut unless it shakes something down on you it is probably harmless in itself Keep calm and ride 4t out Your chances of survival are good if you know how to act
During the shaking If indoors stay indoors Got under sturdy fur-niture such as a table Stay near the centre of a building and stay away from glass Do not use condles matches or other open flames
Do not run through or near buildings particularly concrete ones where there is danger of fall-ing debris If outside stay in the open away from buildings and power lines
If in a moving ccr stop but stay inside
After the r akinq Check your water and electricity
If water pipes are damaged or electric wires are shorting turn off at primary control point If in a low-lying coastal area which can be affected by tsunamis leave house and make for higher ground (see tsunami safety rules below) Turn on radio for emergency bulletins Stay out ofaamaged buildings- aftershocks can shake them down
In a 1961 study of earthquake risks in Fiji RHoutz estimated that the chance of a strong quake occurring here -was about 140 ie
6
once every 40 years This figure should be reassuring But one must remember that it is only an estimate -and that once in 40 years could be toshymorrow
Tsunami Safety Rules Tsunamis follow no disshy
cernible pattern of occurrence When you receive a tsunami warning you must assume that a dangerous wave is on its way
History shows that when the great waves finally strike they claim those who have ihed the wnin ve
ignored the warning The following tsunami
rules were extracted from a pamphlet prepared by the US Environmental Science Services Administration and they should be noted 1 An earthquake in your
area is a natural tsunami warnshying Do not stay in 1-yving coastal areas after a strong local earthquake
2 A tsunami is not a single wave but a series of waves Stay out of danger areas until on all-clear is issued by a competent authority
3 Approaching tsunamis are sometimes heralded by a noticeshyable rise or full of coastal water This is nature s tsunami
warning and should be heeded 4 A small tsunamiat one
beach can be a giant one a few bea a Do nt le the milesaway Do not let the modestse ofowve ma you lose reect for whut may follow
5 All tsunamis - like hurricanes -are potentially dangerous even though they may not damage every coastline they strike
6 Never go down to the beach to watch for a tsunami
92
yocn thetoo L see wave you are After 5Oft
too close to escape it
7 Sooner or later tsunamishit visit every coastline in the Pacific Warnings apply to yollif you live in Suva reef any Pacific coastal Olrea
8 During a tsunami emergency A section of the Suva Harbour reef your local emergency organisations forced upwards by the 1953 earthshywill try to save your life Give quake A tsunami -(tidalwave) 50ft them your fullest co-operation high hit the reef within 10 seconds
Unless otherwise determined by after the quake and sent a 6ft wavecompetent scientists potential to the shoreThis struckdanger areas are hose less than watershyfront about three to four Ainutes 50f above sea level and within one later and caused minor Cdamage but
mile of the coast for tsunamis of only because it was at low tide any origin
7
Measuring their size Earthquake magnitudes are
measured on very sensitive seismolo-
gical instruments Theseare often referred to as the Richter scale and the largest shock known to date had a magnitude of 89 on Richter scale (compared to 675 for the 1953 Suva earthquake on the same scale)
hat is in commonAnother scale use and depends on physical effects and observations is the modified Mercalli scale which is reproduced here It measures the intensity of earthquake and is graduated from one to 12 for measuring
Modifiedl Mercalli scale1956 versiont
Earthquake intensity
1 Not felt except by a very few under especially favourable (for
the arthuak)crcustanesamountsthe earthquakes) circumstances
2 Felt only by a few persons at rest especially on upper floors of buildings Delicately suspended objects may swing
3 Felt quite noticeably indoors especially on upper floors of build-ings but many people do not recog-nise it as c earthquake Standing motor cars muy rock slightly Vib-ration like passing truck Duration can be estimated
4 During the day felt indoors by many outdoors by few At night some awakened Dishes windowsdoors disturbed walls make creaking sound Sensation like heavy truck striking building Standing motor cars rocked noticeably
5 Felt by nearly everyone many
awakened Some dishes windowsetc broken a fewinstances of cracked plaster unstable objects overturned Disturbances of trees poles and other tall objects sometimes noticed Pendulum clocks may stop
6 Felt by all many frightened
and run outdoors Some heavy furni-
ture moved a few instances of fallen plaster or damaged chimneys Damage slight
8
7 Everybody runs outdoors Damage negligible in buildings of good design and construction slight to moderate in wellshybuilt ordinary structures considerable in poorly built or badly designed structures some chimneys broken Noticed
by persons driving motor cars
8 Damage slight in specialshyly designed structures conshysiderable in ordinary substantshyial buildings with partial collapse great in poorly built structures Panel walls thrown out of frame strucTures Fall
f fameystrctresasof chimneyq factory stcks
columns monuments walls Eeavy furniture overturned Savy fniur e -turned
Sand and mud ejected in small Changes in well water
Disturbs persons driving motor
cars 9 Damage considerable in
specially designed structures well-designed frame structures
thrown out of plumb great in substantial buildings with partial collapse Buildings shifted off foundations Ground cracked conspicuously Undershyground pipes broken
10 Some well-builtwooden
structures destroyed most masonry and frame structures destroyed with foundations ground badly cracked Rails bent Landslides considerable from river banks and steep slopes Shifted sand and mud Water splashed over banks
11 Few if any (masonry) Ltructures remain standing Bridges destroyed Broad fissures in ground Underground pipelines completely out of service Earth slumps and land
slips in soft ground Rails bent greatly
12 Damage total Waves seen on ground surfaces Lines of sight and level distorted Objects thrown upward into the air
FILL THIS IN TO HELP THE EARTHQUAKE STUDY
To enable an improved study of shallow local earthquakes the coshyoperation of the public is required in filling out the following questionshynaire whenever an earthquake is felt Many earthquakes are very small and sometimes are not recorded on seismological instruments This questionnaire system will enable the Mineral Resources Division to better determine the location of earthquake zones which can then be mapped in detail
EARTHQUAKE QUESTIONNAIRE
1 An earthquake was felt on at am or pm
Place
2 What direction did the shock come from
o ooo mge oe e o o o o
3 How many seconds did the quake last
4 Was the shaking rapid or slow
5 Where were you when the earthquake occurred
6 Were you awake asleep or awakened
7 Were you walking working standing sitting or lying down
8 Did the people around you feel the earthquake too
9 Did people run outside
10 Did cracks occur in the buildings you were in
11 Was the building damaged in any otherway
o
12 What is the building made of
13 Did the windows doors dishes rattle
14 Did hanging objects doors etc swing 0000000000600
Turn to next page 9
95 15 Did vases small objects furniture overturn
e
16 Did things fall off shelves
17 Did you notice any unusual waves in the sea after the quake 00 0a -0 0 000aV0a0a0 000000a000 00
18 1f so h6w soonafterwards 0 BO
e a 0000000amp000000000amp0000 a a
What were the waves like 00000619
20 Did anything else unusual happen
0 o a o e e o o 0o e o e e eo o eo 6 o e e e oIe e e o o o adegdeg e odegI e o o oo oo oe 1 8 aampv a
21o Any other remarks e
N me a
Complete formtear out this whole page and mail to
The Director of Mineral Development Mineral Resources Division Private Bag GPO SUVA
This special booklet is published by the Ministry of Information at Government Buildings in Suva for the Ministry of Lands and Mineral Resources
(JANUARY 1976)
10
96
In the wake of the 1953 quake
1M
Crack in the coral
A -rac) in the main Suva reef after the earthquake and tidal wave in 1953
12
T SANERIVE Government Printer Suva Fiji
98
APPENDIX IV SEISMOLOGICAL FACILITIES AND EARTHQUAKE HAZARD PROGRAMS IN THE SOUTHWEST PACIFIC
As part of our program of field investigations in Fiji Tonga andVanuatu our researcher was able to visit the neighboring island countries of the Southwest Pacific region During these visits he was able to meetwith scientists and public officials involved with the earthquake hazard problem facing each country In every case the governments are aware ofand have taken some action to mitigate the potential losses due to destrucshytive earthquakes but these governmental responses have varied widely fromcountry to country This report focusses on the seismological institutionsand facilities in each of the countries and their capablities in assessingand planning for carthquake hazards In the following sections we conshysider each of the island countries of this area which face a severe earthshyquake risk Fiji Tonga Vanuatu Western Samoa Solomon Islands PapuaNew Guinea and New Zealand
FIJI
Seismological Facilities
Seismological observations in Fiji are conducted by the Mineral Resources Department a subdivision of the Ministry of Energy and MineralResourcs The government has made a major commitment to seismologicalwork since the establishment of the AID-supported seismic network in 1979In fact seismological observations in Fiji have been carried out since theearly part of this century supported at first by the New Zealand scienshytific organizations and subsequently strengthened by Lamont GeologicalObservatorys Upper Mantle Project in the 1950s and 1960s In late 1979the 8 -station US AID network was established to complement three permanent stations in Viti Levu The network was significantly expanded byinstallation of a five-station telemetered network in 1981 supported byJapanese aid (Figure Al) Additional stations were installed in 1983 and 1984 the network has now expanded to an eighteen-station national networkwith excellent coverage of the Fiji region In addition MRD now has available five MEQ-800 portable seismographs for occupation of temporaryfield sites telemetered station testing and special refraction experiments While the Fiji network has experienced considerable technical difficulties it has recorded over 2000 earthquakes since its installationand provides an invaluable basis for seismological study of the Fiji region
Strong Motion Accelerographs
The Mineral Resources Department also operates a network of strongmotion accelerographs now numbering ten Kinemetrics SMA-ls (Figure A2)The initial six instruments of this network were granted to Fiji by AIDthe remainder were purchased by the Fiji government Since establishment of the SMA network three accelerogram records have been obtained from moderate-sized earthquakes in Viti Levu Records obtained from thisnetwork are expected in the long run to provide the basis for predicting
tTT Illt EAST OF +NWICH IS0 WEST OF GREENWICH III
Y 7sdeg NATIONAL NETWORK OF SEISMOGRAPHIC STATIONS 1982
AC7
DEELLAAIKOORROOMTRE
23O~~~~ ROTUMU
YASAWAIRAR C1
00
A0 KORO
-W
0
I VUNH SOUTHRIOGE A
~)AVALAU 0
NADI A A ONASAVULAU
MAGOORO A VUNIOAWALAU
VIT LE U _LAKEPe NAMOSI AUNIAA -GAJ
ALOAA0A NAMORO SUVA
VITICLEVU
13 BEOA
LEGEND A E-isting Station
I RAKRAKI A Proposed Station Toloyo
Motulu Fuloo amp
EAST OF GREENWoICH ISO WEST Of GREENWICH ITS
Figure Al Network of seismic stations in Fiji established through the assistance of US AID and Japanese aid programs
_ _ _1_ Q__
NATIOqAL NETWORK OF EAST
STRONG OF OEEwICH
MOTION IO WEST 0 OREV-1CM
ACCELEROGRAPHS 79
LEGEND
A Accelerograph
0 30 60 KLOLETRES
LBS
YASAWA
lt ---shyVANUA LEVU U
T EUW r
S|bullKORO 0
T
V2anua bala~u
N
0
LA IV)DI A MON~ASAVU V
9LAU
VITI LEVU OKA1)
(4)
GAU
LAKE1A
0 11-
Kld
A S T O r
Maluku
GREN Wa
Toloyc
I 0 W E S T O f C REEM CN I
Figure 2A Location of strong-motion accelerographs in Fiji
100
ground accelerations and thus for development of building codes specific to Fijis tectonic setting
Related Scientific Programs
The Mineral Resources Department includes an Offshore Geology sectionwhich has an active program of marine geological and geophysicalinvestigations in and around Fiji waters MRD also employs an engineeringgeologist whose work includes microzonation of the Suva area mapping ofactive faults in southeastern Viti Levu and investigation of soils subjectto earthquake-induced liquefaction An active program of geologicalmapping and structural studies is also carried out by MRD They aresupported by personncl assistance from Australia and Great Britain
Suva is also the home of the United Nations Committee for Coordinationof Offshore Prospecting in South Pacific Offshore Areas (CCOPSOPAC) Thisorganization coordinates much of the international marine research carried on in the region and has been particularly helpful with Fijisinvestigation of its offshore waters
Critical Facilities
The major development in Fiji has been in and around the capital cityof Suva The population of the metropolitan area now exceeds 130000 and most of the government commercial and industrial operations are concentrated there The city has become a major commercialtransportation and regional political center and has developed rapidly inthe past ten years Development in this period has included constructionof multistory buildings a major electric power plant expansion of theSuva harbor and most recently completion of the thirteen-story CentralMonetary Authority building in downtown Suva Much of this development hastaken place on an area of filled land close to sea level particularlyvulnerable to earthquake and tsunami damage This area was extensivelydamaged by the 1953 Suva earthquake and tsunami and is thus at significantrisk from a repeat occurrence of an event of comparable size
Other population centers with significant development include thetowns of Lautoka (pop 29000) Nadi (13000) and Ba (9000) on the islandof Viti Levu and Labasa (13000) on Vanua Levu The tourist industrywhich is a major part of Fijis economy is concentrated on the southernand western coasts of Viti Levu and is also vulnerable to earthquake andtsunami damage The major development project in Fiji is the 87-meter highMonasavu Dam in the interior of Viti Levu The earthfill dam was completedin 1983 and is planned to provide most of the countrys electric powerneeds through the end of the century
Earthquake Preparedness Programs
In awareness of the serious earthquake risk to development in Fijithe government has adopted New Zealand earthquake design codes for most ofthe urban areas of the country Seismic zone B codes applicable to areas of moderate seismic activity in New Zealand have been chosen asappropriate and are applied (in theory at least) to all domestic andcommercial construction in urban areas Considerable difficulty remains in
101
enforcement of these regulations particularly in construction of privatedwellings Major multistory building design is generally handled by overseas (Australia or New Zealand) engineers and dynamic modelling tests are generally applied for earthquake loadings at least as large as those required by the New Zealand codes The Monasavu Dam underwent dyiamictesting by Australian consulting engineers
Disaster preparedness is the responsibility of the Emergency Services Committee (EMSEC) and the Prime Ministers Relief and Rehabilitation Committee (PMRRC) EMSEC is responsible for coordination of disaster plans maintenance of essential services advice to the Cabinet on emergency measures and direction of relief work It is comprised of representativer of the related ministries and public agencies PMRRC is chaired by the Prime Minister of Fiji and has responsibility for long-termrelief policy and rehabilitation programs Fijis experience with recurrent weather-related disasters has spurred efforts for emergencycommunication systems supply distribution temporary shelters and so on Much of this hurricane disaster planning is applicable as well to earthquake and tsunami damage Fiji is also a participant in the International Tsunami Warning System
Educational programs have been handled through the Fiji BroadcastingSystem the Red Cross and the school sysem To a limited dgree the Public Works Department and the Mineral Resources Department have producededucational materials related to earthquake hazards in Fiji
TONGA
Seismological Facilities
Seismological observations in Tonga are the responsibility of the Ministry of Lands Surveys and Natural Resources Due to fiscal constraiits however these efforts have in the past been entirelydependent on foreign assistance Seismological experiments began in Tongain the mid-1960s with Lamont-Dohertys Upper Mantle Project Seismic stations were operated by Lamont-Doherty and subsequently by Cornell scientists through the early 1970s when operations were suspended In late 1983 as part of the present AID-supported seismic hazard programCornell reinstalled a three-component short-period seismograph in the capital Nukualofa The seismograph was installed upon the request of the government geologist to be operated by the Tongan government with technical assistance from Cornell Unfortunately after operation of the seismograph for eight months Tongas Cabinet decided that the drain on its resources and personnel was excessive and the instruments were disconnected in May 1984 with the components transferred to Fiji and Vanuatu where they can be utilized There are presently no plans to reinstall permanent seismographs in Tonga
Strong Motion Acceierographs
Two strong-motion accelerographs provided by the AID seismic hazard program are presently operating in Tonga one in Nukualofa and one in the northern Vavau Islands They have been in operation for one year and
102
have not to date recorded any large earthquakes They require a minimum of maintenance and their operation will continue to be supervised by the government geologists with assistance from Cornell A third accelerograph may be made available to tonga by the British Geological Survey and could bB installed on Eua Island in a zone of high activity close to the Tonga Trench Related Research Programs
The Ministry of Lands Surveys and Natural Resources employs a singlegovernment geologist whose responsibilities include coordination of oil prospecting geolcgical mapping of the islands and assessment of earthquakeand tsunami hazards There has been considerable scientific study of the Tonga Trench subduction zone by research groups from the United StatesJapan New Zealand Australia Germany and the Soviet Union More detailed marine geophysical data have been collected near Tongatapu Island byAmerican petroleum exploration groups
Critical Facilities
The capital city of Nukualofa has a population of only 20000 butdoes include several three- and four-story buildings The larger buildingshave in general been designed by foreign engineers and have included earthquake- resistant design specifications Other significantdevelopment projects include the expansion of the government wharf in Nukualofa and development of tourist resorts on Tongatapu and several of the outer islands
Earthquake Preparedness Programs
There are no building codes presently enforced in Tonga Howeverconstruction of public buildings must be approvei by the Ministries of Works and Health The largest office buildings and hotels are designed byoverseas engineering firms and generally include some earthquake loadingcriteria The Land and Environment Act currently under consideration bythe Tongan government would require review of all development projects bythe government planner application of building codes largely adapted from New Zealand codes is expected to follow
Disaster preparedness programs are the responsibility of the Cabinets National Disaster Committee including representatives from the related government ministries and departments Subcommittees focus on disaster preparedness action planning and long-term relief and rehabilitation There is no earthquake education program in Tonga
WESTERN SAMOA
Seismological Facilities
One of the earliest seismic stations in the Pacific was established atthe Apia Observatory in 1902 during the German colonial period through the University of Gbttingen In 1921 control of the observatory was transferred to the New Zealand Government Weichert seismographs were
103
operated continuously at Apia through 1957 when they were replaced by Benioff instruments at Afiamalu and by short-period Wood-Anderson instruments at Apia Since Samoan independence in 1963 the Observatory has been operated jointly by the Samoan Government and the Department of Scientific and Industrial Research (DSIR) New Zealand In 1963 a Worldwide Standard Seismograph Station was established at Afiamalu Operation of this six-component station is supported by the US Geological Survey In 1980 the station was upgraded to allow digital reccrding equipment was added to upgrade the station to the status of a Global Digital Seismic Network station Seismic records are sent to DSIR in Wellington for permanent storage
Strong Motion AccelerograDhs
A simple strong motion instrument has been operating in Apia since 1979 It is an event-triggered low-gain seismograph recording on an ink-stylus recorder At the time of our visit to Western Samoa the instrument had been out of service for several months Only one event has to date triggered the instrument
Related Scientific Programs
The Apia Observatory has also made continuous magnetic field measurements since 1905 Measurements are currently made using a Schultze earth inductor an Askania declinometer and a proton magnetometer The observatory maintains two tide guages as part of the Pacific Tsunami Warning System Offshore resource studies have been carried out through CCOPSOPAC and by various international research groups Much of the reconnaissance geological work in Western Samoa has been carried out by DSIR in New Zealand
Critical Facilities
Like many of the other island countries of the Pacific Western Samoas development has been concentrated around the capital Apia (pop 34000) A major deep-water harbor and the countrys tourist industry are based in Apia Several multistory buildings have been erected in Apia in the past several years A hydroelectric dam on Upolu Island was completed in 1978
Earthquake Preparedness Programs
There is presently no disaster plan in effect in Western Samoa The various agencies involved with emergency action are coordinated through the Police Commissioner New Zealand seismic zone B codes are applied to construction in Western Samoa Enforcement is handled by the Public Works Department Modest educational materials have been prepared by the Apia Observatory staff in English and Samoan for distribution through schools and public agencies
104
SOLOMON ISLANDS
Seismological Facilities
Seismological Observatories in the Solomon Islands are conducted bythe Ministry of Lands Energy and Natural Resources They have operated aWorldwide Standard Seismic Station in Honiara since 1962 operation of the station is supported by funds from the US Geological Survey The station was augmented by two short-period telemetered seismic stations in 1982 This three-station necwork was provided through the British GeologicalSurvey with the aim o identifying volcanic earthquakes associated with theactive volcano Savo located close to the capital
In awareness of the high volcanic risk to population centers in theSolomon Islands the Ministry has drawn up plans for two three-station telemetered arrays to be deployed around the active volcanoes on Simbo Island (New Georgia Group) and on Tinakula Island (Santa Cruz Group) Theyare presently seekirg foreign aid in the form of seismic instrumentation and technical asistance to establish the network
The Ministry also has responsibility for field surveys following majorearthquakes in the Solomon islands Studies of ground deformation and cultural effects of the large 1977 and 1984 earthquakes were made by seismology officers
Strong Motion Accelerographs
Two strong motion accelerogaphs were installed on Guadalcanal by theMinistry in late 1984 They will be responsible for maintaining the instruments but have requested Cornells assistance in analyzingaccelerograms obtained during their operation The high level of shallow activity near Guadalcanal suggests that a significant number of strong-motion records will be obtained during the lifetime of the instruments
Related Scientific Programs
The Ministry also carries out related research programs in regionalgeology minerals assessment groundwater studies and so on Extensive marine surveys have been caried out in the Solomon Islands by the USGeological Surveys Resource Assessment Program Local offshore surveyshave been carried out through CCOPSOPAC A tide gauge is maintained bythe Solomon Islands Hydrographic Unit Six proton-precession magnetometers are operated in the Solomon Islands by the Queensland University (Australia)
Critical Facilities
Over 90 of the Solomon Islands population remains in rural areas The major development is in Honiara the administrative and commercial center of the country Honiara (pop 15000) is the major shipping center of the country and now includes several multistory buildings
105
Earthquake Preparedness Programs
The Solomon Islands implemented a National Disaster Plan in 1980 subsequently revised in 1982 The Plan gives the Ministry for Home Affairs and National Development overall responsibility for coord~lation of efforts in earthquake volcanic and tsunami disasters Operational relief effort are carried out through the Disaster Operations Coordinator and the Provincial governments
The government has adopted the most stringent earthquake building code (Zone A) from New Zealand for multistory building construction in Honiara Implementation of these guidelines continues to be a problem One multistory building in Honiara (Australian High Commission Building) was severely damaged during the 1984 earthquake Some efforts have been made to develop small-scale earthquake-resistant building techniques appropriatefor rural areas The Pacific Islands Development Program organized a model house construction and workshop during early 1984 A modest outreach program has developed through the school system adult education programs and the government broadcasting company
PAPUA NEW GUINEA Seismological Facilities
The government of Papua New Guinea has made an extensive commitment to earthquake and volcanic hazard mitigation through construction of a national network of seismographs and accelerographs (Figure A3) A ten-station national network of seismographs is monitored by the Port Moresby Geophysical Observatory (Department of Minerals and Energy) Three of the remote stations are telemetered to Port Moresby via microwave links four stations operate as permanent field stations and two are operated at temporary sites on outlying islands Port Moresby is presently the site of a Worldwide Standard Seismic Station that has operated since 1958 The national network reports arrival times to the US Geological SurveysPreliminary Determination of Epicenters and the International Seismological Centre but does not routinely locate events independently
In addition to the national seismic network the Rabaul VolcanologicalObservatory operates seven seismic stations near active volcanoes around the country and a nine-station telemetry network around the Rabaul Caldera Bougainville Copper Limited opeates a 5-station network on Bougainville Island (North Solomons Province)
Strong Motion Accelerographs
The Port Moresby Geophysical Observatory maintains a national network of thirteen strong motion accelerographs distributed in the highly seismic areas of the country (Figure A3) This includes a closely spacedfour-station network around the Rabaul Caldera A single strong motion accelerograph is situated on Bougainville Island and is maintained byBougainville Copper Limited The network uses Kinemetrics SMA-I and New Zealand DSIR MO-2 instruments and has recorded tens of accelerograms since its establishment in 1967 The Observatory ispresently trying to to establish an engineering seismologist position to analyze the accumulating data and to further upgrade the accelerograph network
I I I I I I I I I I
Re--o -joso shy
Mooo u J4D (Ro-js
bull~~vASeA saxA+ Samp-cUong sloon
(twu lueoaott koRowq (KvG) jjj ccurodAj a~OlF
Accv~tj (8~Cli
Raboul (PART 2bLo(MOG) C GoTo and -4-A Duke of Tok
vie W~~IiTUI = a
Rogno SGA Kowumbukae0
lebub-gn ITPAc l-O MARCH agno BGAI
Tank ( F -goono PAAl
Coo Glooclslb Island I OSOGRAP SEISM A-D ACCELEOGR -
_____ L I IS IIsI I I
IPUGI
PAPUA NeW GUI NEeAr rp n w k
hTTWORKS MARCH 1384
IG -nol 1v
Figure A3 Papua New Guinea seismograph and accelerograph networks a
107-108
Related Scientific Activities
In addition to the Geophysical Observatory the Department of Mineralsand Energy includes the Geological Survey of Papua New Guinea The Surveyundertakes a wide range of geological investigations including regionalgeological mapping petroleum and mineral exploration engineering andenvironmental geology and energy resource development Offshore surveyshave been carried out through CCOPSOPAC as well as American and Austrrlianresearch vessels Continuous monitoring of the magnetic field is carriedout by the University of Queensland (Australia) Ten tiltmeters have beendeployed by the Volcanological Observatory to monitor ground deformation near Papua New Guineas active volcanoes Four of these instruments are deployed around Rabaul Caldera
Critical Facilities
Papua New Guinea is the most developed of the island countries of theSouthwest Pacific with a population of over 3000000 and extensive urbandevelopment The capital city of Port Moresby has a population of over 130000 with major multistory construction in the downtown area a majordeep water harbor and significant commercial and industrial activity in thePort Moresby area There is significant development as well in the smaller towns of Rabaul Lae Madang Wewak Goroka Mount Hagen Wau BuloloDaru and Kerema Major hydroelectric schemes have been established on theRamu and Rouna rivers with additional hydroelectric plans at various stages of evaluation and development Extensive mineral development hastaken place in the North Solomons Morobe and Western provinces of PapuaNew Guinea Extensive natural gas and limited oil deposits have beenlocated these may become commercially exploited in the near future
Earthquake Preparedness Programs
Papua New Guinea has a long history of earthquake and volcano-relateddisasters A national disaster program was established in 1981 and provides for a National Disaster Emergency Committee which formulates emergency government policy and a Disaster Civil Defence Committee which is responsible for implementation of short-term relief efforts Theprovincial governments are given major responsibility for initial coordination and assessment of disasters assistance is subsequentlyrequested from the federal government for major disasters Many of theprovincial governments have not revised preparedness plans since thecolonial period However particularly intense effort has been directed inEast New Britain province because of the imminence of a potentiallydestructive volcanic eruption in Rabaul Caldera
The town of Rabaul (pop 15000) is a major commercial center forPapua New Guinea and is situated directly within the caldera of an activevolcano A relatively small eruption took place at a secondary eruptivecenter near Rabaul in 1937 killing over five hundred nearby residents andforcing the evacuation of the town In order to avoid a repeat of such adisaster the government established the Volcanological Observatory withfour full-time volcanologists and real-time earthquake location andanalysis of tilt data A drastic increase in volcanic seismicity in mid-1983 led to a volcanic hazard alert and intensification ofseismological and ground deformation studies around Rabaul In addition
109
the alert allowed the provincial and national Disaster Emergency Committees to make extensive evacuation and relief plans for a possible eruption at Rabaul including preparation of a new airstrip improvement of roads and emergency water supplies communications systems detailed evacuation plans education programs and so on To date there has been remarkable cooperation of efforts by provincial national and overseas officials to mitigate the potentially devastating effects of a volcanic eruption at Rabaul
Papua New Guinea is the only country of the developing nations of the Southwest Pacific to have devised its own seismic zoning system (Figure A4)
The Nationwide Housing Code for Papua New Guinea sets up a four-level system of seismic loading oriented toward moderate-sized (to 8 stories)buildings Major buildings require independent dynamic analysis usuallycarried out by overseas engineering firms Seismic Zone 1 of the HousingCode is among the most stringent earthquake loading codes in the world and includes the town of Rabaul and much of the East New Britain and North Solomons provinces Seismic zone 2 includes the towns of Lae Wewak and Madang and is approximately equivalent to New Zealand Zone A or California loading designs The capital Port Moresby is in the lowest seismic zone (4) but buildings constructed there still require designsallowing for significant lateral loadings
Earthquake education is handled through the National Radio Government Printing Office the Civil Defence Department and the school system with information supplied by the Geophysical and Volcanological Observatories A particularly intense education effort has been mounted in Rabaul where educational materials have been produced and distributed in three languages and public involvement in preparedness plans has been emphasized
NEW ZEALAND
While New Zealand cannot be considered one of the developing countries of the Southwest Pacific its seismology programs have been responsible for much of the observational data available for the entire region Because of its importance to the other national seismology programs we briefly review here the New Zealands observational facilities Its extensive programs in engineering seismology its critical facilities and its earthquake preparedness programs will not be covered here
National Seismic Network
Seismological facilities in New Zealand are maintained by the Geophysics Division of the Department of Scientific and Industrial Research (DSIR) in Wellington The natioal standard seismograph network presentlyconsisting of thirty short-period stations is shown in Figure A5 The network routinely locates all earthquakes of ML gt 38 within New Zealandand earthquakes with Ms gt 50 for the region within 100 of New Zealand Arrival time data are routinely transmitted to the US Geological Surveyand the International Seismological Centre The events located by the network are reported in the annual New Zealand Seismological ReportSeveral hundred earthquakes are located by the DSIR national network each year
0 - - - --- - - - -
FIG 13
1SEISMIC ZONES FOR BUILDING CONSTRUCTION
- -- IN PAPUA NEW GUINEA
i 1d - - - - - _
(I -lt 53-0Fef cs r i eat a 1 982))j --_ _ -- r L - - --- a a V bull
N i - O(r-tIbd t
__ __ Po --shy
-- -- -
[i ~5- E I
Is-O I ___ oh - - --- - --shy-- shy
4 __J ft - - I- S 4 E jshy
_ _ _-i - _ j -z -
_____ _U 511
ZONE CLASSIFICATION OF CITIES I lZONE 30 1 I 3 1 153--ZONE3 4u shyW-t -~- 6--v 4- bull -
I == 1 --by- Ll _
Figure A4 Seismic zones for building construction in Papua New Guinea (jury et al 1982)
CAPE REINGA
ONERAHI
GREAT BARRIER AUCKLAND - C
5OCT 1914 WHITE ISLAND
KARAPIO EAST CAPE 0r WHAKATANE 15 WAIRKEIp I TUI 28 JUN 1921 t SEP19_-
CHATEAU TARADALE N U 2 FEB 19317 1897 1a Ju DEC 84
MANGAHAO 5 MAR 934 8 AUG 1904 - CASTLEPOINT ( A 1942
COs ELLINGTON IS5CT 18408 2C18BJN562 JAN 1855 23 MAY 1989
Figure A5 Seismograph stations of the national network (left) and the distribution of large shallow earthquakes (right) in New Zealand From Seismological Observatory Wellington (1980)
112
The network is augmented by long-period instruments operating atKaropiro Roxburgh and Wellington DSIR also operates a three-componentborehole seismometer in Wellington as part of the Seismic Research Obseervatory network supported by the US Geological Survey
Stations in Outlying Territories
New Zealand has also taken an important lead in operating seismographstations in outlying areas of the Southwest Pacific These stations havebeen extremely important in hypocentral control for the Tonga - Kermadec seismic zone and for nuclear event detection in the Pacific DSIR operates three 6 -component Worldwide Standard Seismograph stations at Afiamalu (Western Samoa) Raratonga (Cook Islands) and Scott Base (Antarctica) Short-period stations operate at Apia (Western Samoa)Campbell Island (New Zealand) Chatham Islands (New Zealand) Nadi (Fiji)Nime and Raoul Island (Kermadec Island New Zealand) Readings from these stations are routinely reported to PDE and ISC for global earthquake location
Wellington Network
A small-aperture high-gain seismic network is operated around Wellington an area of greatest seismic risk in New Zealand The stations are telemetered by radio or telephone link to the central recording site The network now consists of eleven stations Earthquakes are presentlydetected by a microprocessor-based Automatic Seismic Monitor and automated location processing is expected to follow The network routinely locates events with ML gt 15
Pukaki Network
A second microearthquake network has operated around Lake Pukaki ahydroelectric project in the South Island New Zealand The network wasestablished in 1975 to monitor reservoir-induced seismicity associated with impoundment of the reservoir The network consisted of nine stationsand was intended to operate on a temporary basis It has been closed since early 1984 with several of the stations continuing to support the national network and to monitor any future reservoir-related activity
Related Seismology Research
In addition to its regular observatory seismology the GeophysicsDivision has an active seismology research program Their studies have focussed on theoretical seismology earthquake prediction crustal structure of New Zealand historical earthquake studies nuclear eventdetection seismic risk in New Zealand strong motion studies and volcanic seismology The monitoring of active volcanoes is closely coordinated withcrustal deformation monitoring conducted by the Earth Deformation Section of the New Zealand Geological Survey
The New Zealand strong motion accelerograph network now consists of225 instruments operated by the Physics and Engineering Laboratory of DSIR Most of these instruments are of a New Zealand design (Mechanicaland Optical Accelerographs) and analog records are made on photographicfilm Three digitally recording accelexographs are now in operation in New
113
Zealand and the MO records are digitized for computational analysisAnalysis of this empirical data is being used for a revision of New Zealands building codes
114
REFERENCES
Berryman K 1979 Seismotectonic zoning study of the Fiji IslandsEarth Deformation Section Report 70 Wellington NZ Dept Sci and Indust Research 40 pp
Franco AB MP Hamnett and J Makasiale 1982 Disaster Preparednessand Disaster Experience in the South Pacific Pacific Islands Developshymental Program Honolulu 380 pp
Geological Survey of Papua New Guinea 1979 Information Booklet Port Moresby Dept Minerals and Energy 12 pp
Government of Western Samoa 1977 Apia Observatory 1902-1977 ApiaApia Observatory 8 pp
Jury RD JP Hollings and IAN Fraser 1982 The development ofseismic zones and the evaluation of lateral loadings for earthquakeresistant design of buildings in Papua New Guinea Bull NZ Nat Soc for Earthq Engr 5 123-140
Lowenstein PL 1982 Problems of volcanic hazards in Papua New GuineaGeol Surv Papua New Guinea Rept 827 Port Moresby Papua New Guinea 62 pp
McCue KF and ID Ripper 1980 The Papua New Guinea Strong MotionAccelerograph Network Geol Surv Papua New Guinea Rept 807 Port Moresby Papua New Guinea 13 pp
Mineral Resources Department Seismology Section 1983 National activityreport Fiji Submitted to Session IX Intl Coord Group for TsunamiWarning System in the Pacific Min Resources Dept Fiji Note 333Suva Fiji 4 pp
Parliament of Fiji 1984 Mineral Resources Department Annual Report forthe Year 1982 Parliam Paper No 13 Suva Fiji 90 pp
Power CA 1978 Earthquake risk in Fiji and the problems of earthquakeengineering Presented to the Fiji Society 17 pp
Prevot R and JL Chatelaiu 1983 Seismicity and Seismic Hazard in Vanuatu ORSTOM Rept 5-F3 Noumda 51 pp
Ripper ID 1982 Accelerogram library Geol Surv Papua New Guinea Rept 198211 Port Moresby Papua New Guinea 44 pp
Seismological Observatory Wellington 1980 The earthquake problem in NewZealand Alpha DSIR Extension Information Wellington NZ 4 pp
Smith WD 1979 Seismology and related research in New Zealand1975-1978 NZ DSIR Information Series No 140 30 pp
115
Smith WD 1983 Seismology and related research in New Zealand 1979-1982 Seismol Observatory Wellington Bull 276 32 pp
Solomon Islands Government 1982 National Disaster Plan 1982 Honiara Solomon Is 14 pp
116
A Rahimin A Simpson R Holmes P Rodda R Singh I Everingham K Draunidalo G Shorten M Mehrotra J Booth J Campbell
R Carter R Byrne G Gauss D Rubin
S Tongilava
D Tappin S Lemoto T Tukia
C Clarke
R Campillo R Foy T Lee J Rdcy J Chatelain R Prdvot
L ioane S losa A Titimaea
S Danitofea
D Tuni R Walshaw J Vunagi D Gwyun
INFORMATION CONTACTS
FIJI
Director Mineral Resources Dept Asst Director (MRD) Princ Geol OffshoreSeismol (MRD) Princ Geol Inform Services (MRD) Principle Geophysicist Senior Seismologist (MRD) Seismologist (MRD) Senior Engineering Geoogist (MRD) Struc Engr Suva City Council Civil Engineer Suva Engineering Geologist A Gibb amp Partners (Monasavu) Marine Geologist (CCOPSOPAC) Marine Geologist (CCOPSOPAC) Marine Geologist (CCOPSOPAC) Marine Geologist (CCOPSOPAC)
TONGA
Superintendent of Lands Surveys and Natural Resources Government Geologist (LSNR) Land Assessor (LSNR) Government Planner (LSNR)
VANUATU
Director Dept Mines Geology and Rural Water Supplies Director ORSTOM Mission Engineer ORSTOM Civil Engineer Public Works Dept Director ORSTOM Dept Geol and Geophys (Noumda) Seismologist ORSTOM (Nouma) Seismologist ORSTOM Nouma)
WESTERN SAMOA
Director Apia Observatory Senior Seismologist (AO) Geologist (AO)
SOLOMON ISLANDS
Chief Geologist Ministry of Lands Energy and Natural Resources
Senior Seismologist (MLENR) Senior Geologist (MLENR) Ministry of Home Affairs and National Development Civil Engineer Public Works Department
117
PAPUA NEW GUINEA
K Doble Chief Geologist Geological Survey I Ripper Chief Seismologist Geophysical Observatory G Seidel Information Officer Volcanological Observatory G Anderson Engineering Geologist Geological Survey J Wilkins Civil Engineer Dept of Works and Supply
NEW ZEALAND
W Smith Director Seismological Observatory Wellington
UNITED STATES
M Hamnett Pacific Islands Development Program G Burton Director Pacific Tsunami Warning Center R Sillcox Seismologist (PTWC) G Pararis-Corayannis Director International Tsunami Information Center
118
APPENDIX V TSUNAMI SAFETY RULES
1 All earthquakes do not cause tsunamis but many do When you hearthat an earthquake has occurred stand by for a tsunami emergency
2 An earthquake in your area is a natural tsunami warning Do not stayin low-lying coastal areas after a local earthquake
3 A tsunami is not a single wave but a series of waves Stay out ofdanger areas until an all-clear is issued by competent authority
4 Approaching tsunamis are sometimes heralded by a noticeable rise orfall of coastal water This is natures tsunami warning and should be heeded
5 A small tsunami at one beach can be a giant a few miles away Dontlet the modest size of one make you lose respect for all
6 The Tsunami Warning System does not issue false alarms When anocean-wide warning is issued a tsunami exists When a regionalwarning is issued a tsunami probably exists The tsunami of May 1960killed 61 people in Hilo Hawaii who thought it was just another false alarm
7 All tsunamis--like hurricanes--are potentially dangerous even thoughthey may not damage every coastline they strike
8 Never go down to the beach to watch for a tsunami When you can seethe wave you are too close to escape it
9 Sooner or later tsunamis visit every coastline in the PacificWarnings apply to you if you live in any Pacific coastal area
10 During a tsunami emergency your local Civil Defense police andother emergency organizations will try to save your life Give them your fullest cooperation
Unless otherwise determined by competent scientists potential danger areasare those less than 50 feet above sea level and within 1 mile of the coastfor tsunamis of distant origin or less than 100 feet above sea level andwithin 1 mile of the coast for tsunamis of local origin
REGIONAL BACKGROUND INFORMATION 13 Historical Earthquakes in the Vanuatu Region 13
SUMMARY OF FACILITIES AND PROGRAMS 19 Critical Facilities 19 Earthquake Preparedness Programs 21 Seismological Facilities 21 Strong-Motion Accelerographs 23 Related Research Programs 24
PREVIOUS STUDIES 24 Seismicity Studies Along the New Hebrides Arc 24 Seismic Potential Studies Along the New Hebrides Arc 45
ASSESSMENT OF EARTHQUAKE HAZARD 50 Seismotectonic Provinces 50 Ground Motion 54 Tectonic Uplift 61 Tsunamis in Vanuatu 61 Volcanic Eruptions in Vanuatu 66
IMPLICATIONS FOR MITIGATION OF EARTHQUAKE RISK 66 Earthquake Education 67 Building Codes 68 Emergency Civil Defense Procedures 68 Long-term Seismicity Observations 70 International Cooperation 70
REFERENCES 76
APPENDIX I DEFINITIONS 81
APPENDIX II MODIFIED MERCALLI INTENSITY SCALE (1956 VERSION) 84
APPENDIX III EARTHQUAKE EDUCATION PAMPHLET PUBLISHED BY FIJI MINERAL RESOURCES DEPARTMENT 86
APPENDIX IV TSUNAMI SAFETY RULES 98
APPENDIX V TSUNAMI SAFETY RULES 118
ii
EXECUTIVE SUMMARY Overall Program
This country report is a summary of our contribution to a long-term program to evaluate earthquake risk to the islaid countries of Tonga Fijiand Vanuatu in the Southwest Pacific These countries are located within one of the most active belts of seismicity in the world and seismic hazard in these countries has been largely neglected in national planning and development programs The fundamental contributions of our inv7estigations include (1) analysis of regional seismicity and seismotectonic data (2) maintenance and improvement of seismological facilities in the region(3) establishment of a regional network of strong-notion accelerographs (4) initiation of regional cooperation between national and international agencies working in this region and (5) training of national technical and scientific personnel Our investigations in Vanuatu have been carried out through cooperative work with ORSTOM
Earthquake Potential We have subdivided the New Hebrides Island Arc into four zones of
seismic potential based on the available seismicity data Zone 1 is the central portion of the arc where no trench is present and is assigned a maximum probable magnitude of M 7 34 Zone 2 and Zone 3 include the northern and southern portions of the arc where the trench is present and are assigned a maximum magnitude of Ms 8 Zone 4 is the back-arc region and is assigned a maximum magnitude of Ms 7 12 Other zones of potential in the region are Zone 5 which refers to the Hazel-Holmes Fracture Zone which is assigned a maximum magnitude of Ms 7 and the North Fiji Basin which is assigned a maximum magnitude of Ms of 6 12
Tsunami Hazard
The history of earthquake-generated tsnamis in Vanuatu indicates a possible hazard to Vanuatus population Tsunamis are of particular concern in low-lying coastal areas with concentrations of population While tsunamis are not generated by all earthquakes they must be considered a possible effect of all major earthquakes that occur in submarine areas that lie near the islands Real-time monitoring of seismic activity combined with an active tsunami education program cculd significantly aid in tsunami risk mitigation
Conclusions and Recommendations We recommend that (1) an earthquake and tsunami education program be
adopted and combined with other disaster preparedness programs (eg hurricane floods and so on) (2) adoption of more stringent building codes for all of Vanuatu is strongly recommended (3) long-term seismicity and strong motion observations be continued in order to refine estimates of seismic potential (4) regional cooperation among the island countries of the Southwest Pacific be encouraged in order to assist in Vanuatus earthquake preparedness piogram
INTRODUCTION
The island countries of the Southwest Pacific are subject to natural
disasters including earthquakes volcanic eruptions and tsunamis which
threaten human life and property every year Geological and geophysical
observations indicate that these natural disasters are manifestations of
continuous geological processes the inexorable movements of ti- earth
guarantee that they will continue to occur in the future
The Southwest Pacific region is the source area for a large percentage
of the worlds seismicity Approximately seventy percent of the worlds
intermediate and deep earthquakes occur in this region A large number of
great shallow earthquakes have taken place along the convergent plate
boundaries that affect New Zealand Kermadec Islands Tonga Vanuatu
Solomon Islands and Papua New Guinea
Normally public attention focuses on emergency and rescue operations
once a disaster has taken place While little can be done to prevent
earthquakes or volcanic eruptions from occurring significant steps may be
taken to minimize the destructive effects of such disasters Scientists
are striving to better understand what causes these phenomena and to learn
what measures might be taken to mitigate their destructive nature This
report is a summary of the available scientific data tihat help constrain
the potential for destructive earthquakes that may affect the populated
areas of Vanuatu The report is by no means the final analysis of
earthquake hazards in Vanuatu it is however a synthesis of available
seismic information that provides a basis for judicious engineering
planning and civil decisions in the years to come Definitions of some of
2
the technical terms that will appear in this report are contained in
Appendix I
The ultimate aim of earthquake hazard programs--mitigation of human
and economic losses due to earthquakes--involves prediction of the
frequency of occurrence and intensity of strong ground motion produced by
future earthquakes of specific magnitudes in the vicinity of any given
site These predictions are often summarized in the form of seismic zoning
maps and microzonation which give th spatial distributions of the
following parameters maximum intensity of shaking engineering design
codes maximum acceleration of ground motion (velocity displacement) for
given return periods of earthquakes of a particular size or seismic risk
(which relates to the expected human and property losses from
earthquakes) In this report we focus on the fundamental seismological
observations that will provide the basis for more applied engineering
studies of earthquake risk in Vanuatu
The Republic of Vanuatu is located close to a major seismic zone with
an historical and instrumental history of earthquakes with magnitudes as
large as 80 (Isacks et al 1981 Marthelot 1983) In this tectonic
environment we are mainly concerned with the large shallow thrust-type
earthquakes which accompany major rupture of the plate iaterface While
this type of faulting is responsible for the worlds largest earthquakes
(eg Aleutian 1957 Chile 1960 Alaska 1964) there appear to be
tectonic limitations on the maximum size of the thrust events These
limitations appear to be related to coupling between plates and lateral
heterogeneities in the plate interface (Kelleher et al 1973 Lay and
Kanamori 1981) In the Vanuatu region the rupture length may be limited
3
by major lateral variations on both the upper and lower plates (Isacks et
al 1981 Chatelain et al in press)
Although Vanuatu is not heavily populated or industrialized its
proximity to a seismic zone leaves it particularly vulnerable to the risk
of earthquake damage Most of the damaging earthquakes come from the
inter-late zone beneath and trenchward of the islands although back-arc
and intermediate depth earthquakes are also felt The capital city of Port
Vila is now uder increasing development pressures The construction of
multi-storied buildings to accommodate the increasing urban populations and
tourism as well as other essential structures such as dams and power
plants pipelines schools and hospitals adds to the immediacy of the
problem of earthquake risk
Past disaster associated loss of life in the Republic of Vanuatu
resulting from earthquake hazard has been relatively limited but the
increasing urban concentration and industrial development raises the
potential human and economic losses brought on by a large earthquake
occurring in the immediate vicinity These losses are usually the result of
the collapse of man-made structures and can be substantially reduced by
adequate engineering precautions To date more deaths in Vanuatu have been
caused by cyclones than by earthquakes although material damage has been
fairly severe from shaking landslides or tsunamis produced by earthquakes
TECTONICS AND GEOLOGY
Plate Tectonic Setting
The Republic of Vanuatu lies along a portion of what is commonly
called the Pacific Ring of Fire The concentration of earthquakes
(Figure 1A) and volcanoes (Figure 1B) along this trend were used to
- -
- i
UA
- 4
w SI or
Figure1 World distribution of tA) earthquakes and (B) volcanoes (C)
Configuration of the major tectonic plates on the earths surface (Turcotteand Schubert 1982)
5
establish the boundaries of the lithospheric plates in the modern view of
plate tectonic theory (Figure 10) These plates which are relatively
rigid cover the surface of the earth like a mosaic of rigid caps and move
against each other by sliding (1) past at a transform fault (2) over at a
convergent margin (such as subduction at a deep sea trench) or (3) apart
from one another at a divergent margin (such as spreading at a mid-ocean
rift) Figure 2 shows schematically the spatial relationship of these
different types of boundaries Convergent plate boundaries are responsible
for the majority of the worlds large earthquakes and most of the worlds
tsunamis Many volcanic arcs form parallel to these deep-sea trenches
above the point where the subducted plate reaches about 100 km depth
(Isacks and Barazangi 1977) The relative motion of two convergent
lithospheric plates may be accumulated over a time period of tens to
hundreds of years and then released in large earthquakes or aseismic creep
(motion without earthquakes) may occur instead of earthquakes The area
over which the descending and over-riding plates interact the age of the
sea floor the topography of the sea floor and many other factors appear to
influence the recurrence interval and the size of earthquakes along the
interplate zone
The New Hebrides island arc trends linearly south-southeastward from
IIdegS to approximately 20degS (Figure 3) The northern end of the trench
bends sharply westward to merge with the east-west trending Solomon Trench
The southern end of the trench curves around eastward to merge with the
east-northeast trending Hunter Fracture Zone The arc is a component of
the Melanesian Borderlands that form the boundary between the
Indo-Australian and Pacific lithospheric plates (Figure 4) This
6
AS
M E S
T H
0
E
S
N
P
0 S
H
P H
E R
R
E
ridge
trnsIr
trench
Noauii
-
bull
q
transom al
Figure2 (A) Sketch of the different types of plate tectonic boundariesand their relationships (Isacks et al 1968) (B) Diagrams of the threetypes of boundaries in three dimensional view (Calder 1972)
1600
SOLOMON IS
1650
-
1700 E 1750
PACIFIC OCEAN
1800
100 o
0
-~ ~
1jN~CH
~ A
Ko
$SATA CRUZ IS
-10- K~10
J-shy
ltK14
TitCASTECS
is
k)tANKS
S A ME O
L AMBRY MALEKULA V
FI JI PLATEAU
150
FIJI is
~o eANGO d
250 3 ATT E UNTE PJC
160c 1650 1700 E 1750 1800
Figure 3 Bathymetric map of the New Hebrides Island arc and thesurrounding region taken from Mammerickx et al 1971 The filledtriangles denote Quaternary volcanoes Contours are in fathoms
1600 E 170 1800 W 170 deg 8
CENTRAL PACIFIC BAIN
S040
NOTH2
0
AMOA 0
200
BASIN
bull
o 0
BASIN
FIJI
f d
S 0 BASIN a O
INDV USTIRAL
oamp PLATE
0 ASA
BASIN
r
0
NEW t~Z EALAND
CHAT 11A M
R S
150 160 E 170 180
-a A S
0
30 PACIFIC PL ATE
SOUTHWESiT
PACIFIC 0
BASIN 0
40shy
1700 W Figure 4 Regional setting of the Southwest Pacific Tectonic and morphoshylogic features of the PacificIndo-Australian plate boundary Open arrows indicate direction of relative plate convergence Contour line shows 2-km isobath Holocene volcanoes are indicated by open triangles Data on bathymetry seismicity volcanoes and plate motions are taken from the Circum-Pacific Council for Energy and Mineral Resources (1981) map
9
intra-oceanic arc is unusual in that the subducting slab dips toward the
Pacific Basin The Indo-Australian plate is being subducted at a rate of
approximately eleven centimeters per year (Dubois et al 1977 Pascal et
al 1978 Isacks et al 1981) in a direction perpendicular to the trench
(Isacks et al 1969 Johnson and Molnar 1972 Pascal et al 1978)
Relative to other convergent plate boundaries (eg Chile and Alaska) the
width of the zone of interaction between these two plates is limited to
approximately 50 km in extent because the subducting (Indo-Australian)
degplate is steeply downbent (70 ) at intermediate depths This geometry
produces a narrow ribbon of potentially damaging seismicity rather than a
large region of seismicity The northern and southern portions of the arc
are typical of arc-trench systems but the central portion exhibits several
unusual features (1) The bathymetric expression of the trench is obscured
between 13degS and 17degS where a submarine ridge known as the dEntrecasteaux
Fracture Zone intersects it at approximately 16degS (2) The upper plate
protrudes westward in this central portion of the arc such that the western
coast of Malekula Island is located where the inner slope of the trench is
normally positioned (Karig and Mammerickx 1972 Isacks et al 1981 see
Figure 3)
Shallow Vanuatu earthquakes (Figure 5) are located in the interplate
zone between the two plates They are associated with slippage of the
Indo-Australian Plate as it descends beneath the Pacific Plate Intraplate
earthquakes also occur within the descending and overlying plates in the
trench region and behind the island arc in what is known as the back-arc
region An actual and a schematic vertical cross section near Tanna
perpendicular to the trend of the arc is representative of the
10
1600 E 1700 180 W 1700
I 0 s ee 0 0o
2e 01
6 S
20
30S $
S4b
0
3040 30
4S
400
1 2 40
150 1600 E 1700 I80 170 W
Figure 5 Regional setting of the Southwest Pacific associated with the plate boundaries in this region
Shallow seismicity
relationship of the seismicity to the trench islands and back-arc region
(Figure 6) In Vanuatu earthquakes occur from near the surface to
approximately 300 km depth The earthquakes systematically deepen
eastward from the New Hebrides Trench forming a narrow dipping plane
under islands located in the central portion of the arc and intermediate
depth earthquakes occur-progressively farther eastward Large (Ms gt 7)
earthquakes but few great (Ms 7 34) earthquakes have occurred along
the island arc as a result of the subduction of the Indo-Australian plate
In spite of the anomalous protrusion of the upper plate in the central
part of the arc the Benioff zone and convergent plate boundary appear to
be relatively uniform in configuration and continuous along the entire
length of the arc (Pascal et al 1978 Isacks et al 1981) The linear
distribution of the islands of Vanuatu and their location so close to the
main interplate thrust zone of the convergent plate margin result in a
geometry that is uniquely suited for subduction zone studies in comparison
to most other subduction zones on earth This also results in a unique
earthquake hazard in central Vanuatu Behind and eastward of the New
Hebrides island arc lies the North Fiji Basin (Figure 4) where the presence
of shallow seismicity (Figure 5) fresh basalts little sedimentation
(Karig and Mammerickx 1972 Luyendyk et al 1974) and high values of
heat flow (Sclater End Menard 1967) indicate active tectonism The Vitiaz
Trench forms the northern boundary of the North Fiji Basin and represents
the site of an old subduction zone that existed before the modern New
Hebrides arc formed Subduction (of the Pacific Plate) ceased at the
Vitiaz Trench sometime in mid-Miocene (Falvey 1978) or earlier (Chase
12
NEW HEBRDES VOLCANIC TRENCH ARC CORIOLIS
SW 4 TROUGH NE 00Z_shy
- _shy 2
-vQ 100- DESCENDING
PLATE ~ ~SEISMICf
ZONE -Ishy
200shy
300 00 100 200
DISTANCE KM
Figure 6 A schematic cross secion showing the region where shallow and intermediate-depth earthquakes were recorded (inclined lines) and the inferred geometry of the descending plate beneath the southern New Hebrides arc The inferred geometry of the interplate thrust zone is partly based on the slip vectors (short solid lines) of the shallow thrust-type focal mechanisms The Moho discontinuity of the overriding plate estiated from refraction and gravity studies is also shown (Condert et a 1981)
13
1971 Mitchell and Warden 1971 Karig and Mammerickx 1972) and resumed at
the modern New Hebrides Trench with the opposite polarity (Indo-Australian
Plate underthrusting beneath the Pacific Plate) Deep earthquakes are
still recorded near Vanuatu that result from this episode of subduction
The New Hebrides arc has migrated away from the trend of the older Vitiaz
Trench to its present position (Hamburger 1986)
Geolc-ical Setting
The islands of Vanuatu are volcanic in origin with older islands
fringed or capped with reefal limestones In the central region of the
arc the single chain of islands gives way to a more complex structure
(Figure 7) (1) the eastern Miocene-Pliocene chain with tholeiitic and
calc-alkaline volcanoclastics includes the islands of Maewo Pentecost
Efate and parts of Epi (2) the slightly older western Oligocene-Miocene
chain includes the islands of Santo Malekula and the Torres and (3) the
central late Pliocene-Recent portion contains active aerial and subaerial
alkaline volcanics (Mitchell and Warden 1971) The volcanic rocks of the
western chain are similar to slightly more acidic composition than the
eastern chain Local outcrops of ultramafic rocks are found in several
places in the eastern chain
REGIONAL BACKGROUND INFORMATION
Historical Earthquakes in the Vanuatu Region
An accurate evaluation of the earthquake hazard for a particular
region includes a survey of historical seismicity in the region in
question Historical earthquakes are important because they help to better
determine the potential size frequency of occurrence and possible effects
of future earthquakes
14
170
Tinakula
xd
Torres Is e
Vat Gonoi
Vanua Lava
b Gauagp Merig
- --- -4
- --- Santo Moewo NOR TH
DENTRECASTEAUX FZ ===== Pentecost FIJI
-- tMae ku v Ambry m BASIN
-p -E
0 ioo 200 Km
o Erromang -A IWA
U) TANNA FUTUNA -A
~ANEITYUMOVOLCANIV ASSOCIATIONS 7 UPliacene- Recen- (Central Chain) UMiocene- L Pliocene
Effi (Eastern Belt) ~UOIlgocene - MMiocene
1plusmnZ (Western Belt) Di ofDip ofTune Matthow TECTONIC ELEMENTS selomic zoneHunter
1r~7Uplifted volcanic ridge
~B c- bsn Major fracture zone - -Bock -aorc basin NF -
Zone of flexuring Sedimentary basin and faulting
I I K KIRI
Figure 7 Geology of New Hebrides Arc (Carney and Macfarlane 1979)
15
The earliest reports of earthquakes in the Vanuatu region is a series
of earthquakes which began on 28 March 1875 and were felt on Anatom
(Mercalli intensity VIII-IX for the largest event) and Erromango and in the
Loyalty Islands of Lifou Mare and Ouvea (lida et al 1967) On 10
January 1878 a tsunamigenic earthquake associated with the eruption of
Yasowa Volcano Tanna was felt in Port Resolution Tanna Another strong
tsunamigenic earthquake occurred on 11 February 1878 associated with
another eruption of Yasowa Volcano
Since 1900 5 great earthquakes (Ms gt 7 34) and 52 major earthquakes
(7ltMs lt 7 34) have occurred along the arc (McCann 1980) However the
great earthquakes that occurred near the turn of the century are not
well-constrained in size or place and their magnitudes were probably overshy
estimated (due to the way in which the magnitudes were calculated)
Moderate-sized earthquakes are distributed throughout the arc (Figure 8C)
but the largest events are more clustered especially in the northern
portion of the arc (Figure 8B Marthelot 1983 and Figures 9A and 9B
McCann 1980) There is a distinct gap in the seismicity at the point
where the dEntrecasteau Ridge intersects the line of the trench
Because the occurrence of shallow earthquakes near population centers
are of greatest concern for earthquake hazard in this report we have
focussed on shallow earthquakes near the main islands of Santo Malekula
and Efate in the central portion of the arc Maps of shallow seismicity
(depth lt 70 km) of the region based on the US Geological Surveys
Preliminary Determination of Epicenters (PDE) catalog for the period
1961-1981 are shown in Figure 8B and 8C (from Marthelot 1983) This
with bewen70 and10 Kin sqars betee 10deth andK2N00Kin FriaguresMpete island)arceV00anuat (ail) hongnrhto the argha
std itriagebetween00 and 3e0vkn locte (1) the acnceaoneo largesxise of thereshlwents nthe trnhahrcal diappeanras i thetareshalwents nthe norheialof the arnhh ih thetarch thapconraspuato he acthe reanqig mapis ho the dstrutiorn oaf2thepuxaprton ofearcTive reanqiet regis inothe dsorutrnhaf2the
haviencanue largetthand5an3) earthquakeintermediate-depthofrnestshanppresencanue of intermediate-depth3 ctivitye
17
9 194 (74) s-AFTERSHOCK ZONE
ft 1 (827 _RECOMFUTED OR 2RECENT EVENT
1914 ) EPICENTER
1944(7) 0-FROM
GUTENBERG AND (73) RICHTER
1 7 bull__ EPICENTER FROM RICHTER
192 (7O)(21 ( i9 1945()2)
j50 21926 (71)150 01928(71)
1946(70) 1927 (71)
1903(75)
1944(73) 1925 (76) 2 18754
~ 1878
200 1920(80O 94943(72)
4875 1923(70) 1944(72)
70737 1z945 I941943(757372) shy
1904 (84)
1928(75) 1926(70)
1917 (71)
250 6 I 165 0E 1700 1750
Figure 9A Map showing locations of large (Ms gt 7) and great (Ms gt 7 34)historical earthquakes along the New Hebrides Trench for the time period1900 to 1950 (McCann 1980)
18
I I
Io 953 1963 (73 73)
1966(7473)
19617(70)
9195304) 20 I 1972 (71)
651965(70)197
7150 (7 7 2 1958 (72)
--- 1965 197(71)-
F7873s) od
19616 1 A
2 00 1950 (70727072)
ID
165degE deg170c 1750 Fig~ure 9B Map showing locations of large (Ms gt 7) and great (Ms gt 7 34)historical earthquakes along the New Hebrides Trench for the time period1950 to 1979 (McCann 1980)
19
figure illustrates the dense concentration of interplate events close to
and landward of the New Hebrides Trench
Very little information exits concerning the effects of strong
earthquakes prior to 1961 apart from a few sketchy damage reports The
location accuracy of earthquakes was improved in 1961 Before this time
locations were located to the nearest tenth of a degree and magnitudes were
considerably over-estimated The last major seismic episode of interplate
slippage in central Vanuatu occurred in a sequence of earthquakes in August
1965 (Figure 10) which accumulated a total seismic moment equivalent to a
single magnitude Ms - 77 event (Isacks et al 1981) The 1965 Santo
earthquakes caused significant damage to buildings wharves and bridges in
Luganville on Santo Island and major damage to buildings and water tanks in
Norsup and Sarmet on Malekula Island (Pr6vot and Chatelain 1983)
Coseismic tectonic uplifts on Malekula Island were also measured in
association with the 1965 earthquakes (Figure 10) Over 1 meter of uplift
was detected for the 1965 earthquake sequence (Taylor et al 1980)
Only one sequence of earthquakes has been relatively damaging since
the Cornell-ORSTOM network began operating in 1978 The Mere Lava
earthquake (Ms 61) occurred on 12 May 1980 at 14800S and 16782degE and a
depth of 23 km The worst damage from this event was caused by landslides
SUMMARY OF FACILITIES AND PROGRAMS
Critical Facilities
Port Vila with a population of 15088 in 1979 is the administrative
and commercial center of the country There are a number of multistory
buildings in the capital and most of Vanuatus tourist industry is located
2
1970
140- )O AN OCT
JAN 19731974 0 00-
MAY 0
0--- 1965
S 9000 97150K 15deg AU61973 NOVV
1974
600 x OCT
4 1971 AUG 01966
171965
160shydeg 1 - - 2000
Ms S73 -77
63 -67
0
0
58-62170 1- 1 -_0 1660 1670 E 1680
Figure10 August 1965 earthquake sequence (from Isacks et al 1981)
21
in and near Port Vila A large shipping wharf is located near the center
of the city on Vila Bay
Apart from Port Vila the only significant development in Vanuatu is
at Luganville on Santo Island (pop 5116 in 1979) It remains an
important economic center for the country with agricultural processing and
shipping facilities located there There are several three- and four-story
buildings in the center of Luganville
Earthquake Preparedness Programs
As of late 1983 the Government had requested the assistance of a
consultant from New Zealand to help provide uniform building codes for the
country The Public Works Department enforces New Zealand seismic zone B
codes to construction of public buildings Large buildings for the most
part are designed by overseas engineering firms and generally comply with
the earthquake design standards Smaller buildings are generally designed
close to the New Zealand loading specifications but there continues to be
great difficulty in supervising construction projects
There is no large-scale earthquake education program in Vanuatu
Materials have been prepared by ORSTOM seismologists for distribution to
teachers public officials and planners involved in earthquake hazards
(eg Prdvot and Chatelain 1983)
Seismological Facilities
Seismological observations are necessary to the accurate location
study and ultimate prediction of earthquakes Seismic stations were first
established in Vanuatu in the mid-1960s by the French Office de la
Recherche Scientifique et Technique Outre-Mer (ORSTOM) Staion PVC in
Port Vila has operated continuously from 1964 to the present while LUG in
22
1680 1700140 1660 1670 1690 deg 140
GAUAP FIJI
PLATEAU 0
deg ~ HOG MAEWO -15 150 AOBA
2000 SANTO AB
MAP PENTECOST
160 A MT AM8160A= A 13AMBRYM-16
DENTRECASTEAUX OJi= LMP EPIP1FRACTURE ZONE
170 EME 170 EMAINGOUNA
NGAoS L E_ EFATE
RTVDvpP 18o 0shy180 -
o -180 z 0
o ERROMANGO
190 - Rk90R-190
TAN AN~o 4 FUTUNA
AUSTRALIAN oshy0 0TANNA
200 PLATE ANATOM 0 200
0 0
1650 1660 1670 E 1680 1690 1700
Figure 11 Map showing the seismograph stations in Vanuatu Circles arestations telemetered to the base station PVC on Efate island andunderlined stations have two components--one horizontal and one vertical The triangles are older ORSTOM stations INH and LUG are no longeroperational Strong motion instruments are located at SWB and LMP onMalekula island DVP and PVC on Efate island and LUG on Santo island
Luganville Santo operated through 1980 A third station on Tanna Island
(INH) operated through 1978 Cornell University began cooperative field
programs with ORSTOM in 1975 with a microearthquake experiment on Santo
Island An ocean-bottom seismograph experiment was carried out in southern
Vanuatu in 1977 and in central Vanuatu in 1978 The Cornell-ORSTOM
telemetered seismic network was established in 1978 and has operated
continuously since that time The seismic network now includes 19
telemetered stations (Figure 11) to date over 20000 earthquakes have
been recorded by the network A permanent ORSTOM mission is now based in
Port Vila and takes primary responsibility for day-to-day maintenance of
the network The availability of continuous earthquake monitoring in
Vanuatu is an important component of any earthqi-ke or -arthquake hazard
study for the country Figure 12 shows the seismicity level (magnitudes gt
4) recorded by the Worldwide Seismograph Station Network (WWSSN) Compare
these results with the increased sensitivity (magnitude gt 25) and location
accuracy of the regional Cornell-ORSTOM network which is shown by better
definition of seismic zones in Figure 13 These network data clearly
define the heterogeneous distribution of seismic activity in the central
portion of the arc
These seismological facilities are complemented by studies of ground
deformation using seven bubble-level tiltmeters a two-component longshy
baseline water tube tiltmeters and two levelling arrays
Strong-Motion Accelerographs
As part of the present program of seismic hazard evaluation in
Vanuatu Cornell and ORSTOM have installed five strong-motion
accelerographs on the islands of Efate Malekula and Santo (Figure 11)
__
5 t~j24
0 - 70km
o0 a 0 70-150km 0 C J
5 S S - 0 0 shy
-150-300km
a 0 o 300-700km
0
15S 4 -
bull7 -06 ----
SS
bull bull S
bull iilIIle
Figure I9 1p 4D JE l o shybull =r-
5 NO a~ 40
20 1 a
~ ~- 20Smbull 5m
- S r S st
16 E5 170 E~
165EI bull =W
Figre 2 Epcenresde sesme lcasspa er ea onia de sttos-16-1) PDE ocaionsofvent (167-182) vtand 1983)-- ha-la
25
PROFONDEUR - DEPTH 0 - 70 Km
E
05 0
EE
03 4 3
0I
Figur 13Siete e ~se bulloai~pa le rieuOSO-ONEL(918)
00i
oA
Fi3r1N
a
0--
E iete e e Icls sp rl dspeuOR T M C R E L(9 8 1 8 )
26 These acce2erographs complement the other instruments being used to study the seismicity in the region The accelerographs record the ground accelerations at a particular site fiom an earthquake strong enough to trigger the instrument To date these instruments have already been triggered by five moderate-sized shallow events and will be used to provide a basis for prediction of local ground motion induced by large interplate earthquakes in Vanuatu The high level of seismicity along this plate boundary suggests that a valuable baseline of strong-motion data can be collected in a relatively short period of time
Related Research Programs
The seismology program is carried out in cooperation with the Vanuatu Department of Mines Geology and Rural Water Supplies They are responsible for regional geology studies resource assessment detailed mapping and hydrological activities In addition ORSTOMs geology and geophysics department based in New Caledonia carries out an extensive
program of investigations covering submarine morphology marine geology and geophysics island geology and crustal structure The US Geological Survey has undertaken a series of detailed marine studies in the central and northern portions of the island arc using the research vessel SP Lee (1982 and 19F4) A detailed hydrographic survey was carried out in coastal waters by Australian researchers A tide gauge is maintained by the ORSTOM
mission in Port Vila (Pr6vot and Chatelain 1983)
PREVIOUS STUDIES
Seismicity Studies Along the New Hebrides Arc
Seismicity studies of the New Hebrides Arc by Isacks et al (1981) found that major bathymetric and structural complexities divide the central
27 part of the arc into segments approximately 100 km long The segment near
Santo and northern Malekula islands ruptured during two complex sequences
of events occurring in August 1965 and in late December 1973 through early
January 1974 (Table 1) In contrast the segments near the southern part of Malekula and Efate islands may not have ruptured during the past 75
years Moreover between southern Malekula and Efate islands the
orientation of the horizontal compressive stress within the upper plate
changes from a direction perpendicular to the arc to a more complex and
variable pattern found in the southern portion of the arc
Since the Cornell-ORSTOM network was established in 1978 10 moderate
(58 lt Ms lt 7) earthquakes have occurred within the network (Table 2) A
description of the seismicity recorded by the network follows
(A) Fore- and Aftershock Sequences of the August 1979 and July 1981 Main
shocks
(1) 17 August 1979 Sequence Figures 14A and 14B show earthquakes in the foreshock sequence of the 17 August 1979 earthquake The spatial and
temporal development of this activity was described by Isacks et
al [1981] This section provides a more detailed analysis of a longer
period of time A small zone near the epicenter of the 17 August
earthquake was intermittently active during late June - early July 1979
(Figure 14A) The more immediate foreshock sequence (Figure 14B) started
eight days before the main shock and consisted of five groups of events
Each group of foreshocks began with an earthquake having a magnitude
between 42 and 49 and each was followed by a number of small
aftershocks The first foreshock cluster was located just landward of the
trench Each successive cluster migrated in time northeast toward the
Relocations with all available teleseismic and local data for 1978-1981events except 27 Jan 1979 [Bulletin of the International SeismologicalCentre (ISC) location] remaining locations based on local data only 2Ms surface-wave magnitude taken from Monthly Bulletins of the PreliminaryDetermination of Epicenters (PDE)3MO seismic moments reported by Chinn and Isacks [1982] or in Monthly
Bulletins of the PDE (1981-1985 events)
4Mw is calculated from M0 by Mw - (115) x (log(Mo)-161)
17
0 0 0
0CD 00 aVm01 83 0 0 0
00 0 00 3
0 00 0
000 0 0
167 E 168 0 E
169 167 E
168 0 0
169 167 E 0 1
168 169
Figure 14 (A) Early foreshocks of the 17 August 1979 main shock (shown as a filled square) that occurredat the end of June to the beginning of July 1979 Island contours and 6 km bathymetry are shown (B) Lateforeshock activity preceding the 17 August 1979 earthquake Foreshocks migrated from the trench toward thelocation of the main shock (C) Foreshocks preceding the 15 July 1981 earthquake 0o
31 epicenter of the main shock The foreshock sequence ended with a very
intense concentration of seismicity near the 17 August 1979 main shock
epicenter The final foreshock cluster began eight hours before the main
shock and continued until the region became seismically quiet three hours
before the main shock The main shock occurred at the northeastern end of
these clusters
The development of the aftershock activity in Figure 15 is shown for
two time intervals during the nine days following the main shock During
the first day the aftershocks were initially located close to the epicenter
of the mainshock and rapidly expanded towards the west At the end of this
day aftershocks occurred as far north as the site of the 26 August main
shock and as far south as about 181degS (Figure 15A) Most of the increase
in the aftershock area occurred during the first day as can be seen by
comparing Figures 15A and 15B To the north the expansion of the aftershy
shock zone stopped near the epicenter of the next main shock of the
sequence that occurred nine days later on 26 August In the south aftershy
shocks were located in the same zone defined by the early foreshocks (also
see Figures 18C and 18D)
(B) 26 August 1979 sequence The development of the 26 August
aftershock zone (Figure 16) shows very similar patterns to the development
of the 17 August aftershock zone The activity developed very rapidly
during the first two days following the main shock (26 -- 27 August)
Then as in the case of the 17 August aftershock sequence the cumulative
sequence occupied an area larger by a factor of 2 or 3 than the one
expected for an earthquake of such magnitude [Isacks et al 1981] The
main shock was located on the southern edge of the aftershock zone -- the
aftershock activity developed to the north east and west only while the
aftershock zone of the 17 August event was nearly inactive (Figures 16A
16B) By 27 August aftershocks were located as far north as the epicenter
of the future 15 July 1981 earthquake and as far west as the New Hebrides
32
17
oA B
00
00
18 - 0o - 0 0
0 0
00
167 E 168 169 167 E 168 169
Figure 15 Maps of epicenters showing the development of the 17 August1979 aftershock sequence Format as in Figure 14 (A) 12H59M 17 August1979 to 12H59M 18 August (B) 13HOOM 18 August to 11H46M 26 August(to just before the 26 August main shock)
17
180 0 ogI0
0 00 o0
CP 00 000
0
0 0 0 8V
0 00 0 0(0 0
0 0
C0 0
C 0
167 E 168 I0
159 167 E 168
0
169 167 E
e l 0
168
_o
169
Figure 16 Maps of epicenters showing the development of the 26 August 1979 aftershock sequence Formatas in Figure 14 (A) 11H47M 26 August 1979 to IIH47M 27 August (B) IIH48M 27 August to IIH47M4 September (C) 1lH47M 4 September to IIH47M 26 October 1979
34
trench The aftershock zone ends very abruptly to the north along a
sharply defined east - west trending line which passes close to the
epicenter of the 1 September 1978 earthquake (Figure 18A) After the first
two days the level of aftershock activity decreased rapidly During the
entire period from the main shock to 14 September the aftershock zone of
the 17 August earthquake remained relatively quiet (Figures 16A 16B)
From 15 September to about mid - October both the 17 August and the 26
August aftershock zones were reactivated (Figure 16C) although the level of
activity was much lower than that during the days immediately following
each of the main shocks During this later period some activity occurred
in the back-arc region Northeast of Efate Island a small intense cluster
occurred in 1979 followed by shallow events spread around Efate Island
(Figure 16C) The level of activity then decreased and by the end of
October was back to a more normal background level of seismicity in the
entire region
The two aftershock zones of the 17 and 26 August 1979 earthquakes are
contiguous with some overlap in the area between the two epicenters (Isacks
et al 1981 Chatelain et al 1986) Chatelain et al (1986) show tiat
this area plays a key role in the development of the seismicity in ne
Efate region
(3) The 15 July 1981 earthquake In contrast to the 17 August 1979
earthquake no outstanding foreshock activity occurred prior to the 15 July
event Small clusters occurred on 5-6 and 12 July (see Figure 14C) Both
clusters included few events although each started with a magnitude (mb)
50 earthquake The larger of the two occurred on 12 July near the pending
main shock epicenter In contrast to the 17 August 1979 case no unusual
35
concentration of activity was noticed in the epicentral region during the
months immediately preceding the main shock Possible long-term precursory
activity may be the clusters observed in March and June 1980 and are
discussed in the next section
Figure 17 illustrates several outstanding features of the aftershock
sequence of the 15 July earthquake First an intense zone of activity
develops during the first day and continues throughout the sequence (Figure
17A) This zone is coincident with the aftershock zone of the preceding 26
August 1979 event (compare Figures 17A and 16) The southern boundary of
this activity is quite sharp and coincides with the region between the two
August 1979 epicenters this again emphasizes the importance of the area of
the two 1979 epicenters The epicenter of the main shock is located on the
northern boundary of the region of intense activity
Second the aftershock activity expands in size during the succeeding
nine days primarily northwards [see also Chatelain et al 1983] To the
northwest significant activity develops within the oceanic plate beneath
the trench axis (Figure 17B) This activity is concentrated beneath the
ORSTOM seamount [see USGS map by Chase et al 1983] near 173degS and
1672degE During the second through the ninth days activity continues to
develop in the area west of Epi Island and south of Malekula Island (Figure
17B) while in the succeeding 50 days the area of southern Malekula is
activated with a remarkable cluster occurring beneath the southern coast
(Figure 17C) The region of southern Malekula and Epi has been notably
quiet for much of the period prior to the July 1981 earthquake Back-arc
activity is also notable with a cluster occurring on 29 July east of
16 06 A B deg
0
O0
0 0
0~
o
000
0 0
0
00
0o~$
S 0 08 S
16E0
167 E
1 - C
0 0
168
0
16
0--
0
169 16
t
E
4P0
16
168
_ _ _ _ _ _ _ _
167
16 1o6
0
E 0
o S 0O
0 0
66
o5
0 6
0 24 Ju
q-o
0
6
1G 8HOM(C) 240 in~~ ~~
08OM24 JulJul toto 075M Figur 14
M Setme 1981 ()0H5M1Juy11to0H5M16Jl()0HO16uyto 1515 Setmbr191
I shy37
9Mo 4 o
uy
ON
37
Efate and increased activity in the region of Ambrym and Epi islands
(Figure 17C)
The aftershocks of the 15 July 1981 event thus affected four distinct
regions (1) the former 26 August 1979 aftershock zone presumably on the
interplate boundary (2) a region of the suboceanic plate near the ORSTOM
seamount (3) the region between South Malekula and 172degS presumably also
part of the interplate boundary and (4) upper plate crust cast of Efate
Island The total area affected by this earthquake was about 10 times
larger than the area expected for the rupture zone of an earthquake with
magnitude of the July 1981 event [Chatelain et al 1983]
(B) Prominent Clusters
Aside from aftershocks of the August 1979 and July 1981 events the
Efate -Malekula region also experienced several remarkable earthquake
clusters Some of these have the characteristics of an aftershock
sequence with the initiating event having the largest magnitude (and
sometimes preceded by a few foreshocks) Others have characteristics
intermediate between an aftershock sequence and a swarm [Mogi 1963] where
there may be several dominant shocks within the sequence and a more
symmetric shape to temporal variation of the number of events per unit
time The clusters are shown together with the larger aftershock sequences
in the summary of seismicity presented in Figure 18 For clarity the
aftershocks of the August 1979 and July 1981 events are represented by the
first nine days of activity
(A) Clusters in the forearc region The first cluster recorded by the
local network occurred in late September and early October 1978 near the 1
38
September mainshock (Figure 18A) and can be considered as a late part of
the aftershock sequence of the 1 September event The location of this
cluster however is activated again in later clusters (December 1979
August 1983 and April 1984) Figure 18A shows the next significant
activity in the region a cluster of earthquakes in December 1978 located
west of the August 1979 aftershock zone beneath the New Hebrides trench
The region was then fairly quiet until March 1979 when an intense cluster
of earthquakes occurred over a period of five days (Figure 18B) Activity
in the same area resumed again in April 1979 for a period of two days The
most active parts of both clusters are located at the same place which
defines an east - west trending zone located near the epicenter of the 26
August 1979 event and at the junction of the 17 August and 26 August
aftershock zones
After the August 1979 shocks three clusters occurred in December
1979 March 1980 and June 1980 (Figure 18G and 18H) near the epicenter of
the 1 September 1978 main shock (and also near the mid September 1978
cluster noted above) This location is on the eastern edge of the future
1981 aftershock zone The three clusters also tended to migrate toward the
July 1981 main shock epicenter (Figure 18G) A smaller cluster occurred in
August 1980 beneath Malekula Island (not shown on Figures) Actually the
entire region was rather quiet during 1980 The three 1980 clusters were
relatively small
In February 1981 a cluster of earthqukes occurred just west of the
location of the March -April 1979 clusters between those clusters and the
location of the December 1979 cluster (Figure 18H and 181) This location
39
Figure 18 Maps of epicenters in aftershock zones and clusters located bythe Cornell-ORSTOM network shown sequentially in time Epicenters of main shocks are shown by filled squares In each successive frame the next cluster overlays the preceding one for comparison Only successive clusters are shown in each frame All the activity recorded for the periods chosen is plotted Ten days of aftershock activity are shown for the August 1979 and July 1981 earthquakes
(A) 1 September 1978 main shock with September-October 1978 cluster (open circles) and December 1978 cluster (open squares)
(B) 27 January 1979 mainshock (no aftershock activity) with clusters of March-April 1979 (filled circles)
(C) Foreshock sequence for 17 August 1979 (open circles) (D) 17 August 1979 mainshock and aftershok sequence (filled circles)(E) 26 August 1979 mainshock and afters]ock sequence (open circles)
back-arc activity in September 1979 (crosses) (F) Cluster in December 1979 (filled circles) (G) Clusters in March 1980 (open circles) June 1980 (open squares) and
February 1980 on Efate island (plus signs) (H) Cluster in February 1981 (filled circles) (I) 15 July 1981 foreshocks (open circles) and June 1981 back-arc cluster
(plus signs) (J) 15 July 1981 aftershock sequence (filled circles) and back-arc activity
during July 1981 (plus signs) (K) Clusters in September-October 1981 (open circles) and activity on Efate
island in December 1981 (plus signs) (L) 12 March 1983 earthquake and aftershock sequence (filled circles) (M) Cluster in June 1983 (open circles) (N) 3 August and 5 August 1983 events and aftershock sequence (filled
circles) (0) Clusters in April 1984 (open circles) and in the back-arc near Epi
Island in March 1984 (plus signL) (P) Cluster in October 1984 (filled circles) (Q) Clusters in February 1984 (open circles) and April 1984 (open squares) (R) 3 July 1985 aftershock sequence (filled circles)
17
deg A B c
o 0W
0
03
0
00
(0C
0
00
00
0cn9
0
13g
0
o
000
o
0 000
0 0
0
0o 0
0 o 0S
(So
0
0
17
17 sclo
deg D c
p 0 0-
F
O 0 0 1800
O00 0
000
0 0 00 0
0 +
167 E 168 1690 167 E0 0
168 169 167 E 00
168 169
0 0
17
S
18
a I
0deg0Ck G
06+04
13 degp
~ - Ho
-to+00 0 o0o0o
0+1
I
0 0 +
18-
0
0O
A- V
J
+
- 00 B +o
K0 00 o0
L 0
0
0~
+
17 0
0
0j AbullB
0
0 0 0
0
0e
0 06
0 000
0
g oo
000
0+ 0olo
9
00
f 000
00 eFo 0 Q000
01
0 0
0 o00 1 0
o 0
1 7 E1 8116767E 168 169 167 E 168 169
I-0
16
7
0 o k3 ~
00
00
0 0
o 00
_o-I -
00 0 0
0 00
0
00
17s IP
0
00 00
13
01
0
0
00
000 0shy18
1868
CP 0 0t
00
169 167o
8
0
00
00
3
17E168 169 167 E 168 0 0 169 167 E 168 169
43
is part of the overlapping aftershock zones of the August 1979 events and
is also at the southern limit of the 15 July 1981 aftershock zone
The clusters thus have a very close spatial relationship to the
aftershock zones of the main shocks They occurred near the boundaries of
the aftershock zones and appear to be related to features delimiting or
defining the spatial development of the aftershock zones (see also
Chatelain et al 1986)
From February 1981 until August 1982 except for the aftershock
sequence of the July 1981 earthquake not a single fore arc cluster was
detected in the Efate Malekula region- Starting in September 1982
clusters began to occur around the former July 1981 immediate aftershock
zone In September and October 1982 four clusters occurred south of and
beneath Malekula Island (Figure 18K) Besides the aftershocks of the 15
July 1981 earthquake the September - October 1982 clusters were the most
prominent activity in the Malekula region during the entire 1978-1984
period These clusters did not occur at random places The first one was
located beneath Malekula Island at the site of the previous cluster in
1980 The second cluster is lcated southwest of Epi Island in an area
which experienced significanc activity during the aftershock sequence of
the 15 July 1981 earthquake (compare Figure 17C and 18L) The third
cluster shows a very linear pattern trending southwest - northeast right
along the extension of the northern edge of the 15 July aftershock zone
The fourth cluster then occurred beneath southern Malekula Island
In March and June 1983 two clusters occurred in the southern part of
the Efate zone The March 1983 cluster (Figure 18L and 18M) occurred near
the January 1979 epicenter and comprised a relatively small aftershock
44
sequence of a magnitude (Ms) 58 earthquake The June 1983 cluster
occurred just south of the July 1981 aftershock zone (Figure 18M and 18N)
This cluster affected the same zone which had already been affected by both
foreshocks and aftershocks of the 17 August 1979 mainshock Most of the
cluster occurred after a magnitude (mb) 54 shock which was the largest
event in the cluster The cluster thus has the charactistics of an
aftershock sequence but one with an abnormally large area for the main
shock magnitude The main shock was also preceded by a small foreshock
sequence that started a day before and stopped six hours before the main
shock
In August 1983 a dense cluster following a Ms - 56 and a Ms - 57
event occurred northwest of Efate Island (Figure 18N and 180) The latest
cluster recorded in the region occurred in April 1984 again activating the
same zone (Figure 180)
(2) Clusters in the back-arc region Although the back-arc region is
usually relatively aseismic there were clusters of earthquakes located
east of Efate Island and beneath Efate Island itself The clusters were
shallow and located in the island arc crust The areas affected were much
smaller than those in the forearc clusters Three of the clusters occurred
just before or after the August 1979 and July 1981 main shocks (Figures
18E 18F 181 and 18J) The August 1979 event was followed in September
1979 by a cluster east of Efate and in February 1980 beneath Efate The
July 1981 main shock was preceded in June - July 1981 by a swarm occurring
just south of the cluster following the August 1979 events Another
cluster occurred shortly after the July 1981 event at the same place The
July 1981 main shock was also followed by a swarm on Efate Island at about
45
the same place as the one following the August 1979 earthquakes No
clusters have been located in the Efate back-arc region from December 1981
when the last swarm occurred on Efate Island up to the most recent data
available October 1984 thus giving support to the close temporal
relationship between these clusters and the 1978 - 1983 sequence (see also
Chatelain et al 1986) In December 1980 a larger cluster occurred
farther east near the Coriolis trough (not shown on figures) The only
other back-arc activity occurred in March 1984 farther north just south of
Epi Island (Figure 180)
(3) Summary of Results from the Cornell-ORSTOM Network Investigation
of the patterns of seismicity associated with the earthquakes which have
occurred within the Cornell-ORSTOM network has shown that (1) not all
medium to large size events are associated with foreshock activity (2)
long term precursory activity sometimes occurs but not with enough
consistency to use in forecasting an impending event and (3) some zones
are activated before and after the main shocks without defining any clear
cycle (Chatelain et al in press) These earthquakes and their associated
seismicity suggest that specific features along the interplate zone
produced by the interaction of structures in the overriding and subducted
plates appear to control the seismicity in the Efate region (Chatelain et
al in press Isacks et al 1981)
Seismic Potential Studies Along the New Hebrides Arc
The earthquake hazard from the interplate zone is generally high
because of the rate of relative motion of the two plates (approximately 11
cmyr) and the stick-slip nature of the boundary However in addition to
large to great earthquakes along the plate interface moderate to large
46
magnitude events can occur within either plate and cause considerable
damage locally
One approach to determining the seismic potential of a region is to
identify a seismic gap or portion of an arc that has not produced a large
earthquake for some period of time The identification of a seismic gap
does not mean that a large earthquake will necessarily occur in a given
region because not all gaps will produce large earthquakes The gap may
indicate that (1) the section of the plate boundary is locked stress is
accumulating along the interface and will be the site of a future
earthquake or (2) the relative plate motion is being accommodated by
continuous slippage (aseismic creep andor by slip during small and
moderate events) such that sufficient stress to generate large earthquakes
along that section of the plate boundary does not accummulate Historical
information regarding the occurrence of earthquakes in a particular region
and regional tectonic constraints are necessary to clarify which of these
two possibilities is valid for the region in question In many cases
however the historical record may be incomplete or too short to accurately
determine which option is correct
Evaluation of the recurrence history of a particular region can be
investigated using (1) Teleseismically recorded earthquakes (2)
recurrence relations of smaller earthquakes recorded by seismograph
networks (3) pre-instrumental historical records of large earthquakes and
(4) evidence of prehistoric and historic large earthquakes observable in
the geological record Recurrence relations may help determine return
periods for certain sizes of earthquakes Recurrence intervals are
dependent upon the observations of seismograph networks and-are incomplete
47
since the period of record keeping is short compared to the time necessary
to develop these relationships Indirect evidence of large earthquakes can
sometimes be found in the geologic record in the form of uplift rates and
used to address the problem of recurrence intervals However information
obtained from the geologic record is necessarily limited in accurracy
McCann (1980) has divided the New Hebrides arc into different zones
and assigned values of seismic potential to these zones (Figure 19) based
on his study of historical and instrumental seismicity He has assigned 6
different divisions based on his study of the historical record (1) site
of a great (Ms 7 34) earthquake more than 100 years ago (2) site of a
great earthquake within the past 100 years but more than 30 years (before
1978) (3) incomplete historical record but indication that the region may
have the potential for a large earthquake (4) plate motion is subparallel
to the arc (5) no historical record of a great earthquake and the region
may not have the potential for one and (6) site of a large earthquake
within the past 30 years and presumably the lowest seismic potential
Marthelot (1983) used PDE data to determine some general segmentations
in the seismicity of the New Hebrides arc and the patterns of seismic
activity that characterize these segments (Figure 20) Marthelot (1983)
found that coupled interplate large (Ms lt 79) thrust earthquakes which
are preceded by intense activity dominate the northern end of the New
Hebrides arc near the Santa Cruz islands (between IIdegS and 13degS) Moderate
(Ms lt 72) thrust events concentrate between 13degS and 14degS Coupled
moderate (Ms lt 75) interplate thrust earthquakes occur near Santo and
northern Malekula islands (14degS to 165degS) The southern end of Malekula
and slightly south (165 0S to 1750S) exhibit coupled interplate thrust
48
14 S
2
19
24 I 165 E 170
Figure 19 McCanns seismic potential for New Hebrides island arc (McCann1980 See text for discussion of numbers
____
49
1650 1650 2 6 63 - 41 100
0 COUPLED INTER-INTRAPLATE THRUST
7467 e34 34
w
= EVENTS PRECEDED
BY INTENSE 24
AACTIVITY U I 44 CONCENTRATION
OF THRUST EVENTS
64-72 21O210
3
COUPLED 2061 73 0 _00
s INTERPLATE - 0 0C w THRUST EVENTS 78
PRECEDED BY 45t58C-150
DONUT PATTERNS 16 46 I S
81 03Q STEADY HIGH RATE L2 062 501 4 4
02ONLY ONE THRUST EVENT 61 025 INTRAPLATE200 ACTIVITY A 43
81 _0 2 O V CLUSTERS OF 72 73
RECURRING 76 150Q20 THRUST EVENTS 200
SLOW EXPANSION 4 OI01
OF ACTIVITY 8I 80 26 43 IN 198081- 13Do NO PRECURSORY
PATTERN 0 66 26
170 0 E 1720 170 0E 1720
Figure 20 Summary of the characteristics of the distribution of shallow earthquakes along the New Hebrides island arc The dashed line representsthe axis of the trench The trench disappears in the central part of the arc Horizontal lin separate regions characterized by distinct seismicity patterns Middle figure shows years of occurrence of large(Ms gt 70) and moderate-sized events (ms gt 60) 1961-1981 Right figureshows the large earthquakes that occurred from 1900 through 1960 (Marthelot and Isacks 1984)
50 earthquakes that are not quite as large (Ms lt 72) The zone west of Efate
(175degS to 18degS) exhibits a steady high rate of seismicity with magnitudes
(Ms ) less than or equal to 72 Between 18degS and 20degS intraplate activity
(Ms lt 72) dominates South of Anatom (eg south of 20degS) the seismicity
is characterized by clusters of recurring thrust events that do not exhibit
any precursory activity
In another study utilizing the PDE data set Wyss et al (1983) and
Habermann (1984) have used the shallow New Hebrides seismicity in order to
(1) identify areas of higher and lower strength within the plate interface
which might control the rupture length of future earthquakes and (2) test
for changes in the rate of seismicity prior to large earthquakes using a
statistical procedure The trend toward low stress drops in the central
portion of the arc near the intersection of the dEntrecasteaux Fracture
Zone with the New Hebride Trench is consistent with other studies which
indicate that this region is anomalous However a region of high or low
strength does not indicate anything about the nature of the region and
these regions do not help pinpoint when a large destructive earthquake
will occur within or near them
ASSESSMENT OF EARTHQUAKE HAZARD
Seismotectonic Provinces
We propose the following seismotectonic provinces and the maximum
probable (but not absolute) sizes of earthquakes be considered for the
subregions within Vanuatu when considering a design earthquake for these
regions (Figure 21) These provinces are based on the instrumental history
of earthquakes near Vanuatu The northern end of the New Hebrides Trench
is a complex zone of deformation where the interplate motion is changing
51
M612
13
S 0 0
18
231 165 E 170
Figure21 Earthquake potential for Vanuatu
--
--
52 from thrusting in the southern portion to mostly strike-slip motion in the
northern portion and has the potential for great (Ms 8) earthquakes The
central portion of the New Hebrides Trench here called the Santo
Malekula segment exhibits characteristics different from the rest of the
arc as the result of the dEntrecasteaux ridge interaction and has the
potential for Ms 7 34 earthquakes The southern end of the New Hebrides
Trench here called the Efate Tanna segment may have the potential for
Ms 8 earthquakes The extreme southern end of the New Hebrides Trench is
another complex zone where the interplate motion is changing from thrusting
in the north to strike-slip motion in the south and may be limited to
infrequent moderate (M 7 12) earthquakes Other sources of seismicity
include back-arc spreading east of the New Hebrides Trench (Ms 7 12) and
diffuse shallow activity along the Hazel-Holme Ridge (Ms 7) in the North
Fiji Basin (Ms 6 12)
One method for estimating the maximum possible magnitude earthquake in
a region is to look at the amount of deformation that has accumulated from
past earthquakes The deformation is assumed to be proportional to the
square root of the energy released by a powerful earthquake The energy
(E in joules) of each earthquake can be calculated from its magnitude (Ms)
using a formula developed for the region Pr~vot and Chatelain (1983) have
used the formula
Log E - 48 + (15 x Ms)
to calculate the amount of energy which has been released since 1965 in the
central portion of the arc (Figure 22) The calculated values tend to fall
within a range of values which can be bounded by two parallel lines since
deformation occurs more or less uniformly in time The maximum possible
E1 2 106 600 (joules )
500
400
300
200
136 shy
100
65 70 75 80 82 ANNEES - YEARS
Figure 22 Seismic energy release along the New Hebrides Arc since 1965 (Chatelain and Pr~vot 1983)
54
magnitude earthquake calculated by this method is Ms - 76 Prdvot and
Chatelain (1984) computed a similar result using all of the earthquakes
which have occurred since 1900
Ground Motion
Once the location and magnitude of potential earthquakes have been
determined for a region the next step is to determine the characteristics
of the ground shaking at a particular site This accomplished by the
condsideration of such quantities as earthquake source mechanism
epicentral distance and geometry and physical properties of the geologic
structures located between the source and the site
Strong-motion records provide one measure of site response To date
a relatively large number of strong-motion records have been generated in
the far-field of large earthquakes especially in California and Japan In
contrast relatively few near-field records of moderate and large shocks
have been recorded in island arcs These few have shown large scatter with
unpredictable results The 3 March 1985 Chilean and 19 September 1985
Mexican earthquakes constitute the most important exceptions and are
invaluable additions to the library of strong motion data for subduction
zones Nor-theless these two events do not constitute a databank of
information especially for intraoceanic tectonic settings such as Vanuatu
A major difficulty arises in trying to translate past earthquake size
(intensity values) which are based on cultural effects or magnitudes
derived from widely varying instrumental parameters into values of ground
motion The development of earthquake resistant design is usually based on
intensity of ground motion at a particular site The most widely applied
standard of comparison for strong motion data is the peak ground
55
accelereation (PGA) Figure 23 shows a general relationship between peak
acceleration and distance from hypocenter which has been derived from
worldwide earthquake data Some earthquakes generate relatively high
single peaks of ground accleration which represent little ground energy
Therefore on an absolute basis the use of PGA can be misleading for
smaller events
Peak ground accelerations are easily obtained from accelerogram
records however most historical information consists of earthquake
intensities Numerous relationships between ground acceleration and
Modified Mercalli intensities have been developed (Table 3) Two of these
proposed relationships are shown in Figure 24 For worldwide data Murphy
and OBrien (1977) have computed statistical correlations between Modified
Mercalli intensity values and ground accelerations (horizontal and
vertical) Theresultant relationships and the geometrical standard
deviation (s) are
log Av - 028 Imm - 040 s - 253
log Ah - 024 Imm- 026 s - 219
where -Av peak vertical ground acceleration
Ah - peak horizontal ground acceleration
Imm - Modified Mercalli intensity
Using the relationship of earthquake intensity to distance and size of
Fiji earthquakes Everingham (1984) has produced a plot for the Fiji region
(Figure 25) Although these results are for a nearby region they give a
general indication of what might be expected for Vanuatu Figure 26
(Prdvot and Chatelain 1983) shows the recurrence of Modified Mercalli
intensities per number of earthquakes
56
1000 1 I l I I eO58 M(R 5 -X A= 1320 e R+25)152
5
MEAN + a =2N01 - STANDARD 2-
oe DEVIATIONbullbull- ~0 MEAN + 2
tbull 0o - STANDARD - oo o DEVIATIONS Jf E N o 0
LU0
U 01 0_ o o 0-oo n 00 bull
L) em a00
- MEAN - shy - 4ra 00 L 0 W STANDARD 0-~DEVIATIONWL 000 to
0 ME N -2 1 STANDARDUx 0
DEVIATIONS
101- 10 - 000
D N O oENTE K - 1 so-
10 100 1000
DISTANCE FFROM HYPOCENTEFR IN KILOMETEFRS
Figure 23 Acceleration-attenuation relations derived from worldwide earthquakes (Hays 1980)
57
Table 3 Characteristics of the data samples used in selected studies of the correlation of ModifiedMercalli intensity and peak ground acceleration (modified fom OBrien et al 1977)
Number and Range of location Number Modified Mercalli Distance Acceleration
Study of earthquakes of recordings intensity
Gutenberg and 61 Western 167 n-VIII Richter 1942 United States 1956
Neumann 1954 10 do
Hershberger 1956 60 do Coulter Waldron dodo
and Devine (Not based 1973 entirely on
observed data)
Trifunac and 57 do Brady 1975c
10 V-VIII
108 J-Vil IV-X
187 IV-X
range (kin) range (cms2)
3-450 1-300
Averages of 40-300 25 and 160 (distance dependent) - 1-300 Short distance 6-3000
(Dependent on site geology and local amplification)
Figure 24 Proposed relationships between earth quake intensities and peack accelerations
59
DEPTH 20KM
7shy
6- 6 0
075 502
61 h0
DISTANCE KM
Figure 25 Modified Mercalli earthquake intensities observed in Fiji as a function of magnitude and epicentral distance (Everingham 1984)
60
10
0
5CI I-C)
0i
0
o
01 a)o
PORTVILA = SANTO
00
E
0212
000
E
z
Degres Mercali _ Mercalli degrees
Fiue-2 Frequency of Modified Mercalli earthquake intensities felt in Port Vila and Santo (Chatelain and Prfivot 1983)
61
Tectonic Uplift
Studies of longer term island uplift on Santo and Malekula as
evidenced by the uplift of coral reefs have related segmentation of these
islands to features of the subducting topography of the dEntrecasteaux
fracture zone (Taylor et al 1980) The proximity of these two islands to
the main interplate thrust zone and the growth of the coral reef terraces
around the islands has resulted in preservation of long-term deformation
Taylor et al (1980) have studied late Quaternary coral reefs that have
been uplifted on Santo and Malekula islands They identified four main
blocks based on long-term tilt differences (Figure 27) The rupture zones
of the 1965 and 1973-1974 earthquake sequences correlate to the tectonic
discontinuities in the Santo -- Malekula region Taylor et al (1980)
studied the uplift of coral terraces on Malekula over a period of three
years (976 1177 and 779) and found that just over 1 meter of uplift
had occurred in the northern part of the island as a resalt of the 1965
earthquake (Figure 28 Table 4)
Tsunamis in Vanuatu
Tsunamis (seismic sea waves) are caused by displacements in submarine
topography that are induced by earthquakes andor volcanic activity
occurring below or near the floor of the ocean Low-lying areas near the
shore are particularly vulnerable to damage by these waves The shallow
seismic zones of the Southwest Pacific have a history of earthquakeshy
generated tsunamis (Figure 29) A few tsunamis have originated in the
Vanuatu region A tsunami was produced by the first earthquake of the
March 1875 sequence (Iida et al 1967) The earliest known significant
one was the 10 January 1878 earthquake which produced a large tsunami
62
1167030E
AK-A 150 30 S
Tasmaloum Arkialo
NORTH MALEKULA
X Direction of tilt inferred from reef terraces 16000S
Tilt discontinuity
Pliocene and Quaternary shy sedimentary rocks mostly
coral limestone
r Pre-Pliocene sedimentaryand igneous rocks SOUTH
MALEKULA
160305
Figure 27 Tectonic uplift associated with the 1965 Santo earthquakes (Taylor et al 1980)
63
Contour Interval =02 m 02--- 04 - hp
0-6- shy08 xx16 000Sshy
08 9
06
02 i
00
160 30S a
167 0 00E 167 030E
Figure 28 Measurements (meters) of 1965 uplift made in September 1976November 1977 and July 1979 The letters on the figure represent the places and amounts of uplift given in Table 2 The contours of uplift(contour interval - 02 ) represent one of the simplest interpretations of the uplift pattern consistent with the measurements (Taylor et al 1980)
64
TABLE 4 Uplift Measured Along the Coast of Northern Malekula
Year Number ofStation Place Name Measured Measurements a Southwest Bay 1977 observationb Bamboo Bay 1977 observation c Dixon Reef 1977 Id Lambubu Bay 1976 15 e West Bay 1976 5f Horrok 1976 Ig Brenwe 1976 4h Liwout Point 1976 1979 50i East Leviamp 1976 4j West Leviamp 1976 6k Elephant Point 1976 17I Win 1979 24 m Wihet Bay 1979 23 n Rambak 1979 30 o Npennanavet 1976 10P Matanvat 1976 4 q Potovrou 1977 1 r Atchin Island 1977 observations Wala Island 1977 observation t Norsup 1977 I u Lamp 1977 observation
Insufficient measurements for a standard deviation to be useful
Figure 29 Tsunami history of the Southwest Pacific Filled circles indicate locations of tsunaznigenic events dashed circles indicate inferred locations of tsunamigenic events
66
(12-17 m lida et al 1967) and 6 meters of uplift of the harbor at Port
Resolution (Warden and Mitchell 1974) Other earthquake generated
tsunamis have occurred in 1961 1965 and 2 in 1967 (lida et al 1967)
While major Pacific-wide tsunamis such as those generated along the South
American or Alaskan plate margins apparently do not affect Vanuatu
significant local tsunamis may be generated by large shallow earthquakes
occurring within the region
Volcanic Eruptions in Vanuatu
Volcanic activity is concentrated in the central belt of the Vanuatu
island arc Much of the present activity is confined to solfataric
eruptions however explosive eruptions are known (eg the 1878 Yasowa
eruptions)
In general the potential effects of a volcanic eruption on the
inhabitants of the islands of Vanuatu are small except for those people
who are living in the immediate vicinity of an active volcano However
evacuation of inhabited volcanic islands may be necessary in larger
eruptions Even distant volcanic eruptions such as those at Home Reef in
the Kingdom of Tonga during March 1984 produced large quantities of pumice
some of which rafted across large portions of the Southwest Pacific The
floating pumice interfered with shipping throughout the Southwest Pacific
region (SEAN Bull 1984)
IMPLICATIONS FOR MITIGATION OF EARTHQUAKE RISK
Several significant steps may be taken that will significantly
mitigate the loss of life and property from future earthquakes in Vanuatu
The following five steps provide suggestions for mitigation of the
earthquake risk
67
Earthquake Education
First an earthquake education program such as that adopted in Fiji
or Papua New Guinea is strongly recommended At minimal cost to the
Government such a program may be mounted through the schools Red Cross
programs and through the news media In other countries earthquake
education programs have taught simple methods of strengthening house
construction and minimizing hazardous conditions within the home they
have warned of tsunami hazards to coastal dwellers they have instructed on
proper behavior during an earthquake they have helped to encourage storage
of emergency food water and equipment in many households and
importantly they have helped avoid panic during an earthquake and
stimulated cooperation with government officials following such a disaster
Earthquake education programs are effectively combined with other disaster
preparedness programs (eg cyclones floods and so on) An example of
educational materials prepared by the Fiji Mineral Resou-ces Department is
included in Appendix IV
A few simple measures can be taken to reduce the likelihood of damage
to personal property A system of baffles in water reservoirs can reduce
the chances of seiches being set up in the tanks and the ultimate collapse
of the towex if the motion is large enough Large heavy objects should
not be put in high places where they can be easily dislodged unless they
are anchored in place This would apply to things like stereo speakers and
other objects that might be on shelves Products on shelves in stores and
books in offices can be restrained with wire retainers along fronts of
shelves Heavy objects that could tip over (such as hot water heaters and
gas tanks) can be fastened with anchoring bands This is especially a
68
concern with gas tanks which could fall over rupture lines and result in
fire
Building Codes
Second adoption of building codes for Vanuatu is imperative There
is a real danger of a large earthquake occurring very close to Port Vila or
Luganville In general the adequacy of construction is a major factor
controlling the damage and loss of life brought on by such an earthquake
Building codes designed for areas of similar earthquake hazard such as New
Zealand Code A California Building Codes or Papua New Guinea Codes 1 or
2 would be appropriate for Vanuatu Observation of such codes is most
crucial for public multistory buildings in the major towns of Port Vila
Efate and Luganville Santo As important as the design of such buildings
are the construction methods and guality of construction material used to
implement building design Careful monitoring of construction by competent
engineers is important for critical facilities The traditional houses
have kept down past losses of life and property but increasing population
and rapid urbanization can result in higher potential damage if
earthquake-resistant designs are not implemented One of the primary
reasons for property damage resulting from the Mere Lava earthquakes was
related to the siting of newer homes Houses located on steep slopes
suffered damage when they were not situated on competent substrate (Figure
30) The shaking of the fill and loose soils by the earthquakes caused
unconsolidated materials to shift under the foundations
Emergency Civil Defense Procedures
Third development of specific Civil Defense plans for emergency
procedures following an earthquake or tsunami should be initiated Of
69 a ) Poorly - situated house
and terrace e
house built too far over slope Rear
0 R
near cutting vertical and too backwall of house
bull e
b ) Earthquake- induced slope movements
-7 Rear cutting collapses pushingForward terrace edge - house orward
subsidesunder mining huefrad house foundation shy
Landslippage here
c) Well- situated house and terrace Good distancebetween house and
Good between
distance house
cutting
ond sopr I Rear cutting slope back and planted with natural vegetation
Figure 30 Sche7atic representation of causes of damage to poorly sited houses and suggestions for future house contruction in areas of loosely consolidated soil
70 course earthquake preparedness plans have much in common with hurricane or
other natural disaster planning but specific effects of earthquake
occurrence must be considered structural damage to multistory buildings
interruption of water supply disruption of electrical and gas lines
secondary geological effects such as ground liquefaction or landslides in
the near-source region complicating effects of aftershocks in the days and
weeks following a major earthquake The primary structure for such civil
defence plans already is in place in Tonga Programs specific to the
earthquake hazard may be added following similar programs in Fiji Papua
New Guinea and New Zealand
Long-term Seismicity Observations
Fourth long-term seismicity and strong motion observations should be
continued In the long-term such information will help to refine
estimates of seismic potential along the New Hebrides plate boundary they
will help to more directly and accurately assess the ground motion
parameters of direct concern to engineers for building design in
Vanuatu--ground acceleration frequency spectra horizontal and vertical
components of ground motion local amplification effects and so on
Furthermore seismicity patterns may provide a key to long-term forecasting
and short-term prediction of the location and size of future earthquakes
that may affect Vanuatus population
Internationa Cooperation
Fifth international cooperation among the island countries of the
Southwest Pacific and foreign agencies (eg US Geological Survey
ORSTOM etc) may significantly help in Vanuatus earthquake preparedness
program All of the countries affected by earthquakes (Vanuatu Western
71
Samoa Fiji Tonga Solomon Islands Papua New Guinea and New Zealand)
have to varying degrees developed earthquake preparedness programs
Vanuatu may take advantage of the previous current and any future efforts
of the other countries in the region
72-76
References
Atkin R J (1968) On volcanoes in the New Hebrides and Banks Islands Quarterly J of the Geologvical Society of London 24 305-307
Calder N 1972 The Rescless Earth A Report on the New Geology The Viking Press New York N Y
Carney J N and A Macfarlane (1979) Geology of Tanna AneityumFutuna and Aniwa New Hebrides Geological Survey Regional Report 71 pp Carney J N and R Campillo (1980) An investigation into damage causedby seismic activity on Mere Lava during May 1980 Geological Survey DeptOf Vanuatu Report
Chase C G (1971) Tectonic history of the Fiji Plateau Geol Doc Amer Bull 82 3087-3110
Chase T E B A Seekins J Daniel and J Y Collot (1983)Topography of the Vanuatu region map US Geological Survey Alexandria VA
Chatelain J L R K Cardwell and B L Isacks (1983) Expansion ofthe aftershock zone following the Vanuatu (New Hebrides) earthquake on 15July 1981 Geophys Res Lett 10 385-388
Chatelain J L B L Isacks R K Cardwell R Pr6vot and M Bevis (inpress) Patterns of seismicity associated with asperities in the centralNew Hebrides Island Arc J Geophys ResChinn D S (1982) Accurate source deths and focal mechanisms ofshallow earthquakes in western South America and in the New Hebrides island arc PhD Thesis Cornell University Ithaca NY
Chinn D S and B L Isacks (1983) Accurate source depths and focalmechanisms of shallow earthquakes in western South America and in the NewHebrides island arc Tectonics 2 529-563
Chiu J-M (1982) Structural features of subduction zone determined bydetailed analysis of short period seismic waves from earthquakes recordedin the New Hebrides island arc PhD Thesis Cornell University
Collot J Y J Daniel and R V Burne (1985) Recent tectonicsassociated with the subductioncollisioi of the DEntrecasteaux zone in thecentral New Hebrides Tectonophys 112 325-356
Coudert E B L Isacks M Barazangi R Louat R Cardwell A Chen JDubois G Latham and B Pontoise (1981) Spatial distribution andmechanisms of earthquakes in the southern New Hebrides arc from atemporary land and ocean bottom seismic network and from worldwide observations J Geophys Res 86 5905-5925
77
Dubois J J Lauray J Recy and J Marshall (1977) New Hebrides trench Subduction rate from associated lithospheric bulge Canadian J Earth Sci 14 250-255
Ebel J E (1980) Source processes of the 1965 New Hebrides Islands earthquakes inferred from teleseismic waveforms Geophys J Royal Astron Soc 63 381-403
Everingham I B (1984) Provisional list of felt earthquakes reports in Fiji 1941-1981 Min Resources Dept Fiji Note BP 338 17 pp
Falvey D A (1978) Analysis of paleomagnetic data from New Hebrides Bull Austr Explor Geophys 9 117-123
Geological Map of the New Hebrides Condominium scale 11000000 (1975)Ministry of Overseas Development (Directorate of Overseas Surveys) DOS 1196 British Residency Port Vila New Hebrides
Gilpin L M A L Bloom B L Isacks and M Bevis F W Taylor and C Jouannic (1982) Late Pleistocene coral reef terraces as tiltmeters on Santo Island Vanuatu (New Hebrides) EOS Trans Amer Geophys Union 63 430
Gutenberg B and C F Richter (1954) Seismicity of the Earth 2nd ed Princeton NJ Princeton University Press
Habermann R E (1984) Spatial seismicity variations and asperities in the New Hebrides seismic zone J Geophys Res 89 5891-590
Hamburger M W (1986) Seismicity of the Fiji Islands and Tectonics of the Southwest Pacific PhD thesis 312 pp Cornell University Ithaca NY
Hays W W (1980) Procedures for estimating earthquake ground motions U S Geological Surv Prof Paper 1114 77 pp
Ibrahim A K B Pontoise G Latham M Larue T Chen B Isacks J Recy and R Louat (1980) Structure of the New Hebrides arc-trench system J Geophys Res 85 253-266
lida K D Cox and G Pararas-Carayannis (1967) Preliminary Catalog of Tsunamis Occurring in the Pacific Ocean HIG University of Hawaii
International Seismological Centre (ISC) 1978-1979 Bulletin of the International Seismological Centre Newberry Berkshire United Kingdom
International Seismolog4 cal Centre (ISS) 1918-1963 International Seismoshylogical Summary Newbury Berkshire UK
78
Isacks B L and M Barazangi (1977) Geometry of Benioff zones Lateralsegmentation and downwards bending of the subducted lithosphere in IslandArcs Deep Sea Trenches and Back-Arc Basins Talwani M and W C Pitmaned Maurice Ewing Series 1 Amer Geophys Union Washington D C 99shy114
Isacks B L G Hade R Campillo M Bevis D Chinn J Dubois JRecy and J L Saos (1978) Measurements of tilt in the New Hebrides island arc in Proceedings of Conference VII Stress and StrainMeasurements Related to -Prthquake Prediction US Geological SurveyOpen-rile Report 79-370 176-221
Isacks B L R Cardwell J-L Chatelain M Barazangi J-M MarthelotD Chinn and R Louat (1981) Seismicity and tectonics of the central NewHebrides Island Arc in Earthquake Prediction An International ReviewMaurice Ewing Ser 4 edited by D W Simpson and P G Richards AGUWashington DC 93-116
Johnson T and P Molnar (1972) Focal mechanisms and plate tectonics ofthe southwest Pacific J Geophys Res 77 5000-5032
Karig D E (1971) Origin and development of marginal basins in the western Pacific J Geophys Res 76 2542-2561
Karig D E and J Mammerickx (1972) Tectonic framework of the New Hebrides island arc Marine Geology 12 187-205
Kelleher J J Savino H Rowlett and W McCann (1974) Why and where great thrust earthquakes occur along island arc J Geophys Res 794889-4898
Kroenke L (1984) Cenozoic Tectonic Development of the SouthwestPacific United Nations Econ and Social Commission for Asia and the Pacific Technical Bull 6
Lay T and H Kanamori (1981) An asperity model of large earthquakesequences in Earthquake Prediction An International Review Maurice EwingSer 4 edited by D W Simpson and P G Richards AGU Washington DC 579-592
Luyendyk B P W B Bryan and P A Jezek (1974) Shallow structure ofthe New Hebrides Island Arc Geol Soc Amer 85 1287-1300
Louat R J Daniel and B Isacks (1982) Seismicitd de larc desNouvelles Hebrides in Equipe de GOologie-GOophysique du Centre ORSTOM deNoumda Contribution Aletude godvnamique du Sud-Ouest Pacifique Travau et Documents de lORSTOM 1147 179-186
Mammerickx J T E Chase S M Smith and I L Taylor (1971)Bathymetry of the South Pacific map Scripps Inst of Oceanogr La Jolla Calif
79 Marthelot J-M (1983) Patterns of seismicity in the Vanuatu (NewHebrides) arc Regional variations and systematic evolution PhD Thesis Cornell University
Marthelot J-M J-L Chatelain B L Isacks R K Cardwell and ECoudert (1985) Seismicity and attenuation in the central Vanuatu (NewHebrides) islands A new interpretation of the effect of subduction of theDEntrecasteaux Fracture Zone J Geophys Res 90
McCann W R (1980) Large and moderate size earthquakes Theirrelationship to the tectonics of subduction Ph D thesis Lamont-DohertyGeol Observ of Columbia Univ Palisades NY
McCann W R S P Nishenko L R Sykes and J Krause (1979) Seismicgaps and plate tectonics Seismic potential for major boundaries Pure Appl Geonhys II_7 1082-1147
McGuire R K (1977) Effects of uncertainty in seismicity on estimateof seismic hazard for the East Coast of the United States Bull Seis Soc Amer 67 827-848
Mitchell A H G and A J Warden (1971) Geological evolution of the NewHebrides island arc J Geol Soc London 127 501-529
Mogi K (1963) Some discussions on aftershocks foreshocks andearthquake swarms--The fracture of a semi-infinite body caused by an innerstress origin and its relation to the earthquake phenomena (third paper)Bull Eartho Res Tnst Tokyo Univ 41 615-658
Monzier M J Y Collot and J Daniel (1984) Carte bathymetrique desparties centrale et meridionale de larc insulaire des Nouvelles-Hebridesmap Office de la Recherche Scientifique et Technique Outre-Mer (ORSTOM) Paris
Murphy J R and L J OBrien (1977) Analysis of a worldwide strongmotion data sample to develop an improved correlation between peakacceleration seismic intensity and other physical parameters ComputerSciences Corporation Rept NUREG-0402 to US Nuclear RegulatoryCommission 68 pp
Pascal G B L Isacks M Barazangi and J Dubois (1978) Preciserelocations of earthquakes and seismotectonics of the New Hebrides island arc JGeophys Res 83 4957-4973
Preliminary Determination of Epicenters (PDE) 1961-1981 MonthlyBulletin National Earthquake Information Service US Geological SurveyAlexandria Va
Pr~vot R and J L Chatelain (1982) Seismicity and seismic risk inVanuatu Report No 5-83 Centre ORSTOM Nouma New Caledonia
Richter C F (1958) Elementary Seismology W H Freeman and CompanyInc San Francisco
80
Rothe J (1965) The Seismicity of the Earth 1953-1965 Paris UNESCO 336 ppSanto T (1970) Regional study of the characteristic seismicity of theworld Part III New Hebrides island region Bull Earthquake Res Inst Tokyo Univ 48 1-18
SEAN (Scientific Event Alert Network) Bulletin 9
Taylor F W B L Isacks C Jouannic A L Bloom and J Dubois(1980) Coseismic and Quaternary vertical tectonic movements Santo andMalekula islands New Hebrides-island arc J Geophys Res 85 5367-5381
Taylor F W C Jouannic and A L Bloom (1985) Quaternary uplift ofthe Torres Islands northern New Hebrides frontal arc Comparison withSanto and Malakula Islands central New Hebrides frontal arc J of Geol 93 419-438
Trifunac M D (1976) Preliminary analysis of the peaks of strongearthquake ground motion--dependence of peaks on earthquake magnitudeepicentral distance and recording site condition Bull Seism Soc Amer 66 189-220
Trifunac M D and A G Brady (1975a) Correlations of peakacceleration velocity and displacement with earthquake magnitude andsite condition Intl J Earthquake Engr Struc Dynamics 4 455-471
Trifunac M D and A G Brady (1975b) On the correlation of seismicintensity scales with the peaks of recorded ground motion Bull Seism Soc Amer 65 139-162
Turcotte D L and G Schubert (1982) Geodynamics John Wiley amp Sons New York
US Geological Survey 1961-1985 Preliminiry Determination of Epicenters Denver Colo
Vidale J and H Kanamori (1983) The October 1980 earthquake sequencenear New Hebrides Geophys Res Lett 10 1137-1140
Wellington Seismological Observatory Geophysics Division 1953-1960 NZDept Scientific and Industrial Research Catalog of Earthuakes 1953-1960
Wray S T R K Cardwell B L Isacks E Cudert and J-L Chatelain(1983) Detailed seismicity observations in the forearc region of aconvergent plate boundary Malekula Island Vanuatu (abstract) EOS Trans Am Geophys Union 62 945
Wyss M R E Habermann and C Heiniger (1983) Seismic quiescencestress drops and asperities in the New Hebrides arc Bull Seismol Soc Am 23 219-236
81
APPENDIX I DEFINITIONS
Two measures of the size of an earthquake are magnitude and intensity
Magnitude is a measure of the energy from an earthquake source to indicate the
strength of an earthquake In comparison intensity is a measure of the amount
of ground shaking caused by the earthquake at a particular site Thus an
earthquake of a given magnitude will produce a wide range of intensities
depending largely on distance from the source
In general a small earthquake with a magnitude less than 5 may be felt
only in the area near the source and a moderate earthquake with a magnitude
between 5 and 7 will be felt over a wider area and may produce significant
damage in the area very close to the source A large earthquake refers to an
earthquake with a magnitude greater than 7 Such events are often very desshy
tructive if they are located near population centers A major earthquake
refers to magnitudes between 7 and 7 34 and a great earthquake refers to
magnitudes greater than 7 34 These great earthquakes cause widespread desshy
truction and possible regional tsunamis Generally the potential damage from
earthquakes is multiplied by the secondary effects of earthquake occurrence
such as ground faulting generation of tsunamis landslides slumping or
liquifaction
The depth of earthquakes range from the surface to approximately 700 km
depth Shallow earthquakes refer to those with depths between the surface and
70 km Intermediate earthquakes refer to those with depths between 70 km and
250 km depth Deep earthquakes refer to those with depths greater than 250 km
(but less than 700 km) Intermediate depth earthquakes occasionally produce
damage at the earths surface only if the earthquake is very large Deep
events are generally not felt
82
The seismic (earthquake) potential of a particular region is defined as
the likelihood of that region to experience a (destructive) earthquake within
particular magnitude range within a particular time period The seismic
(earthquake) hazard of a particular location refers to the amount of ground
motion that might be expected from an earthquake within or near that region
Adequate data on seismotectonic features instrumental (strong-motion) and
macroseismic (intensity) records of near-field effects of large earthquakes
source parameters of large earthquakes earthquake spectra and ground attenuashy
tion or amplification are necessary in order to reasonably evaluate earthquake
hazard for any region The seismic potential is the integration of all of
these bits of information The average length of time between earthquakes of a
particular size (recurrence interval) and the amount of time elapsed since the
last earthquake of that size help to define the probability of future earthshy
quake occurrence along a particular seismogenic zone hence the seismic
potential of that zone
Seismic risk of a particular region refers to the expected degree of
losses of people and their property which result from the seismic hazard and
the vulnerability in the region One method that has been widely used for this
risk determination (and is used here) involves the determination of a maximum
probable earthquake (design earthuake) that is likely to occur in the imshy
mediate region Calculations of seismic hazard which are based on design
earthquakes generally yield conservative estimates of risk
The most important conclusion of historical studies of seismicity is to
define the seismogenic zones of a region and extrapolate what the future earthshy
quake potential is for those zones Seismically quiescent regions refer to
regions with a lower level of seismic activity which are surrounded by more
83
active regions Portions of major plate boundaries that have not experienced a
major or great earthquake during a particular time interval are seismic Raps
This time interval is taken to be a significant portion of the earthquake
recurrence interval for a large earthquake An estimate to within several
decades of the location and size (magnitude) of a large earthquake constitutes
a forecast If a precise calculation of the time and probability of occurrence
can be added to the location and size information then the estimation is a
prediction
84
APPENDIX II MODIFIED MERCALLI INTENSITY SCALE (1956 VERSION)
Masonry A B C D To avoid ambiguity of language the quality of masonry brick or otherwise is specified by the following lettering whichhas no connection with the conventional Class A B C construction)
Masonry A Good workmanship mortar and design reinforced especiallylaterally and bound together by using steel concrete etc designed to resist lateral forces
Masonry B Good workmanship and mortar reinforced but not designed in detail to resist lateral forces
Masonry C Ordinary workmanship and mortar no extreme weaknessez likefailing to tie in at corners but neither reinforced nor designed againsthorizontal forces
Masonry D Weak materials such as adobe poor mortar low standards ofworkmanship weak horizontally
DESCRIPTION (INTENSITY VALUES RANGE FROM I TO XII)
I Not felt Marginal and long-period effects of large earthquakes
II Felt by persons at rest on upper floors or favorably placed
III atlt indoors Hanging objects swing Vibration like passing oflight trucks Duration estimated May not be recognized as an earthquake
IV Hanging objects swing Vibration like passing of heavy trucks orsensation of a jolt like a heavy ball striking the wallsStanding motor cars rock Windows dishes doors rattle Glassesclink Crockery clashes In the upper range of IV wooden walls and frames creak
V Felt outdoors direction estimated Sleepers wakened Liquidsdisturbed some spilled Small unstable objects displaced or upset Doors swing close open Shutters pictures move Pendulum clocks stop start change rate
iOriginal 1931 version in Wood H 0 and F Newmann 1931 Modified
Mercalli Intensity Scale of 1931 Bull Seis Soc Amer 53 979-9871956 version prepared by Charles F Richter in Elementary Seismology(1958) 137-138 W H Freeman and Company
VI Felt by all Many frightened and run outdoors Persons walk unsteadily Windows dishes glassware broken Knickknacks booksetc off shelves Pictures off walls Furniture moved or overshyturned Weak plaster and masonry D cracked Small bells ring(church school) Trees bushes shaken (visibly or heard to rustle--CFR)
VII Difficult to stand Noticed by drivers of motor cars Hangingobjects quiver Furniture broken Damage to masonry D includingcracks Weak chimneys broken at roof line Fall of plasterloose bricks stones tiles cornices (also unbraced parapets andarchitectural ornaments--CFR) Some cracks in masonry C Waves on ponds water turbid with mud Small slides and caving in alongsand or gravel banks Large bells ring Concrete irrigationditches damaged
VIII Steering of motor cars affected Damage to masonry C partialcollapse Some damage to masonry B none to A Fall of stucco and some masonry walls Twisting fall of chimneys factory stacks monuments towers elevated tanks Frame houses moved onfoundations if not bolted down loose panel walls thrown outDecayed piling broken off Branches broken from trees Changes inflow or temperature of springs and wells Cracks in wet ground and steep slopes
IX General panic Masonry D destroyed masonry C heavily damagedsome times with complete collapse masonry B seriously damaged(General damage to foundaticns--CFR) Frame structures if notbolted shifted off foundations Framed cracked Serious damageto reservoirs Underground pipes broken Conspicuous cracks inground In alluviated areas sand and mud ejected earthquakefountains sand craters
X Most masonry and frame structures and bridges destroyed Seriousdamage to dams dikes embankments Large landslides Water thrown on banks of canals rivers lakes etc Sand and mudshifted horizontally on beaches and flat land Rails bent slightly
XI Damage nearly total Large rock masses displaced Lines of sightand level distorted Objects thrown into the air
86 APPENDIX III EARTHQUAKE EDUCATION PAMPHLET PUBLISHED IN FIJI
EARTHQUAKE What to do how to help
-
bull - -C II
deg
Damage at Suva wharf caused by the 1953 -earthquakelw hich was followed by a tidal wave within 30 seconds
1 411_0- shy
87 from theA message Minister for Lands
Recent earthquakes in Waya tsunamis might be the most Island and the even more recent one effective means of mitigating which rocked the city of Suva short- the worst effects of a sudden ly after 9am on Decanber 171975 calamity in these two potentshyand the ensuing panic reaction of ially dangerous forms is to the people are sharp reminders to us know more about them that although Fiji is situated in an
Indeed the suddennessearthquake zone there is little in-the severity of a wideshyformation available to the public on and
spread disaster could disruptearthquakes and tsunamis (tidal which are often associated all communications and paralysewaves)
with the type of earthquakes we have even the most efficient and experienced in Fiji well-drilled emergency organishy
sation it is hopeZ that the infor-
Survival in those cirshymation pamphlet prepared by myministry on earthqkes and tsunamis Ceatnces would depend on
will allay some of the natural alarm each individuals own knowshy
which people exp -ence during even
the minor tremor- Because we are in an
It has been brought to my earthquake belt it would be
notice that at least one expert has prudent for people living in Fiji to make themselvespredicted the chance of a serious
earthquake in Fiji as 140 years thoroughly familiar with the
one earthquake every 40 years information contained in this pamphlet
However with the exception of the earthquake and tidal waves in I wish to take This 1953 we are fortunate not to have opportunity to appeal for your suffered a more serious earthquake full co-operation in answeringthe questionnaire on earth-
They are probably the most quakes and tsunamis which terrifying and devastating phenomena appears on page nine of known to man this pamphlet as accurately
Unlike other natural disas- as possible
ters such as hurricanes and flood- The aim of the ing the tragedy of earthquakes is questionnaire is to locate that there is no forewarning of their and map the fault-line zones coming from which it is suspected
The very recent earthquake that most of our earthquakes in Hawaii is an obvious in- originatedisaster
dicator that the science of predicting The success and the earthquakes is still in the early efficiency of any kind of stages of development emergency relief system may
Although the recent occurrence depend on your co-operation in Hawaii might not rank among the in providing the informationworlds most serious earthquakes we sought- SNWqanivavalagi
orldssrios msteathqakes weMinister for Lands and Mineralknow from the experiences of other Resources countries that earthquakes can be totally devastating
However remote the possibishyity of a serious earthquake and
2
88
7 -
Part of the damage to the Suva Harbour reef caused by the 1953 earthquake
70 per cent from FIJI area About 70 per cent of the masonry landslides or drowning
worlds deep earthquakes are recorded in the tsunami from the Fiji area Most of them are Another earthquake with not felt because they occur at great an intensity of four to five was depths of about 400 to 600 kilometres ecperienced in Suva in 1961but (24845 to 37267 miles) beneath thecasdolmirdmget
surfac of te ebuildings
These types of earthquakes are not dangerous or damaging because of the depths at which they occur ButOtra they ore scientifically interesting
because they help geologists to deduce
the structure of the crust
The types of earthquakes which can be very damaging are those of large magnitude which occur in thebecase tey Todedueelp eolgist top 50 kilemetres (3106 miles) of the earths crust
The 1953 earthquake which hcd on epicentre (origin) 15 miles west of Suva was of this type That earth-quake had an intensity of seven out of a Mercalli scale of 12 and result-ed in a tsunami (tidal wave) which occurred 30 seconds after the quake and affectedoiSuva and davu About seven people were killed by falling
Several smaller shocks have been reported since then
w here re oftenearthquake fe arrtua aaso avun
fhlare laldes odrwi savu Taveuni and recentlythe WayA - Nadi - Lautoka area
Reports received after the 1953 earthquakes also show f l itle dmage incstes t that several very strong earthshyquakes have been felt in the
Fiji area since the early 1800s A o the
caused lthu d thse in tha the increasing density of popushyltion and buildings would make the area more prone to damage unless buildings are properly reinforced to withstand strong lateral motions from earthrukes
89 Quakes come In two main types
Volcanic earthquakes are asso-ciated with the movement of molten rocks underground usually at depths of less than 30 kilometre5 near active or inactive (at surface) volcanoes
These volcanic earthquakes are
often called tremors because they tend to occur frequently and almost continuously and are often associat-ed with possible forthcoming erupt-ions of volcanoes
Fortunately it has been over a million years since volcanoes erupted in most parts of Fiji al-though the most recent volcano was probably active less than 2000 years ago in the Taveuni area
Because of the long period of
time since previous eruptions vol-
canoes in most parts of Fiji can be or least inshyconsidered extinct at
active
The possibility of another
eruption occurring at some future time cannot be totally discounted
But it should be reassuring to note that with modern advances in instru-mentation it is becoming increasing-ly possible to predict the likeli-hood of impending volcanic activity
Tectonic earthquakes the other
major (and more common) type are due
to the movements of relatively solid parts of the earths crust against each other
Such motions c 3n be in the form of the swallowing of a large portion (or plate) of the crust into a trench area
For example the Eastern Pacific plate is postulated to be drifting westward at the rate of about 10 centimetres (roughly 394
inches) a year and is being swallowed or subducted under the Western Pacific plate in the Tonga trench area
The subduction of one plate under another causes friction between the plates and causes numerous earthquakes fortunately at great depthsshyabout 500 to 600 kilometres (31056 to 37267 miles)
Tectonic earthquakes occur also along fault lines which are zones of weakness in the earths crust usually at fairly shallow crustal depth
Geologists have mapped a number of fault areas in Fiji where it is apparent that one rock mass has been moved (or displaced) relative to an
adjacent rock mass through the release of stresses and strainsbrought about during the geoshylogca dvlp n the islands
Fortunately again most
of the faults which have been mapped are thought to be inshyactive
But there are some fault zones which could be active and it is quite likely that the strong 1953 earthquake was caused by fault movement offshyshore from the Kalokolevu shyso ara
The recent earthquakes felt in the Waya - Nadi -Lautoka area could be due to fault movements several miles offshore south-west of Waya
In 1976 the Mineral Reshysources Division intends to do
detailed mapping of these possibly active fault-zone areas near Suva and in the west of Waya
Other plans are for the division to make greater use of instruments and become inshyvalved in the recording of earthquakes
9
THE MAIN DANGERS Collapse of buildings due to
lack of reinforcement poor building materials (eg adobe type) or un-satisfactory foundations
Broken overJ ead power lines can
occur quite easily and are partishy
cularly dcnprous because many people have the inclination to run outdoors when they feel a strong earthquake
Landslides are possible alongLandlidsposibe aongofae fault zones or very wet areas pbrti-cularly where hillsides are steep
One person was killed in the Namosi area by landslides during the 1953 earthquake
Earth movements and chasms People naturally tend to have a very strong fear that the earth will open up and swallow them during an earth-quake However there is only one pro-perly documented case in recorded history of a person being crushed in a fissure Basically the danger of falling into chasms is minimal and the natural terroz of people from this is apparently the result of ex-
Fire can be one of the most dangerous effects of earthquake as evidenced by the disasters in Son Francisco in 1906 and Tokyo in 1923 Perhaps the worst problem from fires caused by earthquakes is that water pipes are often broken and firemen are forced to use less accessible alternative sources such as a river or the sea
Tsunamis are a particular kind
of sea wave which can build up follow-ing an earthquake In the past they have devastated cities and small settlements along the coasts of Chile Peru Alaska Hawaii Japan and other countries These waves travel across the Pacific Ocean at jet speed (more than 600 miles an hour)
In shallow wters t5unamis become a threat to life and property because they can reach up to miore than 100ft high at wave crest levels and strike with devastating force
5
We have no official record of any extensive tsunamis in Fiji except for the one caused by the 1953 earthquake which claimed some lives in Suva andKadavu
Other tsunamis are likely to have occurred in earlier times but were not identified especially as tsunamis becauseour lack of experience with them
The barrier reef round much of the islands helps to dissipate some of the wave
energy and therefore some ofthe dangers
But we should realise that we can still bevulnerable to waves especially from a southerly direction where our reef systems are less extensive
If a very strong earthshyquake is felt in Fiji you should prudently assume that it has originated within the Fiji group and is likely to have generated a tsunami
In the 1953 case the tsunami was about csft high when it hit the reef outside Suva within 10 seconds after the earthquake
A 6ft wave then travelled across the harbour and hit the waterfront about three to four minutes later causing only
slight damage and leaving many
But the tide was low at that time If it had been high tide the waves could have been about 9ft high and the effects could have been disastrous
Waves 5ft to 6ft high
also hit Lami Deubq Be--Island and Koro Island and a 15ft-high wave claimed two lives at Nakasaleka Kadavu Smaller waves were felt at Ovalauthe southern coast of Vanua Levu and in the western Lou Group
Precautons to take Because earthquakes occur
suddenly and without warning there ore only a few precouton5 people can take such as ensuring that houses are on firm foundations and are suitably reinforced to withstand earthquakes
The following modified version of on earthquake notice is reproduc-ed from a California Geology article published in October 1975
When an earthquake occurs For a minute or two the earth may pitch and roll like the deck of a ship The motion is frighteningbut unless it shakes something down on you it is probably harmless in itself Keep calm and ride 4t out Your chances of survival are good if you know how to act
During the shaking If indoors stay indoors Got under sturdy fur-niture such as a table Stay near the centre of a building and stay away from glass Do not use condles matches or other open flames
Do not run through or near buildings particularly concrete ones where there is danger of fall-ing debris If outside stay in the open away from buildings and power lines
If in a moving ccr stop but stay inside
After the r akinq Check your water and electricity
If water pipes are damaged or electric wires are shorting turn off at primary control point If in a low-lying coastal area which can be affected by tsunamis leave house and make for higher ground (see tsunami safety rules below) Turn on radio for emergency bulletins Stay out ofaamaged buildings- aftershocks can shake them down
In a 1961 study of earthquake risks in Fiji RHoutz estimated that the chance of a strong quake occurring here -was about 140 ie
6
once every 40 years This figure should be reassuring But one must remember that it is only an estimate -and that once in 40 years could be toshymorrow
Tsunami Safety Rules Tsunamis follow no disshy
cernible pattern of occurrence When you receive a tsunami warning you must assume that a dangerous wave is on its way
History shows that when the great waves finally strike they claim those who have ihed the wnin ve
ignored the warning The following tsunami
rules were extracted from a pamphlet prepared by the US Environmental Science Services Administration and they should be noted 1 An earthquake in your
area is a natural tsunami warnshying Do not stay in 1-yving coastal areas after a strong local earthquake
2 A tsunami is not a single wave but a series of waves Stay out of danger areas until on all-clear is issued by a competent authority
3 Approaching tsunamis are sometimes heralded by a noticeshyable rise or full of coastal water This is nature s tsunami
warning and should be heeded 4 A small tsunamiat one
beach can be a giant one a few bea a Do nt le the milesaway Do not let the modestse ofowve ma you lose reect for whut may follow
5 All tsunamis - like hurricanes -are potentially dangerous even though they may not damage every coastline they strike
6 Never go down to the beach to watch for a tsunami
92
yocn thetoo L see wave you are After 5Oft
too close to escape it
7 Sooner or later tsunamishit visit every coastline in the Pacific Warnings apply to yollif you live in Suva reef any Pacific coastal Olrea
8 During a tsunami emergency A section of the Suva Harbour reef your local emergency organisations forced upwards by the 1953 earthshywill try to save your life Give quake A tsunami -(tidalwave) 50ft them your fullest co-operation high hit the reef within 10 seconds
Unless otherwise determined by after the quake and sent a 6ft wavecompetent scientists potential to the shoreThis struckdanger areas are hose less than watershyfront about three to four Ainutes 50f above sea level and within one later and caused minor Cdamage but
mile of the coast for tsunamis of only because it was at low tide any origin
7
Measuring their size Earthquake magnitudes are
measured on very sensitive seismolo-
gical instruments Theseare often referred to as the Richter scale and the largest shock known to date had a magnitude of 89 on Richter scale (compared to 675 for the 1953 Suva earthquake on the same scale)
hat is in commonAnother scale use and depends on physical effects and observations is the modified Mercalli scale which is reproduced here It measures the intensity of earthquake and is graduated from one to 12 for measuring
Modifiedl Mercalli scale1956 versiont
Earthquake intensity
1 Not felt except by a very few under especially favourable (for
the arthuak)crcustanesamountsthe earthquakes) circumstances
2 Felt only by a few persons at rest especially on upper floors of buildings Delicately suspended objects may swing
3 Felt quite noticeably indoors especially on upper floors of build-ings but many people do not recog-nise it as c earthquake Standing motor cars muy rock slightly Vib-ration like passing truck Duration can be estimated
4 During the day felt indoors by many outdoors by few At night some awakened Dishes windowsdoors disturbed walls make creaking sound Sensation like heavy truck striking building Standing motor cars rocked noticeably
5 Felt by nearly everyone many
awakened Some dishes windowsetc broken a fewinstances of cracked plaster unstable objects overturned Disturbances of trees poles and other tall objects sometimes noticed Pendulum clocks may stop
6 Felt by all many frightened
and run outdoors Some heavy furni-
ture moved a few instances of fallen plaster or damaged chimneys Damage slight
8
7 Everybody runs outdoors Damage negligible in buildings of good design and construction slight to moderate in wellshybuilt ordinary structures considerable in poorly built or badly designed structures some chimneys broken Noticed
by persons driving motor cars
8 Damage slight in specialshyly designed structures conshysiderable in ordinary substantshyial buildings with partial collapse great in poorly built structures Panel walls thrown out of frame strucTures Fall
f fameystrctresasof chimneyq factory stcks
columns monuments walls Eeavy furniture overturned Savy fniur e -turned
Sand and mud ejected in small Changes in well water
Disturbs persons driving motor
cars 9 Damage considerable in
specially designed structures well-designed frame structures
thrown out of plumb great in substantial buildings with partial collapse Buildings shifted off foundations Ground cracked conspicuously Undershyground pipes broken
10 Some well-builtwooden
structures destroyed most masonry and frame structures destroyed with foundations ground badly cracked Rails bent Landslides considerable from river banks and steep slopes Shifted sand and mud Water splashed over banks
11 Few if any (masonry) Ltructures remain standing Bridges destroyed Broad fissures in ground Underground pipelines completely out of service Earth slumps and land
slips in soft ground Rails bent greatly
12 Damage total Waves seen on ground surfaces Lines of sight and level distorted Objects thrown upward into the air
FILL THIS IN TO HELP THE EARTHQUAKE STUDY
To enable an improved study of shallow local earthquakes the coshyoperation of the public is required in filling out the following questionshynaire whenever an earthquake is felt Many earthquakes are very small and sometimes are not recorded on seismological instruments This questionnaire system will enable the Mineral Resources Division to better determine the location of earthquake zones which can then be mapped in detail
EARTHQUAKE QUESTIONNAIRE
1 An earthquake was felt on at am or pm
Place
2 What direction did the shock come from
o ooo mge oe e o o o o
3 How many seconds did the quake last
4 Was the shaking rapid or slow
5 Where were you when the earthquake occurred
6 Were you awake asleep or awakened
7 Were you walking working standing sitting or lying down
8 Did the people around you feel the earthquake too
9 Did people run outside
10 Did cracks occur in the buildings you were in
11 Was the building damaged in any otherway
o
12 What is the building made of
13 Did the windows doors dishes rattle
14 Did hanging objects doors etc swing 0000000000600
Turn to next page 9
95 15 Did vases small objects furniture overturn
e
16 Did things fall off shelves
17 Did you notice any unusual waves in the sea after the quake 00 0a -0 0 000aV0a0a0 000000a000 00
18 1f so h6w soonafterwards 0 BO
e a 0000000amp000000000amp0000 a a
What were the waves like 00000619
20 Did anything else unusual happen
0 o a o e e o o 0o e o e e eo o eo 6 o e e e oIe e e o o o adegdeg e odegI e o o oo oo oe 1 8 aampv a
21o Any other remarks e
N me a
Complete formtear out this whole page and mail to
The Director of Mineral Development Mineral Resources Division Private Bag GPO SUVA
This special booklet is published by the Ministry of Information at Government Buildings in Suva for the Ministry of Lands and Mineral Resources
(JANUARY 1976)
10
96
In the wake of the 1953 quake
1M
Crack in the coral
A -rac) in the main Suva reef after the earthquake and tidal wave in 1953
12
T SANERIVE Government Printer Suva Fiji
98
APPENDIX IV SEISMOLOGICAL FACILITIES AND EARTHQUAKE HAZARD PROGRAMS IN THE SOUTHWEST PACIFIC
As part of our program of field investigations in Fiji Tonga andVanuatu our researcher was able to visit the neighboring island countries of the Southwest Pacific region During these visits he was able to meetwith scientists and public officials involved with the earthquake hazard problem facing each country In every case the governments are aware ofand have taken some action to mitigate the potential losses due to destrucshytive earthquakes but these governmental responses have varied widely fromcountry to country This report focusses on the seismological institutionsand facilities in each of the countries and their capablities in assessingand planning for carthquake hazards In the following sections we conshysider each of the island countries of this area which face a severe earthshyquake risk Fiji Tonga Vanuatu Western Samoa Solomon Islands PapuaNew Guinea and New Zealand
FIJI
Seismological Facilities
Seismological observations in Fiji are conducted by the Mineral Resources Department a subdivision of the Ministry of Energy and MineralResourcs The government has made a major commitment to seismologicalwork since the establishment of the AID-supported seismic network in 1979In fact seismological observations in Fiji have been carried out since theearly part of this century supported at first by the New Zealand scienshytific organizations and subsequently strengthened by Lamont GeologicalObservatorys Upper Mantle Project in the 1950s and 1960s In late 1979the 8 -station US AID network was established to complement three permanent stations in Viti Levu The network was significantly expanded byinstallation of a five-station telemetered network in 1981 supported byJapanese aid (Figure Al) Additional stations were installed in 1983 and 1984 the network has now expanded to an eighteen-station national networkwith excellent coverage of the Fiji region In addition MRD now has available five MEQ-800 portable seismographs for occupation of temporaryfield sites telemetered station testing and special refraction experiments While the Fiji network has experienced considerable technical difficulties it has recorded over 2000 earthquakes since its installationand provides an invaluable basis for seismological study of the Fiji region
Strong Motion Accelerographs
The Mineral Resources Department also operates a network of strongmotion accelerographs now numbering ten Kinemetrics SMA-ls (Figure A2)The initial six instruments of this network were granted to Fiji by AIDthe remainder were purchased by the Fiji government Since establishment of the SMA network three accelerogram records have been obtained from moderate-sized earthquakes in Viti Levu Records obtained from thisnetwork are expected in the long run to provide the basis for predicting
tTT Illt EAST OF +NWICH IS0 WEST OF GREENWICH III
Y 7sdeg NATIONAL NETWORK OF SEISMOGRAPHIC STATIONS 1982
AC7
DEELLAAIKOORROOMTRE
23O~~~~ ROTUMU
YASAWAIRAR C1
00
A0 KORO
-W
0
I VUNH SOUTHRIOGE A
~)AVALAU 0
NADI A A ONASAVULAU
MAGOORO A VUNIOAWALAU
VIT LE U _LAKEPe NAMOSI AUNIAA -GAJ
ALOAA0A NAMORO SUVA
VITICLEVU
13 BEOA
LEGEND A E-isting Station
I RAKRAKI A Proposed Station Toloyo
Motulu Fuloo amp
EAST OF GREENWoICH ISO WEST Of GREENWICH ITS
Figure Al Network of seismic stations in Fiji established through the assistance of US AID and Japanese aid programs
_ _ _1_ Q__
NATIOqAL NETWORK OF EAST
STRONG OF OEEwICH
MOTION IO WEST 0 OREV-1CM
ACCELEROGRAPHS 79
LEGEND
A Accelerograph
0 30 60 KLOLETRES
LBS
YASAWA
lt ---shyVANUA LEVU U
T EUW r
S|bullKORO 0
T
V2anua bala~u
N
0
LA IV)DI A MON~ASAVU V
9LAU
VITI LEVU OKA1)
(4)
GAU
LAKE1A
0 11-
Kld
A S T O r
Maluku
GREN Wa
Toloyc
I 0 W E S T O f C REEM CN I
Figure 2A Location of strong-motion accelerographs in Fiji
100
ground accelerations and thus for development of building codes specific to Fijis tectonic setting
Related Scientific Programs
The Mineral Resources Department includes an Offshore Geology sectionwhich has an active program of marine geological and geophysicalinvestigations in and around Fiji waters MRD also employs an engineeringgeologist whose work includes microzonation of the Suva area mapping ofactive faults in southeastern Viti Levu and investigation of soils subjectto earthquake-induced liquefaction An active program of geologicalmapping and structural studies is also carried out by MRD They aresupported by personncl assistance from Australia and Great Britain
Suva is also the home of the United Nations Committee for Coordinationof Offshore Prospecting in South Pacific Offshore Areas (CCOPSOPAC) Thisorganization coordinates much of the international marine research carried on in the region and has been particularly helpful with Fijisinvestigation of its offshore waters
Critical Facilities
The major development in Fiji has been in and around the capital cityof Suva The population of the metropolitan area now exceeds 130000 and most of the government commercial and industrial operations are concentrated there The city has become a major commercialtransportation and regional political center and has developed rapidly inthe past ten years Development in this period has included constructionof multistory buildings a major electric power plant expansion of theSuva harbor and most recently completion of the thirteen-story CentralMonetary Authority building in downtown Suva Much of this development hastaken place on an area of filled land close to sea level particularlyvulnerable to earthquake and tsunami damage This area was extensivelydamaged by the 1953 Suva earthquake and tsunami and is thus at significantrisk from a repeat occurrence of an event of comparable size
Other population centers with significant development include thetowns of Lautoka (pop 29000) Nadi (13000) and Ba (9000) on the islandof Viti Levu and Labasa (13000) on Vanua Levu The tourist industrywhich is a major part of Fijis economy is concentrated on the southernand western coasts of Viti Levu and is also vulnerable to earthquake andtsunami damage The major development project in Fiji is the 87-meter highMonasavu Dam in the interior of Viti Levu The earthfill dam was completedin 1983 and is planned to provide most of the countrys electric powerneeds through the end of the century
Earthquake Preparedness Programs
In awareness of the serious earthquake risk to development in Fijithe government has adopted New Zealand earthquake design codes for most ofthe urban areas of the country Seismic zone B codes applicable to areas of moderate seismic activity in New Zealand have been chosen asappropriate and are applied (in theory at least) to all domestic andcommercial construction in urban areas Considerable difficulty remains in
101
enforcement of these regulations particularly in construction of privatedwellings Major multistory building design is generally handled by overseas (Australia or New Zealand) engineers and dynamic modelling tests are generally applied for earthquake loadings at least as large as those required by the New Zealand codes The Monasavu Dam underwent dyiamictesting by Australian consulting engineers
Disaster preparedness is the responsibility of the Emergency Services Committee (EMSEC) and the Prime Ministers Relief and Rehabilitation Committee (PMRRC) EMSEC is responsible for coordination of disaster plans maintenance of essential services advice to the Cabinet on emergency measures and direction of relief work It is comprised of representativer of the related ministries and public agencies PMRRC is chaired by the Prime Minister of Fiji and has responsibility for long-termrelief policy and rehabilitation programs Fijis experience with recurrent weather-related disasters has spurred efforts for emergencycommunication systems supply distribution temporary shelters and so on Much of this hurricane disaster planning is applicable as well to earthquake and tsunami damage Fiji is also a participant in the International Tsunami Warning System
Educational programs have been handled through the Fiji BroadcastingSystem the Red Cross and the school sysem To a limited dgree the Public Works Department and the Mineral Resources Department have producededucational materials related to earthquake hazards in Fiji
TONGA
Seismological Facilities
Seismological observations in Tonga are the responsibility of the Ministry of Lands Surveys and Natural Resources Due to fiscal constraiits however these efforts have in the past been entirelydependent on foreign assistance Seismological experiments began in Tongain the mid-1960s with Lamont-Dohertys Upper Mantle Project Seismic stations were operated by Lamont-Doherty and subsequently by Cornell scientists through the early 1970s when operations were suspended In late 1983 as part of the present AID-supported seismic hazard programCornell reinstalled a three-component short-period seismograph in the capital Nukualofa The seismograph was installed upon the request of the government geologist to be operated by the Tongan government with technical assistance from Cornell Unfortunately after operation of the seismograph for eight months Tongas Cabinet decided that the drain on its resources and personnel was excessive and the instruments were disconnected in May 1984 with the components transferred to Fiji and Vanuatu where they can be utilized There are presently no plans to reinstall permanent seismographs in Tonga
Strong Motion Acceierographs
Two strong-motion accelerographs provided by the AID seismic hazard program are presently operating in Tonga one in Nukualofa and one in the northern Vavau Islands They have been in operation for one year and
102
have not to date recorded any large earthquakes They require a minimum of maintenance and their operation will continue to be supervised by the government geologists with assistance from Cornell A third accelerograph may be made available to tonga by the British Geological Survey and could bB installed on Eua Island in a zone of high activity close to the Tonga Trench Related Research Programs
The Ministry of Lands Surveys and Natural Resources employs a singlegovernment geologist whose responsibilities include coordination of oil prospecting geolcgical mapping of the islands and assessment of earthquakeand tsunami hazards There has been considerable scientific study of the Tonga Trench subduction zone by research groups from the United StatesJapan New Zealand Australia Germany and the Soviet Union More detailed marine geophysical data have been collected near Tongatapu Island byAmerican petroleum exploration groups
Critical Facilities
The capital city of Nukualofa has a population of only 20000 butdoes include several three- and four-story buildings The larger buildingshave in general been designed by foreign engineers and have included earthquake- resistant design specifications Other significantdevelopment projects include the expansion of the government wharf in Nukualofa and development of tourist resorts on Tongatapu and several of the outer islands
Earthquake Preparedness Programs
There are no building codes presently enforced in Tonga Howeverconstruction of public buildings must be approvei by the Ministries of Works and Health The largest office buildings and hotels are designed byoverseas engineering firms and generally include some earthquake loadingcriteria The Land and Environment Act currently under consideration bythe Tongan government would require review of all development projects bythe government planner application of building codes largely adapted from New Zealand codes is expected to follow
Disaster preparedness programs are the responsibility of the Cabinets National Disaster Committee including representatives from the related government ministries and departments Subcommittees focus on disaster preparedness action planning and long-term relief and rehabilitation There is no earthquake education program in Tonga
WESTERN SAMOA
Seismological Facilities
One of the earliest seismic stations in the Pacific was established atthe Apia Observatory in 1902 during the German colonial period through the University of Gbttingen In 1921 control of the observatory was transferred to the New Zealand Government Weichert seismographs were
103
operated continuously at Apia through 1957 when they were replaced by Benioff instruments at Afiamalu and by short-period Wood-Anderson instruments at Apia Since Samoan independence in 1963 the Observatory has been operated jointly by the Samoan Government and the Department of Scientific and Industrial Research (DSIR) New Zealand In 1963 a Worldwide Standard Seismograph Station was established at Afiamalu Operation of this six-component station is supported by the US Geological Survey In 1980 the station was upgraded to allow digital reccrding equipment was added to upgrade the station to the status of a Global Digital Seismic Network station Seismic records are sent to DSIR in Wellington for permanent storage
Strong Motion AccelerograDhs
A simple strong motion instrument has been operating in Apia since 1979 It is an event-triggered low-gain seismograph recording on an ink-stylus recorder At the time of our visit to Western Samoa the instrument had been out of service for several months Only one event has to date triggered the instrument
Related Scientific Programs
The Apia Observatory has also made continuous magnetic field measurements since 1905 Measurements are currently made using a Schultze earth inductor an Askania declinometer and a proton magnetometer The observatory maintains two tide guages as part of the Pacific Tsunami Warning System Offshore resource studies have been carried out through CCOPSOPAC and by various international research groups Much of the reconnaissance geological work in Western Samoa has been carried out by DSIR in New Zealand
Critical Facilities
Like many of the other island countries of the Pacific Western Samoas development has been concentrated around the capital Apia (pop 34000) A major deep-water harbor and the countrys tourist industry are based in Apia Several multistory buildings have been erected in Apia in the past several years A hydroelectric dam on Upolu Island was completed in 1978
Earthquake Preparedness Programs
There is presently no disaster plan in effect in Western Samoa The various agencies involved with emergency action are coordinated through the Police Commissioner New Zealand seismic zone B codes are applied to construction in Western Samoa Enforcement is handled by the Public Works Department Modest educational materials have been prepared by the Apia Observatory staff in English and Samoan for distribution through schools and public agencies
104
SOLOMON ISLANDS
Seismological Facilities
Seismological Observatories in the Solomon Islands are conducted bythe Ministry of Lands Energy and Natural Resources They have operated aWorldwide Standard Seismic Station in Honiara since 1962 operation of the station is supported by funds from the US Geological Survey The station was augmented by two short-period telemetered seismic stations in 1982 This three-station necwork was provided through the British GeologicalSurvey with the aim o identifying volcanic earthquakes associated with theactive volcano Savo located close to the capital
In awareness of the high volcanic risk to population centers in theSolomon Islands the Ministry has drawn up plans for two three-station telemetered arrays to be deployed around the active volcanoes on Simbo Island (New Georgia Group) and on Tinakula Island (Santa Cruz Group) Theyare presently seekirg foreign aid in the form of seismic instrumentation and technical asistance to establish the network
The Ministry also has responsibility for field surveys following majorearthquakes in the Solomon islands Studies of ground deformation and cultural effects of the large 1977 and 1984 earthquakes were made by seismology officers
Strong Motion Accelerographs
Two strong motion accelerogaphs were installed on Guadalcanal by theMinistry in late 1984 They will be responsible for maintaining the instruments but have requested Cornells assistance in analyzingaccelerograms obtained during their operation The high level of shallow activity near Guadalcanal suggests that a significant number of strong-motion records will be obtained during the lifetime of the instruments
Related Scientific Programs
The Ministry also carries out related research programs in regionalgeology minerals assessment groundwater studies and so on Extensive marine surveys have been caried out in the Solomon Islands by the USGeological Surveys Resource Assessment Program Local offshore surveyshave been carried out through CCOPSOPAC A tide gauge is maintained bythe Solomon Islands Hydrographic Unit Six proton-precession magnetometers are operated in the Solomon Islands by the Queensland University (Australia)
Critical Facilities
Over 90 of the Solomon Islands population remains in rural areas The major development is in Honiara the administrative and commercial center of the country Honiara (pop 15000) is the major shipping center of the country and now includes several multistory buildings
105
Earthquake Preparedness Programs
The Solomon Islands implemented a National Disaster Plan in 1980 subsequently revised in 1982 The Plan gives the Ministry for Home Affairs and National Development overall responsibility for coord~lation of efforts in earthquake volcanic and tsunami disasters Operational relief effort are carried out through the Disaster Operations Coordinator and the Provincial governments
The government has adopted the most stringent earthquake building code (Zone A) from New Zealand for multistory building construction in Honiara Implementation of these guidelines continues to be a problem One multistory building in Honiara (Australian High Commission Building) was severely damaged during the 1984 earthquake Some efforts have been made to develop small-scale earthquake-resistant building techniques appropriatefor rural areas The Pacific Islands Development Program organized a model house construction and workshop during early 1984 A modest outreach program has developed through the school system adult education programs and the government broadcasting company
PAPUA NEW GUINEA Seismological Facilities
The government of Papua New Guinea has made an extensive commitment to earthquake and volcanic hazard mitigation through construction of a national network of seismographs and accelerographs (Figure A3) A ten-station national network of seismographs is monitored by the Port Moresby Geophysical Observatory (Department of Minerals and Energy) Three of the remote stations are telemetered to Port Moresby via microwave links four stations operate as permanent field stations and two are operated at temporary sites on outlying islands Port Moresby is presently the site of a Worldwide Standard Seismic Station that has operated since 1958 The national network reports arrival times to the US Geological SurveysPreliminary Determination of Epicenters and the International Seismological Centre but does not routinely locate events independently
In addition to the national seismic network the Rabaul VolcanologicalObservatory operates seven seismic stations near active volcanoes around the country and a nine-station telemetry network around the Rabaul Caldera Bougainville Copper Limited opeates a 5-station network on Bougainville Island (North Solomons Province)
Strong Motion Accelerographs
The Port Moresby Geophysical Observatory maintains a national network of thirteen strong motion accelerographs distributed in the highly seismic areas of the country (Figure A3) This includes a closely spacedfour-station network around the Rabaul Caldera A single strong motion accelerograph is situated on Bougainville Island and is maintained byBougainville Copper Limited The network uses Kinemetrics SMA-I and New Zealand DSIR MO-2 instruments and has recorded tens of accelerograms since its establishment in 1967 The Observatory ispresently trying to to establish an engineering seismologist position to analyze the accumulating data and to further upgrade the accelerograph network
I I I I I I I I I I
Re--o -joso shy
Mooo u J4D (Ro-js
bull~~vASeA saxA+ Samp-cUong sloon
(twu lueoaott koRowq (KvG) jjj ccurodAj a~OlF
Accv~tj (8~Cli
Raboul (PART 2bLo(MOG) C GoTo and -4-A Duke of Tok
vie W~~IiTUI = a
Rogno SGA Kowumbukae0
lebub-gn ITPAc l-O MARCH agno BGAI
Tank ( F -goono PAAl
Coo Glooclslb Island I OSOGRAP SEISM A-D ACCELEOGR -
_____ L I IS IIsI I I
IPUGI
PAPUA NeW GUI NEeAr rp n w k
hTTWORKS MARCH 1384
IG -nol 1v
Figure A3 Papua New Guinea seismograph and accelerograph networks a
107-108
Related Scientific Activities
In addition to the Geophysical Observatory the Department of Mineralsand Energy includes the Geological Survey of Papua New Guinea The Surveyundertakes a wide range of geological investigations including regionalgeological mapping petroleum and mineral exploration engineering andenvironmental geology and energy resource development Offshore surveyshave been carried out through CCOPSOPAC as well as American and Austrrlianresearch vessels Continuous monitoring of the magnetic field is carriedout by the University of Queensland (Australia) Ten tiltmeters have beendeployed by the Volcanological Observatory to monitor ground deformation near Papua New Guineas active volcanoes Four of these instruments are deployed around Rabaul Caldera
Critical Facilities
Papua New Guinea is the most developed of the island countries of theSouthwest Pacific with a population of over 3000000 and extensive urbandevelopment The capital city of Port Moresby has a population of over 130000 with major multistory construction in the downtown area a majordeep water harbor and significant commercial and industrial activity in thePort Moresby area There is significant development as well in the smaller towns of Rabaul Lae Madang Wewak Goroka Mount Hagen Wau BuloloDaru and Kerema Major hydroelectric schemes have been established on theRamu and Rouna rivers with additional hydroelectric plans at various stages of evaluation and development Extensive mineral development hastaken place in the North Solomons Morobe and Western provinces of PapuaNew Guinea Extensive natural gas and limited oil deposits have beenlocated these may become commercially exploited in the near future
Earthquake Preparedness Programs
Papua New Guinea has a long history of earthquake and volcano-relateddisasters A national disaster program was established in 1981 and provides for a National Disaster Emergency Committee which formulates emergency government policy and a Disaster Civil Defence Committee which is responsible for implementation of short-term relief efforts Theprovincial governments are given major responsibility for initial coordination and assessment of disasters assistance is subsequentlyrequested from the federal government for major disasters Many of theprovincial governments have not revised preparedness plans since thecolonial period However particularly intense effort has been directed inEast New Britain province because of the imminence of a potentiallydestructive volcanic eruption in Rabaul Caldera
The town of Rabaul (pop 15000) is a major commercial center forPapua New Guinea and is situated directly within the caldera of an activevolcano A relatively small eruption took place at a secondary eruptivecenter near Rabaul in 1937 killing over five hundred nearby residents andforcing the evacuation of the town In order to avoid a repeat of such adisaster the government established the Volcanological Observatory withfour full-time volcanologists and real-time earthquake location andanalysis of tilt data A drastic increase in volcanic seismicity in mid-1983 led to a volcanic hazard alert and intensification ofseismological and ground deformation studies around Rabaul In addition
109
the alert allowed the provincial and national Disaster Emergency Committees to make extensive evacuation and relief plans for a possible eruption at Rabaul including preparation of a new airstrip improvement of roads and emergency water supplies communications systems detailed evacuation plans education programs and so on To date there has been remarkable cooperation of efforts by provincial national and overseas officials to mitigate the potentially devastating effects of a volcanic eruption at Rabaul
Papua New Guinea is the only country of the developing nations of the Southwest Pacific to have devised its own seismic zoning system (Figure A4)
The Nationwide Housing Code for Papua New Guinea sets up a four-level system of seismic loading oriented toward moderate-sized (to 8 stories)buildings Major buildings require independent dynamic analysis usuallycarried out by overseas engineering firms Seismic Zone 1 of the HousingCode is among the most stringent earthquake loading codes in the world and includes the town of Rabaul and much of the East New Britain and North Solomons provinces Seismic zone 2 includes the towns of Lae Wewak and Madang and is approximately equivalent to New Zealand Zone A or California loading designs The capital Port Moresby is in the lowest seismic zone (4) but buildings constructed there still require designsallowing for significant lateral loadings
Earthquake education is handled through the National Radio Government Printing Office the Civil Defence Department and the school system with information supplied by the Geophysical and Volcanological Observatories A particularly intense education effort has been mounted in Rabaul where educational materials have been produced and distributed in three languages and public involvement in preparedness plans has been emphasized
NEW ZEALAND
While New Zealand cannot be considered one of the developing countries of the Southwest Pacific its seismology programs have been responsible for much of the observational data available for the entire region Because of its importance to the other national seismology programs we briefly review here the New Zealands observational facilities Its extensive programs in engineering seismology its critical facilities and its earthquake preparedness programs will not be covered here
National Seismic Network
Seismological facilities in New Zealand are maintained by the Geophysics Division of the Department of Scientific and Industrial Research (DSIR) in Wellington The natioal standard seismograph network presentlyconsisting of thirty short-period stations is shown in Figure A5 The network routinely locates all earthquakes of ML gt 38 within New Zealandand earthquakes with Ms gt 50 for the region within 100 of New Zealand Arrival time data are routinely transmitted to the US Geological Surveyand the International Seismological Centre The events located by the network are reported in the annual New Zealand Seismological ReportSeveral hundred earthquakes are located by the DSIR national network each year
0 - - - --- - - - -
FIG 13
1SEISMIC ZONES FOR BUILDING CONSTRUCTION
- -- IN PAPUA NEW GUINEA
i 1d - - - - - _
(I -lt 53-0Fef cs r i eat a 1 982))j --_ _ -- r L - - --- a a V bull
N i - O(r-tIbd t
__ __ Po --shy
-- -- -
[i ~5- E I
Is-O I ___ oh - - --- - --shy-- shy
4 __J ft - - I- S 4 E jshy
_ _ _-i - _ j -z -
_____ _U 511
ZONE CLASSIFICATION OF CITIES I lZONE 30 1 I 3 1 153--ZONE3 4u shyW-t -~- 6--v 4- bull -
I == 1 --by- Ll _
Figure A4 Seismic zones for building construction in Papua New Guinea (jury et al 1982)
CAPE REINGA
ONERAHI
GREAT BARRIER AUCKLAND - C
5OCT 1914 WHITE ISLAND
KARAPIO EAST CAPE 0r WHAKATANE 15 WAIRKEIp I TUI 28 JUN 1921 t SEP19_-
CHATEAU TARADALE N U 2 FEB 19317 1897 1a Ju DEC 84
MANGAHAO 5 MAR 934 8 AUG 1904 - CASTLEPOINT ( A 1942
COs ELLINGTON IS5CT 18408 2C18BJN562 JAN 1855 23 MAY 1989
Figure A5 Seismograph stations of the national network (left) and the distribution of large shallow earthquakes (right) in New Zealand From Seismological Observatory Wellington (1980)
112
The network is augmented by long-period instruments operating atKaropiro Roxburgh and Wellington DSIR also operates a three-componentborehole seismometer in Wellington as part of the Seismic Research Obseervatory network supported by the US Geological Survey
Stations in Outlying Territories
New Zealand has also taken an important lead in operating seismographstations in outlying areas of the Southwest Pacific These stations havebeen extremely important in hypocentral control for the Tonga - Kermadec seismic zone and for nuclear event detection in the Pacific DSIR operates three 6 -component Worldwide Standard Seismograph stations at Afiamalu (Western Samoa) Raratonga (Cook Islands) and Scott Base (Antarctica) Short-period stations operate at Apia (Western Samoa)Campbell Island (New Zealand) Chatham Islands (New Zealand) Nadi (Fiji)Nime and Raoul Island (Kermadec Island New Zealand) Readings from these stations are routinely reported to PDE and ISC for global earthquake location
Wellington Network
A small-aperture high-gain seismic network is operated around Wellington an area of greatest seismic risk in New Zealand The stations are telemetered by radio or telephone link to the central recording site The network now consists of eleven stations Earthquakes are presentlydetected by a microprocessor-based Automatic Seismic Monitor and automated location processing is expected to follow The network routinely locates events with ML gt 15
Pukaki Network
A second microearthquake network has operated around Lake Pukaki ahydroelectric project in the South Island New Zealand The network wasestablished in 1975 to monitor reservoir-induced seismicity associated with impoundment of the reservoir The network consisted of nine stationsand was intended to operate on a temporary basis It has been closed since early 1984 with several of the stations continuing to support the national network and to monitor any future reservoir-related activity
Related Seismology Research
In addition to its regular observatory seismology the GeophysicsDivision has an active seismology research program Their studies have focussed on theoretical seismology earthquake prediction crustal structure of New Zealand historical earthquake studies nuclear eventdetection seismic risk in New Zealand strong motion studies and volcanic seismology The monitoring of active volcanoes is closely coordinated withcrustal deformation monitoring conducted by the Earth Deformation Section of the New Zealand Geological Survey
The New Zealand strong motion accelerograph network now consists of225 instruments operated by the Physics and Engineering Laboratory of DSIR Most of these instruments are of a New Zealand design (Mechanicaland Optical Accelerographs) and analog records are made on photographicfilm Three digitally recording accelexographs are now in operation in New
113
Zealand and the MO records are digitized for computational analysisAnalysis of this empirical data is being used for a revision of New Zealands building codes
114
REFERENCES
Berryman K 1979 Seismotectonic zoning study of the Fiji IslandsEarth Deformation Section Report 70 Wellington NZ Dept Sci and Indust Research 40 pp
Franco AB MP Hamnett and J Makasiale 1982 Disaster Preparednessand Disaster Experience in the South Pacific Pacific Islands Developshymental Program Honolulu 380 pp
Geological Survey of Papua New Guinea 1979 Information Booklet Port Moresby Dept Minerals and Energy 12 pp
Government of Western Samoa 1977 Apia Observatory 1902-1977 ApiaApia Observatory 8 pp
Jury RD JP Hollings and IAN Fraser 1982 The development ofseismic zones and the evaluation of lateral loadings for earthquakeresistant design of buildings in Papua New Guinea Bull NZ Nat Soc for Earthq Engr 5 123-140
Lowenstein PL 1982 Problems of volcanic hazards in Papua New GuineaGeol Surv Papua New Guinea Rept 827 Port Moresby Papua New Guinea 62 pp
McCue KF and ID Ripper 1980 The Papua New Guinea Strong MotionAccelerograph Network Geol Surv Papua New Guinea Rept 807 Port Moresby Papua New Guinea 13 pp
Mineral Resources Department Seismology Section 1983 National activityreport Fiji Submitted to Session IX Intl Coord Group for TsunamiWarning System in the Pacific Min Resources Dept Fiji Note 333Suva Fiji 4 pp
Parliament of Fiji 1984 Mineral Resources Department Annual Report forthe Year 1982 Parliam Paper No 13 Suva Fiji 90 pp
Power CA 1978 Earthquake risk in Fiji and the problems of earthquakeengineering Presented to the Fiji Society 17 pp
Prevot R and JL Chatelaiu 1983 Seismicity and Seismic Hazard in Vanuatu ORSTOM Rept 5-F3 Noumda 51 pp
Ripper ID 1982 Accelerogram library Geol Surv Papua New Guinea Rept 198211 Port Moresby Papua New Guinea 44 pp
Seismological Observatory Wellington 1980 The earthquake problem in NewZealand Alpha DSIR Extension Information Wellington NZ 4 pp
Smith WD 1979 Seismology and related research in New Zealand1975-1978 NZ DSIR Information Series No 140 30 pp
115
Smith WD 1983 Seismology and related research in New Zealand 1979-1982 Seismol Observatory Wellington Bull 276 32 pp
Solomon Islands Government 1982 National Disaster Plan 1982 Honiara Solomon Is 14 pp
116
A Rahimin A Simpson R Holmes P Rodda R Singh I Everingham K Draunidalo G Shorten M Mehrotra J Booth J Campbell
R Carter R Byrne G Gauss D Rubin
S Tongilava
D Tappin S Lemoto T Tukia
C Clarke
R Campillo R Foy T Lee J Rdcy J Chatelain R Prdvot
L ioane S losa A Titimaea
S Danitofea
D Tuni R Walshaw J Vunagi D Gwyun
INFORMATION CONTACTS
FIJI
Director Mineral Resources Dept Asst Director (MRD) Princ Geol OffshoreSeismol (MRD) Princ Geol Inform Services (MRD) Principle Geophysicist Senior Seismologist (MRD) Seismologist (MRD) Senior Engineering Geoogist (MRD) Struc Engr Suva City Council Civil Engineer Suva Engineering Geologist A Gibb amp Partners (Monasavu) Marine Geologist (CCOPSOPAC) Marine Geologist (CCOPSOPAC) Marine Geologist (CCOPSOPAC) Marine Geologist (CCOPSOPAC)
TONGA
Superintendent of Lands Surveys and Natural Resources Government Geologist (LSNR) Land Assessor (LSNR) Government Planner (LSNR)
VANUATU
Director Dept Mines Geology and Rural Water Supplies Director ORSTOM Mission Engineer ORSTOM Civil Engineer Public Works Dept Director ORSTOM Dept Geol and Geophys (Noumda) Seismologist ORSTOM (Nouma) Seismologist ORSTOM Nouma)
WESTERN SAMOA
Director Apia Observatory Senior Seismologist (AO) Geologist (AO)
SOLOMON ISLANDS
Chief Geologist Ministry of Lands Energy and Natural Resources
Senior Seismologist (MLENR) Senior Geologist (MLENR) Ministry of Home Affairs and National Development Civil Engineer Public Works Department
117
PAPUA NEW GUINEA
K Doble Chief Geologist Geological Survey I Ripper Chief Seismologist Geophysical Observatory G Seidel Information Officer Volcanological Observatory G Anderson Engineering Geologist Geological Survey J Wilkins Civil Engineer Dept of Works and Supply
NEW ZEALAND
W Smith Director Seismological Observatory Wellington
UNITED STATES
M Hamnett Pacific Islands Development Program G Burton Director Pacific Tsunami Warning Center R Sillcox Seismologist (PTWC) G Pararis-Corayannis Director International Tsunami Information Center
118
APPENDIX V TSUNAMI SAFETY RULES
1 All earthquakes do not cause tsunamis but many do When you hearthat an earthquake has occurred stand by for a tsunami emergency
2 An earthquake in your area is a natural tsunami warning Do not stayin low-lying coastal areas after a local earthquake
3 A tsunami is not a single wave but a series of waves Stay out ofdanger areas until an all-clear is issued by competent authority
4 Approaching tsunamis are sometimes heralded by a noticeable rise orfall of coastal water This is natures tsunami warning and should be heeded
5 A small tsunami at one beach can be a giant a few miles away Dontlet the modest size of one make you lose respect for all
6 The Tsunami Warning System does not issue false alarms When anocean-wide warning is issued a tsunami exists When a regionalwarning is issued a tsunami probably exists The tsunami of May 1960killed 61 people in Hilo Hawaii who thought it was just another false alarm
7 All tsunamis--like hurricanes--are potentially dangerous even thoughthey may not damage every coastline they strike
8 Never go down to the beach to watch for a tsunami When you can seethe wave you are too close to escape it
9 Sooner or later tsunamis visit every coastline in the PacificWarnings apply to you if you live in any Pacific coastal area
10 During a tsunami emergency your local Civil Defense police andother emergency organizations will try to save your life Give them your fullest cooperation
Unless otherwise determined by competent scientists potential danger areasare those less than 50 feet above sea level and within 1 mile of the coastfor tsunamis of distant origin or less than 100 feet above sea level andwithin 1 mile of the coast for tsunamis of local origin
2
the technical terms that will appear in this report are contained in
Appendix I
The ultimate aim of earthquake hazard programs--mitigation of human
and economic losses due to earthquakes--involves prediction of the
frequency of occurrence and intensity of strong ground motion produced by
future earthquakes of specific magnitudes in the vicinity of any given
site These predictions are often summarized in the form of seismic zoning
maps and microzonation which give th spatial distributions of the
following parameters maximum intensity of shaking engineering design
codes maximum acceleration of ground motion (velocity displacement) for
given return periods of earthquakes of a particular size or seismic risk
(which relates to the expected human and property losses from
earthquakes) In this report we focus on the fundamental seismological
observations that will provide the basis for more applied engineering
studies of earthquake risk in Vanuatu
The Republic of Vanuatu is located close to a major seismic zone with
an historical and instrumental history of earthquakes with magnitudes as
large as 80 (Isacks et al 1981 Marthelot 1983) In this tectonic
environment we are mainly concerned with the large shallow thrust-type
earthquakes which accompany major rupture of the plate iaterface While
this type of faulting is responsible for the worlds largest earthquakes
(eg Aleutian 1957 Chile 1960 Alaska 1964) there appear to be
tectonic limitations on the maximum size of the thrust events These
limitations appear to be related to coupling between plates and lateral
heterogeneities in the plate interface (Kelleher et al 1973 Lay and
Kanamori 1981) In the Vanuatu region the rupture length may be limited
3
by major lateral variations on both the upper and lower plates (Isacks et
al 1981 Chatelain et al in press)
Although Vanuatu is not heavily populated or industrialized its
proximity to a seismic zone leaves it particularly vulnerable to the risk
of earthquake damage Most of the damaging earthquakes come from the
inter-late zone beneath and trenchward of the islands although back-arc
and intermediate depth earthquakes are also felt The capital city of Port
Vila is now uder increasing development pressures The construction of
multi-storied buildings to accommodate the increasing urban populations and
tourism as well as other essential structures such as dams and power
plants pipelines schools and hospitals adds to the immediacy of the
problem of earthquake risk
Past disaster associated loss of life in the Republic of Vanuatu
resulting from earthquake hazard has been relatively limited but the
increasing urban concentration and industrial development raises the
potential human and economic losses brought on by a large earthquake
occurring in the immediate vicinity These losses are usually the result of
the collapse of man-made structures and can be substantially reduced by
adequate engineering precautions To date more deaths in Vanuatu have been
caused by cyclones than by earthquakes although material damage has been
fairly severe from shaking landslides or tsunamis produced by earthquakes
TECTONICS AND GEOLOGY
Plate Tectonic Setting
The Republic of Vanuatu lies along a portion of what is commonly
called the Pacific Ring of Fire The concentration of earthquakes
(Figure 1A) and volcanoes (Figure 1B) along this trend were used to
- -
- i
UA
- 4
w SI or
Figure1 World distribution of tA) earthquakes and (B) volcanoes (C)
Configuration of the major tectonic plates on the earths surface (Turcotteand Schubert 1982)
5
establish the boundaries of the lithospheric plates in the modern view of
plate tectonic theory (Figure 10) These plates which are relatively
rigid cover the surface of the earth like a mosaic of rigid caps and move
against each other by sliding (1) past at a transform fault (2) over at a
convergent margin (such as subduction at a deep sea trench) or (3) apart
from one another at a divergent margin (such as spreading at a mid-ocean
rift) Figure 2 shows schematically the spatial relationship of these
different types of boundaries Convergent plate boundaries are responsible
for the majority of the worlds large earthquakes and most of the worlds
tsunamis Many volcanic arcs form parallel to these deep-sea trenches
above the point where the subducted plate reaches about 100 km depth
(Isacks and Barazangi 1977) The relative motion of two convergent
lithospheric plates may be accumulated over a time period of tens to
hundreds of years and then released in large earthquakes or aseismic creep
(motion without earthquakes) may occur instead of earthquakes The area
over which the descending and over-riding plates interact the age of the
sea floor the topography of the sea floor and many other factors appear to
influence the recurrence interval and the size of earthquakes along the
interplate zone
The New Hebrides island arc trends linearly south-southeastward from
IIdegS to approximately 20degS (Figure 3) The northern end of the trench
bends sharply westward to merge with the east-west trending Solomon Trench
The southern end of the trench curves around eastward to merge with the
east-northeast trending Hunter Fracture Zone The arc is a component of
the Melanesian Borderlands that form the boundary between the
Indo-Australian and Pacific lithospheric plates (Figure 4) This
6
AS
M E S
T H
0
E
S
N
P
0 S
H
P H
E R
R
E
ridge
trnsIr
trench
Noauii
-
bull
q
transom al
Figure2 (A) Sketch of the different types of plate tectonic boundariesand their relationships (Isacks et al 1968) (B) Diagrams of the threetypes of boundaries in three dimensional view (Calder 1972)
1600
SOLOMON IS
1650
-
1700 E 1750
PACIFIC OCEAN
1800
100 o
0
-~ ~
1jN~CH
~ A
Ko
$SATA CRUZ IS
-10- K~10
J-shy
ltK14
TitCASTECS
is
k)tANKS
S A ME O
L AMBRY MALEKULA V
FI JI PLATEAU
150
FIJI is
~o eANGO d
250 3 ATT E UNTE PJC
160c 1650 1700 E 1750 1800
Figure 3 Bathymetric map of the New Hebrides Island arc and thesurrounding region taken from Mammerickx et al 1971 The filledtriangles denote Quaternary volcanoes Contours are in fathoms
1600 E 170 1800 W 170 deg 8
CENTRAL PACIFIC BAIN
S040
NOTH2
0
AMOA 0
200
BASIN
bull
o 0
BASIN
FIJI
f d
S 0 BASIN a O
INDV USTIRAL
oamp PLATE
0 ASA
BASIN
r
0
NEW t~Z EALAND
CHAT 11A M
R S
150 160 E 170 180
-a A S
0
30 PACIFIC PL ATE
SOUTHWESiT
PACIFIC 0
BASIN 0
40shy
1700 W Figure 4 Regional setting of the Southwest Pacific Tectonic and morphoshylogic features of the PacificIndo-Australian plate boundary Open arrows indicate direction of relative plate convergence Contour line shows 2-km isobath Holocene volcanoes are indicated by open triangles Data on bathymetry seismicity volcanoes and plate motions are taken from the Circum-Pacific Council for Energy and Mineral Resources (1981) map
9
intra-oceanic arc is unusual in that the subducting slab dips toward the
Pacific Basin The Indo-Australian plate is being subducted at a rate of
approximately eleven centimeters per year (Dubois et al 1977 Pascal et
al 1978 Isacks et al 1981) in a direction perpendicular to the trench
(Isacks et al 1969 Johnson and Molnar 1972 Pascal et al 1978)
Relative to other convergent plate boundaries (eg Chile and Alaska) the
width of the zone of interaction between these two plates is limited to
approximately 50 km in extent because the subducting (Indo-Australian)
degplate is steeply downbent (70 ) at intermediate depths This geometry
produces a narrow ribbon of potentially damaging seismicity rather than a
large region of seismicity The northern and southern portions of the arc
are typical of arc-trench systems but the central portion exhibits several
unusual features (1) The bathymetric expression of the trench is obscured
between 13degS and 17degS where a submarine ridge known as the dEntrecasteaux
Fracture Zone intersects it at approximately 16degS (2) The upper plate
protrudes westward in this central portion of the arc such that the western
coast of Malekula Island is located where the inner slope of the trench is
normally positioned (Karig and Mammerickx 1972 Isacks et al 1981 see
Figure 3)
Shallow Vanuatu earthquakes (Figure 5) are located in the interplate
zone between the two plates They are associated with slippage of the
Indo-Australian Plate as it descends beneath the Pacific Plate Intraplate
earthquakes also occur within the descending and overlying plates in the
trench region and behind the island arc in what is known as the back-arc
region An actual and a schematic vertical cross section near Tanna
perpendicular to the trend of the arc is representative of the
10
1600 E 1700 180 W 1700
I 0 s ee 0 0o
2e 01
6 S
20
30S $
S4b
0
3040 30
4S
400
1 2 40
150 1600 E 1700 I80 170 W
Figure 5 Regional setting of the Southwest Pacific associated with the plate boundaries in this region
Shallow seismicity
relationship of the seismicity to the trench islands and back-arc region
(Figure 6) In Vanuatu earthquakes occur from near the surface to
approximately 300 km depth The earthquakes systematically deepen
eastward from the New Hebrides Trench forming a narrow dipping plane
under islands located in the central portion of the arc and intermediate
depth earthquakes occur-progressively farther eastward Large (Ms gt 7)
earthquakes but few great (Ms 7 34) earthquakes have occurred along
the island arc as a result of the subduction of the Indo-Australian plate
In spite of the anomalous protrusion of the upper plate in the central
part of the arc the Benioff zone and convergent plate boundary appear to
be relatively uniform in configuration and continuous along the entire
length of the arc (Pascal et al 1978 Isacks et al 1981) The linear
distribution of the islands of Vanuatu and their location so close to the
main interplate thrust zone of the convergent plate margin result in a
geometry that is uniquely suited for subduction zone studies in comparison
to most other subduction zones on earth This also results in a unique
earthquake hazard in central Vanuatu Behind and eastward of the New
Hebrides island arc lies the North Fiji Basin (Figure 4) where the presence
of shallow seismicity (Figure 5) fresh basalts little sedimentation
(Karig and Mammerickx 1972 Luyendyk et al 1974) and high values of
heat flow (Sclater End Menard 1967) indicate active tectonism The Vitiaz
Trench forms the northern boundary of the North Fiji Basin and represents
the site of an old subduction zone that existed before the modern New
Hebrides arc formed Subduction (of the Pacific Plate) ceased at the
Vitiaz Trench sometime in mid-Miocene (Falvey 1978) or earlier (Chase
12
NEW HEBRDES VOLCANIC TRENCH ARC CORIOLIS
SW 4 TROUGH NE 00Z_shy
- _shy 2
-vQ 100- DESCENDING
PLATE ~ ~SEISMICf
ZONE -Ishy
200shy
300 00 100 200
DISTANCE KM
Figure 6 A schematic cross secion showing the region where shallow and intermediate-depth earthquakes were recorded (inclined lines) and the inferred geometry of the descending plate beneath the southern New Hebrides arc The inferred geometry of the interplate thrust zone is partly based on the slip vectors (short solid lines) of the shallow thrust-type focal mechanisms The Moho discontinuity of the overriding plate estiated from refraction and gravity studies is also shown (Condert et a 1981)
13
1971 Mitchell and Warden 1971 Karig and Mammerickx 1972) and resumed at
the modern New Hebrides Trench with the opposite polarity (Indo-Australian
Plate underthrusting beneath the Pacific Plate) Deep earthquakes are
still recorded near Vanuatu that result from this episode of subduction
The New Hebrides arc has migrated away from the trend of the older Vitiaz
Trench to its present position (Hamburger 1986)
Geolc-ical Setting
The islands of Vanuatu are volcanic in origin with older islands
fringed or capped with reefal limestones In the central region of the
arc the single chain of islands gives way to a more complex structure
(Figure 7) (1) the eastern Miocene-Pliocene chain with tholeiitic and
calc-alkaline volcanoclastics includes the islands of Maewo Pentecost
Efate and parts of Epi (2) the slightly older western Oligocene-Miocene
chain includes the islands of Santo Malekula and the Torres and (3) the
central late Pliocene-Recent portion contains active aerial and subaerial
alkaline volcanics (Mitchell and Warden 1971) The volcanic rocks of the
western chain are similar to slightly more acidic composition than the
eastern chain Local outcrops of ultramafic rocks are found in several
places in the eastern chain
REGIONAL BACKGROUND INFORMATION
Historical Earthquakes in the Vanuatu Region
An accurate evaluation of the earthquake hazard for a particular
region includes a survey of historical seismicity in the region in
question Historical earthquakes are important because they help to better
determine the potential size frequency of occurrence and possible effects
of future earthquakes
14
170
Tinakula
xd
Torres Is e
Vat Gonoi
Vanua Lava
b Gauagp Merig
- --- -4
- --- Santo Moewo NOR TH
DENTRECASTEAUX FZ ===== Pentecost FIJI
-- tMae ku v Ambry m BASIN
-p -E
0 ioo 200 Km
o Erromang -A IWA
U) TANNA FUTUNA -A
~ANEITYUMOVOLCANIV ASSOCIATIONS 7 UPliacene- Recen- (Central Chain) UMiocene- L Pliocene
Effi (Eastern Belt) ~UOIlgocene - MMiocene
1plusmnZ (Western Belt) Di ofDip ofTune Matthow TECTONIC ELEMENTS selomic zoneHunter
1r~7Uplifted volcanic ridge
~B c- bsn Major fracture zone - -Bock -aorc basin NF -
Zone of flexuring Sedimentary basin and faulting
I I K KIRI
Figure 7 Geology of New Hebrides Arc (Carney and Macfarlane 1979)
15
The earliest reports of earthquakes in the Vanuatu region is a series
of earthquakes which began on 28 March 1875 and were felt on Anatom
(Mercalli intensity VIII-IX for the largest event) and Erromango and in the
Loyalty Islands of Lifou Mare and Ouvea (lida et al 1967) On 10
January 1878 a tsunamigenic earthquake associated with the eruption of
Yasowa Volcano Tanna was felt in Port Resolution Tanna Another strong
tsunamigenic earthquake occurred on 11 February 1878 associated with
another eruption of Yasowa Volcano
Since 1900 5 great earthquakes (Ms gt 7 34) and 52 major earthquakes
(7ltMs lt 7 34) have occurred along the arc (McCann 1980) However the
great earthquakes that occurred near the turn of the century are not
well-constrained in size or place and their magnitudes were probably overshy
estimated (due to the way in which the magnitudes were calculated)
Moderate-sized earthquakes are distributed throughout the arc (Figure 8C)
but the largest events are more clustered especially in the northern
portion of the arc (Figure 8B Marthelot 1983 and Figures 9A and 9B
McCann 1980) There is a distinct gap in the seismicity at the point
where the dEntrecasteau Ridge intersects the line of the trench
Because the occurrence of shallow earthquakes near population centers
are of greatest concern for earthquake hazard in this report we have
focussed on shallow earthquakes near the main islands of Santo Malekula
and Efate in the central portion of the arc Maps of shallow seismicity
(depth lt 70 km) of the region based on the US Geological Surveys
Preliminary Determination of Epicenters (PDE) catalog for the period
1961-1981 are shown in Figure 8B and 8C (from Marthelot 1983) This
with bewen70 and10 Kin sqars betee 10deth andK2N00Kin FriaguresMpete island)arceV00anuat (ail) hongnrhto the argha
std itriagebetween00 and 3e0vkn locte (1) the acnceaoneo largesxise of thereshlwents nthe trnhahrcal diappeanras i thetareshalwents nthe norheialof the arnhh ih thetarch thapconraspuato he acthe reanqig mapis ho the dstrutiorn oaf2thepuxaprton ofearcTive reanqiet regis inothe dsorutrnhaf2the
haviencanue largetthand5an3) earthquakeintermediate-depthofrnestshanppresencanue of intermediate-depth3 ctivitye
17
9 194 (74) s-AFTERSHOCK ZONE
ft 1 (827 _RECOMFUTED OR 2RECENT EVENT
1914 ) EPICENTER
1944(7) 0-FROM
GUTENBERG AND (73) RICHTER
1 7 bull__ EPICENTER FROM RICHTER
192 (7O)(21 ( i9 1945()2)
j50 21926 (71)150 01928(71)
1946(70) 1927 (71)
1903(75)
1944(73) 1925 (76) 2 18754
~ 1878
200 1920(80O 94943(72)
4875 1923(70) 1944(72)
70737 1z945 I941943(757372) shy
1904 (84)
1928(75) 1926(70)
1917 (71)
250 6 I 165 0E 1700 1750
Figure 9A Map showing locations of large (Ms gt 7) and great (Ms gt 7 34)historical earthquakes along the New Hebrides Trench for the time period1900 to 1950 (McCann 1980)
18
I I
Io 953 1963 (73 73)
1966(7473)
19617(70)
9195304) 20 I 1972 (71)
651965(70)197
7150 (7 7 2 1958 (72)
--- 1965 197(71)-
F7873s) od
19616 1 A
2 00 1950 (70727072)
ID
165degE deg170c 1750 Fig~ure 9B Map showing locations of large (Ms gt 7) and great (Ms gt 7 34)historical earthquakes along the New Hebrides Trench for the time period1950 to 1979 (McCann 1980)
19
figure illustrates the dense concentration of interplate events close to
and landward of the New Hebrides Trench
Very little information exits concerning the effects of strong
earthquakes prior to 1961 apart from a few sketchy damage reports The
location accuracy of earthquakes was improved in 1961 Before this time
locations were located to the nearest tenth of a degree and magnitudes were
considerably over-estimated The last major seismic episode of interplate
slippage in central Vanuatu occurred in a sequence of earthquakes in August
1965 (Figure 10) which accumulated a total seismic moment equivalent to a
single magnitude Ms - 77 event (Isacks et al 1981) The 1965 Santo
earthquakes caused significant damage to buildings wharves and bridges in
Luganville on Santo Island and major damage to buildings and water tanks in
Norsup and Sarmet on Malekula Island (Pr6vot and Chatelain 1983)
Coseismic tectonic uplifts on Malekula Island were also measured in
association with the 1965 earthquakes (Figure 10) Over 1 meter of uplift
was detected for the 1965 earthquake sequence (Taylor et al 1980)
Only one sequence of earthquakes has been relatively damaging since
the Cornell-ORSTOM network began operating in 1978 The Mere Lava
earthquake (Ms 61) occurred on 12 May 1980 at 14800S and 16782degE and a
depth of 23 km The worst damage from this event was caused by landslides
SUMMARY OF FACILITIES AND PROGRAMS
Critical Facilities
Port Vila with a population of 15088 in 1979 is the administrative
and commercial center of the country There are a number of multistory
buildings in the capital and most of Vanuatus tourist industry is located
2
1970
140- )O AN OCT
JAN 19731974 0 00-
MAY 0
0--- 1965
S 9000 97150K 15deg AU61973 NOVV
1974
600 x OCT
4 1971 AUG 01966
171965
160shydeg 1 - - 2000
Ms S73 -77
63 -67
0
0
58-62170 1- 1 -_0 1660 1670 E 1680
Figure10 August 1965 earthquake sequence (from Isacks et al 1981)
21
in and near Port Vila A large shipping wharf is located near the center
of the city on Vila Bay
Apart from Port Vila the only significant development in Vanuatu is
at Luganville on Santo Island (pop 5116 in 1979) It remains an
important economic center for the country with agricultural processing and
shipping facilities located there There are several three- and four-story
buildings in the center of Luganville
Earthquake Preparedness Programs
As of late 1983 the Government had requested the assistance of a
consultant from New Zealand to help provide uniform building codes for the
country The Public Works Department enforces New Zealand seismic zone B
codes to construction of public buildings Large buildings for the most
part are designed by overseas engineering firms and generally comply with
the earthquake design standards Smaller buildings are generally designed
close to the New Zealand loading specifications but there continues to be
great difficulty in supervising construction projects
There is no large-scale earthquake education program in Vanuatu
Materials have been prepared by ORSTOM seismologists for distribution to
teachers public officials and planners involved in earthquake hazards
(eg Prdvot and Chatelain 1983)
Seismological Facilities
Seismological observations are necessary to the accurate location
study and ultimate prediction of earthquakes Seismic stations were first
established in Vanuatu in the mid-1960s by the French Office de la
Recherche Scientifique et Technique Outre-Mer (ORSTOM) Staion PVC in
Port Vila has operated continuously from 1964 to the present while LUG in
22
1680 1700140 1660 1670 1690 deg 140
GAUAP FIJI
PLATEAU 0
deg ~ HOG MAEWO -15 150 AOBA
2000 SANTO AB
MAP PENTECOST
160 A MT AM8160A= A 13AMBRYM-16
DENTRECASTEAUX OJi= LMP EPIP1FRACTURE ZONE
170 EME 170 EMAINGOUNA
NGAoS L E_ EFATE
RTVDvpP 18o 0shy180 -
o -180 z 0
o ERROMANGO
190 - Rk90R-190
TAN AN~o 4 FUTUNA
AUSTRALIAN oshy0 0TANNA
200 PLATE ANATOM 0 200
0 0
1650 1660 1670 E 1680 1690 1700
Figure 11 Map showing the seismograph stations in Vanuatu Circles arestations telemetered to the base station PVC on Efate island andunderlined stations have two components--one horizontal and one vertical The triangles are older ORSTOM stations INH and LUG are no longeroperational Strong motion instruments are located at SWB and LMP onMalekula island DVP and PVC on Efate island and LUG on Santo island
Luganville Santo operated through 1980 A third station on Tanna Island
(INH) operated through 1978 Cornell University began cooperative field
programs with ORSTOM in 1975 with a microearthquake experiment on Santo
Island An ocean-bottom seismograph experiment was carried out in southern
Vanuatu in 1977 and in central Vanuatu in 1978 The Cornell-ORSTOM
telemetered seismic network was established in 1978 and has operated
continuously since that time The seismic network now includes 19
telemetered stations (Figure 11) to date over 20000 earthquakes have
been recorded by the network A permanent ORSTOM mission is now based in
Port Vila and takes primary responsibility for day-to-day maintenance of
the network The availability of continuous earthquake monitoring in
Vanuatu is an important component of any earthqi-ke or -arthquake hazard
study for the country Figure 12 shows the seismicity level (magnitudes gt
4) recorded by the Worldwide Seismograph Station Network (WWSSN) Compare
these results with the increased sensitivity (magnitude gt 25) and location
accuracy of the regional Cornell-ORSTOM network which is shown by better
definition of seismic zones in Figure 13 These network data clearly
define the heterogeneous distribution of seismic activity in the central
portion of the arc
These seismological facilities are complemented by studies of ground
deformation using seven bubble-level tiltmeters a two-component longshy
baseline water tube tiltmeters and two levelling arrays
Strong-Motion Accelerographs
As part of the present program of seismic hazard evaluation in
Vanuatu Cornell and ORSTOM have installed five strong-motion
accelerographs on the islands of Efate Malekula and Santo (Figure 11)
__
5 t~j24
0 - 70km
o0 a 0 70-150km 0 C J
5 S S - 0 0 shy
-150-300km
a 0 o 300-700km
0
15S 4 -
bull7 -06 ----
SS
bull bull S
bull iilIIle
Figure I9 1p 4D JE l o shybull =r-
5 NO a~ 40
20 1 a
~ ~- 20Smbull 5m
- S r S st
16 E5 170 E~
165EI bull =W
Figre 2 Epcenresde sesme lcasspa er ea onia de sttos-16-1) PDE ocaionsofvent (167-182) vtand 1983)-- ha-la
25
PROFONDEUR - DEPTH 0 - 70 Km
E
05 0
EE
03 4 3
0I
Figur 13Siete e ~se bulloai~pa le rieuOSO-ONEL(918)
00i
oA
Fi3r1N
a
0--
E iete e e Icls sp rl dspeuOR T M C R E L(9 8 1 8 )
26 These acce2erographs complement the other instruments being used to study the seismicity in the region The accelerographs record the ground accelerations at a particular site fiom an earthquake strong enough to trigger the instrument To date these instruments have already been triggered by five moderate-sized shallow events and will be used to provide a basis for prediction of local ground motion induced by large interplate earthquakes in Vanuatu The high level of seismicity along this plate boundary suggests that a valuable baseline of strong-motion data can be collected in a relatively short period of time
Related Research Programs
The seismology program is carried out in cooperation with the Vanuatu Department of Mines Geology and Rural Water Supplies They are responsible for regional geology studies resource assessment detailed mapping and hydrological activities In addition ORSTOMs geology and geophysics department based in New Caledonia carries out an extensive
program of investigations covering submarine morphology marine geology and geophysics island geology and crustal structure The US Geological Survey has undertaken a series of detailed marine studies in the central and northern portions of the island arc using the research vessel SP Lee (1982 and 19F4) A detailed hydrographic survey was carried out in coastal waters by Australian researchers A tide gauge is maintained by the ORSTOM
mission in Port Vila (Pr6vot and Chatelain 1983)
PREVIOUS STUDIES
Seismicity Studies Along the New Hebrides Arc
Seismicity studies of the New Hebrides Arc by Isacks et al (1981) found that major bathymetric and structural complexities divide the central
27 part of the arc into segments approximately 100 km long The segment near
Santo and northern Malekula islands ruptured during two complex sequences
of events occurring in August 1965 and in late December 1973 through early
January 1974 (Table 1) In contrast the segments near the southern part of Malekula and Efate islands may not have ruptured during the past 75
years Moreover between southern Malekula and Efate islands the
orientation of the horizontal compressive stress within the upper plate
changes from a direction perpendicular to the arc to a more complex and
variable pattern found in the southern portion of the arc
Since the Cornell-ORSTOM network was established in 1978 10 moderate
(58 lt Ms lt 7) earthquakes have occurred within the network (Table 2) A
description of the seismicity recorded by the network follows
(A) Fore- and Aftershock Sequences of the August 1979 and July 1981 Main
shocks
(1) 17 August 1979 Sequence Figures 14A and 14B show earthquakes in the foreshock sequence of the 17 August 1979 earthquake The spatial and
temporal development of this activity was described by Isacks et
al [1981] This section provides a more detailed analysis of a longer
period of time A small zone near the epicenter of the 17 August
earthquake was intermittently active during late June - early July 1979
(Figure 14A) The more immediate foreshock sequence (Figure 14B) started
eight days before the main shock and consisted of five groups of events
Each group of foreshocks began with an earthquake having a magnitude
between 42 and 49 and each was followed by a number of small
aftershocks The first foreshock cluster was located just landward of the
trench Each successive cluster migrated in time northeast toward the
Relocations with all available teleseismic and local data for 1978-1981events except 27 Jan 1979 [Bulletin of the International SeismologicalCentre (ISC) location] remaining locations based on local data only 2Ms surface-wave magnitude taken from Monthly Bulletins of the PreliminaryDetermination of Epicenters (PDE)3MO seismic moments reported by Chinn and Isacks [1982] or in Monthly
Bulletins of the PDE (1981-1985 events)
4Mw is calculated from M0 by Mw - (115) x (log(Mo)-161)
17
0 0 0
0CD 00 aVm01 83 0 0 0
00 0 00 3
0 00 0
000 0 0
167 E 168 0 E
169 167 E
168 0 0
169 167 E 0 1
168 169
Figure 14 (A) Early foreshocks of the 17 August 1979 main shock (shown as a filled square) that occurredat the end of June to the beginning of July 1979 Island contours and 6 km bathymetry are shown (B) Lateforeshock activity preceding the 17 August 1979 earthquake Foreshocks migrated from the trench toward thelocation of the main shock (C) Foreshocks preceding the 15 July 1981 earthquake 0o
31 epicenter of the main shock The foreshock sequence ended with a very
intense concentration of seismicity near the 17 August 1979 main shock
epicenter The final foreshock cluster began eight hours before the main
shock and continued until the region became seismically quiet three hours
before the main shock The main shock occurred at the northeastern end of
these clusters
The development of the aftershock activity in Figure 15 is shown for
two time intervals during the nine days following the main shock During
the first day the aftershocks were initially located close to the epicenter
of the mainshock and rapidly expanded towards the west At the end of this
day aftershocks occurred as far north as the site of the 26 August main
shock and as far south as about 181degS (Figure 15A) Most of the increase
in the aftershock area occurred during the first day as can be seen by
comparing Figures 15A and 15B To the north the expansion of the aftershy
shock zone stopped near the epicenter of the next main shock of the
sequence that occurred nine days later on 26 August In the south aftershy
shocks were located in the same zone defined by the early foreshocks (also
see Figures 18C and 18D)
(B) 26 August 1979 sequence The development of the 26 August
aftershock zone (Figure 16) shows very similar patterns to the development
of the 17 August aftershock zone The activity developed very rapidly
during the first two days following the main shock (26 -- 27 August)
Then as in the case of the 17 August aftershock sequence the cumulative
sequence occupied an area larger by a factor of 2 or 3 than the one
expected for an earthquake of such magnitude [Isacks et al 1981] The
main shock was located on the southern edge of the aftershock zone -- the
aftershock activity developed to the north east and west only while the
aftershock zone of the 17 August event was nearly inactive (Figures 16A
16B) By 27 August aftershocks were located as far north as the epicenter
of the future 15 July 1981 earthquake and as far west as the New Hebrides
32
17
oA B
00
00
18 - 0o - 0 0
0 0
00
167 E 168 169 167 E 168 169
Figure 15 Maps of epicenters showing the development of the 17 August1979 aftershock sequence Format as in Figure 14 (A) 12H59M 17 August1979 to 12H59M 18 August (B) 13HOOM 18 August to 11H46M 26 August(to just before the 26 August main shock)
17
180 0 ogI0
0 00 o0
CP 00 000
0
0 0 0 8V
0 00 0 0(0 0
0 0
C0 0
C 0
167 E 168 I0
159 167 E 168
0
169 167 E
e l 0
168
_o
169
Figure 16 Maps of epicenters showing the development of the 26 August 1979 aftershock sequence Formatas in Figure 14 (A) 11H47M 26 August 1979 to IIH47M 27 August (B) IIH48M 27 August to IIH47M4 September (C) 1lH47M 4 September to IIH47M 26 October 1979
34
trench The aftershock zone ends very abruptly to the north along a
sharply defined east - west trending line which passes close to the
epicenter of the 1 September 1978 earthquake (Figure 18A) After the first
two days the level of aftershock activity decreased rapidly During the
entire period from the main shock to 14 September the aftershock zone of
the 17 August earthquake remained relatively quiet (Figures 16A 16B)
From 15 September to about mid - October both the 17 August and the 26
August aftershock zones were reactivated (Figure 16C) although the level of
activity was much lower than that during the days immediately following
each of the main shocks During this later period some activity occurred
in the back-arc region Northeast of Efate Island a small intense cluster
occurred in 1979 followed by shallow events spread around Efate Island
(Figure 16C) The level of activity then decreased and by the end of
October was back to a more normal background level of seismicity in the
entire region
The two aftershock zones of the 17 and 26 August 1979 earthquakes are
contiguous with some overlap in the area between the two epicenters (Isacks
et al 1981 Chatelain et al 1986) Chatelain et al (1986) show tiat
this area plays a key role in the development of the seismicity in ne
Efate region
(3) The 15 July 1981 earthquake In contrast to the 17 August 1979
earthquake no outstanding foreshock activity occurred prior to the 15 July
event Small clusters occurred on 5-6 and 12 July (see Figure 14C) Both
clusters included few events although each started with a magnitude (mb)
50 earthquake The larger of the two occurred on 12 July near the pending
main shock epicenter In contrast to the 17 August 1979 case no unusual
35
concentration of activity was noticed in the epicentral region during the
months immediately preceding the main shock Possible long-term precursory
activity may be the clusters observed in March and June 1980 and are
discussed in the next section
Figure 17 illustrates several outstanding features of the aftershock
sequence of the 15 July earthquake First an intense zone of activity
develops during the first day and continues throughout the sequence (Figure
17A) This zone is coincident with the aftershock zone of the preceding 26
August 1979 event (compare Figures 17A and 16) The southern boundary of
this activity is quite sharp and coincides with the region between the two
August 1979 epicenters this again emphasizes the importance of the area of
the two 1979 epicenters The epicenter of the main shock is located on the
northern boundary of the region of intense activity
Second the aftershock activity expands in size during the succeeding
nine days primarily northwards [see also Chatelain et al 1983] To the
northwest significant activity develops within the oceanic plate beneath
the trench axis (Figure 17B) This activity is concentrated beneath the
ORSTOM seamount [see USGS map by Chase et al 1983] near 173degS and
1672degE During the second through the ninth days activity continues to
develop in the area west of Epi Island and south of Malekula Island (Figure
17B) while in the succeeding 50 days the area of southern Malekula is
activated with a remarkable cluster occurring beneath the southern coast
(Figure 17C) The region of southern Malekula and Epi has been notably
quiet for much of the period prior to the July 1981 earthquake Back-arc
activity is also notable with a cluster occurring on 29 July east of
16 06 A B deg
0
O0
0 0
0~
o
000
0 0
0
00
0o~$
S 0 08 S
16E0
167 E
1 - C
0 0
168
0
16
0--
0
169 16
t
E
4P0
16
168
_ _ _ _ _ _ _ _
167
16 1o6
0
E 0
o S 0O
0 0
66
o5
0 6
0 24 Ju
q-o
0
6
1G 8HOM(C) 240 in~~ ~~
08OM24 JulJul toto 075M Figur 14
M Setme 1981 ()0H5M1Juy11to0H5M16Jl()0HO16uyto 1515 Setmbr191
I shy37
9Mo 4 o
uy
ON
37
Efate and increased activity in the region of Ambrym and Epi islands
(Figure 17C)
The aftershocks of the 15 July 1981 event thus affected four distinct
regions (1) the former 26 August 1979 aftershock zone presumably on the
interplate boundary (2) a region of the suboceanic plate near the ORSTOM
seamount (3) the region between South Malekula and 172degS presumably also
part of the interplate boundary and (4) upper plate crust cast of Efate
Island The total area affected by this earthquake was about 10 times
larger than the area expected for the rupture zone of an earthquake with
magnitude of the July 1981 event [Chatelain et al 1983]
(B) Prominent Clusters
Aside from aftershocks of the August 1979 and July 1981 events the
Efate -Malekula region also experienced several remarkable earthquake
clusters Some of these have the characteristics of an aftershock
sequence with the initiating event having the largest magnitude (and
sometimes preceded by a few foreshocks) Others have characteristics
intermediate between an aftershock sequence and a swarm [Mogi 1963] where
there may be several dominant shocks within the sequence and a more
symmetric shape to temporal variation of the number of events per unit
time The clusters are shown together with the larger aftershock sequences
in the summary of seismicity presented in Figure 18 For clarity the
aftershocks of the August 1979 and July 1981 events are represented by the
first nine days of activity
(A) Clusters in the forearc region The first cluster recorded by the
local network occurred in late September and early October 1978 near the 1
38
September mainshock (Figure 18A) and can be considered as a late part of
the aftershock sequence of the 1 September event The location of this
cluster however is activated again in later clusters (December 1979
August 1983 and April 1984) Figure 18A shows the next significant
activity in the region a cluster of earthquakes in December 1978 located
west of the August 1979 aftershock zone beneath the New Hebrides trench
The region was then fairly quiet until March 1979 when an intense cluster
of earthquakes occurred over a period of five days (Figure 18B) Activity
in the same area resumed again in April 1979 for a period of two days The
most active parts of both clusters are located at the same place which
defines an east - west trending zone located near the epicenter of the 26
August 1979 event and at the junction of the 17 August and 26 August
aftershock zones
After the August 1979 shocks three clusters occurred in December
1979 March 1980 and June 1980 (Figure 18G and 18H) near the epicenter of
the 1 September 1978 main shock (and also near the mid September 1978
cluster noted above) This location is on the eastern edge of the future
1981 aftershock zone The three clusters also tended to migrate toward the
July 1981 main shock epicenter (Figure 18G) A smaller cluster occurred in
August 1980 beneath Malekula Island (not shown on Figures) Actually the
entire region was rather quiet during 1980 The three 1980 clusters were
relatively small
In February 1981 a cluster of earthqukes occurred just west of the
location of the March -April 1979 clusters between those clusters and the
location of the December 1979 cluster (Figure 18H and 181) This location
39
Figure 18 Maps of epicenters in aftershock zones and clusters located bythe Cornell-ORSTOM network shown sequentially in time Epicenters of main shocks are shown by filled squares In each successive frame the next cluster overlays the preceding one for comparison Only successive clusters are shown in each frame All the activity recorded for the periods chosen is plotted Ten days of aftershock activity are shown for the August 1979 and July 1981 earthquakes
(A) 1 September 1978 main shock with September-October 1978 cluster (open circles) and December 1978 cluster (open squares)
(B) 27 January 1979 mainshock (no aftershock activity) with clusters of March-April 1979 (filled circles)
(C) Foreshock sequence for 17 August 1979 (open circles) (D) 17 August 1979 mainshock and aftershok sequence (filled circles)(E) 26 August 1979 mainshock and afters]ock sequence (open circles)
back-arc activity in September 1979 (crosses) (F) Cluster in December 1979 (filled circles) (G) Clusters in March 1980 (open circles) June 1980 (open squares) and
February 1980 on Efate island (plus signs) (H) Cluster in February 1981 (filled circles) (I) 15 July 1981 foreshocks (open circles) and June 1981 back-arc cluster
(plus signs) (J) 15 July 1981 aftershock sequence (filled circles) and back-arc activity
during July 1981 (plus signs) (K) Clusters in September-October 1981 (open circles) and activity on Efate
island in December 1981 (plus signs) (L) 12 March 1983 earthquake and aftershock sequence (filled circles) (M) Cluster in June 1983 (open circles) (N) 3 August and 5 August 1983 events and aftershock sequence (filled
circles) (0) Clusters in April 1984 (open circles) and in the back-arc near Epi
Island in March 1984 (plus signL) (P) Cluster in October 1984 (filled circles) (Q) Clusters in February 1984 (open circles) and April 1984 (open squares) (R) 3 July 1985 aftershock sequence (filled circles)
17
deg A B c
o 0W
0
03
0
00
(0C
0
00
00
0cn9
0
13g
0
o
000
o
0 000
0 0
0
0o 0
0 o 0S
(So
0
0
17
17 sclo
deg D c
p 0 0-
F
O 0 0 1800
O00 0
000
0 0 00 0
0 +
167 E 168 1690 167 E0 0
168 169 167 E 00
168 169
0 0
17
S
18
a I
0deg0Ck G
06+04
13 degp
~ - Ho
-to+00 0 o0o0o
0+1
I
0 0 +
18-
0
0O
A- V
J
+
- 00 B +o
K0 00 o0
L 0
0
0~
+
17 0
0
0j AbullB
0
0 0 0
0
0e
0 06
0 000
0
g oo
000
0+ 0olo
9
00
f 000
00 eFo 0 Q000
01
0 0
0 o00 1 0
o 0
1 7 E1 8116767E 168 169 167 E 168 169
I-0
16
7
0 o k3 ~
00
00
0 0
o 00
_o-I -
00 0 0
0 00
0
00
17s IP
0
00 00
13
01
0
0
00
000 0shy18
1868
CP 0 0t
00
169 167o
8
0
00
00
3
17E168 169 167 E 168 0 0 169 167 E 168 169
43
is part of the overlapping aftershock zones of the August 1979 events and
is also at the southern limit of the 15 July 1981 aftershock zone
The clusters thus have a very close spatial relationship to the
aftershock zones of the main shocks They occurred near the boundaries of
the aftershock zones and appear to be related to features delimiting or
defining the spatial development of the aftershock zones (see also
Chatelain et al 1986)
From February 1981 until August 1982 except for the aftershock
sequence of the July 1981 earthquake not a single fore arc cluster was
detected in the Efate Malekula region- Starting in September 1982
clusters began to occur around the former July 1981 immediate aftershock
zone In September and October 1982 four clusters occurred south of and
beneath Malekula Island (Figure 18K) Besides the aftershocks of the 15
July 1981 earthquake the September - October 1982 clusters were the most
prominent activity in the Malekula region during the entire 1978-1984
period These clusters did not occur at random places The first one was
located beneath Malekula Island at the site of the previous cluster in
1980 The second cluster is lcated southwest of Epi Island in an area
which experienced significanc activity during the aftershock sequence of
the 15 July 1981 earthquake (compare Figure 17C and 18L) The third
cluster shows a very linear pattern trending southwest - northeast right
along the extension of the northern edge of the 15 July aftershock zone
The fourth cluster then occurred beneath southern Malekula Island
In March and June 1983 two clusters occurred in the southern part of
the Efate zone The March 1983 cluster (Figure 18L and 18M) occurred near
the January 1979 epicenter and comprised a relatively small aftershock
44
sequence of a magnitude (Ms) 58 earthquake The June 1983 cluster
occurred just south of the July 1981 aftershock zone (Figure 18M and 18N)
This cluster affected the same zone which had already been affected by both
foreshocks and aftershocks of the 17 August 1979 mainshock Most of the
cluster occurred after a magnitude (mb) 54 shock which was the largest
event in the cluster The cluster thus has the charactistics of an
aftershock sequence but one with an abnormally large area for the main
shock magnitude The main shock was also preceded by a small foreshock
sequence that started a day before and stopped six hours before the main
shock
In August 1983 a dense cluster following a Ms - 56 and a Ms - 57
event occurred northwest of Efate Island (Figure 18N and 180) The latest
cluster recorded in the region occurred in April 1984 again activating the
same zone (Figure 180)
(2) Clusters in the back-arc region Although the back-arc region is
usually relatively aseismic there were clusters of earthquakes located
east of Efate Island and beneath Efate Island itself The clusters were
shallow and located in the island arc crust The areas affected were much
smaller than those in the forearc clusters Three of the clusters occurred
just before or after the August 1979 and July 1981 main shocks (Figures
18E 18F 181 and 18J) The August 1979 event was followed in September
1979 by a cluster east of Efate and in February 1980 beneath Efate The
July 1981 main shock was preceded in June - July 1981 by a swarm occurring
just south of the cluster following the August 1979 events Another
cluster occurred shortly after the July 1981 event at the same place The
July 1981 main shock was also followed by a swarm on Efate Island at about
45
the same place as the one following the August 1979 earthquakes No
clusters have been located in the Efate back-arc region from December 1981
when the last swarm occurred on Efate Island up to the most recent data
available October 1984 thus giving support to the close temporal
relationship between these clusters and the 1978 - 1983 sequence (see also
Chatelain et al 1986) In December 1980 a larger cluster occurred
farther east near the Coriolis trough (not shown on figures) The only
other back-arc activity occurred in March 1984 farther north just south of
Epi Island (Figure 180)
(3) Summary of Results from the Cornell-ORSTOM Network Investigation
of the patterns of seismicity associated with the earthquakes which have
occurred within the Cornell-ORSTOM network has shown that (1) not all
medium to large size events are associated with foreshock activity (2)
long term precursory activity sometimes occurs but not with enough
consistency to use in forecasting an impending event and (3) some zones
are activated before and after the main shocks without defining any clear
cycle (Chatelain et al in press) These earthquakes and their associated
seismicity suggest that specific features along the interplate zone
produced by the interaction of structures in the overriding and subducted
plates appear to control the seismicity in the Efate region (Chatelain et
al in press Isacks et al 1981)
Seismic Potential Studies Along the New Hebrides Arc
The earthquake hazard from the interplate zone is generally high
because of the rate of relative motion of the two plates (approximately 11
cmyr) and the stick-slip nature of the boundary However in addition to
large to great earthquakes along the plate interface moderate to large
46
magnitude events can occur within either plate and cause considerable
damage locally
One approach to determining the seismic potential of a region is to
identify a seismic gap or portion of an arc that has not produced a large
earthquake for some period of time The identification of a seismic gap
does not mean that a large earthquake will necessarily occur in a given
region because not all gaps will produce large earthquakes The gap may
indicate that (1) the section of the plate boundary is locked stress is
accumulating along the interface and will be the site of a future
earthquake or (2) the relative plate motion is being accommodated by
continuous slippage (aseismic creep andor by slip during small and
moderate events) such that sufficient stress to generate large earthquakes
along that section of the plate boundary does not accummulate Historical
information regarding the occurrence of earthquakes in a particular region
and regional tectonic constraints are necessary to clarify which of these
two possibilities is valid for the region in question In many cases
however the historical record may be incomplete or too short to accurately
determine which option is correct
Evaluation of the recurrence history of a particular region can be
investigated using (1) Teleseismically recorded earthquakes (2)
recurrence relations of smaller earthquakes recorded by seismograph
networks (3) pre-instrumental historical records of large earthquakes and
(4) evidence of prehistoric and historic large earthquakes observable in
the geological record Recurrence relations may help determine return
periods for certain sizes of earthquakes Recurrence intervals are
dependent upon the observations of seismograph networks and-are incomplete
47
since the period of record keeping is short compared to the time necessary
to develop these relationships Indirect evidence of large earthquakes can
sometimes be found in the geologic record in the form of uplift rates and
used to address the problem of recurrence intervals However information
obtained from the geologic record is necessarily limited in accurracy
McCann (1980) has divided the New Hebrides arc into different zones
and assigned values of seismic potential to these zones (Figure 19) based
on his study of historical and instrumental seismicity He has assigned 6
different divisions based on his study of the historical record (1) site
of a great (Ms 7 34) earthquake more than 100 years ago (2) site of a
great earthquake within the past 100 years but more than 30 years (before
1978) (3) incomplete historical record but indication that the region may
have the potential for a large earthquake (4) plate motion is subparallel
to the arc (5) no historical record of a great earthquake and the region
may not have the potential for one and (6) site of a large earthquake
within the past 30 years and presumably the lowest seismic potential
Marthelot (1983) used PDE data to determine some general segmentations
in the seismicity of the New Hebrides arc and the patterns of seismic
activity that characterize these segments (Figure 20) Marthelot (1983)
found that coupled interplate large (Ms lt 79) thrust earthquakes which
are preceded by intense activity dominate the northern end of the New
Hebrides arc near the Santa Cruz islands (between IIdegS and 13degS) Moderate
(Ms lt 72) thrust events concentrate between 13degS and 14degS Coupled
moderate (Ms lt 75) interplate thrust earthquakes occur near Santo and
northern Malekula islands (14degS to 165degS) The southern end of Malekula
and slightly south (165 0S to 1750S) exhibit coupled interplate thrust
48
14 S
2
19
24 I 165 E 170
Figure 19 McCanns seismic potential for New Hebrides island arc (McCann1980 See text for discussion of numbers
____
49
1650 1650 2 6 63 - 41 100
0 COUPLED INTER-INTRAPLATE THRUST
7467 e34 34
w
= EVENTS PRECEDED
BY INTENSE 24
AACTIVITY U I 44 CONCENTRATION
OF THRUST EVENTS
64-72 21O210
3
COUPLED 2061 73 0 _00
s INTERPLATE - 0 0C w THRUST EVENTS 78
PRECEDED BY 45t58C-150
DONUT PATTERNS 16 46 I S
81 03Q STEADY HIGH RATE L2 062 501 4 4
02ONLY ONE THRUST EVENT 61 025 INTRAPLATE200 ACTIVITY A 43
81 _0 2 O V CLUSTERS OF 72 73
RECURRING 76 150Q20 THRUST EVENTS 200
SLOW EXPANSION 4 OI01
OF ACTIVITY 8I 80 26 43 IN 198081- 13Do NO PRECURSORY
PATTERN 0 66 26
170 0 E 1720 170 0E 1720
Figure 20 Summary of the characteristics of the distribution of shallow earthquakes along the New Hebrides island arc The dashed line representsthe axis of the trench The trench disappears in the central part of the arc Horizontal lin separate regions characterized by distinct seismicity patterns Middle figure shows years of occurrence of large(Ms gt 70) and moderate-sized events (ms gt 60) 1961-1981 Right figureshows the large earthquakes that occurred from 1900 through 1960 (Marthelot and Isacks 1984)
50 earthquakes that are not quite as large (Ms lt 72) The zone west of Efate
(175degS to 18degS) exhibits a steady high rate of seismicity with magnitudes
(Ms ) less than or equal to 72 Between 18degS and 20degS intraplate activity
(Ms lt 72) dominates South of Anatom (eg south of 20degS) the seismicity
is characterized by clusters of recurring thrust events that do not exhibit
any precursory activity
In another study utilizing the PDE data set Wyss et al (1983) and
Habermann (1984) have used the shallow New Hebrides seismicity in order to
(1) identify areas of higher and lower strength within the plate interface
which might control the rupture length of future earthquakes and (2) test
for changes in the rate of seismicity prior to large earthquakes using a
statistical procedure The trend toward low stress drops in the central
portion of the arc near the intersection of the dEntrecasteaux Fracture
Zone with the New Hebride Trench is consistent with other studies which
indicate that this region is anomalous However a region of high or low
strength does not indicate anything about the nature of the region and
these regions do not help pinpoint when a large destructive earthquake
will occur within or near them
ASSESSMENT OF EARTHQUAKE HAZARD
Seismotectonic Provinces
We propose the following seismotectonic provinces and the maximum
probable (but not absolute) sizes of earthquakes be considered for the
subregions within Vanuatu when considering a design earthquake for these
regions (Figure 21) These provinces are based on the instrumental history
of earthquakes near Vanuatu The northern end of the New Hebrides Trench
is a complex zone of deformation where the interplate motion is changing
51
M612
13
S 0 0
18
231 165 E 170
Figure21 Earthquake potential for Vanuatu
--
--
52 from thrusting in the southern portion to mostly strike-slip motion in the
northern portion and has the potential for great (Ms 8) earthquakes The
central portion of the New Hebrides Trench here called the Santo
Malekula segment exhibits characteristics different from the rest of the
arc as the result of the dEntrecasteaux ridge interaction and has the
potential for Ms 7 34 earthquakes The southern end of the New Hebrides
Trench here called the Efate Tanna segment may have the potential for
Ms 8 earthquakes The extreme southern end of the New Hebrides Trench is
another complex zone where the interplate motion is changing from thrusting
in the north to strike-slip motion in the south and may be limited to
infrequent moderate (M 7 12) earthquakes Other sources of seismicity
include back-arc spreading east of the New Hebrides Trench (Ms 7 12) and
diffuse shallow activity along the Hazel-Holme Ridge (Ms 7) in the North
Fiji Basin (Ms 6 12)
One method for estimating the maximum possible magnitude earthquake in
a region is to look at the amount of deformation that has accumulated from
past earthquakes The deformation is assumed to be proportional to the
square root of the energy released by a powerful earthquake The energy
(E in joules) of each earthquake can be calculated from its magnitude (Ms)
using a formula developed for the region Pr~vot and Chatelain (1983) have
used the formula
Log E - 48 + (15 x Ms)
to calculate the amount of energy which has been released since 1965 in the
central portion of the arc (Figure 22) The calculated values tend to fall
within a range of values which can be bounded by two parallel lines since
deformation occurs more or less uniformly in time The maximum possible
E1 2 106 600 (joules )
500
400
300
200
136 shy
100
65 70 75 80 82 ANNEES - YEARS
Figure 22 Seismic energy release along the New Hebrides Arc since 1965 (Chatelain and Pr~vot 1983)
54
magnitude earthquake calculated by this method is Ms - 76 Prdvot and
Chatelain (1984) computed a similar result using all of the earthquakes
which have occurred since 1900
Ground Motion
Once the location and magnitude of potential earthquakes have been
determined for a region the next step is to determine the characteristics
of the ground shaking at a particular site This accomplished by the
condsideration of such quantities as earthquake source mechanism
epicentral distance and geometry and physical properties of the geologic
structures located between the source and the site
Strong-motion records provide one measure of site response To date
a relatively large number of strong-motion records have been generated in
the far-field of large earthquakes especially in California and Japan In
contrast relatively few near-field records of moderate and large shocks
have been recorded in island arcs These few have shown large scatter with
unpredictable results The 3 March 1985 Chilean and 19 September 1985
Mexican earthquakes constitute the most important exceptions and are
invaluable additions to the library of strong motion data for subduction
zones Nor-theless these two events do not constitute a databank of
information especially for intraoceanic tectonic settings such as Vanuatu
A major difficulty arises in trying to translate past earthquake size
(intensity values) which are based on cultural effects or magnitudes
derived from widely varying instrumental parameters into values of ground
motion The development of earthquake resistant design is usually based on
intensity of ground motion at a particular site The most widely applied
standard of comparison for strong motion data is the peak ground
55
accelereation (PGA) Figure 23 shows a general relationship between peak
acceleration and distance from hypocenter which has been derived from
worldwide earthquake data Some earthquakes generate relatively high
single peaks of ground accleration which represent little ground energy
Therefore on an absolute basis the use of PGA can be misleading for
smaller events
Peak ground accelerations are easily obtained from accelerogram
records however most historical information consists of earthquake
intensities Numerous relationships between ground acceleration and
Modified Mercalli intensities have been developed (Table 3) Two of these
proposed relationships are shown in Figure 24 For worldwide data Murphy
and OBrien (1977) have computed statistical correlations between Modified
Mercalli intensity values and ground accelerations (horizontal and
vertical) Theresultant relationships and the geometrical standard
deviation (s) are
log Av - 028 Imm - 040 s - 253
log Ah - 024 Imm- 026 s - 219
where -Av peak vertical ground acceleration
Ah - peak horizontal ground acceleration
Imm - Modified Mercalli intensity
Using the relationship of earthquake intensity to distance and size of
Fiji earthquakes Everingham (1984) has produced a plot for the Fiji region
(Figure 25) Although these results are for a nearby region they give a
general indication of what might be expected for Vanuatu Figure 26
(Prdvot and Chatelain 1983) shows the recurrence of Modified Mercalli
intensities per number of earthquakes
56
1000 1 I l I I eO58 M(R 5 -X A= 1320 e R+25)152
5
MEAN + a =2N01 - STANDARD 2-
oe DEVIATIONbullbull- ~0 MEAN + 2
tbull 0o - STANDARD - oo o DEVIATIONS Jf E N o 0
LU0
U 01 0_ o o 0-oo n 00 bull
L) em a00
- MEAN - shy - 4ra 00 L 0 W STANDARD 0-~DEVIATIONWL 000 to
0 ME N -2 1 STANDARDUx 0
DEVIATIONS
101- 10 - 000
D N O oENTE K - 1 so-
10 100 1000
DISTANCE FFROM HYPOCENTEFR IN KILOMETEFRS
Figure 23 Acceleration-attenuation relations derived from worldwide earthquakes (Hays 1980)
57
Table 3 Characteristics of the data samples used in selected studies of the correlation of ModifiedMercalli intensity and peak ground acceleration (modified fom OBrien et al 1977)
Number and Range of location Number Modified Mercalli Distance Acceleration
Study of earthquakes of recordings intensity
Gutenberg and 61 Western 167 n-VIII Richter 1942 United States 1956
Neumann 1954 10 do
Hershberger 1956 60 do Coulter Waldron dodo
and Devine (Not based 1973 entirely on
observed data)
Trifunac and 57 do Brady 1975c
10 V-VIII
108 J-Vil IV-X
187 IV-X
range (kin) range (cms2)
3-450 1-300
Averages of 40-300 25 and 160 (distance dependent) - 1-300 Short distance 6-3000
(Dependent on site geology and local amplification)
Figure 24 Proposed relationships between earth quake intensities and peack accelerations
59
DEPTH 20KM
7shy
6- 6 0
075 502
61 h0
DISTANCE KM
Figure 25 Modified Mercalli earthquake intensities observed in Fiji as a function of magnitude and epicentral distance (Everingham 1984)
60
10
0
5CI I-C)
0i
0
o
01 a)o
PORTVILA = SANTO
00
E
0212
000
E
z
Degres Mercali _ Mercalli degrees
Fiue-2 Frequency of Modified Mercalli earthquake intensities felt in Port Vila and Santo (Chatelain and Prfivot 1983)
61
Tectonic Uplift
Studies of longer term island uplift on Santo and Malekula as
evidenced by the uplift of coral reefs have related segmentation of these
islands to features of the subducting topography of the dEntrecasteaux
fracture zone (Taylor et al 1980) The proximity of these two islands to
the main interplate thrust zone and the growth of the coral reef terraces
around the islands has resulted in preservation of long-term deformation
Taylor et al (1980) have studied late Quaternary coral reefs that have
been uplifted on Santo and Malekula islands They identified four main
blocks based on long-term tilt differences (Figure 27) The rupture zones
of the 1965 and 1973-1974 earthquake sequences correlate to the tectonic
discontinuities in the Santo -- Malekula region Taylor et al (1980)
studied the uplift of coral terraces on Malekula over a period of three
years (976 1177 and 779) and found that just over 1 meter of uplift
had occurred in the northern part of the island as a resalt of the 1965
earthquake (Figure 28 Table 4)
Tsunamis in Vanuatu
Tsunamis (seismic sea waves) are caused by displacements in submarine
topography that are induced by earthquakes andor volcanic activity
occurring below or near the floor of the ocean Low-lying areas near the
shore are particularly vulnerable to damage by these waves The shallow
seismic zones of the Southwest Pacific have a history of earthquakeshy
generated tsunamis (Figure 29) A few tsunamis have originated in the
Vanuatu region A tsunami was produced by the first earthquake of the
March 1875 sequence (Iida et al 1967) The earliest known significant
one was the 10 January 1878 earthquake which produced a large tsunami
62
1167030E
AK-A 150 30 S
Tasmaloum Arkialo
NORTH MALEKULA
X Direction of tilt inferred from reef terraces 16000S
Tilt discontinuity
Pliocene and Quaternary shy sedimentary rocks mostly
coral limestone
r Pre-Pliocene sedimentaryand igneous rocks SOUTH
MALEKULA
160305
Figure 27 Tectonic uplift associated with the 1965 Santo earthquakes (Taylor et al 1980)
63
Contour Interval =02 m 02--- 04 - hp
0-6- shy08 xx16 000Sshy
08 9
06
02 i
00
160 30S a
167 0 00E 167 030E
Figure 28 Measurements (meters) of 1965 uplift made in September 1976November 1977 and July 1979 The letters on the figure represent the places and amounts of uplift given in Table 2 The contours of uplift(contour interval - 02 ) represent one of the simplest interpretations of the uplift pattern consistent with the measurements (Taylor et al 1980)
64
TABLE 4 Uplift Measured Along the Coast of Northern Malekula
Year Number ofStation Place Name Measured Measurements a Southwest Bay 1977 observationb Bamboo Bay 1977 observation c Dixon Reef 1977 Id Lambubu Bay 1976 15 e West Bay 1976 5f Horrok 1976 Ig Brenwe 1976 4h Liwout Point 1976 1979 50i East Leviamp 1976 4j West Leviamp 1976 6k Elephant Point 1976 17I Win 1979 24 m Wihet Bay 1979 23 n Rambak 1979 30 o Npennanavet 1976 10P Matanvat 1976 4 q Potovrou 1977 1 r Atchin Island 1977 observations Wala Island 1977 observation t Norsup 1977 I u Lamp 1977 observation
Insufficient measurements for a standard deviation to be useful
Figure 29 Tsunami history of the Southwest Pacific Filled circles indicate locations of tsunaznigenic events dashed circles indicate inferred locations of tsunamigenic events
66
(12-17 m lida et al 1967) and 6 meters of uplift of the harbor at Port
Resolution (Warden and Mitchell 1974) Other earthquake generated
tsunamis have occurred in 1961 1965 and 2 in 1967 (lida et al 1967)
While major Pacific-wide tsunamis such as those generated along the South
American or Alaskan plate margins apparently do not affect Vanuatu
significant local tsunamis may be generated by large shallow earthquakes
occurring within the region
Volcanic Eruptions in Vanuatu
Volcanic activity is concentrated in the central belt of the Vanuatu
island arc Much of the present activity is confined to solfataric
eruptions however explosive eruptions are known (eg the 1878 Yasowa
eruptions)
In general the potential effects of a volcanic eruption on the
inhabitants of the islands of Vanuatu are small except for those people
who are living in the immediate vicinity of an active volcano However
evacuation of inhabited volcanic islands may be necessary in larger
eruptions Even distant volcanic eruptions such as those at Home Reef in
the Kingdom of Tonga during March 1984 produced large quantities of pumice
some of which rafted across large portions of the Southwest Pacific The
floating pumice interfered with shipping throughout the Southwest Pacific
region (SEAN Bull 1984)
IMPLICATIONS FOR MITIGATION OF EARTHQUAKE RISK
Several significant steps may be taken that will significantly
mitigate the loss of life and property from future earthquakes in Vanuatu
The following five steps provide suggestions for mitigation of the
earthquake risk
67
Earthquake Education
First an earthquake education program such as that adopted in Fiji
or Papua New Guinea is strongly recommended At minimal cost to the
Government such a program may be mounted through the schools Red Cross
programs and through the news media In other countries earthquake
education programs have taught simple methods of strengthening house
construction and minimizing hazardous conditions within the home they
have warned of tsunami hazards to coastal dwellers they have instructed on
proper behavior during an earthquake they have helped to encourage storage
of emergency food water and equipment in many households and
importantly they have helped avoid panic during an earthquake and
stimulated cooperation with government officials following such a disaster
Earthquake education programs are effectively combined with other disaster
preparedness programs (eg cyclones floods and so on) An example of
educational materials prepared by the Fiji Mineral Resou-ces Department is
included in Appendix IV
A few simple measures can be taken to reduce the likelihood of damage
to personal property A system of baffles in water reservoirs can reduce
the chances of seiches being set up in the tanks and the ultimate collapse
of the towex if the motion is large enough Large heavy objects should
not be put in high places where they can be easily dislodged unless they
are anchored in place This would apply to things like stereo speakers and
other objects that might be on shelves Products on shelves in stores and
books in offices can be restrained with wire retainers along fronts of
shelves Heavy objects that could tip over (such as hot water heaters and
gas tanks) can be fastened with anchoring bands This is especially a
68
concern with gas tanks which could fall over rupture lines and result in
fire
Building Codes
Second adoption of building codes for Vanuatu is imperative There
is a real danger of a large earthquake occurring very close to Port Vila or
Luganville In general the adequacy of construction is a major factor
controlling the damage and loss of life brought on by such an earthquake
Building codes designed for areas of similar earthquake hazard such as New
Zealand Code A California Building Codes or Papua New Guinea Codes 1 or
2 would be appropriate for Vanuatu Observation of such codes is most
crucial for public multistory buildings in the major towns of Port Vila
Efate and Luganville Santo As important as the design of such buildings
are the construction methods and guality of construction material used to
implement building design Careful monitoring of construction by competent
engineers is important for critical facilities The traditional houses
have kept down past losses of life and property but increasing population
and rapid urbanization can result in higher potential damage if
earthquake-resistant designs are not implemented One of the primary
reasons for property damage resulting from the Mere Lava earthquakes was
related to the siting of newer homes Houses located on steep slopes
suffered damage when they were not situated on competent substrate (Figure
30) The shaking of the fill and loose soils by the earthquakes caused
unconsolidated materials to shift under the foundations
Emergency Civil Defense Procedures
Third development of specific Civil Defense plans for emergency
procedures following an earthquake or tsunami should be initiated Of
69 a ) Poorly - situated house
and terrace e
house built too far over slope Rear
0 R
near cutting vertical and too backwall of house
bull e
b ) Earthquake- induced slope movements
-7 Rear cutting collapses pushingForward terrace edge - house orward
subsidesunder mining huefrad house foundation shy
Landslippage here
c) Well- situated house and terrace Good distancebetween house and
Good between
distance house
cutting
ond sopr I Rear cutting slope back and planted with natural vegetation
Figure 30 Sche7atic representation of causes of damage to poorly sited houses and suggestions for future house contruction in areas of loosely consolidated soil
70 course earthquake preparedness plans have much in common with hurricane or
other natural disaster planning but specific effects of earthquake
occurrence must be considered structural damage to multistory buildings
interruption of water supply disruption of electrical and gas lines
secondary geological effects such as ground liquefaction or landslides in
the near-source region complicating effects of aftershocks in the days and
weeks following a major earthquake The primary structure for such civil
defence plans already is in place in Tonga Programs specific to the
earthquake hazard may be added following similar programs in Fiji Papua
New Guinea and New Zealand
Long-term Seismicity Observations
Fourth long-term seismicity and strong motion observations should be
continued In the long-term such information will help to refine
estimates of seismic potential along the New Hebrides plate boundary they
will help to more directly and accurately assess the ground motion
parameters of direct concern to engineers for building design in
Vanuatu--ground acceleration frequency spectra horizontal and vertical
components of ground motion local amplification effects and so on
Furthermore seismicity patterns may provide a key to long-term forecasting
and short-term prediction of the location and size of future earthquakes
that may affect Vanuatus population
Internationa Cooperation
Fifth international cooperation among the island countries of the
Southwest Pacific and foreign agencies (eg US Geological Survey
ORSTOM etc) may significantly help in Vanuatus earthquake preparedness
program All of the countries affected by earthquakes (Vanuatu Western
71
Samoa Fiji Tonga Solomon Islands Papua New Guinea and New Zealand)
have to varying degrees developed earthquake preparedness programs
Vanuatu may take advantage of the previous current and any future efforts
of the other countries in the region
72-76
References
Atkin R J (1968) On volcanoes in the New Hebrides and Banks Islands Quarterly J of the Geologvical Society of London 24 305-307
Calder N 1972 The Rescless Earth A Report on the New Geology The Viking Press New York N Y
Carney J N and A Macfarlane (1979) Geology of Tanna AneityumFutuna and Aniwa New Hebrides Geological Survey Regional Report 71 pp Carney J N and R Campillo (1980) An investigation into damage causedby seismic activity on Mere Lava during May 1980 Geological Survey DeptOf Vanuatu Report
Chase C G (1971) Tectonic history of the Fiji Plateau Geol Doc Amer Bull 82 3087-3110
Chase T E B A Seekins J Daniel and J Y Collot (1983)Topography of the Vanuatu region map US Geological Survey Alexandria VA
Chatelain J L R K Cardwell and B L Isacks (1983) Expansion ofthe aftershock zone following the Vanuatu (New Hebrides) earthquake on 15July 1981 Geophys Res Lett 10 385-388
Chatelain J L B L Isacks R K Cardwell R Pr6vot and M Bevis (inpress) Patterns of seismicity associated with asperities in the centralNew Hebrides Island Arc J Geophys ResChinn D S (1982) Accurate source deths and focal mechanisms ofshallow earthquakes in western South America and in the New Hebrides island arc PhD Thesis Cornell University Ithaca NY
Chinn D S and B L Isacks (1983) Accurate source depths and focalmechanisms of shallow earthquakes in western South America and in the NewHebrides island arc Tectonics 2 529-563
Chiu J-M (1982) Structural features of subduction zone determined bydetailed analysis of short period seismic waves from earthquakes recordedin the New Hebrides island arc PhD Thesis Cornell University
Collot J Y J Daniel and R V Burne (1985) Recent tectonicsassociated with the subductioncollisioi of the DEntrecasteaux zone in thecentral New Hebrides Tectonophys 112 325-356
Coudert E B L Isacks M Barazangi R Louat R Cardwell A Chen JDubois G Latham and B Pontoise (1981) Spatial distribution andmechanisms of earthquakes in the southern New Hebrides arc from atemporary land and ocean bottom seismic network and from worldwide observations J Geophys Res 86 5905-5925
77
Dubois J J Lauray J Recy and J Marshall (1977) New Hebrides trench Subduction rate from associated lithospheric bulge Canadian J Earth Sci 14 250-255
Ebel J E (1980) Source processes of the 1965 New Hebrides Islands earthquakes inferred from teleseismic waveforms Geophys J Royal Astron Soc 63 381-403
Everingham I B (1984) Provisional list of felt earthquakes reports in Fiji 1941-1981 Min Resources Dept Fiji Note BP 338 17 pp
Falvey D A (1978) Analysis of paleomagnetic data from New Hebrides Bull Austr Explor Geophys 9 117-123
Geological Map of the New Hebrides Condominium scale 11000000 (1975)Ministry of Overseas Development (Directorate of Overseas Surveys) DOS 1196 British Residency Port Vila New Hebrides
Gilpin L M A L Bloom B L Isacks and M Bevis F W Taylor and C Jouannic (1982) Late Pleistocene coral reef terraces as tiltmeters on Santo Island Vanuatu (New Hebrides) EOS Trans Amer Geophys Union 63 430
Gutenberg B and C F Richter (1954) Seismicity of the Earth 2nd ed Princeton NJ Princeton University Press
Habermann R E (1984) Spatial seismicity variations and asperities in the New Hebrides seismic zone J Geophys Res 89 5891-590
Hamburger M W (1986) Seismicity of the Fiji Islands and Tectonics of the Southwest Pacific PhD thesis 312 pp Cornell University Ithaca NY
Hays W W (1980) Procedures for estimating earthquake ground motions U S Geological Surv Prof Paper 1114 77 pp
Ibrahim A K B Pontoise G Latham M Larue T Chen B Isacks J Recy and R Louat (1980) Structure of the New Hebrides arc-trench system J Geophys Res 85 253-266
lida K D Cox and G Pararas-Carayannis (1967) Preliminary Catalog of Tsunamis Occurring in the Pacific Ocean HIG University of Hawaii
International Seismological Centre (ISC) 1978-1979 Bulletin of the International Seismological Centre Newberry Berkshire United Kingdom
International Seismolog4 cal Centre (ISS) 1918-1963 International Seismoshylogical Summary Newbury Berkshire UK
78
Isacks B L and M Barazangi (1977) Geometry of Benioff zones Lateralsegmentation and downwards bending of the subducted lithosphere in IslandArcs Deep Sea Trenches and Back-Arc Basins Talwani M and W C Pitmaned Maurice Ewing Series 1 Amer Geophys Union Washington D C 99shy114
Isacks B L G Hade R Campillo M Bevis D Chinn J Dubois JRecy and J L Saos (1978) Measurements of tilt in the New Hebrides island arc in Proceedings of Conference VII Stress and StrainMeasurements Related to -Prthquake Prediction US Geological SurveyOpen-rile Report 79-370 176-221
Isacks B L R Cardwell J-L Chatelain M Barazangi J-M MarthelotD Chinn and R Louat (1981) Seismicity and tectonics of the central NewHebrides Island Arc in Earthquake Prediction An International ReviewMaurice Ewing Ser 4 edited by D W Simpson and P G Richards AGUWashington DC 93-116
Johnson T and P Molnar (1972) Focal mechanisms and plate tectonics ofthe southwest Pacific J Geophys Res 77 5000-5032
Karig D E (1971) Origin and development of marginal basins in the western Pacific J Geophys Res 76 2542-2561
Karig D E and J Mammerickx (1972) Tectonic framework of the New Hebrides island arc Marine Geology 12 187-205
Kelleher J J Savino H Rowlett and W McCann (1974) Why and where great thrust earthquakes occur along island arc J Geophys Res 794889-4898
Kroenke L (1984) Cenozoic Tectonic Development of the SouthwestPacific United Nations Econ and Social Commission for Asia and the Pacific Technical Bull 6
Lay T and H Kanamori (1981) An asperity model of large earthquakesequences in Earthquake Prediction An International Review Maurice EwingSer 4 edited by D W Simpson and P G Richards AGU Washington DC 579-592
Luyendyk B P W B Bryan and P A Jezek (1974) Shallow structure ofthe New Hebrides Island Arc Geol Soc Amer 85 1287-1300
Louat R J Daniel and B Isacks (1982) Seismicitd de larc desNouvelles Hebrides in Equipe de GOologie-GOophysique du Centre ORSTOM deNoumda Contribution Aletude godvnamique du Sud-Ouest Pacifique Travau et Documents de lORSTOM 1147 179-186
Mammerickx J T E Chase S M Smith and I L Taylor (1971)Bathymetry of the South Pacific map Scripps Inst of Oceanogr La Jolla Calif
79 Marthelot J-M (1983) Patterns of seismicity in the Vanuatu (NewHebrides) arc Regional variations and systematic evolution PhD Thesis Cornell University
Marthelot J-M J-L Chatelain B L Isacks R K Cardwell and ECoudert (1985) Seismicity and attenuation in the central Vanuatu (NewHebrides) islands A new interpretation of the effect of subduction of theDEntrecasteaux Fracture Zone J Geophys Res 90
McCann W R (1980) Large and moderate size earthquakes Theirrelationship to the tectonics of subduction Ph D thesis Lamont-DohertyGeol Observ of Columbia Univ Palisades NY
McCann W R S P Nishenko L R Sykes and J Krause (1979) Seismicgaps and plate tectonics Seismic potential for major boundaries Pure Appl Geonhys II_7 1082-1147
McGuire R K (1977) Effects of uncertainty in seismicity on estimateof seismic hazard for the East Coast of the United States Bull Seis Soc Amer 67 827-848
Mitchell A H G and A J Warden (1971) Geological evolution of the NewHebrides island arc J Geol Soc London 127 501-529
Mogi K (1963) Some discussions on aftershocks foreshocks andearthquake swarms--The fracture of a semi-infinite body caused by an innerstress origin and its relation to the earthquake phenomena (third paper)Bull Eartho Res Tnst Tokyo Univ 41 615-658
Monzier M J Y Collot and J Daniel (1984) Carte bathymetrique desparties centrale et meridionale de larc insulaire des Nouvelles-Hebridesmap Office de la Recherche Scientifique et Technique Outre-Mer (ORSTOM) Paris
Murphy J R and L J OBrien (1977) Analysis of a worldwide strongmotion data sample to develop an improved correlation between peakacceleration seismic intensity and other physical parameters ComputerSciences Corporation Rept NUREG-0402 to US Nuclear RegulatoryCommission 68 pp
Pascal G B L Isacks M Barazangi and J Dubois (1978) Preciserelocations of earthquakes and seismotectonics of the New Hebrides island arc JGeophys Res 83 4957-4973
Preliminary Determination of Epicenters (PDE) 1961-1981 MonthlyBulletin National Earthquake Information Service US Geological SurveyAlexandria Va
Pr~vot R and J L Chatelain (1982) Seismicity and seismic risk inVanuatu Report No 5-83 Centre ORSTOM Nouma New Caledonia
Richter C F (1958) Elementary Seismology W H Freeman and CompanyInc San Francisco
80
Rothe J (1965) The Seismicity of the Earth 1953-1965 Paris UNESCO 336 ppSanto T (1970) Regional study of the characteristic seismicity of theworld Part III New Hebrides island region Bull Earthquake Res Inst Tokyo Univ 48 1-18
SEAN (Scientific Event Alert Network) Bulletin 9
Taylor F W B L Isacks C Jouannic A L Bloom and J Dubois(1980) Coseismic and Quaternary vertical tectonic movements Santo andMalekula islands New Hebrides-island arc J Geophys Res 85 5367-5381
Taylor F W C Jouannic and A L Bloom (1985) Quaternary uplift ofthe Torres Islands northern New Hebrides frontal arc Comparison withSanto and Malakula Islands central New Hebrides frontal arc J of Geol 93 419-438
Trifunac M D (1976) Preliminary analysis of the peaks of strongearthquake ground motion--dependence of peaks on earthquake magnitudeepicentral distance and recording site condition Bull Seism Soc Amer 66 189-220
Trifunac M D and A G Brady (1975a) Correlations of peakacceleration velocity and displacement with earthquake magnitude andsite condition Intl J Earthquake Engr Struc Dynamics 4 455-471
Trifunac M D and A G Brady (1975b) On the correlation of seismicintensity scales with the peaks of recorded ground motion Bull Seism Soc Amer 65 139-162
Turcotte D L and G Schubert (1982) Geodynamics John Wiley amp Sons New York
US Geological Survey 1961-1985 Preliminiry Determination of Epicenters Denver Colo
Vidale J and H Kanamori (1983) The October 1980 earthquake sequencenear New Hebrides Geophys Res Lett 10 1137-1140
Wellington Seismological Observatory Geophysics Division 1953-1960 NZDept Scientific and Industrial Research Catalog of Earthuakes 1953-1960
Wray S T R K Cardwell B L Isacks E Cudert and J-L Chatelain(1983) Detailed seismicity observations in the forearc region of aconvergent plate boundary Malekula Island Vanuatu (abstract) EOS Trans Am Geophys Union 62 945
Wyss M R E Habermann and C Heiniger (1983) Seismic quiescencestress drops and asperities in the New Hebrides arc Bull Seismol Soc Am 23 219-236
81
APPENDIX I DEFINITIONS
Two measures of the size of an earthquake are magnitude and intensity
Magnitude is a measure of the energy from an earthquake source to indicate the
strength of an earthquake In comparison intensity is a measure of the amount
of ground shaking caused by the earthquake at a particular site Thus an
earthquake of a given magnitude will produce a wide range of intensities
depending largely on distance from the source
In general a small earthquake with a magnitude less than 5 may be felt
only in the area near the source and a moderate earthquake with a magnitude
between 5 and 7 will be felt over a wider area and may produce significant
damage in the area very close to the source A large earthquake refers to an
earthquake with a magnitude greater than 7 Such events are often very desshy
tructive if they are located near population centers A major earthquake
refers to magnitudes between 7 and 7 34 and a great earthquake refers to
magnitudes greater than 7 34 These great earthquakes cause widespread desshy
truction and possible regional tsunamis Generally the potential damage from
earthquakes is multiplied by the secondary effects of earthquake occurrence
such as ground faulting generation of tsunamis landslides slumping or
liquifaction
The depth of earthquakes range from the surface to approximately 700 km
depth Shallow earthquakes refer to those with depths between the surface and
70 km Intermediate earthquakes refer to those with depths between 70 km and
250 km depth Deep earthquakes refer to those with depths greater than 250 km
(but less than 700 km) Intermediate depth earthquakes occasionally produce
damage at the earths surface only if the earthquake is very large Deep
events are generally not felt
82
The seismic (earthquake) potential of a particular region is defined as
the likelihood of that region to experience a (destructive) earthquake within
particular magnitude range within a particular time period The seismic
(earthquake) hazard of a particular location refers to the amount of ground
motion that might be expected from an earthquake within or near that region
Adequate data on seismotectonic features instrumental (strong-motion) and
macroseismic (intensity) records of near-field effects of large earthquakes
source parameters of large earthquakes earthquake spectra and ground attenuashy
tion or amplification are necessary in order to reasonably evaluate earthquake
hazard for any region The seismic potential is the integration of all of
these bits of information The average length of time between earthquakes of a
particular size (recurrence interval) and the amount of time elapsed since the
last earthquake of that size help to define the probability of future earthshy
quake occurrence along a particular seismogenic zone hence the seismic
potential of that zone
Seismic risk of a particular region refers to the expected degree of
losses of people and their property which result from the seismic hazard and
the vulnerability in the region One method that has been widely used for this
risk determination (and is used here) involves the determination of a maximum
probable earthquake (design earthuake) that is likely to occur in the imshy
mediate region Calculations of seismic hazard which are based on design
earthquakes generally yield conservative estimates of risk
The most important conclusion of historical studies of seismicity is to
define the seismogenic zones of a region and extrapolate what the future earthshy
quake potential is for those zones Seismically quiescent regions refer to
regions with a lower level of seismic activity which are surrounded by more
83
active regions Portions of major plate boundaries that have not experienced a
major or great earthquake during a particular time interval are seismic Raps
This time interval is taken to be a significant portion of the earthquake
recurrence interval for a large earthquake An estimate to within several
decades of the location and size (magnitude) of a large earthquake constitutes
a forecast If a precise calculation of the time and probability of occurrence
can be added to the location and size information then the estimation is a
prediction
84
APPENDIX II MODIFIED MERCALLI INTENSITY SCALE (1956 VERSION)
Masonry A B C D To avoid ambiguity of language the quality of masonry brick or otherwise is specified by the following lettering whichhas no connection with the conventional Class A B C construction)
Masonry A Good workmanship mortar and design reinforced especiallylaterally and bound together by using steel concrete etc designed to resist lateral forces
Masonry B Good workmanship and mortar reinforced but not designed in detail to resist lateral forces
Masonry C Ordinary workmanship and mortar no extreme weaknessez likefailing to tie in at corners but neither reinforced nor designed againsthorizontal forces
Masonry D Weak materials such as adobe poor mortar low standards ofworkmanship weak horizontally
DESCRIPTION (INTENSITY VALUES RANGE FROM I TO XII)
I Not felt Marginal and long-period effects of large earthquakes
II Felt by persons at rest on upper floors or favorably placed
III atlt indoors Hanging objects swing Vibration like passing oflight trucks Duration estimated May not be recognized as an earthquake
IV Hanging objects swing Vibration like passing of heavy trucks orsensation of a jolt like a heavy ball striking the wallsStanding motor cars rock Windows dishes doors rattle Glassesclink Crockery clashes In the upper range of IV wooden walls and frames creak
V Felt outdoors direction estimated Sleepers wakened Liquidsdisturbed some spilled Small unstable objects displaced or upset Doors swing close open Shutters pictures move Pendulum clocks stop start change rate
iOriginal 1931 version in Wood H 0 and F Newmann 1931 Modified
Mercalli Intensity Scale of 1931 Bull Seis Soc Amer 53 979-9871956 version prepared by Charles F Richter in Elementary Seismology(1958) 137-138 W H Freeman and Company
VI Felt by all Many frightened and run outdoors Persons walk unsteadily Windows dishes glassware broken Knickknacks booksetc off shelves Pictures off walls Furniture moved or overshyturned Weak plaster and masonry D cracked Small bells ring(church school) Trees bushes shaken (visibly or heard to rustle--CFR)
VII Difficult to stand Noticed by drivers of motor cars Hangingobjects quiver Furniture broken Damage to masonry D includingcracks Weak chimneys broken at roof line Fall of plasterloose bricks stones tiles cornices (also unbraced parapets andarchitectural ornaments--CFR) Some cracks in masonry C Waves on ponds water turbid with mud Small slides and caving in alongsand or gravel banks Large bells ring Concrete irrigationditches damaged
VIII Steering of motor cars affected Damage to masonry C partialcollapse Some damage to masonry B none to A Fall of stucco and some masonry walls Twisting fall of chimneys factory stacks monuments towers elevated tanks Frame houses moved onfoundations if not bolted down loose panel walls thrown outDecayed piling broken off Branches broken from trees Changes inflow or temperature of springs and wells Cracks in wet ground and steep slopes
IX General panic Masonry D destroyed masonry C heavily damagedsome times with complete collapse masonry B seriously damaged(General damage to foundaticns--CFR) Frame structures if notbolted shifted off foundations Framed cracked Serious damageto reservoirs Underground pipes broken Conspicuous cracks inground In alluviated areas sand and mud ejected earthquakefountains sand craters
X Most masonry and frame structures and bridges destroyed Seriousdamage to dams dikes embankments Large landslides Water thrown on banks of canals rivers lakes etc Sand and mudshifted horizontally on beaches and flat land Rails bent slightly
XI Damage nearly total Large rock masses displaced Lines of sightand level distorted Objects thrown into the air
86 APPENDIX III EARTHQUAKE EDUCATION PAMPHLET PUBLISHED IN FIJI
EARTHQUAKE What to do how to help
-
bull - -C II
deg
Damage at Suva wharf caused by the 1953 -earthquakelw hich was followed by a tidal wave within 30 seconds
1 411_0- shy
87 from theA message Minister for Lands
Recent earthquakes in Waya tsunamis might be the most Island and the even more recent one effective means of mitigating which rocked the city of Suva short- the worst effects of a sudden ly after 9am on Decanber 171975 calamity in these two potentshyand the ensuing panic reaction of ially dangerous forms is to the people are sharp reminders to us know more about them that although Fiji is situated in an
Indeed the suddennessearthquake zone there is little in-the severity of a wideshyformation available to the public on and
spread disaster could disruptearthquakes and tsunamis (tidal which are often associated all communications and paralysewaves)
with the type of earthquakes we have even the most efficient and experienced in Fiji well-drilled emergency organishy
sation it is hopeZ that the infor-
Survival in those cirshymation pamphlet prepared by myministry on earthqkes and tsunamis Ceatnces would depend on
will allay some of the natural alarm each individuals own knowshy
which people exp -ence during even
the minor tremor- Because we are in an
It has been brought to my earthquake belt it would be
notice that at least one expert has prudent for people living in Fiji to make themselvespredicted the chance of a serious
earthquake in Fiji as 140 years thoroughly familiar with the
one earthquake every 40 years information contained in this pamphlet
However with the exception of the earthquake and tidal waves in I wish to take This 1953 we are fortunate not to have opportunity to appeal for your suffered a more serious earthquake full co-operation in answeringthe questionnaire on earth-
They are probably the most quakes and tsunamis which terrifying and devastating phenomena appears on page nine of known to man this pamphlet as accurately
Unlike other natural disas- as possible
ters such as hurricanes and flood- The aim of the ing the tragedy of earthquakes is questionnaire is to locate that there is no forewarning of their and map the fault-line zones coming from which it is suspected
The very recent earthquake that most of our earthquakes in Hawaii is an obvious in- originatedisaster
dicator that the science of predicting The success and the earthquakes is still in the early efficiency of any kind of stages of development emergency relief system may
Although the recent occurrence depend on your co-operation in Hawaii might not rank among the in providing the informationworlds most serious earthquakes we sought- SNWqanivavalagi
orldssrios msteathqakes weMinister for Lands and Mineralknow from the experiences of other Resources countries that earthquakes can be totally devastating
However remote the possibishyity of a serious earthquake and
2
88
7 -
Part of the damage to the Suva Harbour reef caused by the 1953 earthquake
70 per cent from FIJI area About 70 per cent of the masonry landslides or drowning
worlds deep earthquakes are recorded in the tsunami from the Fiji area Most of them are Another earthquake with not felt because they occur at great an intensity of four to five was depths of about 400 to 600 kilometres ecperienced in Suva in 1961but (24845 to 37267 miles) beneath thecasdolmirdmget
surfac of te ebuildings
These types of earthquakes are not dangerous or damaging because of the depths at which they occur ButOtra they ore scientifically interesting
because they help geologists to deduce
the structure of the crust
The types of earthquakes which can be very damaging are those of large magnitude which occur in thebecase tey Todedueelp eolgist top 50 kilemetres (3106 miles) of the earths crust
The 1953 earthquake which hcd on epicentre (origin) 15 miles west of Suva was of this type That earth-quake had an intensity of seven out of a Mercalli scale of 12 and result-ed in a tsunami (tidal wave) which occurred 30 seconds after the quake and affectedoiSuva and davu About seven people were killed by falling
Several smaller shocks have been reported since then
w here re oftenearthquake fe arrtua aaso avun
fhlare laldes odrwi savu Taveuni and recentlythe WayA - Nadi - Lautoka area
Reports received after the 1953 earthquakes also show f l itle dmage incstes t that several very strong earthshyquakes have been felt in the
Fiji area since the early 1800s A o the
caused lthu d thse in tha the increasing density of popushyltion and buildings would make the area more prone to damage unless buildings are properly reinforced to withstand strong lateral motions from earthrukes
89 Quakes come In two main types
Volcanic earthquakes are asso-ciated with the movement of molten rocks underground usually at depths of less than 30 kilometre5 near active or inactive (at surface) volcanoes
These volcanic earthquakes are
often called tremors because they tend to occur frequently and almost continuously and are often associat-ed with possible forthcoming erupt-ions of volcanoes
Fortunately it has been over a million years since volcanoes erupted in most parts of Fiji al-though the most recent volcano was probably active less than 2000 years ago in the Taveuni area
Because of the long period of
time since previous eruptions vol-
canoes in most parts of Fiji can be or least inshyconsidered extinct at
active
The possibility of another
eruption occurring at some future time cannot be totally discounted
But it should be reassuring to note that with modern advances in instru-mentation it is becoming increasing-ly possible to predict the likeli-hood of impending volcanic activity
Tectonic earthquakes the other
major (and more common) type are due
to the movements of relatively solid parts of the earths crust against each other
Such motions c 3n be in the form of the swallowing of a large portion (or plate) of the crust into a trench area
For example the Eastern Pacific plate is postulated to be drifting westward at the rate of about 10 centimetres (roughly 394
inches) a year and is being swallowed or subducted under the Western Pacific plate in the Tonga trench area
The subduction of one plate under another causes friction between the plates and causes numerous earthquakes fortunately at great depthsshyabout 500 to 600 kilometres (31056 to 37267 miles)
Tectonic earthquakes occur also along fault lines which are zones of weakness in the earths crust usually at fairly shallow crustal depth
Geologists have mapped a number of fault areas in Fiji where it is apparent that one rock mass has been moved (or displaced) relative to an
adjacent rock mass through the release of stresses and strainsbrought about during the geoshylogca dvlp n the islands
Fortunately again most
of the faults which have been mapped are thought to be inshyactive
But there are some fault zones which could be active and it is quite likely that the strong 1953 earthquake was caused by fault movement offshyshore from the Kalokolevu shyso ara
The recent earthquakes felt in the Waya - Nadi -Lautoka area could be due to fault movements several miles offshore south-west of Waya
In 1976 the Mineral Reshysources Division intends to do
detailed mapping of these possibly active fault-zone areas near Suva and in the west of Waya
Other plans are for the division to make greater use of instruments and become inshyvalved in the recording of earthquakes
9
THE MAIN DANGERS Collapse of buildings due to
lack of reinforcement poor building materials (eg adobe type) or un-satisfactory foundations
Broken overJ ead power lines can
occur quite easily and are partishy
cularly dcnprous because many people have the inclination to run outdoors when they feel a strong earthquake
Landslides are possible alongLandlidsposibe aongofae fault zones or very wet areas pbrti-cularly where hillsides are steep
One person was killed in the Namosi area by landslides during the 1953 earthquake
Earth movements and chasms People naturally tend to have a very strong fear that the earth will open up and swallow them during an earth-quake However there is only one pro-perly documented case in recorded history of a person being crushed in a fissure Basically the danger of falling into chasms is minimal and the natural terroz of people from this is apparently the result of ex-
Fire can be one of the most dangerous effects of earthquake as evidenced by the disasters in Son Francisco in 1906 and Tokyo in 1923 Perhaps the worst problem from fires caused by earthquakes is that water pipes are often broken and firemen are forced to use less accessible alternative sources such as a river or the sea
Tsunamis are a particular kind
of sea wave which can build up follow-ing an earthquake In the past they have devastated cities and small settlements along the coasts of Chile Peru Alaska Hawaii Japan and other countries These waves travel across the Pacific Ocean at jet speed (more than 600 miles an hour)
In shallow wters t5unamis become a threat to life and property because they can reach up to miore than 100ft high at wave crest levels and strike with devastating force
5
We have no official record of any extensive tsunamis in Fiji except for the one caused by the 1953 earthquake which claimed some lives in Suva andKadavu
Other tsunamis are likely to have occurred in earlier times but were not identified especially as tsunamis becauseour lack of experience with them
The barrier reef round much of the islands helps to dissipate some of the wave
energy and therefore some ofthe dangers
But we should realise that we can still bevulnerable to waves especially from a southerly direction where our reef systems are less extensive
If a very strong earthshyquake is felt in Fiji you should prudently assume that it has originated within the Fiji group and is likely to have generated a tsunami
In the 1953 case the tsunami was about csft high when it hit the reef outside Suva within 10 seconds after the earthquake
A 6ft wave then travelled across the harbour and hit the waterfront about three to four minutes later causing only
slight damage and leaving many
But the tide was low at that time If it had been high tide the waves could have been about 9ft high and the effects could have been disastrous
Waves 5ft to 6ft high
also hit Lami Deubq Be--Island and Koro Island and a 15ft-high wave claimed two lives at Nakasaleka Kadavu Smaller waves were felt at Ovalauthe southern coast of Vanua Levu and in the western Lou Group
Precautons to take Because earthquakes occur
suddenly and without warning there ore only a few precouton5 people can take such as ensuring that houses are on firm foundations and are suitably reinforced to withstand earthquakes
The following modified version of on earthquake notice is reproduc-ed from a California Geology article published in October 1975
When an earthquake occurs For a minute or two the earth may pitch and roll like the deck of a ship The motion is frighteningbut unless it shakes something down on you it is probably harmless in itself Keep calm and ride 4t out Your chances of survival are good if you know how to act
During the shaking If indoors stay indoors Got under sturdy fur-niture such as a table Stay near the centre of a building and stay away from glass Do not use condles matches or other open flames
Do not run through or near buildings particularly concrete ones where there is danger of fall-ing debris If outside stay in the open away from buildings and power lines
If in a moving ccr stop but stay inside
After the r akinq Check your water and electricity
If water pipes are damaged or electric wires are shorting turn off at primary control point If in a low-lying coastal area which can be affected by tsunamis leave house and make for higher ground (see tsunami safety rules below) Turn on radio for emergency bulletins Stay out ofaamaged buildings- aftershocks can shake them down
In a 1961 study of earthquake risks in Fiji RHoutz estimated that the chance of a strong quake occurring here -was about 140 ie
6
once every 40 years This figure should be reassuring But one must remember that it is only an estimate -and that once in 40 years could be toshymorrow
Tsunami Safety Rules Tsunamis follow no disshy
cernible pattern of occurrence When you receive a tsunami warning you must assume that a dangerous wave is on its way
History shows that when the great waves finally strike they claim those who have ihed the wnin ve
ignored the warning The following tsunami
rules were extracted from a pamphlet prepared by the US Environmental Science Services Administration and they should be noted 1 An earthquake in your
area is a natural tsunami warnshying Do not stay in 1-yving coastal areas after a strong local earthquake
2 A tsunami is not a single wave but a series of waves Stay out of danger areas until on all-clear is issued by a competent authority
3 Approaching tsunamis are sometimes heralded by a noticeshyable rise or full of coastal water This is nature s tsunami
warning and should be heeded 4 A small tsunamiat one
beach can be a giant one a few bea a Do nt le the milesaway Do not let the modestse ofowve ma you lose reect for whut may follow
5 All tsunamis - like hurricanes -are potentially dangerous even though they may not damage every coastline they strike
6 Never go down to the beach to watch for a tsunami
92
yocn thetoo L see wave you are After 5Oft
too close to escape it
7 Sooner or later tsunamishit visit every coastline in the Pacific Warnings apply to yollif you live in Suva reef any Pacific coastal Olrea
8 During a tsunami emergency A section of the Suva Harbour reef your local emergency organisations forced upwards by the 1953 earthshywill try to save your life Give quake A tsunami -(tidalwave) 50ft them your fullest co-operation high hit the reef within 10 seconds
Unless otherwise determined by after the quake and sent a 6ft wavecompetent scientists potential to the shoreThis struckdanger areas are hose less than watershyfront about three to four Ainutes 50f above sea level and within one later and caused minor Cdamage but
mile of the coast for tsunamis of only because it was at low tide any origin
7
Measuring their size Earthquake magnitudes are
measured on very sensitive seismolo-
gical instruments Theseare often referred to as the Richter scale and the largest shock known to date had a magnitude of 89 on Richter scale (compared to 675 for the 1953 Suva earthquake on the same scale)
hat is in commonAnother scale use and depends on physical effects and observations is the modified Mercalli scale which is reproduced here It measures the intensity of earthquake and is graduated from one to 12 for measuring
Modifiedl Mercalli scale1956 versiont
Earthquake intensity
1 Not felt except by a very few under especially favourable (for
the arthuak)crcustanesamountsthe earthquakes) circumstances
2 Felt only by a few persons at rest especially on upper floors of buildings Delicately suspended objects may swing
3 Felt quite noticeably indoors especially on upper floors of build-ings but many people do not recog-nise it as c earthquake Standing motor cars muy rock slightly Vib-ration like passing truck Duration can be estimated
4 During the day felt indoors by many outdoors by few At night some awakened Dishes windowsdoors disturbed walls make creaking sound Sensation like heavy truck striking building Standing motor cars rocked noticeably
5 Felt by nearly everyone many
awakened Some dishes windowsetc broken a fewinstances of cracked plaster unstable objects overturned Disturbances of trees poles and other tall objects sometimes noticed Pendulum clocks may stop
6 Felt by all many frightened
and run outdoors Some heavy furni-
ture moved a few instances of fallen plaster or damaged chimneys Damage slight
8
7 Everybody runs outdoors Damage negligible in buildings of good design and construction slight to moderate in wellshybuilt ordinary structures considerable in poorly built or badly designed structures some chimneys broken Noticed
by persons driving motor cars
8 Damage slight in specialshyly designed structures conshysiderable in ordinary substantshyial buildings with partial collapse great in poorly built structures Panel walls thrown out of frame strucTures Fall
f fameystrctresasof chimneyq factory stcks
columns monuments walls Eeavy furniture overturned Savy fniur e -turned
Sand and mud ejected in small Changes in well water
Disturbs persons driving motor
cars 9 Damage considerable in
specially designed structures well-designed frame structures
thrown out of plumb great in substantial buildings with partial collapse Buildings shifted off foundations Ground cracked conspicuously Undershyground pipes broken
10 Some well-builtwooden
structures destroyed most masonry and frame structures destroyed with foundations ground badly cracked Rails bent Landslides considerable from river banks and steep slopes Shifted sand and mud Water splashed over banks
11 Few if any (masonry) Ltructures remain standing Bridges destroyed Broad fissures in ground Underground pipelines completely out of service Earth slumps and land
slips in soft ground Rails bent greatly
12 Damage total Waves seen on ground surfaces Lines of sight and level distorted Objects thrown upward into the air
FILL THIS IN TO HELP THE EARTHQUAKE STUDY
To enable an improved study of shallow local earthquakes the coshyoperation of the public is required in filling out the following questionshynaire whenever an earthquake is felt Many earthquakes are very small and sometimes are not recorded on seismological instruments This questionnaire system will enable the Mineral Resources Division to better determine the location of earthquake zones which can then be mapped in detail
EARTHQUAKE QUESTIONNAIRE
1 An earthquake was felt on at am or pm
Place
2 What direction did the shock come from
o ooo mge oe e o o o o
3 How many seconds did the quake last
4 Was the shaking rapid or slow
5 Where were you when the earthquake occurred
6 Were you awake asleep or awakened
7 Were you walking working standing sitting or lying down
8 Did the people around you feel the earthquake too
9 Did people run outside
10 Did cracks occur in the buildings you were in
11 Was the building damaged in any otherway
o
12 What is the building made of
13 Did the windows doors dishes rattle
14 Did hanging objects doors etc swing 0000000000600
Turn to next page 9
95 15 Did vases small objects furniture overturn
e
16 Did things fall off shelves
17 Did you notice any unusual waves in the sea after the quake 00 0a -0 0 000aV0a0a0 000000a000 00
18 1f so h6w soonafterwards 0 BO
e a 0000000amp000000000amp0000 a a
What were the waves like 00000619
20 Did anything else unusual happen
0 o a o e e o o 0o e o e e eo o eo 6 o e e e oIe e e o o o adegdeg e odegI e o o oo oo oe 1 8 aampv a
21o Any other remarks e
N me a
Complete formtear out this whole page and mail to
The Director of Mineral Development Mineral Resources Division Private Bag GPO SUVA
This special booklet is published by the Ministry of Information at Government Buildings in Suva for the Ministry of Lands and Mineral Resources
(JANUARY 1976)
10
96
In the wake of the 1953 quake
1M
Crack in the coral
A -rac) in the main Suva reef after the earthquake and tidal wave in 1953
12
T SANERIVE Government Printer Suva Fiji
98
APPENDIX IV SEISMOLOGICAL FACILITIES AND EARTHQUAKE HAZARD PROGRAMS IN THE SOUTHWEST PACIFIC
As part of our program of field investigations in Fiji Tonga andVanuatu our researcher was able to visit the neighboring island countries of the Southwest Pacific region During these visits he was able to meetwith scientists and public officials involved with the earthquake hazard problem facing each country In every case the governments are aware ofand have taken some action to mitigate the potential losses due to destrucshytive earthquakes but these governmental responses have varied widely fromcountry to country This report focusses on the seismological institutionsand facilities in each of the countries and their capablities in assessingand planning for carthquake hazards In the following sections we conshysider each of the island countries of this area which face a severe earthshyquake risk Fiji Tonga Vanuatu Western Samoa Solomon Islands PapuaNew Guinea and New Zealand
FIJI
Seismological Facilities
Seismological observations in Fiji are conducted by the Mineral Resources Department a subdivision of the Ministry of Energy and MineralResourcs The government has made a major commitment to seismologicalwork since the establishment of the AID-supported seismic network in 1979In fact seismological observations in Fiji have been carried out since theearly part of this century supported at first by the New Zealand scienshytific organizations and subsequently strengthened by Lamont GeologicalObservatorys Upper Mantle Project in the 1950s and 1960s In late 1979the 8 -station US AID network was established to complement three permanent stations in Viti Levu The network was significantly expanded byinstallation of a five-station telemetered network in 1981 supported byJapanese aid (Figure Al) Additional stations were installed in 1983 and 1984 the network has now expanded to an eighteen-station national networkwith excellent coverage of the Fiji region In addition MRD now has available five MEQ-800 portable seismographs for occupation of temporaryfield sites telemetered station testing and special refraction experiments While the Fiji network has experienced considerable technical difficulties it has recorded over 2000 earthquakes since its installationand provides an invaluable basis for seismological study of the Fiji region
Strong Motion Accelerographs
The Mineral Resources Department also operates a network of strongmotion accelerographs now numbering ten Kinemetrics SMA-ls (Figure A2)The initial six instruments of this network were granted to Fiji by AIDthe remainder were purchased by the Fiji government Since establishment of the SMA network three accelerogram records have been obtained from moderate-sized earthquakes in Viti Levu Records obtained from thisnetwork are expected in the long run to provide the basis for predicting
tTT Illt EAST OF +NWICH IS0 WEST OF GREENWICH III
Y 7sdeg NATIONAL NETWORK OF SEISMOGRAPHIC STATIONS 1982
AC7
DEELLAAIKOORROOMTRE
23O~~~~ ROTUMU
YASAWAIRAR C1
00
A0 KORO
-W
0
I VUNH SOUTHRIOGE A
~)AVALAU 0
NADI A A ONASAVULAU
MAGOORO A VUNIOAWALAU
VIT LE U _LAKEPe NAMOSI AUNIAA -GAJ
ALOAA0A NAMORO SUVA
VITICLEVU
13 BEOA
LEGEND A E-isting Station
I RAKRAKI A Proposed Station Toloyo
Motulu Fuloo amp
EAST OF GREENWoICH ISO WEST Of GREENWICH ITS
Figure Al Network of seismic stations in Fiji established through the assistance of US AID and Japanese aid programs
_ _ _1_ Q__
NATIOqAL NETWORK OF EAST
STRONG OF OEEwICH
MOTION IO WEST 0 OREV-1CM
ACCELEROGRAPHS 79
LEGEND
A Accelerograph
0 30 60 KLOLETRES
LBS
YASAWA
lt ---shyVANUA LEVU U
T EUW r
S|bullKORO 0
T
V2anua bala~u
N
0
LA IV)DI A MON~ASAVU V
9LAU
VITI LEVU OKA1)
(4)
GAU
LAKE1A
0 11-
Kld
A S T O r
Maluku
GREN Wa
Toloyc
I 0 W E S T O f C REEM CN I
Figure 2A Location of strong-motion accelerographs in Fiji
100
ground accelerations and thus for development of building codes specific to Fijis tectonic setting
Related Scientific Programs
The Mineral Resources Department includes an Offshore Geology sectionwhich has an active program of marine geological and geophysicalinvestigations in and around Fiji waters MRD also employs an engineeringgeologist whose work includes microzonation of the Suva area mapping ofactive faults in southeastern Viti Levu and investigation of soils subjectto earthquake-induced liquefaction An active program of geologicalmapping and structural studies is also carried out by MRD They aresupported by personncl assistance from Australia and Great Britain
Suva is also the home of the United Nations Committee for Coordinationof Offshore Prospecting in South Pacific Offshore Areas (CCOPSOPAC) Thisorganization coordinates much of the international marine research carried on in the region and has been particularly helpful with Fijisinvestigation of its offshore waters
Critical Facilities
The major development in Fiji has been in and around the capital cityof Suva The population of the metropolitan area now exceeds 130000 and most of the government commercial and industrial operations are concentrated there The city has become a major commercialtransportation and regional political center and has developed rapidly inthe past ten years Development in this period has included constructionof multistory buildings a major electric power plant expansion of theSuva harbor and most recently completion of the thirteen-story CentralMonetary Authority building in downtown Suva Much of this development hastaken place on an area of filled land close to sea level particularlyvulnerable to earthquake and tsunami damage This area was extensivelydamaged by the 1953 Suva earthquake and tsunami and is thus at significantrisk from a repeat occurrence of an event of comparable size
Other population centers with significant development include thetowns of Lautoka (pop 29000) Nadi (13000) and Ba (9000) on the islandof Viti Levu and Labasa (13000) on Vanua Levu The tourist industrywhich is a major part of Fijis economy is concentrated on the southernand western coasts of Viti Levu and is also vulnerable to earthquake andtsunami damage The major development project in Fiji is the 87-meter highMonasavu Dam in the interior of Viti Levu The earthfill dam was completedin 1983 and is planned to provide most of the countrys electric powerneeds through the end of the century
Earthquake Preparedness Programs
In awareness of the serious earthquake risk to development in Fijithe government has adopted New Zealand earthquake design codes for most ofthe urban areas of the country Seismic zone B codes applicable to areas of moderate seismic activity in New Zealand have been chosen asappropriate and are applied (in theory at least) to all domestic andcommercial construction in urban areas Considerable difficulty remains in
101
enforcement of these regulations particularly in construction of privatedwellings Major multistory building design is generally handled by overseas (Australia or New Zealand) engineers and dynamic modelling tests are generally applied for earthquake loadings at least as large as those required by the New Zealand codes The Monasavu Dam underwent dyiamictesting by Australian consulting engineers
Disaster preparedness is the responsibility of the Emergency Services Committee (EMSEC) and the Prime Ministers Relief and Rehabilitation Committee (PMRRC) EMSEC is responsible for coordination of disaster plans maintenance of essential services advice to the Cabinet on emergency measures and direction of relief work It is comprised of representativer of the related ministries and public agencies PMRRC is chaired by the Prime Minister of Fiji and has responsibility for long-termrelief policy and rehabilitation programs Fijis experience with recurrent weather-related disasters has spurred efforts for emergencycommunication systems supply distribution temporary shelters and so on Much of this hurricane disaster planning is applicable as well to earthquake and tsunami damage Fiji is also a participant in the International Tsunami Warning System
Educational programs have been handled through the Fiji BroadcastingSystem the Red Cross and the school sysem To a limited dgree the Public Works Department and the Mineral Resources Department have producededucational materials related to earthquake hazards in Fiji
TONGA
Seismological Facilities
Seismological observations in Tonga are the responsibility of the Ministry of Lands Surveys and Natural Resources Due to fiscal constraiits however these efforts have in the past been entirelydependent on foreign assistance Seismological experiments began in Tongain the mid-1960s with Lamont-Dohertys Upper Mantle Project Seismic stations were operated by Lamont-Doherty and subsequently by Cornell scientists through the early 1970s when operations were suspended In late 1983 as part of the present AID-supported seismic hazard programCornell reinstalled a three-component short-period seismograph in the capital Nukualofa The seismograph was installed upon the request of the government geologist to be operated by the Tongan government with technical assistance from Cornell Unfortunately after operation of the seismograph for eight months Tongas Cabinet decided that the drain on its resources and personnel was excessive and the instruments were disconnected in May 1984 with the components transferred to Fiji and Vanuatu where they can be utilized There are presently no plans to reinstall permanent seismographs in Tonga
Strong Motion Acceierographs
Two strong-motion accelerographs provided by the AID seismic hazard program are presently operating in Tonga one in Nukualofa and one in the northern Vavau Islands They have been in operation for one year and
102
have not to date recorded any large earthquakes They require a minimum of maintenance and their operation will continue to be supervised by the government geologists with assistance from Cornell A third accelerograph may be made available to tonga by the British Geological Survey and could bB installed on Eua Island in a zone of high activity close to the Tonga Trench Related Research Programs
The Ministry of Lands Surveys and Natural Resources employs a singlegovernment geologist whose responsibilities include coordination of oil prospecting geolcgical mapping of the islands and assessment of earthquakeand tsunami hazards There has been considerable scientific study of the Tonga Trench subduction zone by research groups from the United StatesJapan New Zealand Australia Germany and the Soviet Union More detailed marine geophysical data have been collected near Tongatapu Island byAmerican petroleum exploration groups
Critical Facilities
The capital city of Nukualofa has a population of only 20000 butdoes include several three- and four-story buildings The larger buildingshave in general been designed by foreign engineers and have included earthquake- resistant design specifications Other significantdevelopment projects include the expansion of the government wharf in Nukualofa and development of tourist resorts on Tongatapu and several of the outer islands
Earthquake Preparedness Programs
There are no building codes presently enforced in Tonga Howeverconstruction of public buildings must be approvei by the Ministries of Works and Health The largest office buildings and hotels are designed byoverseas engineering firms and generally include some earthquake loadingcriteria The Land and Environment Act currently under consideration bythe Tongan government would require review of all development projects bythe government planner application of building codes largely adapted from New Zealand codes is expected to follow
Disaster preparedness programs are the responsibility of the Cabinets National Disaster Committee including representatives from the related government ministries and departments Subcommittees focus on disaster preparedness action planning and long-term relief and rehabilitation There is no earthquake education program in Tonga
WESTERN SAMOA
Seismological Facilities
One of the earliest seismic stations in the Pacific was established atthe Apia Observatory in 1902 during the German colonial period through the University of Gbttingen In 1921 control of the observatory was transferred to the New Zealand Government Weichert seismographs were
103
operated continuously at Apia through 1957 when they were replaced by Benioff instruments at Afiamalu and by short-period Wood-Anderson instruments at Apia Since Samoan independence in 1963 the Observatory has been operated jointly by the Samoan Government and the Department of Scientific and Industrial Research (DSIR) New Zealand In 1963 a Worldwide Standard Seismograph Station was established at Afiamalu Operation of this six-component station is supported by the US Geological Survey In 1980 the station was upgraded to allow digital reccrding equipment was added to upgrade the station to the status of a Global Digital Seismic Network station Seismic records are sent to DSIR in Wellington for permanent storage
Strong Motion AccelerograDhs
A simple strong motion instrument has been operating in Apia since 1979 It is an event-triggered low-gain seismograph recording on an ink-stylus recorder At the time of our visit to Western Samoa the instrument had been out of service for several months Only one event has to date triggered the instrument
Related Scientific Programs
The Apia Observatory has also made continuous magnetic field measurements since 1905 Measurements are currently made using a Schultze earth inductor an Askania declinometer and a proton magnetometer The observatory maintains two tide guages as part of the Pacific Tsunami Warning System Offshore resource studies have been carried out through CCOPSOPAC and by various international research groups Much of the reconnaissance geological work in Western Samoa has been carried out by DSIR in New Zealand
Critical Facilities
Like many of the other island countries of the Pacific Western Samoas development has been concentrated around the capital Apia (pop 34000) A major deep-water harbor and the countrys tourist industry are based in Apia Several multistory buildings have been erected in Apia in the past several years A hydroelectric dam on Upolu Island was completed in 1978
Earthquake Preparedness Programs
There is presently no disaster plan in effect in Western Samoa The various agencies involved with emergency action are coordinated through the Police Commissioner New Zealand seismic zone B codes are applied to construction in Western Samoa Enforcement is handled by the Public Works Department Modest educational materials have been prepared by the Apia Observatory staff in English and Samoan for distribution through schools and public agencies
104
SOLOMON ISLANDS
Seismological Facilities
Seismological Observatories in the Solomon Islands are conducted bythe Ministry of Lands Energy and Natural Resources They have operated aWorldwide Standard Seismic Station in Honiara since 1962 operation of the station is supported by funds from the US Geological Survey The station was augmented by two short-period telemetered seismic stations in 1982 This three-station necwork was provided through the British GeologicalSurvey with the aim o identifying volcanic earthquakes associated with theactive volcano Savo located close to the capital
In awareness of the high volcanic risk to population centers in theSolomon Islands the Ministry has drawn up plans for two three-station telemetered arrays to be deployed around the active volcanoes on Simbo Island (New Georgia Group) and on Tinakula Island (Santa Cruz Group) Theyare presently seekirg foreign aid in the form of seismic instrumentation and technical asistance to establish the network
The Ministry also has responsibility for field surveys following majorearthquakes in the Solomon islands Studies of ground deformation and cultural effects of the large 1977 and 1984 earthquakes were made by seismology officers
Strong Motion Accelerographs
Two strong motion accelerogaphs were installed on Guadalcanal by theMinistry in late 1984 They will be responsible for maintaining the instruments but have requested Cornells assistance in analyzingaccelerograms obtained during their operation The high level of shallow activity near Guadalcanal suggests that a significant number of strong-motion records will be obtained during the lifetime of the instruments
Related Scientific Programs
The Ministry also carries out related research programs in regionalgeology minerals assessment groundwater studies and so on Extensive marine surveys have been caried out in the Solomon Islands by the USGeological Surveys Resource Assessment Program Local offshore surveyshave been carried out through CCOPSOPAC A tide gauge is maintained bythe Solomon Islands Hydrographic Unit Six proton-precession magnetometers are operated in the Solomon Islands by the Queensland University (Australia)
Critical Facilities
Over 90 of the Solomon Islands population remains in rural areas The major development is in Honiara the administrative and commercial center of the country Honiara (pop 15000) is the major shipping center of the country and now includes several multistory buildings
105
Earthquake Preparedness Programs
The Solomon Islands implemented a National Disaster Plan in 1980 subsequently revised in 1982 The Plan gives the Ministry for Home Affairs and National Development overall responsibility for coord~lation of efforts in earthquake volcanic and tsunami disasters Operational relief effort are carried out through the Disaster Operations Coordinator and the Provincial governments
The government has adopted the most stringent earthquake building code (Zone A) from New Zealand for multistory building construction in Honiara Implementation of these guidelines continues to be a problem One multistory building in Honiara (Australian High Commission Building) was severely damaged during the 1984 earthquake Some efforts have been made to develop small-scale earthquake-resistant building techniques appropriatefor rural areas The Pacific Islands Development Program organized a model house construction and workshop during early 1984 A modest outreach program has developed through the school system adult education programs and the government broadcasting company
PAPUA NEW GUINEA Seismological Facilities
The government of Papua New Guinea has made an extensive commitment to earthquake and volcanic hazard mitigation through construction of a national network of seismographs and accelerographs (Figure A3) A ten-station national network of seismographs is monitored by the Port Moresby Geophysical Observatory (Department of Minerals and Energy) Three of the remote stations are telemetered to Port Moresby via microwave links four stations operate as permanent field stations and two are operated at temporary sites on outlying islands Port Moresby is presently the site of a Worldwide Standard Seismic Station that has operated since 1958 The national network reports arrival times to the US Geological SurveysPreliminary Determination of Epicenters and the International Seismological Centre but does not routinely locate events independently
In addition to the national seismic network the Rabaul VolcanologicalObservatory operates seven seismic stations near active volcanoes around the country and a nine-station telemetry network around the Rabaul Caldera Bougainville Copper Limited opeates a 5-station network on Bougainville Island (North Solomons Province)
Strong Motion Accelerographs
The Port Moresby Geophysical Observatory maintains a national network of thirteen strong motion accelerographs distributed in the highly seismic areas of the country (Figure A3) This includes a closely spacedfour-station network around the Rabaul Caldera A single strong motion accelerograph is situated on Bougainville Island and is maintained byBougainville Copper Limited The network uses Kinemetrics SMA-I and New Zealand DSIR MO-2 instruments and has recorded tens of accelerograms since its establishment in 1967 The Observatory ispresently trying to to establish an engineering seismologist position to analyze the accumulating data and to further upgrade the accelerograph network
I I I I I I I I I I
Re--o -joso shy
Mooo u J4D (Ro-js
bull~~vASeA saxA+ Samp-cUong sloon
(twu lueoaott koRowq (KvG) jjj ccurodAj a~OlF
Accv~tj (8~Cli
Raboul (PART 2bLo(MOG) C GoTo and -4-A Duke of Tok
vie W~~IiTUI = a
Rogno SGA Kowumbukae0
lebub-gn ITPAc l-O MARCH agno BGAI
Tank ( F -goono PAAl
Coo Glooclslb Island I OSOGRAP SEISM A-D ACCELEOGR -
_____ L I IS IIsI I I
IPUGI
PAPUA NeW GUI NEeAr rp n w k
hTTWORKS MARCH 1384
IG -nol 1v
Figure A3 Papua New Guinea seismograph and accelerograph networks a
107-108
Related Scientific Activities
In addition to the Geophysical Observatory the Department of Mineralsand Energy includes the Geological Survey of Papua New Guinea The Surveyundertakes a wide range of geological investigations including regionalgeological mapping petroleum and mineral exploration engineering andenvironmental geology and energy resource development Offshore surveyshave been carried out through CCOPSOPAC as well as American and Austrrlianresearch vessels Continuous monitoring of the magnetic field is carriedout by the University of Queensland (Australia) Ten tiltmeters have beendeployed by the Volcanological Observatory to monitor ground deformation near Papua New Guineas active volcanoes Four of these instruments are deployed around Rabaul Caldera
Critical Facilities
Papua New Guinea is the most developed of the island countries of theSouthwest Pacific with a population of over 3000000 and extensive urbandevelopment The capital city of Port Moresby has a population of over 130000 with major multistory construction in the downtown area a majordeep water harbor and significant commercial and industrial activity in thePort Moresby area There is significant development as well in the smaller towns of Rabaul Lae Madang Wewak Goroka Mount Hagen Wau BuloloDaru and Kerema Major hydroelectric schemes have been established on theRamu and Rouna rivers with additional hydroelectric plans at various stages of evaluation and development Extensive mineral development hastaken place in the North Solomons Morobe and Western provinces of PapuaNew Guinea Extensive natural gas and limited oil deposits have beenlocated these may become commercially exploited in the near future
Earthquake Preparedness Programs
Papua New Guinea has a long history of earthquake and volcano-relateddisasters A national disaster program was established in 1981 and provides for a National Disaster Emergency Committee which formulates emergency government policy and a Disaster Civil Defence Committee which is responsible for implementation of short-term relief efforts Theprovincial governments are given major responsibility for initial coordination and assessment of disasters assistance is subsequentlyrequested from the federal government for major disasters Many of theprovincial governments have not revised preparedness plans since thecolonial period However particularly intense effort has been directed inEast New Britain province because of the imminence of a potentiallydestructive volcanic eruption in Rabaul Caldera
The town of Rabaul (pop 15000) is a major commercial center forPapua New Guinea and is situated directly within the caldera of an activevolcano A relatively small eruption took place at a secondary eruptivecenter near Rabaul in 1937 killing over five hundred nearby residents andforcing the evacuation of the town In order to avoid a repeat of such adisaster the government established the Volcanological Observatory withfour full-time volcanologists and real-time earthquake location andanalysis of tilt data A drastic increase in volcanic seismicity in mid-1983 led to a volcanic hazard alert and intensification ofseismological and ground deformation studies around Rabaul In addition
109
the alert allowed the provincial and national Disaster Emergency Committees to make extensive evacuation and relief plans for a possible eruption at Rabaul including preparation of a new airstrip improvement of roads and emergency water supplies communications systems detailed evacuation plans education programs and so on To date there has been remarkable cooperation of efforts by provincial national and overseas officials to mitigate the potentially devastating effects of a volcanic eruption at Rabaul
Papua New Guinea is the only country of the developing nations of the Southwest Pacific to have devised its own seismic zoning system (Figure A4)
The Nationwide Housing Code for Papua New Guinea sets up a four-level system of seismic loading oriented toward moderate-sized (to 8 stories)buildings Major buildings require independent dynamic analysis usuallycarried out by overseas engineering firms Seismic Zone 1 of the HousingCode is among the most stringent earthquake loading codes in the world and includes the town of Rabaul and much of the East New Britain and North Solomons provinces Seismic zone 2 includes the towns of Lae Wewak and Madang and is approximately equivalent to New Zealand Zone A or California loading designs The capital Port Moresby is in the lowest seismic zone (4) but buildings constructed there still require designsallowing for significant lateral loadings
Earthquake education is handled through the National Radio Government Printing Office the Civil Defence Department and the school system with information supplied by the Geophysical and Volcanological Observatories A particularly intense education effort has been mounted in Rabaul where educational materials have been produced and distributed in three languages and public involvement in preparedness plans has been emphasized
NEW ZEALAND
While New Zealand cannot be considered one of the developing countries of the Southwest Pacific its seismology programs have been responsible for much of the observational data available for the entire region Because of its importance to the other national seismology programs we briefly review here the New Zealands observational facilities Its extensive programs in engineering seismology its critical facilities and its earthquake preparedness programs will not be covered here
National Seismic Network
Seismological facilities in New Zealand are maintained by the Geophysics Division of the Department of Scientific and Industrial Research (DSIR) in Wellington The natioal standard seismograph network presentlyconsisting of thirty short-period stations is shown in Figure A5 The network routinely locates all earthquakes of ML gt 38 within New Zealandand earthquakes with Ms gt 50 for the region within 100 of New Zealand Arrival time data are routinely transmitted to the US Geological Surveyand the International Seismological Centre The events located by the network are reported in the annual New Zealand Seismological ReportSeveral hundred earthquakes are located by the DSIR national network each year
0 - - - --- - - - -
FIG 13
1SEISMIC ZONES FOR BUILDING CONSTRUCTION
- -- IN PAPUA NEW GUINEA
i 1d - - - - - _
(I -lt 53-0Fef cs r i eat a 1 982))j --_ _ -- r L - - --- a a V bull
N i - O(r-tIbd t
__ __ Po --shy
-- -- -
[i ~5- E I
Is-O I ___ oh - - --- - --shy-- shy
4 __J ft - - I- S 4 E jshy
_ _ _-i - _ j -z -
_____ _U 511
ZONE CLASSIFICATION OF CITIES I lZONE 30 1 I 3 1 153--ZONE3 4u shyW-t -~- 6--v 4- bull -
I == 1 --by- Ll _
Figure A4 Seismic zones for building construction in Papua New Guinea (jury et al 1982)
CAPE REINGA
ONERAHI
GREAT BARRIER AUCKLAND - C
5OCT 1914 WHITE ISLAND
KARAPIO EAST CAPE 0r WHAKATANE 15 WAIRKEIp I TUI 28 JUN 1921 t SEP19_-
CHATEAU TARADALE N U 2 FEB 19317 1897 1a Ju DEC 84
MANGAHAO 5 MAR 934 8 AUG 1904 - CASTLEPOINT ( A 1942
COs ELLINGTON IS5CT 18408 2C18BJN562 JAN 1855 23 MAY 1989
Figure A5 Seismograph stations of the national network (left) and the distribution of large shallow earthquakes (right) in New Zealand From Seismological Observatory Wellington (1980)
112
The network is augmented by long-period instruments operating atKaropiro Roxburgh and Wellington DSIR also operates a three-componentborehole seismometer in Wellington as part of the Seismic Research Obseervatory network supported by the US Geological Survey
Stations in Outlying Territories
New Zealand has also taken an important lead in operating seismographstations in outlying areas of the Southwest Pacific These stations havebeen extremely important in hypocentral control for the Tonga - Kermadec seismic zone and for nuclear event detection in the Pacific DSIR operates three 6 -component Worldwide Standard Seismograph stations at Afiamalu (Western Samoa) Raratonga (Cook Islands) and Scott Base (Antarctica) Short-period stations operate at Apia (Western Samoa)Campbell Island (New Zealand) Chatham Islands (New Zealand) Nadi (Fiji)Nime and Raoul Island (Kermadec Island New Zealand) Readings from these stations are routinely reported to PDE and ISC for global earthquake location
Wellington Network
A small-aperture high-gain seismic network is operated around Wellington an area of greatest seismic risk in New Zealand The stations are telemetered by radio or telephone link to the central recording site The network now consists of eleven stations Earthquakes are presentlydetected by a microprocessor-based Automatic Seismic Monitor and automated location processing is expected to follow The network routinely locates events with ML gt 15
Pukaki Network
A second microearthquake network has operated around Lake Pukaki ahydroelectric project in the South Island New Zealand The network wasestablished in 1975 to monitor reservoir-induced seismicity associated with impoundment of the reservoir The network consisted of nine stationsand was intended to operate on a temporary basis It has been closed since early 1984 with several of the stations continuing to support the national network and to monitor any future reservoir-related activity
Related Seismology Research
In addition to its regular observatory seismology the GeophysicsDivision has an active seismology research program Their studies have focussed on theoretical seismology earthquake prediction crustal structure of New Zealand historical earthquake studies nuclear eventdetection seismic risk in New Zealand strong motion studies and volcanic seismology The monitoring of active volcanoes is closely coordinated withcrustal deformation monitoring conducted by the Earth Deformation Section of the New Zealand Geological Survey
The New Zealand strong motion accelerograph network now consists of225 instruments operated by the Physics and Engineering Laboratory of DSIR Most of these instruments are of a New Zealand design (Mechanicaland Optical Accelerographs) and analog records are made on photographicfilm Three digitally recording accelexographs are now in operation in New
113
Zealand and the MO records are digitized for computational analysisAnalysis of this empirical data is being used for a revision of New Zealands building codes
114
REFERENCES
Berryman K 1979 Seismotectonic zoning study of the Fiji IslandsEarth Deformation Section Report 70 Wellington NZ Dept Sci and Indust Research 40 pp
Franco AB MP Hamnett and J Makasiale 1982 Disaster Preparednessand Disaster Experience in the South Pacific Pacific Islands Developshymental Program Honolulu 380 pp
Geological Survey of Papua New Guinea 1979 Information Booklet Port Moresby Dept Minerals and Energy 12 pp
Government of Western Samoa 1977 Apia Observatory 1902-1977 ApiaApia Observatory 8 pp
Jury RD JP Hollings and IAN Fraser 1982 The development ofseismic zones and the evaluation of lateral loadings for earthquakeresistant design of buildings in Papua New Guinea Bull NZ Nat Soc for Earthq Engr 5 123-140
Lowenstein PL 1982 Problems of volcanic hazards in Papua New GuineaGeol Surv Papua New Guinea Rept 827 Port Moresby Papua New Guinea 62 pp
McCue KF and ID Ripper 1980 The Papua New Guinea Strong MotionAccelerograph Network Geol Surv Papua New Guinea Rept 807 Port Moresby Papua New Guinea 13 pp
Mineral Resources Department Seismology Section 1983 National activityreport Fiji Submitted to Session IX Intl Coord Group for TsunamiWarning System in the Pacific Min Resources Dept Fiji Note 333Suva Fiji 4 pp
Parliament of Fiji 1984 Mineral Resources Department Annual Report forthe Year 1982 Parliam Paper No 13 Suva Fiji 90 pp
Power CA 1978 Earthquake risk in Fiji and the problems of earthquakeengineering Presented to the Fiji Society 17 pp
Prevot R and JL Chatelaiu 1983 Seismicity and Seismic Hazard in Vanuatu ORSTOM Rept 5-F3 Noumda 51 pp
Ripper ID 1982 Accelerogram library Geol Surv Papua New Guinea Rept 198211 Port Moresby Papua New Guinea 44 pp
Seismological Observatory Wellington 1980 The earthquake problem in NewZealand Alpha DSIR Extension Information Wellington NZ 4 pp
Smith WD 1979 Seismology and related research in New Zealand1975-1978 NZ DSIR Information Series No 140 30 pp
115
Smith WD 1983 Seismology and related research in New Zealand 1979-1982 Seismol Observatory Wellington Bull 276 32 pp
Solomon Islands Government 1982 National Disaster Plan 1982 Honiara Solomon Is 14 pp
116
A Rahimin A Simpson R Holmes P Rodda R Singh I Everingham K Draunidalo G Shorten M Mehrotra J Booth J Campbell
R Carter R Byrne G Gauss D Rubin
S Tongilava
D Tappin S Lemoto T Tukia
C Clarke
R Campillo R Foy T Lee J Rdcy J Chatelain R Prdvot
L ioane S losa A Titimaea
S Danitofea
D Tuni R Walshaw J Vunagi D Gwyun
INFORMATION CONTACTS
FIJI
Director Mineral Resources Dept Asst Director (MRD) Princ Geol OffshoreSeismol (MRD) Princ Geol Inform Services (MRD) Principle Geophysicist Senior Seismologist (MRD) Seismologist (MRD) Senior Engineering Geoogist (MRD) Struc Engr Suva City Council Civil Engineer Suva Engineering Geologist A Gibb amp Partners (Monasavu) Marine Geologist (CCOPSOPAC) Marine Geologist (CCOPSOPAC) Marine Geologist (CCOPSOPAC) Marine Geologist (CCOPSOPAC)
TONGA
Superintendent of Lands Surveys and Natural Resources Government Geologist (LSNR) Land Assessor (LSNR) Government Planner (LSNR)
VANUATU
Director Dept Mines Geology and Rural Water Supplies Director ORSTOM Mission Engineer ORSTOM Civil Engineer Public Works Dept Director ORSTOM Dept Geol and Geophys (Noumda) Seismologist ORSTOM (Nouma) Seismologist ORSTOM Nouma)
WESTERN SAMOA
Director Apia Observatory Senior Seismologist (AO) Geologist (AO)
SOLOMON ISLANDS
Chief Geologist Ministry of Lands Energy and Natural Resources
Senior Seismologist (MLENR) Senior Geologist (MLENR) Ministry of Home Affairs and National Development Civil Engineer Public Works Department
117
PAPUA NEW GUINEA
K Doble Chief Geologist Geological Survey I Ripper Chief Seismologist Geophysical Observatory G Seidel Information Officer Volcanological Observatory G Anderson Engineering Geologist Geological Survey J Wilkins Civil Engineer Dept of Works and Supply
NEW ZEALAND
W Smith Director Seismological Observatory Wellington
UNITED STATES
M Hamnett Pacific Islands Development Program G Burton Director Pacific Tsunami Warning Center R Sillcox Seismologist (PTWC) G Pararis-Corayannis Director International Tsunami Information Center
118
APPENDIX V TSUNAMI SAFETY RULES
1 All earthquakes do not cause tsunamis but many do When you hearthat an earthquake has occurred stand by for a tsunami emergency
2 An earthquake in your area is a natural tsunami warning Do not stayin low-lying coastal areas after a local earthquake
3 A tsunami is not a single wave but a series of waves Stay out ofdanger areas until an all-clear is issued by competent authority
4 Approaching tsunamis are sometimes heralded by a noticeable rise orfall of coastal water This is natures tsunami warning and should be heeded
5 A small tsunami at one beach can be a giant a few miles away Dontlet the modest size of one make you lose respect for all
6 The Tsunami Warning System does not issue false alarms When anocean-wide warning is issued a tsunami exists When a regionalwarning is issued a tsunami probably exists The tsunami of May 1960killed 61 people in Hilo Hawaii who thought it was just another false alarm
7 All tsunamis--like hurricanes--are potentially dangerous even thoughthey may not damage every coastline they strike
8 Never go down to the beach to watch for a tsunami When you can seethe wave you are too close to escape it
9 Sooner or later tsunamis visit every coastline in the PacificWarnings apply to you if you live in any Pacific coastal area
10 During a tsunami emergency your local Civil Defense police andother emergency organizations will try to save your life Give them your fullest cooperation
Unless otherwise determined by competent scientists potential danger areasare those less than 50 feet above sea level and within 1 mile of the coastfor tsunamis of distant origin or less than 100 feet above sea level andwithin 1 mile of the coast for tsunamis of local origin
3
by major lateral variations on both the upper and lower plates (Isacks et
al 1981 Chatelain et al in press)
Although Vanuatu is not heavily populated or industrialized its
proximity to a seismic zone leaves it particularly vulnerable to the risk
of earthquake damage Most of the damaging earthquakes come from the
inter-late zone beneath and trenchward of the islands although back-arc
and intermediate depth earthquakes are also felt The capital city of Port
Vila is now uder increasing development pressures The construction of
multi-storied buildings to accommodate the increasing urban populations and
tourism as well as other essential structures such as dams and power
plants pipelines schools and hospitals adds to the immediacy of the
problem of earthquake risk
Past disaster associated loss of life in the Republic of Vanuatu
resulting from earthquake hazard has been relatively limited but the
increasing urban concentration and industrial development raises the
potential human and economic losses brought on by a large earthquake
occurring in the immediate vicinity These losses are usually the result of
the collapse of man-made structures and can be substantially reduced by
adequate engineering precautions To date more deaths in Vanuatu have been
caused by cyclones than by earthquakes although material damage has been
fairly severe from shaking landslides or tsunamis produced by earthquakes
TECTONICS AND GEOLOGY
Plate Tectonic Setting
The Republic of Vanuatu lies along a portion of what is commonly
called the Pacific Ring of Fire The concentration of earthquakes
(Figure 1A) and volcanoes (Figure 1B) along this trend were used to
- -
- i
UA
- 4
w SI or
Figure1 World distribution of tA) earthquakes and (B) volcanoes (C)
Configuration of the major tectonic plates on the earths surface (Turcotteand Schubert 1982)
5
establish the boundaries of the lithospheric plates in the modern view of
plate tectonic theory (Figure 10) These plates which are relatively
rigid cover the surface of the earth like a mosaic of rigid caps and move
against each other by sliding (1) past at a transform fault (2) over at a
convergent margin (such as subduction at a deep sea trench) or (3) apart
from one another at a divergent margin (such as spreading at a mid-ocean
rift) Figure 2 shows schematically the spatial relationship of these
different types of boundaries Convergent plate boundaries are responsible
for the majority of the worlds large earthquakes and most of the worlds
tsunamis Many volcanic arcs form parallel to these deep-sea trenches
above the point where the subducted plate reaches about 100 km depth
(Isacks and Barazangi 1977) The relative motion of two convergent
lithospheric plates may be accumulated over a time period of tens to
hundreds of years and then released in large earthquakes or aseismic creep
(motion without earthquakes) may occur instead of earthquakes The area
over which the descending and over-riding plates interact the age of the
sea floor the topography of the sea floor and many other factors appear to
influence the recurrence interval and the size of earthquakes along the
interplate zone
The New Hebrides island arc trends linearly south-southeastward from
IIdegS to approximately 20degS (Figure 3) The northern end of the trench
bends sharply westward to merge with the east-west trending Solomon Trench
The southern end of the trench curves around eastward to merge with the
east-northeast trending Hunter Fracture Zone The arc is a component of
the Melanesian Borderlands that form the boundary between the
Indo-Australian and Pacific lithospheric plates (Figure 4) This
6
AS
M E S
T H
0
E
S
N
P
0 S
H
P H
E R
R
E
ridge
trnsIr
trench
Noauii
-
bull
q
transom al
Figure2 (A) Sketch of the different types of plate tectonic boundariesand their relationships (Isacks et al 1968) (B) Diagrams of the threetypes of boundaries in three dimensional view (Calder 1972)
1600
SOLOMON IS
1650
-
1700 E 1750
PACIFIC OCEAN
1800
100 o
0
-~ ~
1jN~CH
~ A
Ko
$SATA CRUZ IS
-10- K~10
J-shy
ltK14
TitCASTECS
is
k)tANKS
S A ME O
L AMBRY MALEKULA V
FI JI PLATEAU
150
FIJI is
~o eANGO d
250 3 ATT E UNTE PJC
160c 1650 1700 E 1750 1800
Figure 3 Bathymetric map of the New Hebrides Island arc and thesurrounding region taken from Mammerickx et al 1971 The filledtriangles denote Quaternary volcanoes Contours are in fathoms
1600 E 170 1800 W 170 deg 8
CENTRAL PACIFIC BAIN
S040
NOTH2
0
AMOA 0
200
BASIN
bull
o 0
BASIN
FIJI
f d
S 0 BASIN a O
INDV USTIRAL
oamp PLATE
0 ASA
BASIN
r
0
NEW t~Z EALAND
CHAT 11A M
R S
150 160 E 170 180
-a A S
0
30 PACIFIC PL ATE
SOUTHWESiT
PACIFIC 0
BASIN 0
40shy
1700 W Figure 4 Regional setting of the Southwest Pacific Tectonic and morphoshylogic features of the PacificIndo-Australian plate boundary Open arrows indicate direction of relative plate convergence Contour line shows 2-km isobath Holocene volcanoes are indicated by open triangles Data on bathymetry seismicity volcanoes and plate motions are taken from the Circum-Pacific Council for Energy and Mineral Resources (1981) map
9
intra-oceanic arc is unusual in that the subducting slab dips toward the
Pacific Basin The Indo-Australian plate is being subducted at a rate of
approximately eleven centimeters per year (Dubois et al 1977 Pascal et
al 1978 Isacks et al 1981) in a direction perpendicular to the trench
(Isacks et al 1969 Johnson and Molnar 1972 Pascal et al 1978)
Relative to other convergent plate boundaries (eg Chile and Alaska) the
width of the zone of interaction between these two plates is limited to
approximately 50 km in extent because the subducting (Indo-Australian)
degplate is steeply downbent (70 ) at intermediate depths This geometry
produces a narrow ribbon of potentially damaging seismicity rather than a
large region of seismicity The northern and southern portions of the arc
are typical of arc-trench systems but the central portion exhibits several
unusual features (1) The bathymetric expression of the trench is obscured
between 13degS and 17degS where a submarine ridge known as the dEntrecasteaux
Fracture Zone intersects it at approximately 16degS (2) The upper plate
protrudes westward in this central portion of the arc such that the western
coast of Malekula Island is located where the inner slope of the trench is
normally positioned (Karig and Mammerickx 1972 Isacks et al 1981 see
Figure 3)
Shallow Vanuatu earthquakes (Figure 5) are located in the interplate
zone between the two plates They are associated with slippage of the
Indo-Australian Plate as it descends beneath the Pacific Plate Intraplate
earthquakes also occur within the descending and overlying plates in the
trench region and behind the island arc in what is known as the back-arc
region An actual and a schematic vertical cross section near Tanna
perpendicular to the trend of the arc is representative of the
10
1600 E 1700 180 W 1700
I 0 s ee 0 0o
2e 01
6 S
20
30S $
S4b
0
3040 30
4S
400
1 2 40
150 1600 E 1700 I80 170 W
Figure 5 Regional setting of the Southwest Pacific associated with the plate boundaries in this region
Shallow seismicity
relationship of the seismicity to the trench islands and back-arc region
(Figure 6) In Vanuatu earthquakes occur from near the surface to
approximately 300 km depth The earthquakes systematically deepen
eastward from the New Hebrides Trench forming a narrow dipping plane
under islands located in the central portion of the arc and intermediate
depth earthquakes occur-progressively farther eastward Large (Ms gt 7)
earthquakes but few great (Ms 7 34) earthquakes have occurred along
the island arc as a result of the subduction of the Indo-Australian plate
In spite of the anomalous protrusion of the upper plate in the central
part of the arc the Benioff zone and convergent plate boundary appear to
be relatively uniform in configuration and continuous along the entire
length of the arc (Pascal et al 1978 Isacks et al 1981) The linear
distribution of the islands of Vanuatu and their location so close to the
main interplate thrust zone of the convergent plate margin result in a
geometry that is uniquely suited for subduction zone studies in comparison
to most other subduction zones on earth This also results in a unique
earthquake hazard in central Vanuatu Behind and eastward of the New
Hebrides island arc lies the North Fiji Basin (Figure 4) where the presence
of shallow seismicity (Figure 5) fresh basalts little sedimentation
(Karig and Mammerickx 1972 Luyendyk et al 1974) and high values of
heat flow (Sclater End Menard 1967) indicate active tectonism The Vitiaz
Trench forms the northern boundary of the North Fiji Basin and represents
the site of an old subduction zone that existed before the modern New
Hebrides arc formed Subduction (of the Pacific Plate) ceased at the
Vitiaz Trench sometime in mid-Miocene (Falvey 1978) or earlier (Chase
12
NEW HEBRDES VOLCANIC TRENCH ARC CORIOLIS
SW 4 TROUGH NE 00Z_shy
- _shy 2
-vQ 100- DESCENDING
PLATE ~ ~SEISMICf
ZONE -Ishy
200shy
300 00 100 200
DISTANCE KM
Figure 6 A schematic cross secion showing the region where shallow and intermediate-depth earthquakes were recorded (inclined lines) and the inferred geometry of the descending plate beneath the southern New Hebrides arc The inferred geometry of the interplate thrust zone is partly based on the slip vectors (short solid lines) of the shallow thrust-type focal mechanisms The Moho discontinuity of the overriding plate estiated from refraction and gravity studies is also shown (Condert et a 1981)
13
1971 Mitchell and Warden 1971 Karig and Mammerickx 1972) and resumed at
the modern New Hebrides Trench with the opposite polarity (Indo-Australian
Plate underthrusting beneath the Pacific Plate) Deep earthquakes are
still recorded near Vanuatu that result from this episode of subduction
The New Hebrides arc has migrated away from the trend of the older Vitiaz
Trench to its present position (Hamburger 1986)
Geolc-ical Setting
The islands of Vanuatu are volcanic in origin with older islands
fringed or capped with reefal limestones In the central region of the
arc the single chain of islands gives way to a more complex structure
(Figure 7) (1) the eastern Miocene-Pliocene chain with tholeiitic and
calc-alkaline volcanoclastics includes the islands of Maewo Pentecost
Efate and parts of Epi (2) the slightly older western Oligocene-Miocene
chain includes the islands of Santo Malekula and the Torres and (3) the
central late Pliocene-Recent portion contains active aerial and subaerial
alkaline volcanics (Mitchell and Warden 1971) The volcanic rocks of the
western chain are similar to slightly more acidic composition than the
eastern chain Local outcrops of ultramafic rocks are found in several
places in the eastern chain
REGIONAL BACKGROUND INFORMATION
Historical Earthquakes in the Vanuatu Region
An accurate evaluation of the earthquake hazard for a particular
region includes a survey of historical seismicity in the region in
question Historical earthquakes are important because they help to better
determine the potential size frequency of occurrence and possible effects
of future earthquakes
14
170
Tinakula
xd
Torres Is e
Vat Gonoi
Vanua Lava
b Gauagp Merig
- --- -4
- --- Santo Moewo NOR TH
DENTRECASTEAUX FZ ===== Pentecost FIJI
-- tMae ku v Ambry m BASIN
-p -E
0 ioo 200 Km
o Erromang -A IWA
U) TANNA FUTUNA -A
~ANEITYUMOVOLCANIV ASSOCIATIONS 7 UPliacene- Recen- (Central Chain) UMiocene- L Pliocene
Effi (Eastern Belt) ~UOIlgocene - MMiocene
1plusmnZ (Western Belt) Di ofDip ofTune Matthow TECTONIC ELEMENTS selomic zoneHunter
1r~7Uplifted volcanic ridge
~B c- bsn Major fracture zone - -Bock -aorc basin NF -
Zone of flexuring Sedimentary basin and faulting
I I K KIRI
Figure 7 Geology of New Hebrides Arc (Carney and Macfarlane 1979)
15
The earliest reports of earthquakes in the Vanuatu region is a series
of earthquakes which began on 28 March 1875 and were felt on Anatom
(Mercalli intensity VIII-IX for the largest event) and Erromango and in the
Loyalty Islands of Lifou Mare and Ouvea (lida et al 1967) On 10
January 1878 a tsunamigenic earthquake associated with the eruption of
Yasowa Volcano Tanna was felt in Port Resolution Tanna Another strong
tsunamigenic earthquake occurred on 11 February 1878 associated with
another eruption of Yasowa Volcano
Since 1900 5 great earthquakes (Ms gt 7 34) and 52 major earthquakes
(7ltMs lt 7 34) have occurred along the arc (McCann 1980) However the
great earthquakes that occurred near the turn of the century are not
well-constrained in size or place and their magnitudes were probably overshy
estimated (due to the way in which the magnitudes were calculated)
Moderate-sized earthquakes are distributed throughout the arc (Figure 8C)
but the largest events are more clustered especially in the northern
portion of the arc (Figure 8B Marthelot 1983 and Figures 9A and 9B
McCann 1980) There is a distinct gap in the seismicity at the point
where the dEntrecasteau Ridge intersects the line of the trench
Because the occurrence of shallow earthquakes near population centers
are of greatest concern for earthquake hazard in this report we have
focussed on shallow earthquakes near the main islands of Santo Malekula
and Efate in the central portion of the arc Maps of shallow seismicity
(depth lt 70 km) of the region based on the US Geological Surveys
Preliminary Determination of Epicenters (PDE) catalog for the period
1961-1981 are shown in Figure 8B and 8C (from Marthelot 1983) This
with bewen70 and10 Kin sqars betee 10deth andK2N00Kin FriaguresMpete island)arceV00anuat (ail) hongnrhto the argha
std itriagebetween00 and 3e0vkn locte (1) the acnceaoneo largesxise of thereshlwents nthe trnhahrcal diappeanras i thetareshalwents nthe norheialof the arnhh ih thetarch thapconraspuato he acthe reanqig mapis ho the dstrutiorn oaf2thepuxaprton ofearcTive reanqiet regis inothe dsorutrnhaf2the
haviencanue largetthand5an3) earthquakeintermediate-depthofrnestshanppresencanue of intermediate-depth3 ctivitye
17
9 194 (74) s-AFTERSHOCK ZONE
ft 1 (827 _RECOMFUTED OR 2RECENT EVENT
1914 ) EPICENTER
1944(7) 0-FROM
GUTENBERG AND (73) RICHTER
1 7 bull__ EPICENTER FROM RICHTER
192 (7O)(21 ( i9 1945()2)
j50 21926 (71)150 01928(71)
1946(70) 1927 (71)
1903(75)
1944(73) 1925 (76) 2 18754
~ 1878
200 1920(80O 94943(72)
4875 1923(70) 1944(72)
70737 1z945 I941943(757372) shy
1904 (84)
1928(75) 1926(70)
1917 (71)
250 6 I 165 0E 1700 1750
Figure 9A Map showing locations of large (Ms gt 7) and great (Ms gt 7 34)historical earthquakes along the New Hebrides Trench for the time period1900 to 1950 (McCann 1980)
18
I I
Io 953 1963 (73 73)
1966(7473)
19617(70)
9195304) 20 I 1972 (71)
651965(70)197
7150 (7 7 2 1958 (72)
--- 1965 197(71)-
F7873s) od
19616 1 A
2 00 1950 (70727072)
ID
165degE deg170c 1750 Fig~ure 9B Map showing locations of large (Ms gt 7) and great (Ms gt 7 34)historical earthquakes along the New Hebrides Trench for the time period1950 to 1979 (McCann 1980)
19
figure illustrates the dense concentration of interplate events close to
and landward of the New Hebrides Trench
Very little information exits concerning the effects of strong
earthquakes prior to 1961 apart from a few sketchy damage reports The
location accuracy of earthquakes was improved in 1961 Before this time
locations were located to the nearest tenth of a degree and magnitudes were
considerably over-estimated The last major seismic episode of interplate
slippage in central Vanuatu occurred in a sequence of earthquakes in August
1965 (Figure 10) which accumulated a total seismic moment equivalent to a
single magnitude Ms - 77 event (Isacks et al 1981) The 1965 Santo
earthquakes caused significant damage to buildings wharves and bridges in
Luganville on Santo Island and major damage to buildings and water tanks in
Norsup and Sarmet on Malekula Island (Pr6vot and Chatelain 1983)
Coseismic tectonic uplifts on Malekula Island were also measured in
association with the 1965 earthquakes (Figure 10) Over 1 meter of uplift
was detected for the 1965 earthquake sequence (Taylor et al 1980)
Only one sequence of earthquakes has been relatively damaging since
the Cornell-ORSTOM network began operating in 1978 The Mere Lava
earthquake (Ms 61) occurred on 12 May 1980 at 14800S and 16782degE and a
depth of 23 km The worst damage from this event was caused by landslides
SUMMARY OF FACILITIES AND PROGRAMS
Critical Facilities
Port Vila with a population of 15088 in 1979 is the administrative
and commercial center of the country There are a number of multistory
buildings in the capital and most of Vanuatus tourist industry is located
2
1970
140- )O AN OCT
JAN 19731974 0 00-
MAY 0
0--- 1965
S 9000 97150K 15deg AU61973 NOVV
1974
600 x OCT
4 1971 AUG 01966
171965
160shydeg 1 - - 2000
Ms S73 -77
63 -67
0
0
58-62170 1- 1 -_0 1660 1670 E 1680
Figure10 August 1965 earthquake sequence (from Isacks et al 1981)
21
in and near Port Vila A large shipping wharf is located near the center
of the city on Vila Bay
Apart from Port Vila the only significant development in Vanuatu is
at Luganville on Santo Island (pop 5116 in 1979) It remains an
important economic center for the country with agricultural processing and
shipping facilities located there There are several three- and four-story
buildings in the center of Luganville
Earthquake Preparedness Programs
As of late 1983 the Government had requested the assistance of a
consultant from New Zealand to help provide uniform building codes for the
country The Public Works Department enforces New Zealand seismic zone B
codes to construction of public buildings Large buildings for the most
part are designed by overseas engineering firms and generally comply with
the earthquake design standards Smaller buildings are generally designed
close to the New Zealand loading specifications but there continues to be
great difficulty in supervising construction projects
There is no large-scale earthquake education program in Vanuatu
Materials have been prepared by ORSTOM seismologists for distribution to
teachers public officials and planners involved in earthquake hazards
(eg Prdvot and Chatelain 1983)
Seismological Facilities
Seismological observations are necessary to the accurate location
study and ultimate prediction of earthquakes Seismic stations were first
established in Vanuatu in the mid-1960s by the French Office de la
Recherche Scientifique et Technique Outre-Mer (ORSTOM) Staion PVC in
Port Vila has operated continuously from 1964 to the present while LUG in
22
1680 1700140 1660 1670 1690 deg 140
GAUAP FIJI
PLATEAU 0
deg ~ HOG MAEWO -15 150 AOBA
2000 SANTO AB
MAP PENTECOST
160 A MT AM8160A= A 13AMBRYM-16
DENTRECASTEAUX OJi= LMP EPIP1FRACTURE ZONE
170 EME 170 EMAINGOUNA
NGAoS L E_ EFATE
RTVDvpP 18o 0shy180 -
o -180 z 0
o ERROMANGO
190 - Rk90R-190
TAN AN~o 4 FUTUNA
AUSTRALIAN oshy0 0TANNA
200 PLATE ANATOM 0 200
0 0
1650 1660 1670 E 1680 1690 1700
Figure 11 Map showing the seismograph stations in Vanuatu Circles arestations telemetered to the base station PVC on Efate island andunderlined stations have two components--one horizontal and one vertical The triangles are older ORSTOM stations INH and LUG are no longeroperational Strong motion instruments are located at SWB and LMP onMalekula island DVP and PVC on Efate island and LUG on Santo island
Luganville Santo operated through 1980 A third station on Tanna Island
(INH) operated through 1978 Cornell University began cooperative field
programs with ORSTOM in 1975 with a microearthquake experiment on Santo
Island An ocean-bottom seismograph experiment was carried out in southern
Vanuatu in 1977 and in central Vanuatu in 1978 The Cornell-ORSTOM
telemetered seismic network was established in 1978 and has operated
continuously since that time The seismic network now includes 19
telemetered stations (Figure 11) to date over 20000 earthquakes have
been recorded by the network A permanent ORSTOM mission is now based in
Port Vila and takes primary responsibility for day-to-day maintenance of
the network The availability of continuous earthquake monitoring in
Vanuatu is an important component of any earthqi-ke or -arthquake hazard
study for the country Figure 12 shows the seismicity level (magnitudes gt
4) recorded by the Worldwide Seismograph Station Network (WWSSN) Compare
these results with the increased sensitivity (magnitude gt 25) and location
accuracy of the regional Cornell-ORSTOM network which is shown by better
definition of seismic zones in Figure 13 These network data clearly
define the heterogeneous distribution of seismic activity in the central
portion of the arc
These seismological facilities are complemented by studies of ground
deformation using seven bubble-level tiltmeters a two-component longshy
baseline water tube tiltmeters and two levelling arrays
Strong-Motion Accelerographs
As part of the present program of seismic hazard evaluation in
Vanuatu Cornell and ORSTOM have installed five strong-motion
accelerographs on the islands of Efate Malekula and Santo (Figure 11)
__
5 t~j24
0 - 70km
o0 a 0 70-150km 0 C J
5 S S - 0 0 shy
-150-300km
a 0 o 300-700km
0
15S 4 -
bull7 -06 ----
SS
bull bull S
bull iilIIle
Figure I9 1p 4D JE l o shybull =r-
5 NO a~ 40
20 1 a
~ ~- 20Smbull 5m
- S r S st
16 E5 170 E~
165EI bull =W
Figre 2 Epcenresde sesme lcasspa er ea onia de sttos-16-1) PDE ocaionsofvent (167-182) vtand 1983)-- ha-la
25
PROFONDEUR - DEPTH 0 - 70 Km
E
05 0
EE
03 4 3
0I
Figur 13Siete e ~se bulloai~pa le rieuOSO-ONEL(918)
00i
oA
Fi3r1N
a
0--
E iete e e Icls sp rl dspeuOR T M C R E L(9 8 1 8 )
26 These acce2erographs complement the other instruments being used to study the seismicity in the region The accelerographs record the ground accelerations at a particular site fiom an earthquake strong enough to trigger the instrument To date these instruments have already been triggered by five moderate-sized shallow events and will be used to provide a basis for prediction of local ground motion induced by large interplate earthquakes in Vanuatu The high level of seismicity along this plate boundary suggests that a valuable baseline of strong-motion data can be collected in a relatively short period of time
Related Research Programs
The seismology program is carried out in cooperation with the Vanuatu Department of Mines Geology and Rural Water Supplies They are responsible for regional geology studies resource assessment detailed mapping and hydrological activities In addition ORSTOMs geology and geophysics department based in New Caledonia carries out an extensive
program of investigations covering submarine morphology marine geology and geophysics island geology and crustal structure The US Geological Survey has undertaken a series of detailed marine studies in the central and northern portions of the island arc using the research vessel SP Lee (1982 and 19F4) A detailed hydrographic survey was carried out in coastal waters by Australian researchers A tide gauge is maintained by the ORSTOM
mission in Port Vila (Pr6vot and Chatelain 1983)
PREVIOUS STUDIES
Seismicity Studies Along the New Hebrides Arc
Seismicity studies of the New Hebrides Arc by Isacks et al (1981) found that major bathymetric and structural complexities divide the central
27 part of the arc into segments approximately 100 km long The segment near
Santo and northern Malekula islands ruptured during two complex sequences
of events occurring in August 1965 and in late December 1973 through early
January 1974 (Table 1) In contrast the segments near the southern part of Malekula and Efate islands may not have ruptured during the past 75
years Moreover between southern Malekula and Efate islands the
orientation of the horizontal compressive stress within the upper plate
changes from a direction perpendicular to the arc to a more complex and
variable pattern found in the southern portion of the arc
Since the Cornell-ORSTOM network was established in 1978 10 moderate
(58 lt Ms lt 7) earthquakes have occurred within the network (Table 2) A
description of the seismicity recorded by the network follows
(A) Fore- and Aftershock Sequences of the August 1979 and July 1981 Main
shocks
(1) 17 August 1979 Sequence Figures 14A and 14B show earthquakes in the foreshock sequence of the 17 August 1979 earthquake The spatial and
temporal development of this activity was described by Isacks et
al [1981] This section provides a more detailed analysis of a longer
period of time A small zone near the epicenter of the 17 August
earthquake was intermittently active during late June - early July 1979
(Figure 14A) The more immediate foreshock sequence (Figure 14B) started
eight days before the main shock and consisted of five groups of events
Each group of foreshocks began with an earthquake having a magnitude
between 42 and 49 and each was followed by a number of small
aftershocks The first foreshock cluster was located just landward of the
trench Each successive cluster migrated in time northeast toward the
Relocations with all available teleseismic and local data for 1978-1981events except 27 Jan 1979 [Bulletin of the International SeismologicalCentre (ISC) location] remaining locations based on local data only 2Ms surface-wave magnitude taken from Monthly Bulletins of the PreliminaryDetermination of Epicenters (PDE)3MO seismic moments reported by Chinn and Isacks [1982] or in Monthly
Bulletins of the PDE (1981-1985 events)
4Mw is calculated from M0 by Mw - (115) x (log(Mo)-161)
17
0 0 0
0CD 00 aVm01 83 0 0 0
00 0 00 3
0 00 0
000 0 0
167 E 168 0 E
169 167 E
168 0 0
169 167 E 0 1
168 169
Figure 14 (A) Early foreshocks of the 17 August 1979 main shock (shown as a filled square) that occurredat the end of June to the beginning of July 1979 Island contours and 6 km bathymetry are shown (B) Lateforeshock activity preceding the 17 August 1979 earthquake Foreshocks migrated from the trench toward thelocation of the main shock (C) Foreshocks preceding the 15 July 1981 earthquake 0o
31 epicenter of the main shock The foreshock sequence ended with a very
intense concentration of seismicity near the 17 August 1979 main shock
epicenter The final foreshock cluster began eight hours before the main
shock and continued until the region became seismically quiet three hours
before the main shock The main shock occurred at the northeastern end of
these clusters
The development of the aftershock activity in Figure 15 is shown for
two time intervals during the nine days following the main shock During
the first day the aftershocks were initially located close to the epicenter
of the mainshock and rapidly expanded towards the west At the end of this
day aftershocks occurred as far north as the site of the 26 August main
shock and as far south as about 181degS (Figure 15A) Most of the increase
in the aftershock area occurred during the first day as can be seen by
comparing Figures 15A and 15B To the north the expansion of the aftershy
shock zone stopped near the epicenter of the next main shock of the
sequence that occurred nine days later on 26 August In the south aftershy
shocks were located in the same zone defined by the early foreshocks (also
see Figures 18C and 18D)
(B) 26 August 1979 sequence The development of the 26 August
aftershock zone (Figure 16) shows very similar patterns to the development
of the 17 August aftershock zone The activity developed very rapidly
during the first two days following the main shock (26 -- 27 August)
Then as in the case of the 17 August aftershock sequence the cumulative
sequence occupied an area larger by a factor of 2 or 3 than the one
expected for an earthquake of such magnitude [Isacks et al 1981] The
main shock was located on the southern edge of the aftershock zone -- the
aftershock activity developed to the north east and west only while the
aftershock zone of the 17 August event was nearly inactive (Figures 16A
16B) By 27 August aftershocks were located as far north as the epicenter
of the future 15 July 1981 earthquake and as far west as the New Hebrides
32
17
oA B
00
00
18 - 0o - 0 0
0 0
00
167 E 168 169 167 E 168 169
Figure 15 Maps of epicenters showing the development of the 17 August1979 aftershock sequence Format as in Figure 14 (A) 12H59M 17 August1979 to 12H59M 18 August (B) 13HOOM 18 August to 11H46M 26 August(to just before the 26 August main shock)
17
180 0 ogI0
0 00 o0
CP 00 000
0
0 0 0 8V
0 00 0 0(0 0
0 0
C0 0
C 0
167 E 168 I0
159 167 E 168
0
169 167 E
e l 0
168
_o
169
Figure 16 Maps of epicenters showing the development of the 26 August 1979 aftershock sequence Formatas in Figure 14 (A) 11H47M 26 August 1979 to IIH47M 27 August (B) IIH48M 27 August to IIH47M4 September (C) 1lH47M 4 September to IIH47M 26 October 1979
34
trench The aftershock zone ends very abruptly to the north along a
sharply defined east - west trending line which passes close to the
epicenter of the 1 September 1978 earthquake (Figure 18A) After the first
two days the level of aftershock activity decreased rapidly During the
entire period from the main shock to 14 September the aftershock zone of
the 17 August earthquake remained relatively quiet (Figures 16A 16B)
From 15 September to about mid - October both the 17 August and the 26
August aftershock zones were reactivated (Figure 16C) although the level of
activity was much lower than that during the days immediately following
each of the main shocks During this later period some activity occurred
in the back-arc region Northeast of Efate Island a small intense cluster
occurred in 1979 followed by shallow events spread around Efate Island
(Figure 16C) The level of activity then decreased and by the end of
October was back to a more normal background level of seismicity in the
entire region
The two aftershock zones of the 17 and 26 August 1979 earthquakes are
contiguous with some overlap in the area between the two epicenters (Isacks
et al 1981 Chatelain et al 1986) Chatelain et al (1986) show tiat
this area plays a key role in the development of the seismicity in ne
Efate region
(3) The 15 July 1981 earthquake In contrast to the 17 August 1979
earthquake no outstanding foreshock activity occurred prior to the 15 July
event Small clusters occurred on 5-6 and 12 July (see Figure 14C) Both
clusters included few events although each started with a magnitude (mb)
50 earthquake The larger of the two occurred on 12 July near the pending
main shock epicenter In contrast to the 17 August 1979 case no unusual
35
concentration of activity was noticed in the epicentral region during the
months immediately preceding the main shock Possible long-term precursory
activity may be the clusters observed in March and June 1980 and are
discussed in the next section
Figure 17 illustrates several outstanding features of the aftershock
sequence of the 15 July earthquake First an intense zone of activity
develops during the first day and continues throughout the sequence (Figure
17A) This zone is coincident with the aftershock zone of the preceding 26
August 1979 event (compare Figures 17A and 16) The southern boundary of
this activity is quite sharp and coincides with the region between the two
August 1979 epicenters this again emphasizes the importance of the area of
the two 1979 epicenters The epicenter of the main shock is located on the
northern boundary of the region of intense activity
Second the aftershock activity expands in size during the succeeding
nine days primarily northwards [see also Chatelain et al 1983] To the
northwest significant activity develops within the oceanic plate beneath
the trench axis (Figure 17B) This activity is concentrated beneath the
ORSTOM seamount [see USGS map by Chase et al 1983] near 173degS and
1672degE During the second through the ninth days activity continues to
develop in the area west of Epi Island and south of Malekula Island (Figure
17B) while in the succeeding 50 days the area of southern Malekula is
activated with a remarkable cluster occurring beneath the southern coast
(Figure 17C) The region of southern Malekula and Epi has been notably
quiet for much of the period prior to the July 1981 earthquake Back-arc
activity is also notable with a cluster occurring on 29 July east of
16 06 A B deg
0
O0
0 0
0~
o
000
0 0
0
00
0o~$
S 0 08 S
16E0
167 E
1 - C
0 0
168
0
16
0--
0
169 16
t
E
4P0
16
168
_ _ _ _ _ _ _ _
167
16 1o6
0
E 0
o S 0O
0 0
66
o5
0 6
0 24 Ju
q-o
0
6
1G 8HOM(C) 240 in~~ ~~
08OM24 JulJul toto 075M Figur 14
M Setme 1981 ()0H5M1Juy11to0H5M16Jl()0HO16uyto 1515 Setmbr191
I shy37
9Mo 4 o
uy
ON
37
Efate and increased activity in the region of Ambrym and Epi islands
(Figure 17C)
The aftershocks of the 15 July 1981 event thus affected four distinct
regions (1) the former 26 August 1979 aftershock zone presumably on the
interplate boundary (2) a region of the suboceanic plate near the ORSTOM
seamount (3) the region between South Malekula and 172degS presumably also
part of the interplate boundary and (4) upper plate crust cast of Efate
Island The total area affected by this earthquake was about 10 times
larger than the area expected for the rupture zone of an earthquake with
magnitude of the July 1981 event [Chatelain et al 1983]
(B) Prominent Clusters
Aside from aftershocks of the August 1979 and July 1981 events the
Efate -Malekula region also experienced several remarkable earthquake
clusters Some of these have the characteristics of an aftershock
sequence with the initiating event having the largest magnitude (and
sometimes preceded by a few foreshocks) Others have characteristics
intermediate between an aftershock sequence and a swarm [Mogi 1963] where
there may be several dominant shocks within the sequence and a more
symmetric shape to temporal variation of the number of events per unit
time The clusters are shown together with the larger aftershock sequences
in the summary of seismicity presented in Figure 18 For clarity the
aftershocks of the August 1979 and July 1981 events are represented by the
first nine days of activity
(A) Clusters in the forearc region The first cluster recorded by the
local network occurred in late September and early October 1978 near the 1
38
September mainshock (Figure 18A) and can be considered as a late part of
the aftershock sequence of the 1 September event The location of this
cluster however is activated again in later clusters (December 1979
August 1983 and April 1984) Figure 18A shows the next significant
activity in the region a cluster of earthquakes in December 1978 located
west of the August 1979 aftershock zone beneath the New Hebrides trench
The region was then fairly quiet until March 1979 when an intense cluster
of earthquakes occurred over a period of five days (Figure 18B) Activity
in the same area resumed again in April 1979 for a period of two days The
most active parts of both clusters are located at the same place which
defines an east - west trending zone located near the epicenter of the 26
August 1979 event and at the junction of the 17 August and 26 August
aftershock zones
After the August 1979 shocks three clusters occurred in December
1979 March 1980 and June 1980 (Figure 18G and 18H) near the epicenter of
the 1 September 1978 main shock (and also near the mid September 1978
cluster noted above) This location is on the eastern edge of the future
1981 aftershock zone The three clusters also tended to migrate toward the
July 1981 main shock epicenter (Figure 18G) A smaller cluster occurred in
August 1980 beneath Malekula Island (not shown on Figures) Actually the
entire region was rather quiet during 1980 The three 1980 clusters were
relatively small
In February 1981 a cluster of earthqukes occurred just west of the
location of the March -April 1979 clusters between those clusters and the
location of the December 1979 cluster (Figure 18H and 181) This location
39
Figure 18 Maps of epicenters in aftershock zones and clusters located bythe Cornell-ORSTOM network shown sequentially in time Epicenters of main shocks are shown by filled squares In each successive frame the next cluster overlays the preceding one for comparison Only successive clusters are shown in each frame All the activity recorded for the periods chosen is plotted Ten days of aftershock activity are shown for the August 1979 and July 1981 earthquakes
(A) 1 September 1978 main shock with September-October 1978 cluster (open circles) and December 1978 cluster (open squares)
(B) 27 January 1979 mainshock (no aftershock activity) with clusters of March-April 1979 (filled circles)
(C) Foreshock sequence for 17 August 1979 (open circles) (D) 17 August 1979 mainshock and aftershok sequence (filled circles)(E) 26 August 1979 mainshock and afters]ock sequence (open circles)
back-arc activity in September 1979 (crosses) (F) Cluster in December 1979 (filled circles) (G) Clusters in March 1980 (open circles) June 1980 (open squares) and
February 1980 on Efate island (plus signs) (H) Cluster in February 1981 (filled circles) (I) 15 July 1981 foreshocks (open circles) and June 1981 back-arc cluster
(plus signs) (J) 15 July 1981 aftershock sequence (filled circles) and back-arc activity
during July 1981 (plus signs) (K) Clusters in September-October 1981 (open circles) and activity on Efate
island in December 1981 (plus signs) (L) 12 March 1983 earthquake and aftershock sequence (filled circles) (M) Cluster in June 1983 (open circles) (N) 3 August and 5 August 1983 events and aftershock sequence (filled
circles) (0) Clusters in April 1984 (open circles) and in the back-arc near Epi
Island in March 1984 (plus signL) (P) Cluster in October 1984 (filled circles) (Q) Clusters in February 1984 (open circles) and April 1984 (open squares) (R) 3 July 1985 aftershock sequence (filled circles)
17
deg A B c
o 0W
0
03
0
00
(0C
0
00
00
0cn9
0
13g
0
o
000
o
0 000
0 0
0
0o 0
0 o 0S
(So
0
0
17
17 sclo
deg D c
p 0 0-
F
O 0 0 1800
O00 0
000
0 0 00 0
0 +
167 E 168 1690 167 E0 0
168 169 167 E 00
168 169
0 0
17
S
18
a I
0deg0Ck G
06+04
13 degp
~ - Ho
-to+00 0 o0o0o
0+1
I
0 0 +
18-
0
0O
A- V
J
+
- 00 B +o
K0 00 o0
L 0
0
0~
+
17 0
0
0j AbullB
0
0 0 0
0
0e
0 06
0 000
0
g oo
000
0+ 0olo
9
00
f 000
00 eFo 0 Q000
01
0 0
0 o00 1 0
o 0
1 7 E1 8116767E 168 169 167 E 168 169
I-0
16
7
0 o k3 ~
00
00
0 0
o 00
_o-I -
00 0 0
0 00
0
00
17s IP
0
00 00
13
01
0
0
00
000 0shy18
1868
CP 0 0t
00
169 167o
8
0
00
00
3
17E168 169 167 E 168 0 0 169 167 E 168 169
43
is part of the overlapping aftershock zones of the August 1979 events and
is also at the southern limit of the 15 July 1981 aftershock zone
The clusters thus have a very close spatial relationship to the
aftershock zones of the main shocks They occurred near the boundaries of
the aftershock zones and appear to be related to features delimiting or
defining the spatial development of the aftershock zones (see also
Chatelain et al 1986)
From February 1981 until August 1982 except for the aftershock
sequence of the July 1981 earthquake not a single fore arc cluster was
detected in the Efate Malekula region- Starting in September 1982
clusters began to occur around the former July 1981 immediate aftershock
zone In September and October 1982 four clusters occurred south of and
beneath Malekula Island (Figure 18K) Besides the aftershocks of the 15
July 1981 earthquake the September - October 1982 clusters were the most
prominent activity in the Malekula region during the entire 1978-1984
period These clusters did not occur at random places The first one was
located beneath Malekula Island at the site of the previous cluster in
1980 The second cluster is lcated southwest of Epi Island in an area
which experienced significanc activity during the aftershock sequence of
the 15 July 1981 earthquake (compare Figure 17C and 18L) The third
cluster shows a very linear pattern trending southwest - northeast right
along the extension of the northern edge of the 15 July aftershock zone
The fourth cluster then occurred beneath southern Malekula Island
In March and June 1983 two clusters occurred in the southern part of
the Efate zone The March 1983 cluster (Figure 18L and 18M) occurred near
the January 1979 epicenter and comprised a relatively small aftershock
44
sequence of a magnitude (Ms) 58 earthquake The June 1983 cluster
occurred just south of the July 1981 aftershock zone (Figure 18M and 18N)
This cluster affected the same zone which had already been affected by both
foreshocks and aftershocks of the 17 August 1979 mainshock Most of the
cluster occurred after a magnitude (mb) 54 shock which was the largest
event in the cluster The cluster thus has the charactistics of an
aftershock sequence but one with an abnormally large area for the main
shock magnitude The main shock was also preceded by a small foreshock
sequence that started a day before and stopped six hours before the main
shock
In August 1983 a dense cluster following a Ms - 56 and a Ms - 57
event occurred northwest of Efate Island (Figure 18N and 180) The latest
cluster recorded in the region occurred in April 1984 again activating the
same zone (Figure 180)
(2) Clusters in the back-arc region Although the back-arc region is
usually relatively aseismic there were clusters of earthquakes located
east of Efate Island and beneath Efate Island itself The clusters were
shallow and located in the island arc crust The areas affected were much
smaller than those in the forearc clusters Three of the clusters occurred
just before or after the August 1979 and July 1981 main shocks (Figures
18E 18F 181 and 18J) The August 1979 event was followed in September
1979 by a cluster east of Efate and in February 1980 beneath Efate The
July 1981 main shock was preceded in June - July 1981 by a swarm occurring
just south of the cluster following the August 1979 events Another
cluster occurred shortly after the July 1981 event at the same place The
July 1981 main shock was also followed by a swarm on Efate Island at about
45
the same place as the one following the August 1979 earthquakes No
clusters have been located in the Efate back-arc region from December 1981
when the last swarm occurred on Efate Island up to the most recent data
available October 1984 thus giving support to the close temporal
relationship between these clusters and the 1978 - 1983 sequence (see also
Chatelain et al 1986) In December 1980 a larger cluster occurred
farther east near the Coriolis trough (not shown on figures) The only
other back-arc activity occurred in March 1984 farther north just south of
Epi Island (Figure 180)
(3) Summary of Results from the Cornell-ORSTOM Network Investigation
of the patterns of seismicity associated with the earthquakes which have
occurred within the Cornell-ORSTOM network has shown that (1) not all
medium to large size events are associated with foreshock activity (2)
long term precursory activity sometimes occurs but not with enough
consistency to use in forecasting an impending event and (3) some zones
are activated before and after the main shocks without defining any clear
cycle (Chatelain et al in press) These earthquakes and their associated
seismicity suggest that specific features along the interplate zone
produced by the interaction of structures in the overriding and subducted
plates appear to control the seismicity in the Efate region (Chatelain et
al in press Isacks et al 1981)
Seismic Potential Studies Along the New Hebrides Arc
The earthquake hazard from the interplate zone is generally high
because of the rate of relative motion of the two plates (approximately 11
cmyr) and the stick-slip nature of the boundary However in addition to
large to great earthquakes along the plate interface moderate to large
46
magnitude events can occur within either plate and cause considerable
damage locally
One approach to determining the seismic potential of a region is to
identify a seismic gap or portion of an arc that has not produced a large
earthquake for some period of time The identification of a seismic gap
does not mean that a large earthquake will necessarily occur in a given
region because not all gaps will produce large earthquakes The gap may
indicate that (1) the section of the plate boundary is locked stress is
accumulating along the interface and will be the site of a future
earthquake or (2) the relative plate motion is being accommodated by
continuous slippage (aseismic creep andor by slip during small and
moderate events) such that sufficient stress to generate large earthquakes
along that section of the plate boundary does not accummulate Historical
information regarding the occurrence of earthquakes in a particular region
and regional tectonic constraints are necessary to clarify which of these
two possibilities is valid for the region in question In many cases
however the historical record may be incomplete or too short to accurately
determine which option is correct
Evaluation of the recurrence history of a particular region can be
investigated using (1) Teleseismically recorded earthquakes (2)
recurrence relations of smaller earthquakes recorded by seismograph
networks (3) pre-instrumental historical records of large earthquakes and
(4) evidence of prehistoric and historic large earthquakes observable in
the geological record Recurrence relations may help determine return
periods for certain sizes of earthquakes Recurrence intervals are
dependent upon the observations of seismograph networks and-are incomplete
47
since the period of record keeping is short compared to the time necessary
to develop these relationships Indirect evidence of large earthquakes can
sometimes be found in the geologic record in the form of uplift rates and
used to address the problem of recurrence intervals However information
obtained from the geologic record is necessarily limited in accurracy
McCann (1980) has divided the New Hebrides arc into different zones
and assigned values of seismic potential to these zones (Figure 19) based
on his study of historical and instrumental seismicity He has assigned 6
different divisions based on his study of the historical record (1) site
of a great (Ms 7 34) earthquake more than 100 years ago (2) site of a
great earthquake within the past 100 years but more than 30 years (before
1978) (3) incomplete historical record but indication that the region may
have the potential for a large earthquake (4) plate motion is subparallel
to the arc (5) no historical record of a great earthquake and the region
may not have the potential for one and (6) site of a large earthquake
within the past 30 years and presumably the lowest seismic potential
Marthelot (1983) used PDE data to determine some general segmentations
in the seismicity of the New Hebrides arc and the patterns of seismic
activity that characterize these segments (Figure 20) Marthelot (1983)
found that coupled interplate large (Ms lt 79) thrust earthquakes which
are preceded by intense activity dominate the northern end of the New
Hebrides arc near the Santa Cruz islands (between IIdegS and 13degS) Moderate
(Ms lt 72) thrust events concentrate between 13degS and 14degS Coupled
moderate (Ms lt 75) interplate thrust earthquakes occur near Santo and
northern Malekula islands (14degS to 165degS) The southern end of Malekula
and slightly south (165 0S to 1750S) exhibit coupled interplate thrust
48
14 S
2
19
24 I 165 E 170
Figure 19 McCanns seismic potential for New Hebrides island arc (McCann1980 See text for discussion of numbers
____
49
1650 1650 2 6 63 - 41 100
0 COUPLED INTER-INTRAPLATE THRUST
7467 e34 34
w
= EVENTS PRECEDED
BY INTENSE 24
AACTIVITY U I 44 CONCENTRATION
OF THRUST EVENTS
64-72 21O210
3
COUPLED 2061 73 0 _00
s INTERPLATE - 0 0C w THRUST EVENTS 78
PRECEDED BY 45t58C-150
DONUT PATTERNS 16 46 I S
81 03Q STEADY HIGH RATE L2 062 501 4 4
02ONLY ONE THRUST EVENT 61 025 INTRAPLATE200 ACTIVITY A 43
81 _0 2 O V CLUSTERS OF 72 73
RECURRING 76 150Q20 THRUST EVENTS 200
SLOW EXPANSION 4 OI01
OF ACTIVITY 8I 80 26 43 IN 198081- 13Do NO PRECURSORY
PATTERN 0 66 26
170 0 E 1720 170 0E 1720
Figure 20 Summary of the characteristics of the distribution of shallow earthquakes along the New Hebrides island arc The dashed line representsthe axis of the trench The trench disappears in the central part of the arc Horizontal lin separate regions characterized by distinct seismicity patterns Middle figure shows years of occurrence of large(Ms gt 70) and moderate-sized events (ms gt 60) 1961-1981 Right figureshows the large earthquakes that occurred from 1900 through 1960 (Marthelot and Isacks 1984)
50 earthquakes that are not quite as large (Ms lt 72) The zone west of Efate
(175degS to 18degS) exhibits a steady high rate of seismicity with magnitudes
(Ms ) less than or equal to 72 Between 18degS and 20degS intraplate activity
(Ms lt 72) dominates South of Anatom (eg south of 20degS) the seismicity
is characterized by clusters of recurring thrust events that do not exhibit
any precursory activity
In another study utilizing the PDE data set Wyss et al (1983) and
Habermann (1984) have used the shallow New Hebrides seismicity in order to
(1) identify areas of higher and lower strength within the plate interface
which might control the rupture length of future earthquakes and (2) test
for changes in the rate of seismicity prior to large earthquakes using a
statistical procedure The trend toward low stress drops in the central
portion of the arc near the intersection of the dEntrecasteaux Fracture
Zone with the New Hebride Trench is consistent with other studies which
indicate that this region is anomalous However a region of high or low
strength does not indicate anything about the nature of the region and
these regions do not help pinpoint when a large destructive earthquake
will occur within or near them
ASSESSMENT OF EARTHQUAKE HAZARD
Seismotectonic Provinces
We propose the following seismotectonic provinces and the maximum
probable (but not absolute) sizes of earthquakes be considered for the
subregions within Vanuatu when considering a design earthquake for these
regions (Figure 21) These provinces are based on the instrumental history
of earthquakes near Vanuatu The northern end of the New Hebrides Trench
is a complex zone of deformation where the interplate motion is changing
51
M612
13
S 0 0
18
231 165 E 170
Figure21 Earthquake potential for Vanuatu
--
--
52 from thrusting in the southern portion to mostly strike-slip motion in the
northern portion and has the potential for great (Ms 8) earthquakes The
central portion of the New Hebrides Trench here called the Santo
Malekula segment exhibits characteristics different from the rest of the
arc as the result of the dEntrecasteaux ridge interaction and has the
potential for Ms 7 34 earthquakes The southern end of the New Hebrides
Trench here called the Efate Tanna segment may have the potential for
Ms 8 earthquakes The extreme southern end of the New Hebrides Trench is
another complex zone where the interplate motion is changing from thrusting
in the north to strike-slip motion in the south and may be limited to
infrequent moderate (M 7 12) earthquakes Other sources of seismicity
include back-arc spreading east of the New Hebrides Trench (Ms 7 12) and
diffuse shallow activity along the Hazel-Holme Ridge (Ms 7) in the North
Fiji Basin (Ms 6 12)
One method for estimating the maximum possible magnitude earthquake in
a region is to look at the amount of deformation that has accumulated from
past earthquakes The deformation is assumed to be proportional to the
square root of the energy released by a powerful earthquake The energy
(E in joules) of each earthquake can be calculated from its magnitude (Ms)
using a formula developed for the region Pr~vot and Chatelain (1983) have
used the formula
Log E - 48 + (15 x Ms)
to calculate the amount of energy which has been released since 1965 in the
central portion of the arc (Figure 22) The calculated values tend to fall
within a range of values which can be bounded by two parallel lines since
deformation occurs more or less uniformly in time The maximum possible
E1 2 106 600 (joules )
500
400
300
200
136 shy
100
65 70 75 80 82 ANNEES - YEARS
Figure 22 Seismic energy release along the New Hebrides Arc since 1965 (Chatelain and Pr~vot 1983)
54
magnitude earthquake calculated by this method is Ms - 76 Prdvot and
Chatelain (1984) computed a similar result using all of the earthquakes
which have occurred since 1900
Ground Motion
Once the location and magnitude of potential earthquakes have been
determined for a region the next step is to determine the characteristics
of the ground shaking at a particular site This accomplished by the
condsideration of such quantities as earthquake source mechanism
epicentral distance and geometry and physical properties of the geologic
structures located between the source and the site
Strong-motion records provide one measure of site response To date
a relatively large number of strong-motion records have been generated in
the far-field of large earthquakes especially in California and Japan In
contrast relatively few near-field records of moderate and large shocks
have been recorded in island arcs These few have shown large scatter with
unpredictable results The 3 March 1985 Chilean and 19 September 1985
Mexican earthquakes constitute the most important exceptions and are
invaluable additions to the library of strong motion data for subduction
zones Nor-theless these two events do not constitute a databank of
information especially for intraoceanic tectonic settings such as Vanuatu
A major difficulty arises in trying to translate past earthquake size
(intensity values) which are based on cultural effects or magnitudes
derived from widely varying instrumental parameters into values of ground
motion The development of earthquake resistant design is usually based on
intensity of ground motion at a particular site The most widely applied
standard of comparison for strong motion data is the peak ground
55
accelereation (PGA) Figure 23 shows a general relationship between peak
acceleration and distance from hypocenter which has been derived from
worldwide earthquake data Some earthquakes generate relatively high
single peaks of ground accleration which represent little ground energy
Therefore on an absolute basis the use of PGA can be misleading for
smaller events
Peak ground accelerations are easily obtained from accelerogram
records however most historical information consists of earthquake
intensities Numerous relationships between ground acceleration and
Modified Mercalli intensities have been developed (Table 3) Two of these
proposed relationships are shown in Figure 24 For worldwide data Murphy
and OBrien (1977) have computed statistical correlations between Modified
Mercalli intensity values and ground accelerations (horizontal and
vertical) Theresultant relationships and the geometrical standard
deviation (s) are
log Av - 028 Imm - 040 s - 253
log Ah - 024 Imm- 026 s - 219
where -Av peak vertical ground acceleration
Ah - peak horizontal ground acceleration
Imm - Modified Mercalli intensity
Using the relationship of earthquake intensity to distance and size of
Fiji earthquakes Everingham (1984) has produced a plot for the Fiji region
(Figure 25) Although these results are for a nearby region they give a
general indication of what might be expected for Vanuatu Figure 26
(Prdvot and Chatelain 1983) shows the recurrence of Modified Mercalli
intensities per number of earthquakes
56
1000 1 I l I I eO58 M(R 5 -X A= 1320 e R+25)152
5
MEAN + a =2N01 - STANDARD 2-
oe DEVIATIONbullbull- ~0 MEAN + 2
tbull 0o - STANDARD - oo o DEVIATIONS Jf E N o 0
LU0
U 01 0_ o o 0-oo n 00 bull
L) em a00
- MEAN - shy - 4ra 00 L 0 W STANDARD 0-~DEVIATIONWL 000 to
0 ME N -2 1 STANDARDUx 0
DEVIATIONS
101- 10 - 000
D N O oENTE K - 1 so-
10 100 1000
DISTANCE FFROM HYPOCENTEFR IN KILOMETEFRS
Figure 23 Acceleration-attenuation relations derived from worldwide earthquakes (Hays 1980)
57
Table 3 Characteristics of the data samples used in selected studies of the correlation of ModifiedMercalli intensity and peak ground acceleration (modified fom OBrien et al 1977)
Number and Range of location Number Modified Mercalli Distance Acceleration
Study of earthquakes of recordings intensity
Gutenberg and 61 Western 167 n-VIII Richter 1942 United States 1956
Neumann 1954 10 do
Hershberger 1956 60 do Coulter Waldron dodo
and Devine (Not based 1973 entirely on
observed data)
Trifunac and 57 do Brady 1975c
10 V-VIII
108 J-Vil IV-X
187 IV-X
range (kin) range (cms2)
3-450 1-300
Averages of 40-300 25 and 160 (distance dependent) - 1-300 Short distance 6-3000
(Dependent on site geology and local amplification)
Figure 24 Proposed relationships between earth quake intensities and peack accelerations
59
DEPTH 20KM
7shy
6- 6 0
075 502
61 h0
DISTANCE KM
Figure 25 Modified Mercalli earthquake intensities observed in Fiji as a function of magnitude and epicentral distance (Everingham 1984)
60
10
0
5CI I-C)
0i
0
o
01 a)o
PORTVILA = SANTO
00
E
0212
000
E
z
Degres Mercali _ Mercalli degrees
Fiue-2 Frequency of Modified Mercalli earthquake intensities felt in Port Vila and Santo (Chatelain and Prfivot 1983)
61
Tectonic Uplift
Studies of longer term island uplift on Santo and Malekula as
evidenced by the uplift of coral reefs have related segmentation of these
islands to features of the subducting topography of the dEntrecasteaux
fracture zone (Taylor et al 1980) The proximity of these two islands to
the main interplate thrust zone and the growth of the coral reef terraces
around the islands has resulted in preservation of long-term deformation
Taylor et al (1980) have studied late Quaternary coral reefs that have
been uplifted on Santo and Malekula islands They identified four main
blocks based on long-term tilt differences (Figure 27) The rupture zones
of the 1965 and 1973-1974 earthquake sequences correlate to the tectonic
discontinuities in the Santo -- Malekula region Taylor et al (1980)
studied the uplift of coral terraces on Malekula over a period of three
years (976 1177 and 779) and found that just over 1 meter of uplift
had occurred in the northern part of the island as a resalt of the 1965
earthquake (Figure 28 Table 4)
Tsunamis in Vanuatu
Tsunamis (seismic sea waves) are caused by displacements in submarine
topography that are induced by earthquakes andor volcanic activity
occurring below or near the floor of the ocean Low-lying areas near the
shore are particularly vulnerable to damage by these waves The shallow
seismic zones of the Southwest Pacific have a history of earthquakeshy
generated tsunamis (Figure 29) A few tsunamis have originated in the
Vanuatu region A tsunami was produced by the first earthquake of the
March 1875 sequence (Iida et al 1967) The earliest known significant
one was the 10 January 1878 earthquake which produced a large tsunami
62
1167030E
AK-A 150 30 S
Tasmaloum Arkialo
NORTH MALEKULA
X Direction of tilt inferred from reef terraces 16000S
Tilt discontinuity
Pliocene and Quaternary shy sedimentary rocks mostly
coral limestone
r Pre-Pliocene sedimentaryand igneous rocks SOUTH
MALEKULA
160305
Figure 27 Tectonic uplift associated with the 1965 Santo earthquakes (Taylor et al 1980)
63
Contour Interval =02 m 02--- 04 - hp
0-6- shy08 xx16 000Sshy
08 9
06
02 i
00
160 30S a
167 0 00E 167 030E
Figure 28 Measurements (meters) of 1965 uplift made in September 1976November 1977 and July 1979 The letters on the figure represent the places and amounts of uplift given in Table 2 The contours of uplift(contour interval - 02 ) represent one of the simplest interpretations of the uplift pattern consistent with the measurements (Taylor et al 1980)
64
TABLE 4 Uplift Measured Along the Coast of Northern Malekula
Year Number ofStation Place Name Measured Measurements a Southwest Bay 1977 observationb Bamboo Bay 1977 observation c Dixon Reef 1977 Id Lambubu Bay 1976 15 e West Bay 1976 5f Horrok 1976 Ig Brenwe 1976 4h Liwout Point 1976 1979 50i East Leviamp 1976 4j West Leviamp 1976 6k Elephant Point 1976 17I Win 1979 24 m Wihet Bay 1979 23 n Rambak 1979 30 o Npennanavet 1976 10P Matanvat 1976 4 q Potovrou 1977 1 r Atchin Island 1977 observations Wala Island 1977 observation t Norsup 1977 I u Lamp 1977 observation
Insufficient measurements for a standard deviation to be useful
Figure 29 Tsunami history of the Southwest Pacific Filled circles indicate locations of tsunaznigenic events dashed circles indicate inferred locations of tsunamigenic events
66
(12-17 m lida et al 1967) and 6 meters of uplift of the harbor at Port
Resolution (Warden and Mitchell 1974) Other earthquake generated
tsunamis have occurred in 1961 1965 and 2 in 1967 (lida et al 1967)
While major Pacific-wide tsunamis such as those generated along the South
American or Alaskan plate margins apparently do not affect Vanuatu
significant local tsunamis may be generated by large shallow earthquakes
occurring within the region
Volcanic Eruptions in Vanuatu
Volcanic activity is concentrated in the central belt of the Vanuatu
island arc Much of the present activity is confined to solfataric
eruptions however explosive eruptions are known (eg the 1878 Yasowa
eruptions)
In general the potential effects of a volcanic eruption on the
inhabitants of the islands of Vanuatu are small except for those people
who are living in the immediate vicinity of an active volcano However
evacuation of inhabited volcanic islands may be necessary in larger
eruptions Even distant volcanic eruptions such as those at Home Reef in
the Kingdom of Tonga during March 1984 produced large quantities of pumice
some of which rafted across large portions of the Southwest Pacific The
floating pumice interfered with shipping throughout the Southwest Pacific
region (SEAN Bull 1984)
IMPLICATIONS FOR MITIGATION OF EARTHQUAKE RISK
Several significant steps may be taken that will significantly
mitigate the loss of life and property from future earthquakes in Vanuatu
The following five steps provide suggestions for mitigation of the
earthquake risk
67
Earthquake Education
First an earthquake education program such as that adopted in Fiji
or Papua New Guinea is strongly recommended At minimal cost to the
Government such a program may be mounted through the schools Red Cross
programs and through the news media In other countries earthquake
education programs have taught simple methods of strengthening house
construction and minimizing hazardous conditions within the home they
have warned of tsunami hazards to coastal dwellers they have instructed on
proper behavior during an earthquake they have helped to encourage storage
of emergency food water and equipment in many households and
importantly they have helped avoid panic during an earthquake and
stimulated cooperation with government officials following such a disaster
Earthquake education programs are effectively combined with other disaster
preparedness programs (eg cyclones floods and so on) An example of
educational materials prepared by the Fiji Mineral Resou-ces Department is
included in Appendix IV
A few simple measures can be taken to reduce the likelihood of damage
to personal property A system of baffles in water reservoirs can reduce
the chances of seiches being set up in the tanks and the ultimate collapse
of the towex if the motion is large enough Large heavy objects should
not be put in high places where they can be easily dislodged unless they
are anchored in place This would apply to things like stereo speakers and
other objects that might be on shelves Products on shelves in stores and
books in offices can be restrained with wire retainers along fronts of
shelves Heavy objects that could tip over (such as hot water heaters and
gas tanks) can be fastened with anchoring bands This is especially a
68
concern with gas tanks which could fall over rupture lines and result in
fire
Building Codes
Second adoption of building codes for Vanuatu is imperative There
is a real danger of a large earthquake occurring very close to Port Vila or
Luganville In general the adequacy of construction is a major factor
controlling the damage and loss of life brought on by such an earthquake
Building codes designed for areas of similar earthquake hazard such as New
Zealand Code A California Building Codes or Papua New Guinea Codes 1 or
2 would be appropriate for Vanuatu Observation of such codes is most
crucial for public multistory buildings in the major towns of Port Vila
Efate and Luganville Santo As important as the design of such buildings
are the construction methods and guality of construction material used to
implement building design Careful monitoring of construction by competent
engineers is important for critical facilities The traditional houses
have kept down past losses of life and property but increasing population
and rapid urbanization can result in higher potential damage if
earthquake-resistant designs are not implemented One of the primary
reasons for property damage resulting from the Mere Lava earthquakes was
related to the siting of newer homes Houses located on steep slopes
suffered damage when they were not situated on competent substrate (Figure
30) The shaking of the fill and loose soils by the earthquakes caused
unconsolidated materials to shift under the foundations
Emergency Civil Defense Procedures
Third development of specific Civil Defense plans for emergency
procedures following an earthquake or tsunami should be initiated Of
69 a ) Poorly - situated house
and terrace e
house built too far over slope Rear
0 R
near cutting vertical and too backwall of house
bull e
b ) Earthquake- induced slope movements
-7 Rear cutting collapses pushingForward terrace edge - house orward
subsidesunder mining huefrad house foundation shy
Landslippage here
c) Well- situated house and terrace Good distancebetween house and
Good between
distance house
cutting
ond sopr I Rear cutting slope back and planted with natural vegetation
Figure 30 Sche7atic representation of causes of damage to poorly sited houses and suggestions for future house contruction in areas of loosely consolidated soil
70 course earthquake preparedness plans have much in common with hurricane or
other natural disaster planning but specific effects of earthquake
occurrence must be considered structural damage to multistory buildings
interruption of water supply disruption of electrical and gas lines
secondary geological effects such as ground liquefaction or landslides in
the near-source region complicating effects of aftershocks in the days and
weeks following a major earthquake The primary structure for such civil
defence plans already is in place in Tonga Programs specific to the
earthquake hazard may be added following similar programs in Fiji Papua
New Guinea and New Zealand
Long-term Seismicity Observations
Fourth long-term seismicity and strong motion observations should be
continued In the long-term such information will help to refine
estimates of seismic potential along the New Hebrides plate boundary they
will help to more directly and accurately assess the ground motion
parameters of direct concern to engineers for building design in
Vanuatu--ground acceleration frequency spectra horizontal and vertical
components of ground motion local amplification effects and so on
Furthermore seismicity patterns may provide a key to long-term forecasting
and short-term prediction of the location and size of future earthquakes
that may affect Vanuatus population
Internationa Cooperation
Fifth international cooperation among the island countries of the
Southwest Pacific and foreign agencies (eg US Geological Survey
ORSTOM etc) may significantly help in Vanuatus earthquake preparedness
program All of the countries affected by earthquakes (Vanuatu Western
71
Samoa Fiji Tonga Solomon Islands Papua New Guinea and New Zealand)
have to varying degrees developed earthquake preparedness programs
Vanuatu may take advantage of the previous current and any future efforts
of the other countries in the region
72-76
References
Atkin R J (1968) On volcanoes in the New Hebrides and Banks Islands Quarterly J of the Geologvical Society of London 24 305-307
Calder N 1972 The Rescless Earth A Report on the New Geology The Viking Press New York N Y
Carney J N and A Macfarlane (1979) Geology of Tanna AneityumFutuna and Aniwa New Hebrides Geological Survey Regional Report 71 pp Carney J N and R Campillo (1980) An investigation into damage causedby seismic activity on Mere Lava during May 1980 Geological Survey DeptOf Vanuatu Report
Chase C G (1971) Tectonic history of the Fiji Plateau Geol Doc Amer Bull 82 3087-3110
Chase T E B A Seekins J Daniel and J Y Collot (1983)Topography of the Vanuatu region map US Geological Survey Alexandria VA
Chatelain J L R K Cardwell and B L Isacks (1983) Expansion ofthe aftershock zone following the Vanuatu (New Hebrides) earthquake on 15July 1981 Geophys Res Lett 10 385-388
Chatelain J L B L Isacks R K Cardwell R Pr6vot and M Bevis (inpress) Patterns of seismicity associated with asperities in the centralNew Hebrides Island Arc J Geophys ResChinn D S (1982) Accurate source deths and focal mechanisms ofshallow earthquakes in western South America and in the New Hebrides island arc PhD Thesis Cornell University Ithaca NY
Chinn D S and B L Isacks (1983) Accurate source depths and focalmechanisms of shallow earthquakes in western South America and in the NewHebrides island arc Tectonics 2 529-563
Chiu J-M (1982) Structural features of subduction zone determined bydetailed analysis of short period seismic waves from earthquakes recordedin the New Hebrides island arc PhD Thesis Cornell University
Collot J Y J Daniel and R V Burne (1985) Recent tectonicsassociated with the subductioncollisioi of the DEntrecasteaux zone in thecentral New Hebrides Tectonophys 112 325-356
Coudert E B L Isacks M Barazangi R Louat R Cardwell A Chen JDubois G Latham and B Pontoise (1981) Spatial distribution andmechanisms of earthquakes in the southern New Hebrides arc from atemporary land and ocean bottom seismic network and from worldwide observations J Geophys Res 86 5905-5925
77
Dubois J J Lauray J Recy and J Marshall (1977) New Hebrides trench Subduction rate from associated lithospheric bulge Canadian J Earth Sci 14 250-255
Ebel J E (1980) Source processes of the 1965 New Hebrides Islands earthquakes inferred from teleseismic waveforms Geophys J Royal Astron Soc 63 381-403
Everingham I B (1984) Provisional list of felt earthquakes reports in Fiji 1941-1981 Min Resources Dept Fiji Note BP 338 17 pp
Falvey D A (1978) Analysis of paleomagnetic data from New Hebrides Bull Austr Explor Geophys 9 117-123
Geological Map of the New Hebrides Condominium scale 11000000 (1975)Ministry of Overseas Development (Directorate of Overseas Surveys) DOS 1196 British Residency Port Vila New Hebrides
Gilpin L M A L Bloom B L Isacks and M Bevis F W Taylor and C Jouannic (1982) Late Pleistocene coral reef terraces as tiltmeters on Santo Island Vanuatu (New Hebrides) EOS Trans Amer Geophys Union 63 430
Gutenberg B and C F Richter (1954) Seismicity of the Earth 2nd ed Princeton NJ Princeton University Press
Habermann R E (1984) Spatial seismicity variations and asperities in the New Hebrides seismic zone J Geophys Res 89 5891-590
Hamburger M W (1986) Seismicity of the Fiji Islands and Tectonics of the Southwest Pacific PhD thesis 312 pp Cornell University Ithaca NY
Hays W W (1980) Procedures for estimating earthquake ground motions U S Geological Surv Prof Paper 1114 77 pp
Ibrahim A K B Pontoise G Latham M Larue T Chen B Isacks J Recy and R Louat (1980) Structure of the New Hebrides arc-trench system J Geophys Res 85 253-266
lida K D Cox and G Pararas-Carayannis (1967) Preliminary Catalog of Tsunamis Occurring in the Pacific Ocean HIG University of Hawaii
International Seismological Centre (ISC) 1978-1979 Bulletin of the International Seismological Centre Newberry Berkshire United Kingdom
International Seismolog4 cal Centre (ISS) 1918-1963 International Seismoshylogical Summary Newbury Berkshire UK
78
Isacks B L and M Barazangi (1977) Geometry of Benioff zones Lateralsegmentation and downwards bending of the subducted lithosphere in IslandArcs Deep Sea Trenches and Back-Arc Basins Talwani M and W C Pitmaned Maurice Ewing Series 1 Amer Geophys Union Washington D C 99shy114
Isacks B L G Hade R Campillo M Bevis D Chinn J Dubois JRecy and J L Saos (1978) Measurements of tilt in the New Hebrides island arc in Proceedings of Conference VII Stress and StrainMeasurements Related to -Prthquake Prediction US Geological SurveyOpen-rile Report 79-370 176-221
Isacks B L R Cardwell J-L Chatelain M Barazangi J-M MarthelotD Chinn and R Louat (1981) Seismicity and tectonics of the central NewHebrides Island Arc in Earthquake Prediction An International ReviewMaurice Ewing Ser 4 edited by D W Simpson and P G Richards AGUWashington DC 93-116
Johnson T and P Molnar (1972) Focal mechanisms and plate tectonics ofthe southwest Pacific J Geophys Res 77 5000-5032
Karig D E (1971) Origin and development of marginal basins in the western Pacific J Geophys Res 76 2542-2561
Karig D E and J Mammerickx (1972) Tectonic framework of the New Hebrides island arc Marine Geology 12 187-205
Kelleher J J Savino H Rowlett and W McCann (1974) Why and where great thrust earthquakes occur along island arc J Geophys Res 794889-4898
Kroenke L (1984) Cenozoic Tectonic Development of the SouthwestPacific United Nations Econ and Social Commission for Asia and the Pacific Technical Bull 6
Lay T and H Kanamori (1981) An asperity model of large earthquakesequences in Earthquake Prediction An International Review Maurice EwingSer 4 edited by D W Simpson and P G Richards AGU Washington DC 579-592
Luyendyk B P W B Bryan and P A Jezek (1974) Shallow structure ofthe New Hebrides Island Arc Geol Soc Amer 85 1287-1300
Louat R J Daniel and B Isacks (1982) Seismicitd de larc desNouvelles Hebrides in Equipe de GOologie-GOophysique du Centre ORSTOM deNoumda Contribution Aletude godvnamique du Sud-Ouest Pacifique Travau et Documents de lORSTOM 1147 179-186
Mammerickx J T E Chase S M Smith and I L Taylor (1971)Bathymetry of the South Pacific map Scripps Inst of Oceanogr La Jolla Calif
79 Marthelot J-M (1983) Patterns of seismicity in the Vanuatu (NewHebrides) arc Regional variations and systematic evolution PhD Thesis Cornell University
Marthelot J-M J-L Chatelain B L Isacks R K Cardwell and ECoudert (1985) Seismicity and attenuation in the central Vanuatu (NewHebrides) islands A new interpretation of the effect of subduction of theDEntrecasteaux Fracture Zone J Geophys Res 90
McCann W R (1980) Large and moderate size earthquakes Theirrelationship to the tectonics of subduction Ph D thesis Lamont-DohertyGeol Observ of Columbia Univ Palisades NY
McCann W R S P Nishenko L R Sykes and J Krause (1979) Seismicgaps and plate tectonics Seismic potential for major boundaries Pure Appl Geonhys II_7 1082-1147
McGuire R K (1977) Effects of uncertainty in seismicity on estimateof seismic hazard for the East Coast of the United States Bull Seis Soc Amer 67 827-848
Mitchell A H G and A J Warden (1971) Geological evolution of the NewHebrides island arc J Geol Soc London 127 501-529
Mogi K (1963) Some discussions on aftershocks foreshocks andearthquake swarms--The fracture of a semi-infinite body caused by an innerstress origin and its relation to the earthquake phenomena (third paper)Bull Eartho Res Tnst Tokyo Univ 41 615-658
Monzier M J Y Collot and J Daniel (1984) Carte bathymetrique desparties centrale et meridionale de larc insulaire des Nouvelles-Hebridesmap Office de la Recherche Scientifique et Technique Outre-Mer (ORSTOM) Paris
Murphy J R and L J OBrien (1977) Analysis of a worldwide strongmotion data sample to develop an improved correlation between peakacceleration seismic intensity and other physical parameters ComputerSciences Corporation Rept NUREG-0402 to US Nuclear RegulatoryCommission 68 pp
Pascal G B L Isacks M Barazangi and J Dubois (1978) Preciserelocations of earthquakes and seismotectonics of the New Hebrides island arc JGeophys Res 83 4957-4973
Preliminary Determination of Epicenters (PDE) 1961-1981 MonthlyBulletin National Earthquake Information Service US Geological SurveyAlexandria Va
Pr~vot R and J L Chatelain (1982) Seismicity and seismic risk inVanuatu Report No 5-83 Centre ORSTOM Nouma New Caledonia
Richter C F (1958) Elementary Seismology W H Freeman and CompanyInc San Francisco
80
Rothe J (1965) The Seismicity of the Earth 1953-1965 Paris UNESCO 336 ppSanto T (1970) Regional study of the characteristic seismicity of theworld Part III New Hebrides island region Bull Earthquake Res Inst Tokyo Univ 48 1-18
SEAN (Scientific Event Alert Network) Bulletin 9
Taylor F W B L Isacks C Jouannic A L Bloom and J Dubois(1980) Coseismic and Quaternary vertical tectonic movements Santo andMalekula islands New Hebrides-island arc J Geophys Res 85 5367-5381
Taylor F W C Jouannic and A L Bloom (1985) Quaternary uplift ofthe Torres Islands northern New Hebrides frontal arc Comparison withSanto and Malakula Islands central New Hebrides frontal arc J of Geol 93 419-438
Trifunac M D (1976) Preliminary analysis of the peaks of strongearthquake ground motion--dependence of peaks on earthquake magnitudeepicentral distance and recording site condition Bull Seism Soc Amer 66 189-220
Trifunac M D and A G Brady (1975a) Correlations of peakacceleration velocity and displacement with earthquake magnitude andsite condition Intl J Earthquake Engr Struc Dynamics 4 455-471
Trifunac M D and A G Brady (1975b) On the correlation of seismicintensity scales with the peaks of recorded ground motion Bull Seism Soc Amer 65 139-162
Turcotte D L and G Schubert (1982) Geodynamics John Wiley amp Sons New York
US Geological Survey 1961-1985 Preliminiry Determination of Epicenters Denver Colo
Vidale J and H Kanamori (1983) The October 1980 earthquake sequencenear New Hebrides Geophys Res Lett 10 1137-1140
Wellington Seismological Observatory Geophysics Division 1953-1960 NZDept Scientific and Industrial Research Catalog of Earthuakes 1953-1960
Wray S T R K Cardwell B L Isacks E Cudert and J-L Chatelain(1983) Detailed seismicity observations in the forearc region of aconvergent plate boundary Malekula Island Vanuatu (abstract) EOS Trans Am Geophys Union 62 945
Wyss M R E Habermann and C Heiniger (1983) Seismic quiescencestress drops and asperities in the New Hebrides arc Bull Seismol Soc Am 23 219-236
81
APPENDIX I DEFINITIONS
Two measures of the size of an earthquake are magnitude and intensity
Magnitude is a measure of the energy from an earthquake source to indicate the
strength of an earthquake In comparison intensity is a measure of the amount
of ground shaking caused by the earthquake at a particular site Thus an
earthquake of a given magnitude will produce a wide range of intensities
depending largely on distance from the source
In general a small earthquake with a magnitude less than 5 may be felt
only in the area near the source and a moderate earthquake with a magnitude
between 5 and 7 will be felt over a wider area and may produce significant
damage in the area very close to the source A large earthquake refers to an
earthquake with a magnitude greater than 7 Such events are often very desshy
tructive if they are located near population centers A major earthquake
refers to magnitudes between 7 and 7 34 and a great earthquake refers to
magnitudes greater than 7 34 These great earthquakes cause widespread desshy
truction and possible regional tsunamis Generally the potential damage from
earthquakes is multiplied by the secondary effects of earthquake occurrence
such as ground faulting generation of tsunamis landslides slumping or
liquifaction
The depth of earthquakes range from the surface to approximately 700 km
depth Shallow earthquakes refer to those with depths between the surface and
70 km Intermediate earthquakes refer to those with depths between 70 km and
250 km depth Deep earthquakes refer to those with depths greater than 250 km
(but less than 700 km) Intermediate depth earthquakes occasionally produce
damage at the earths surface only if the earthquake is very large Deep
events are generally not felt
82
The seismic (earthquake) potential of a particular region is defined as
the likelihood of that region to experience a (destructive) earthquake within
particular magnitude range within a particular time period The seismic
(earthquake) hazard of a particular location refers to the amount of ground
motion that might be expected from an earthquake within or near that region
Adequate data on seismotectonic features instrumental (strong-motion) and
macroseismic (intensity) records of near-field effects of large earthquakes
source parameters of large earthquakes earthquake spectra and ground attenuashy
tion or amplification are necessary in order to reasonably evaluate earthquake
hazard for any region The seismic potential is the integration of all of
these bits of information The average length of time between earthquakes of a
particular size (recurrence interval) and the amount of time elapsed since the
last earthquake of that size help to define the probability of future earthshy
quake occurrence along a particular seismogenic zone hence the seismic
potential of that zone
Seismic risk of a particular region refers to the expected degree of
losses of people and their property which result from the seismic hazard and
the vulnerability in the region One method that has been widely used for this
risk determination (and is used here) involves the determination of a maximum
probable earthquake (design earthuake) that is likely to occur in the imshy
mediate region Calculations of seismic hazard which are based on design
earthquakes generally yield conservative estimates of risk
The most important conclusion of historical studies of seismicity is to
define the seismogenic zones of a region and extrapolate what the future earthshy
quake potential is for those zones Seismically quiescent regions refer to
regions with a lower level of seismic activity which are surrounded by more
83
active regions Portions of major plate boundaries that have not experienced a
major or great earthquake during a particular time interval are seismic Raps
This time interval is taken to be a significant portion of the earthquake
recurrence interval for a large earthquake An estimate to within several
decades of the location and size (magnitude) of a large earthquake constitutes
a forecast If a precise calculation of the time and probability of occurrence
can be added to the location and size information then the estimation is a
prediction
84
APPENDIX II MODIFIED MERCALLI INTENSITY SCALE (1956 VERSION)
Masonry A B C D To avoid ambiguity of language the quality of masonry brick or otherwise is specified by the following lettering whichhas no connection with the conventional Class A B C construction)
Masonry A Good workmanship mortar and design reinforced especiallylaterally and bound together by using steel concrete etc designed to resist lateral forces
Masonry B Good workmanship and mortar reinforced but not designed in detail to resist lateral forces
Masonry C Ordinary workmanship and mortar no extreme weaknessez likefailing to tie in at corners but neither reinforced nor designed againsthorizontal forces
Masonry D Weak materials such as adobe poor mortar low standards ofworkmanship weak horizontally
DESCRIPTION (INTENSITY VALUES RANGE FROM I TO XII)
I Not felt Marginal and long-period effects of large earthquakes
II Felt by persons at rest on upper floors or favorably placed
III atlt indoors Hanging objects swing Vibration like passing oflight trucks Duration estimated May not be recognized as an earthquake
IV Hanging objects swing Vibration like passing of heavy trucks orsensation of a jolt like a heavy ball striking the wallsStanding motor cars rock Windows dishes doors rattle Glassesclink Crockery clashes In the upper range of IV wooden walls and frames creak
V Felt outdoors direction estimated Sleepers wakened Liquidsdisturbed some spilled Small unstable objects displaced or upset Doors swing close open Shutters pictures move Pendulum clocks stop start change rate
iOriginal 1931 version in Wood H 0 and F Newmann 1931 Modified
Mercalli Intensity Scale of 1931 Bull Seis Soc Amer 53 979-9871956 version prepared by Charles F Richter in Elementary Seismology(1958) 137-138 W H Freeman and Company
VI Felt by all Many frightened and run outdoors Persons walk unsteadily Windows dishes glassware broken Knickknacks booksetc off shelves Pictures off walls Furniture moved or overshyturned Weak plaster and masonry D cracked Small bells ring(church school) Trees bushes shaken (visibly or heard to rustle--CFR)
VII Difficult to stand Noticed by drivers of motor cars Hangingobjects quiver Furniture broken Damage to masonry D includingcracks Weak chimneys broken at roof line Fall of plasterloose bricks stones tiles cornices (also unbraced parapets andarchitectural ornaments--CFR) Some cracks in masonry C Waves on ponds water turbid with mud Small slides and caving in alongsand or gravel banks Large bells ring Concrete irrigationditches damaged
VIII Steering of motor cars affected Damage to masonry C partialcollapse Some damage to masonry B none to A Fall of stucco and some masonry walls Twisting fall of chimneys factory stacks monuments towers elevated tanks Frame houses moved onfoundations if not bolted down loose panel walls thrown outDecayed piling broken off Branches broken from trees Changes inflow or temperature of springs and wells Cracks in wet ground and steep slopes
IX General panic Masonry D destroyed masonry C heavily damagedsome times with complete collapse masonry B seriously damaged(General damage to foundaticns--CFR) Frame structures if notbolted shifted off foundations Framed cracked Serious damageto reservoirs Underground pipes broken Conspicuous cracks inground In alluviated areas sand and mud ejected earthquakefountains sand craters
X Most masonry and frame structures and bridges destroyed Seriousdamage to dams dikes embankments Large landslides Water thrown on banks of canals rivers lakes etc Sand and mudshifted horizontally on beaches and flat land Rails bent slightly
XI Damage nearly total Large rock masses displaced Lines of sightand level distorted Objects thrown into the air
86 APPENDIX III EARTHQUAKE EDUCATION PAMPHLET PUBLISHED IN FIJI
EARTHQUAKE What to do how to help
-
bull - -C II
deg
Damage at Suva wharf caused by the 1953 -earthquakelw hich was followed by a tidal wave within 30 seconds
1 411_0- shy
87 from theA message Minister for Lands
Recent earthquakes in Waya tsunamis might be the most Island and the even more recent one effective means of mitigating which rocked the city of Suva short- the worst effects of a sudden ly after 9am on Decanber 171975 calamity in these two potentshyand the ensuing panic reaction of ially dangerous forms is to the people are sharp reminders to us know more about them that although Fiji is situated in an
Indeed the suddennessearthquake zone there is little in-the severity of a wideshyformation available to the public on and
spread disaster could disruptearthquakes and tsunamis (tidal which are often associated all communications and paralysewaves)
with the type of earthquakes we have even the most efficient and experienced in Fiji well-drilled emergency organishy
sation it is hopeZ that the infor-
Survival in those cirshymation pamphlet prepared by myministry on earthqkes and tsunamis Ceatnces would depend on
will allay some of the natural alarm each individuals own knowshy
which people exp -ence during even
the minor tremor- Because we are in an
It has been brought to my earthquake belt it would be
notice that at least one expert has prudent for people living in Fiji to make themselvespredicted the chance of a serious
earthquake in Fiji as 140 years thoroughly familiar with the
one earthquake every 40 years information contained in this pamphlet
However with the exception of the earthquake and tidal waves in I wish to take This 1953 we are fortunate not to have opportunity to appeal for your suffered a more serious earthquake full co-operation in answeringthe questionnaire on earth-
They are probably the most quakes and tsunamis which terrifying and devastating phenomena appears on page nine of known to man this pamphlet as accurately
Unlike other natural disas- as possible
ters such as hurricanes and flood- The aim of the ing the tragedy of earthquakes is questionnaire is to locate that there is no forewarning of their and map the fault-line zones coming from which it is suspected
The very recent earthquake that most of our earthquakes in Hawaii is an obvious in- originatedisaster
dicator that the science of predicting The success and the earthquakes is still in the early efficiency of any kind of stages of development emergency relief system may
Although the recent occurrence depend on your co-operation in Hawaii might not rank among the in providing the informationworlds most serious earthquakes we sought- SNWqanivavalagi
orldssrios msteathqakes weMinister for Lands and Mineralknow from the experiences of other Resources countries that earthquakes can be totally devastating
However remote the possibishyity of a serious earthquake and
2
88
7 -
Part of the damage to the Suva Harbour reef caused by the 1953 earthquake
70 per cent from FIJI area About 70 per cent of the masonry landslides or drowning
worlds deep earthquakes are recorded in the tsunami from the Fiji area Most of them are Another earthquake with not felt because they occur at great an intensity of four to five was depths of about 400 to 600 kilometres ecperienced in Suva in 1961but (24845 to 37267 miles) beneath thecasdolmirdmget
surfac of te ebuildings
These types of earthquakes are not dangerous or damaging because of the depths at which they occur ButOtra they ore scientifically interesting
because they help geologists to deduce
the structure of the crust
The types of earthquakes which can be very damaging are those of large magnitude which occur in thebecase tey Todedueelp eolgist top 50 kilemetres (3106 miles) of the earths crust
The 1953 earthquake which hcd on epicentre (origin) 15 miles west of Suva was of this type That earth-quake had an intensity of seven out of a Mercalli scale of 12 and result-ed in a tsunami (tidal wave) which occurred 30 seconds after the quake and affectedoiSuva and davu About seven people were killed by falling
Several smaller shocks have been reported since then
w here re oftenearthquake fe arrtua aaso avun
fhlare laldes odrwi savu Taveuni and recentlythe WayA - Nadi - Lautoka area
Reports received after the 1953 earthquakes also show f l itle dmage incstes t that several very strong earthshyquakes have been felt in the
Fiji area since the early 1800s A o the
caused lthu d thse in tha the increasing density of popushyltion and buildings would make the area more prone to damage unless buildings are properly reinforced to withstand strong lateral motions from earthrukes
89 Quakes come In two main types
Volcanic earthquakes are asso-ciated with the movement of molten rocks underground usually at depths of less than 30 kilometre5 near active or inactive (at surface) volcanoes
These volcanic earthquakes are
often called tremors because they tend to occur frequently and almost continuously and are often associat-ed with possible forthcoming erupt-ions of volcanoes
Fortunately it has been over a million years since volcanoes erupted in most parts of Fiji al-though the most recent volcano was probably active less than 2000 years ago in the Taveuni area
Because of the long period of
time since previous eruptions vol-
canoes in most parts of Fiji can be or least inshyconsidered extinct at
active
The possibility of another
eruption occurring at some future time cannot be totally discounted
But it should be reassuring to note that with modern advances in instru-mentation it is becoming increasing-ly possible to predict the likeli-hood of impending volcanic activity
Tectonic earthquakes the other
major (and more common) type are due
to the movements of relatively solid parts of the earths crust against each other
Such motions c 3n be in the form of the swallowing of a large portion (or plate) of the crust into a trench area
For example the Eastern Pacific plate is postulated to be drifting westward at the rate of about 10 centimetres (roughly 394
inches) a year and is being swallowed or subducted under the Western Pacific plate in the Tonga trench area
The subduction of one plate under another causes friction between the plates and causes numerous earthquakes fortunately at great depthsshyabout 500 to 600 kilometres (31056 to 37267 miles)
Tectonic earthquakes occur also along fault lines which are zones of weakness in the earths crust usually at fairly shallow crustal depth
Geologists have mapped a number of fault areas in Fiji where it is apparent that one rock mass has been moved (or displaced) relative to an
adjacent rock mass through the release of stresses and strainsbrought about during the geoshylogca dvlp n the islands
Fortunately again most
of the faults which have been mapped are thought to be inshyactive
But there are some fault zones which could be active and it is quite likely that the strong 1953 earthquake was caused by fault movement offshyshore from the Kalokolevu shyso ara
The recent earthquakes felt in the Waya - Nadi -Lautoka area could be due to fault movements several miles offshore south-west of Waya
In 1976 the Mineral Reshysources Division intends to do
detailed mapping of these possibly active fault-zone areas near Suva and in the west of Waya
Other plans are for the division to make greater use of instruments and become inshyvalved in the recording of earthquakes
9
THE MAIN DANGERS Collapse of buildings due to
lack of reinforcement poor building materials (eg adobe type) or un-satisfactory foundations
Broken overJ ead power lines can
occur quite easily and are partishy
cularly dcnprous because many people have the inclination to run outdoors when they feel a strong earthquake
Landslides are possible alongLandlidsposibe aongofae fault zones or very wet areas pbrti-cularly where hillsides are steep
One person was killed in the Namosi area by landslides during the 1953 earthquake
Earth movements and chasms People naturally tend to have a very strong fear that the earth will open up and swallow them during an earth-quake However there is only one pro-perly documented case in recorded history of a person being crushed in a fissure Basically the danger of falling into chasms is minimal and the natural terroz of people from this is apparently the result of ex-
Fire can be one of the most dangerous effects of earthquake as evidenced by the disasters in Son Francisco in 1906 and Tokyo in 1923 Perhaps the worst problem from fires caused by earthquakes is that water pipes are often broken and firemen are forced to use less accessible alternative sources such as a river or the sea
Tsunamis are a particular kind
of sea wave which can build up follow-ing an earthquake In the past they have devastated cities and small settlements along the coasts of Chile Peru Alaska Hawaii Japan and other countries These waves travel across the Pacific Ocean at jet speed (more than 600 miles an hour)
In shallow wters t5unamis become a threat to life and property because they can reach up to miore than 100ft high at wave crest levels and strike with devastating force
5
We have no official record of any extensive tsunamis in Fiji except for the one caused by the 1953 earthquake which claimed some lives in Suva andKadavu
Other tsunamis are likely to have occurred in earlier times but were not identified especially as tsunamis becauseour lack of experience with them
The barrier reef round much of the islands helps to dissipate some of the wave
energy and therefore some ofthe dangers
But we should realise that we can still bevulnerable to waves especially from a southerly direction where our reef systems are less extensive
If a very strong earthshyquake is felt in Fiji you should prudently assume that it has originated within the Fiji group and is likely to have generated a tsunami
In the 1953 case the tsunami was about csft high when it hit the reef outside Suva within 10 seconds after the earthquake
A 6ft wave then travelled across the harbour and hit the waterfront about three to four minutes later causing only
slight damage and leaving many
But the tide was low at that time If it had been high tide the waves could have been about 9ft high and the effects could have been disastrous
Waves 5ft to 6ft high
also hit Lami Deubq Be--Island and Koro Island and a 15ft-high wave claimed two lives at Nakasaleka Kadavu Smaller waves were felt at Ovalauthe southern coast of Vanua Levu and in the western Lou Group
Precautons to take Because earthquakes occur
suddenly and without warning there ore only a few precouton5 people can take such as ensuring that houses are on firm foundations and are suitably reinforced to withstand earthquakes
The following modified version of on earthquake notice is reproduc-ed from a California Geology article published in October 1975
When an earthquake occurs For a minute or two the earth may pitch and roll like the deck of a ship The motion is frighteningbut unless it shakes something down on you it is probably harmless in itself Keep calm and ride 4t out Your chances of survival are good if you know how to act
During the shaking If indoors stay indoors Got under sturdy fur-niture such as a table Stay near the centre of a building and stay away from glass Do not use condles matches or other open flames
Do not run through or near buildings particularly concrete ones where there is danger of fall-ing debris If outside stay in the open away from buildings and power lines
If in a moving ccr stop but stay inside
After the r akinq Check your water and electricity
If water pipes are damaged or electric wires are shorting turn off at primary control point If in a low-lying coastal area which can be affected by tsunamis leave house and make for higher ground (see tsunami safety rules below) Turn on radio for emergency bulletins Stay out ofaamaged buildings- aftershocks can shake them down
In a 1961 study of earthquake risks in Fiji RHoutz estimated that the chance of a strong quake occurring here -was about 140 ie
6
once every 40 years This figure should be reassuring But one must remember that it is only an estimate -and that once in 40 years could be toshymorrow
Tsunami Safety Rules Tsunamis follow no disshy
cernible pattern of occurrence When you receive a tsunami warning you must assume that a dangerous wave is on its way
History shows that when the great waves finally strike they claim those who have ihed the wnin ve
ignored the warning The following tsunami
rules were extracted from a pamphlet prepared by the US Environmental Science Services Administration and they should be noted 1 An earthquake in your
area is a natural tsunami warnshying Do not stay in 1-yving coastal areas after a strong local earthquake
2 A tsunami is not a single wave but a series of waves Stay out of danger areas until on all-clear is issued by a competent authority
3 Approaching tsunamis are sometimes heralded by a noticeshyable rise or full of coastal water This is nature s tsunami
warning and should be heeded 4 A small tsunamiat one
beach can be a giant one a few bea a Do nt le the milesaway Do not let the modestse ofowve ma you lose reect for whut may follow
5 All tsunamis - like hurricanes -are potentially dangerous even though they may not damage every coastline they strike
6 Never go down to the beach to watch for a tsunami
92
yocn thetoo L see wave you are After 5Oft
too close to escape it
7 Sooner or later tsunamishit visit every coastline in the Pacific Warnings apply to yollif you live in Suva reef any Pacific coastal Olrea
8 During a tsunami emergency A section of the Suva Harbour reef your local emergency organisations forced upwards by the 1953 earthshywill try to save your life Give quake A tsunami -(tidalwave) 50ft them your fullest co-operation high hit the reef within 10 seconds
Unless otherwise determined by after the quake and sent a 6ft wavecompetent scientists potential to the shoreThis struckdanger areas are hose less than watershyfront about three to four Ainutes 50f above sea level and within one later and caused minor Cdamage but
mile of the coast for tsunamis of only because it was at low tide any origin
7
Measuring their size Earthquake magnitudes are
measured on very sensitive seismolo-
gical instruments Theseare often referred to as the Richter scale and the largest shock known to date had a magnitude of 89 on Richter scale (compared to 675 for the 1953 Suva earthquake on the same scale)
hat is in commonAnother scale use and depends on physical effects and observations is the modified Mercalli scale which is reproduced here It measures the intensity of earthquake and is graduated from one to 12 for measuring
Modifiedl Mercalli scale1956 versiont
Earthquake intensity
1 Not felt except by a very few under especially favourable (for
the arthuak)crcustanesamountsthe earthquakes) circumstances
2 Felt only by a few persons at rest especially on upper floors of buildings Delicately suspended objects may swing
3 Felt quite noticeably indoors especially on upper floors of build-ings but many people do not recog-nise it as c earthquake Standing motor cars muy rock slightly Vib-ration like passing truck Duration can be estimated
4 During the day felt indoors by many outdoors by few At night some awakened Dishes windowsdoors disturbed walls make creaking sound Sensation like heavy truck striking building Standing motor cars rocked noticeably
5 Felt by nearly everyone many
awakened Some dishes windowsetc broken a fewinstances of cracked plaster unstable objects overturned Disturbances of trees poles and other tall objects sometimes noticed Pendulum clocks may stop
6 Felt by all many frightened
and run outdoors Some heavy furni-
ture moved a few instances of fallen plaster or damaged chimneys Damage slight
8
7 Everybody runs outdoors Damage negligible in buildings of good design and construction slight to moderate in wellshybuilt ordinary structures considerable in poorly built or badly designed structures some chimneys broken Noticed
by persons driving motor cars
8 Damage slight in specialshyly designed structures conshysiderable in ordinary substantshyial buildings with partial collapse great in poorly built structures Panel walls thrown out of frame strucTures Fall
f fameystrctresasof chimneyq factory stcks
columns monuments walls Eeavy furniture overturned Savy fniur e -turned
Sand and mud ejected in small Changes in well water
Disturbs persons driving motor
cars 9 Damage considerable in
specially designed structures well-designed frame structures
thrown out of plumb great in substantial buildings with partial collapse Buildings shifted off foundations Ground cracked conspicuously Undershyground pipes broken
10 Some well-builtwooden
structures destroyed most masonry and frame structures destroyed with foundations ground badly cracked Rails bent Landslides considerable from river banks and steep slopes Shifted sand and mud Water splashed over banks
11 Few if any (masonry) Ltructures remain standing Bridges destroyed Broad fissures in ground Underground pipelines completely out of service Earth slumps and land
slips in soft ground Rails bent greatly
12 Damage total Waves seen on ground surfaces Lines of sight and level distorted Objects thrown upward into the air
FILL THIS IN TO HELP THE EARTHQUAKE STUDY
To enable an improved study of shallow local earthquakes the coshyoperation of the public is required in filling out the following questionshynaire whenever an earthquake is felt Many earthquakes are very small and sometimes are not recorded on seismological instruments This questionnaire system will enable the Mineral Resources Division to better determine the location of earthquake zones which can then be mapped in detail
EARTHQUAKE QUESTIONNAIRE
1 An earthquake was felt on at am or pm
Place
2 What direction did the shock come from
o ooo mge oe e o o o o
3 How many seconds did the quake last
4 Was the shaking rapid or slow
5 Where were you when the earthquake occurred
6 Were you awake asleep or awakened
7 Were you walking working standing sitting or lying down
8 Did the people around you feel the earthquake too
9 Did people run outside
10 Did cracks occur in the buildings you were in
11 Was the building damaged in any otherway
o
12 What is the building made of
13 Did the windows doors dishes rattle
14 Did hanging objects doors etc swing 0000000000600
Turn to next page 9
95 15 Did vases small objects furniture overturn
e
16 Did things fall off shelves
17 Did you notice any unusual waves in the sea after the quake 00 0a -0 0 000aV0a0a0 000000a000 00
18 1f so h6w soonafterwards 0 BO
e a 0000000amp000000000amp0000 a a
What were the waves like 00000619
20 Did anything else unusual happen
0 o a o e e o o 0o e o e e eo o eo 6 o e e e oIe e e o o o adegdeg e odegI e o o oo oo oe 1 8 aampv a
21o Any other remarks e
N me a
Complete formtear out this whole page and mail to
The Director of Mineral Development Mineral Resources Division Private Bag GPO SUVA
This special booklet is published by the Ministry of Information at Government Buildings in Suva for the Ministry of Lands and Mineral Resources
(JANUARY 1976)
10
96
In the wake of the 1953 quake
1M
Crack in the coral
A -rac) in the main Suva reef after the earthquake and tidal wave in 1953
12
T SANERIVE Government Printer Suva Fiji
98
APPENDIX IV SEISMOLOGICAL FACILITIES AND EARTHQUAKE HAZARD PROGRAMS IN THE SOUTHWEST PACIFIC
As part of our program of field investigations in Fiji Tonga andVanuatu our researcher was able to visit the neighboring island countries of the Southwest Pacific region During these visits he was able to meetwith scientists and public officials involved with the earthquake hazard problem facing each country In every case the governments are aware ofand have taken some action to mitigate the potential losses due to destrucshytive earthquakes but these governmental responses have varied widely fromcountry to country This report focusses on the seismological institutionsand facilities in each of the countries and their capablities in assessingand planning for carthquake hazards In the following sections we conshysider each of the island countries of this area which face a severe earthshyquake risk Fiji Tonga Vanuatu Western Samoa Solomon Islands PapuaNew Guinea and New Zealand
FIJI
Seismological Facilities
Seismological observations in Fiji are conducted by the Mineral Resources Department a subdivision of the Ministry of Energy and MineralResourcs The government has made a major commitment to seismologicalwork since the establishment of the AID-supported seismic network in 1979In fact seismological observations in Fiji have been carried out since theearly part of this century supported at first by the New Zealand scienshytific organizations and subsequently strengthened by Lamont GeologicalObservatorys Upper Mantle Project in the 1950s and 1960s In late 1979the 8 -station US AID network was established to complement three permanent stations in Viti Levu The network was significantly expanded byinstallation of a five-station telemetered network in 1981 supported byJapanese aid (Figure Al) Additional stations were installed in 1983 and 1984 the network has now expanded to an eighteen-station national networkwith excellent coverage of the Fiji region In addition MRD now has available five MEQ-800 portable seismographs for occupation of temporaryfield sites telemetered station testing and special refraction experiments While the Fiji network has experienced considerable technical difficulties it has recorded over 2000 earthquakes since its installationand provides an invaluable basis for seismological study of the Fiji region
Strong Motion Accelerographs
The Mineral Resources Department also operates a network of strongmotion accelerographs now numbering ten Kinemetrics SMA-ls (Figure A2)The initial six instruments of this network were granted to Fiji by AIDthe remainder were purchased by the Fiji government Since establishment of the SMA network three accelerogram records have been obtained from moderate-sized earthquakes in Viti Levu Records obtained from thisnetwork are expected in the long run to provide the basis for predicting
tTT Illt EAST OF +NWICH IS0 WEST OF GREENWICH III
Y 7sdeg NATIONAL NETWORK OF SEISMOGRAPHIC STATIONS 1982
AC7
DEELLAAIKOORROOMTRE
23O~~~~ ROTUMU
YASAWAIRAR C1
00
A0 KORO
-W
0
I VUNH SOUTHRIOGE A
~)AVALAU 0
NADI A A ONASAVULAU
MAGOORO A VUNIOAWALAU
VIT LE U _LAKEPe NAMOSI AUNIAA -GAJ
ALOAA0A NAMORO SUVA
VITICLEVU
13 BEOA
LEGEND A E-isting Station
I RAKRAKI A Proposed Station Toloyo
Motulu Fuloo amp
EAST OF GREENWoICH ISO WEST Of GREENWICH ITS
Figure Al Network of seismic stations in Fiji established through the assistance of US AID and Japanese aid programs
_ _ _1_ Q__
NATIOqAL NETWORK OF EAST
STRONG OF OEEwICH
MOTION IO WEST 0 OREV-1CM
ACCELEROGRAPHS 79
LEGEND
A Accelerograph
0 30 60 KLOLETRES
LBS
YASAWA
lt ---shyVANUA LEVU U
T EUW r
S|bullKORO 0
T
V2anua bala~u
N
0
LA IV)DI A MON~ASAVU V
9LAU
VITI LEVU OKA1)
(4)
GAU
LAKE1A
0 11-
Kld
A S T O r
Maluku
GREN Wa
Toloyc
I 0 W E S T O f C REEM CN I
Figure 2A Location of strong-motion accelerographs in Fiji
100
ground accelerations and thus for development of building codes specific to Fijis tectonic setting
Related Scientific Programs
The Mineral Resources Department includes an Offshore Geology sectionwhich has an active program of marine geological and geophysicalinvestigations in and around Fiji waters MRD also employs an engineeringgeologist whose work includes microzonation of the Suva area mapping ofactive faults in southeastern Viti Levu and investigation of soils subjectto earthquake-induced liquefaction An active program of geologicalmapping and structural studies is also carried out by MRD They aresupported by personncl assistance from Australia and Great Britain
Suva is also the home of the United Nations Committee for Coordinationof Offshore Prospecting in South Pacific Offshore Areas (CCOPSOPAC) Thisorganization coordinates much of the international marine research carried on in the region and has been particularly helpful with Fijisinvestigation of its offshore waters
Critical Facilities
The major development in Fiji has been in and around the capital cityof Suva The population of the metropolitan area now exceeds 130000 and most of the government commercial and industrial operations are concentrated there The city has become a major commercialtransportation and regional political center and has developed rapidly inthe past ten years Development in this period has included constructionof multistory buildings a major electric power plant expansion of theSuva harbor and most recently completion of the thirteen-story CentralMonetary Authority building in downtown Suva Much of this development hastaken place on an area of filled land close to sea level particularlyvulnerable to earthquake and tsunami damage This area was extensivelydamaged by the 1953 Suva earthquake and tsunami and is thus at significantrisk from a repeat occurrence of an event of comparable size
Other population centers with significant development include thetowns of Lautoka (pop 29000) Nadi (13000) and Ba (9000) on the islandof Viti Levu and Labasa (13000) on Vanua Levu The tourist industrywhich is a major part of Fijis economy is concentrated on the southernand western coasts of Viti Levu and is also vulnerable to earthquake andtsunami damage The major development project in Fiji is the 87-meter highMonasavu Dam in the interior of Viti Levu The earthfill dam was completedin 1983 and is planned to provide most of the countrys electric powerneeds through the end of the century
Earthquake Preparedness Programs
In awareness of the serious earthquake risk to development in Fijithe government has adopted New Zealand earthquake design codes for most ofthe urban areas of the country Seismic zone B codes applicable to areas of moderate seismic activity in New Zealand have been chosen asappropriate and are applied (in theory at least) to all domestic andcommercial construction in urban areas Considerable difficulty remains in
101
enforcement of these regulations particularly in construction of privatedwellings Major multistory building design is generally handled by overseas (Australia or New Zealand) engineers and dynamic modelling tests are generally applied for earthquake loadings at least as large as those required by the New Zealand codes The Monasavu Dam underwent dyiamictesting by Australian consulting engineers
Disaster preparedness is the responsibility of the Emergency Services Committee (EMSEC) and the Prime Ministers Relief and Rehabilitation Committee (PMRRC) EMSEC is responsible for coordination of disaster plans maintenance of essential services advice to the Cabinet on emergency measures and direction of relief work It is comprised of representativer of the related ministries and public agencies PMRRC is chaired by the Prime Minister of Fiji and has responsibility for long-termrelief policy and rehabilitation programs Fijis experience with recurrent weather-related disasters has spurred efforts for emergencycommunication systems supply distribution temporary shelters and so on Much of this hurricane disaster planning is applicable as well to earthquake and tsunami damage Fiji is also a participant in the International Tsunami Warning System
Educational programs have been handled through the Fiji BroadcastingSystem the Red Cross and the school sysem To a limited dgree the Public Works Department and the Mineral Resources Department have producededucational materials related to earthquake hazards in Fiji
TONGA
Seismological Facilities
Seismological observations in Tonga are the responsibility of the Ministry of Lands Surveys and Natural Resources Due to fiscal constraiits however these efforts have in the past been entirelydependent on foreign assistance Seismological experiments began in Tongain the mid-1960s with Lamont-Dohertys Upper Mantle Project Seismic stations were operated by Lamont-Doherty and subsequently by Cornell scientists through the early 1970s when operations were suspended In late 1983 as part of the present AID-supported seismic hazard programCornell reinstalled a three-component short-period seismograph in the capital Nukualofa The seismograph was installed upon the request of the government geologist to be operated by the Tongan government with technical assistance from Cornell Unfortunately after operation of the seismograph for eight months Tongas Cabinet decided that the drain on its resources and personnel was excessive and the instruments were disconnected in May 1984 with the components transferred to Fiji and Vanuatu where they can be utilized There are presently no plans to reinstall permanent seismographs in Tonga
Strong Motion Acceierographs
Two strong-motion accelerographs provided by the AID seismic hazard program are presently operating in Tonga one in Nukualofa and one in the northern Vavau Islands They have been in operation for one year and
102
have not to date recorded any large earthquakes They require a minimum of maintenance and their operation will continue to be supervised by the government geologists with assistance from Cornell A third accelerograph may be made available to tonga by the British Geological Survey and could bB installed on Eua Island in a zone of high activity close to the Tonga Trench Related Research Programs
The Ministry of Lands Surveys and Natural Resources employs a singlegovernment geologist whose responsibilities include coordination of oil prospecting geolcgical mapping of the islands and assessment of earthquakeand tsunami hazards There has been considerable scientific study of the Tonga Trench subduction zone by research groups from the United StatesJapan New Zealand Australia Germany and the Soviet Union More detailed marine geophysical data have been collected near Tongatapu Island byAmerican petroleum exploration groups
Critical Facilities
The capital city of Nukualofa has a population of only 20000 butdoes include several three- and four-story buildings The larger buildingshave in general been designed by foreign engineers and have included earthquake- resistant design specifications Other significantdevelopment projects include the expansion of the government wharf in Nukualofa and development of tourist resorts on Tongatapu and several of the outer islands
Earthquake Preparedness Programs
There are no building codes presently enforced in Tonga Howeverconstruction of public buildings must be approvei by the Ministries of Works and Health The largest office buildings and hotels are designed byoverseas engineering firms and generally include some earthquake loadingcriteria The Land and Environment Act currently under consideration bythe Tongan government would require review of all development projects bythe government planner application of building codes largely adapted from New Zealand codes is expected to follow
Disaster preparedness programs are the responsibility of the Cabinets National Disaster Committee including representatives from the related government ministries and departments Subcommittees focus on disaster preparedness action planning and long-term relief and rehabilitation There is no earthquake education program in Tonga
WESTERN SAMOA
Seismological Facilities
One of the earliest seismic stations in the Pacific was established atthe Apia Observatory in 1902 during the German colonial period through the University of Gbttingen In 1921 control of the observatory was transferred to the New Zealand Government Weichert seismographs were
103
operated continuously at Apia through 1957 when they were replaced by Benioff instruments at Afiamalu and by short-period Wood-Anderson instruments at Apia Since Samoan independence in 1963 the Observatory has been operated jointly by the Samoan Government and the Department of Scientific and Industrial Research (DSIR) New Zealand In 1963 a Worldwide Standard Seismograph Station was established at Afiamalu Operation of this six-component station is supported by the US Geological Survey In 1980 the station was upgraded to allow digital reccrding equipment was added to upgrade the station to the status of a Global Digital Seismic Network station Seismic records are sent to DSIR in Wellington for permanent storage
Strong Motion AccelerograDhs
A simple strong motion instrument has been operating in Apia since 1979 It is an event-triggered low-gain seismograph recording on an ink-stylus recorder At the time of our visit to Western Samoa the instrument had been out of service for several months Only one event has to date triggered the instrument
Related Scientific Programs
The Apia Observatory has also made continuous magnetic field measurements since 1905 Measurements are currently made using a Schultze earth inductor an Askania declinometer and a proton magnetometer The observatory maintains two tide guages as part of the Pacific Tsunami Warning System Offshore resource studies have been carried out through CCOPSOPAC and by various international research groups Much of the reconnaissance geological work in Western Samoa has been carried out by DSIR in New Zealand
Critical Facilities
Like many of the other island countries of the Pacific Western Samoas development has been concentrated around the capital Apia (pop 34000) A major deep-water harbor and the countrys tourist industry are based in Apia Several multistory buildings have been erected in Apia in the past several years A hydroelectric dam on Upolu Island was completed in 1978
Earthquake Preparedness Programs
There is presently no disaster plan in effect in Western Samoa The various agencies involved with emergency action are coordinated through the Police Commissioner New Zealand seismic zone B codes are applied to construction in Western Samoa Enforcement is handled by the Public Works Department Modest educational materials have been prepared by the Apia Observatory staff in English and Samoan for distribution through schools and public agencies
104
SOLOMON ISLANDS
Seismological Facilities
Seismological Observatories in the Solomon Islands are conducted bythe Ministry of Lands Energy and Natural Resources They have operated aWorldwide Standard Seismic Station in Honiara since 1962 operation of the station is supported by funds from the US Geological Survey The station was augmented by two short-period telemetered seismic stations in 1982 This three-station necwork was provided through the British GeologicalSurvey with the aim o identifying volcanic earthquakes associated with theactive volcano Savo located close to the capital
In awareness of the high volcanic risk to population centers in theSolomon Islands the Ministry has drawn up plans for two three-station telemetered arrays to be deployed around the active volcanoes on Simbo Island (New Georgia Group) and on Tinakula Island (Santa Cruz Group) Theyare presently seekirg foreign aid in the form of seismic instrumentation and technical asistance to establish the network
The Ministry also has responsibility for field surveys following majorearthquakes in the Solomon islands Studies of ground deformation and cultural effects of the large 1977 and 1984 earthquakes were made by seismology officers
Strong Motion Accelerographs
Two strong motion accelerogaphs were installed on Guadalcanal by theMinistry in late 1984 They will be responsible for maintaining the instruments but have requested Cornells assistance in analyzingaccelerograms obtained during their operation The high level of shallow activity near Guadalcanal suggests that a significant number of strong-motion records will be obtained during the lifetime of the instruments
Related Scientific Programs
The Ministry also carries out related research programs in regionalgeology minerals assessment groundwater studies and so on Extensive marine surveys have been caried out in the Solomon Islands by the USGeological Surveys Resource Assessment Program Local offshore surveyshave been carried out through CCOPSOPAC A tide gauge is maintained bythe Solomon Islands Hydrographic Unit Six proton-precession magnetometers are operated in the Solomon Islands by the Queensland University (Australia)
Critical Facilities
Over 90 of the Solomon Islands population remains in rural areas The major development is in Honiara the administrative and commercial center of the country Honiara (pop 15000) is the major shipping center of the country and now includes several multistory buildings
105
Earthquake Preparedness Programs
The Solomon Islands implemented a National Disaster Plan in 1980 subsequently revised in 1982 The Plan gives the Ministry for Home Affairs and National Development overall responsibility for coord~lation of efforts in earthquake volcanic and tsunami disasters Operational relief effort are carried out through the Disaster Operations Coordinator and the Provincial governments
The government has adopted the most stringent earthquake building code (Zone A) from New Zealand for multistory building construction in Honiara Implementation of these guidelines continues to be a problem One multistory building in Honiara (Australian High Commission Building) was severely damaged during the 1984 earthquake Some efforts have been made to develop small-scale earthquake-resistant building techniques appropriatefor rural areas The Pacific Islands Development Program organized a model house construction and workshop during early 1984 A modest outreach program has developed through the school system adult education programs and the government broadcasting company
PAPUA NEW GUINEA Seismological Facilities
The government of Papua New Guinea has made an extensive commitment to earthquake and volcanic hazard mitigation through construction of a national network of seismographs and accelerographs (Figure A3) A ten-station national network of seismographs is monitored by the Port Moresby Geophysical Observatory (Department of Minerals and Energy) Three of the remote stations are telemetered to Port Moresby via microwave links four stations operate as permanent field stations and two are operated at temporary sites on outlying islands Port Moresby is presently the site of a Worldwide Standard Seismic Station that has operated since 1958 The national network reports arrival times to the US Geological SurveysPreliminary Determination of Epicenters and the International Seismological Centre but does not routinely locate events independently
In addition to the national seismic network the Rabaul VolcanologicalObservatory operates seven seismic stations near active volcanoes around the country and a nine-station telemetry network around the Rabaul Caldera Bougainville Copper Limited opeates a 5-station network on Bougainville Island (North Solomons Province)
Strong Motion Accelerographs
The Port Moresby Geophysical Observatory maintains a national network of thirteen strong motion accelerographs distributed in the highly seismic areas of the country (Figure A3) This includes a closely spacedfour-station network around the Rabaul Caldera A single strong motion accelerograph is situated on Bougainville Island and is maintained byBougainville Copper Limited The network uses Kinemetrics SMA-I and New Zealand DSIR MO-2 instruments and has recorded tens of accelerograms since its establishment in 1967 The Observatory ispresently trying to to establish an engineering seismologist position to analyze the accumulating data and to further upgrade the accelerograph network
I I I I I I I I I I
Re--o -joso shy
Mooo u J4D (Ro-js
bull~~vASeA saxA+ Samp-cUong sloon
(twu lueoaott koRowq (KvG) jjj ccurodAj a~OlF
Accv~tj (8~Cli
Raboul (PART 2bLo(MOG) C GoTo and -4-A Duke of Tok
vie W~~IiTUI = a
Rogno SGA Kowumbukae0
lebub-gn ITPAc l-O MARCH agno BGAI
Tank ( F -goono PAAl
Coo Glooclslb Island I OSOGRAP SEISM A-D ACCELEOGR -
_____ L I IS IIsI I I
IPUGI
PAPUA NeW GUI NEeAr rp n w k
hTTWORKS MARCH 1384
IG -nol 1v
Figure A3 Papua New Guinea seismograph and accelerograph networks a
107-108
Related Scientific Activities
In addition to the Geophysical Observatory the Department of Mineralsand Energy includes the Geological Survey of Papua New Guinea The Surveyundertakes a wide range of geological investigations including regionalgeological mapping petroleum and mineral exploration engineering andenvironmental geology and energy resource development Offshore surveyshave been carried out through CCOPSOPAC as well as American and Austrrlianresearch vessels Continuous monitoring of the magnetic field is carriedout by the University of Queensland (Australia) Ten tiltmeters have beendeployed by the Volcanological Observatory to monitor ground deformation near Papua New Guineas active volcanoes Four of these instruments are deployed around Rabaul Caldera
Critical Facilities
Papua New Guinea is the most developed of the island countries of theSouthwest Pacific with a population of over 3000000 and extensive urbandevelopment The capital city of Port Moresby has a population of over 130000 with major multistory construction in the downtown area a majordeep water harbor and significant commercial and industrial activity in thePort Moresby area There is significant development as well in the smaller towns of Rabaul Lae Madang Wewak Goroka Mount Hagen Wau BuloloDaru and Kerema Major hydroelectric schemes have been established on theRamu and Rouna rivers with additional hydroelectric plans at various stages of evaluation and development Extensive mineral development hastaken place in the North Solomons Morobe and Western provinces of PapuaNew Guinea Extensive natural gas and limited oil deposits have beenlocated these may become commercially exploited in the near future
Earthquake Preparedness Programs
Papua New Guinea has a long history of earthquake and volcano-relateddisasters A national disaster program was established in 1981 and provides for a National Disaster Emergency Committee which formulates emergency government policy and a Disaster Civil Defence Committee which is responsible for implementation of short-term relief efforts Theprovincial governments are given major responsibility for initial coordination and assessment of disasters assistance is subsequentlyrequested from the federal government for major disasters Many of theprovincial governments have not revised preparedness plans since thecolonial period However particularly intense effort has been directed inEast New Britain province because of the imminence of a potentiallydestructive volcanic eruption in Rabaul Caldera
The town of Rabaul (pop 15000) is a major commercial center forPapua New Guinea and is situated directly within the caldera of an activevolcano A relatively small eruption took place at a secondary eruptivecenter near Rabaul in 1937 killing over five hundred nearby residents andforcing the evacuation of the town In order to avoid a repeat of such adisaster the government established the Volcanological Observatory withfour full-time volcanologists and real-time earthquake location andanalysis of tilt data A drastic increase in volcanic seismicity in mid-1983 led to a volcanic hazard alert and intensification ofseismological and ground deformation studies around Rabaul In addition
109
the alert allowed the provincial and national Disaster Emergency Committees to make extensive evacuation and relief plans for a possible eruption at Rabaul including preparation of a new airstrip improvement of roads and emergency water supplies communications systems detailed evacuation plans education programs and so on To date there has been remarkable cooperation of efforts by provincial national and overseas officials to mitigate the potentially devastating effects of a volcanic eruption at Rabaul
Papua New Guinea is the only country of the developing nations of the Southwest Pacific to have devised its own seismic zoning system (Figure A4)
The Nationwide Housing Code for Papua New Guinea sets up a four-level system of seismic loading oriented toward moderate-sized (to 8 stories)buildings Major buildings require independent dynamic analysis usuallycarried out by overseas engineering firms Seismic Zone 1 of the HousingCode is among the most stringent earthquake loading codes in the world and includes the town of Rabaul and much of the East New Britain and North Solomons provinces Seismic zone 2 includes the towns of Lae Wewak and Madang and is approximately equivalent to New Zealand Zone A or California loading designs The capital Port Moresby is in the lowest seismic zone (4) but buildings constructed there still require designsallowing for significant lateral loadings
Earthquake education is handled through the National Radio Government Printing Office the Civil Defence Department and the school system with information supplied by the Geophysical and Volcanological Observatories A particularly intense education effort has been mounted in Rabaul where educational materials have been produced and distributed in three languages and public involvement in preparedness plans has been emphasized
NEW ZEALAND
While New Zealand cannot be considered one of the developing countries of the Southwest Pacific its seismology programs have been responsible for much of the observational data available for the entire region Because of its importance to the other national seismology programs we briefly review here the New Zealands observational facilities Its extensive programs in engineering seismology its critical facilities and its earthquake preparedness programs will not be covered here
National Seismic Network
Seismological facilities in New Zealand are maintained by the Geophysics Division of the Department of Scientific and Industrial Research (DSIR) in Wellington The natioal standard seismograph network presentlyconsisting of thirty short-period stations is shown in Figure A5 The network routinely locates all earthquakes of ML gt 38 within New Zealandand earthquakes with Ms gt 50 for the region within 100 of New Zealand Arrival time data are routinely transmitted to the US Geological Surveyand the International Seismological Centre The events located by the network are reported in the annual New Zealand Seismological ReportSeveral hundred earthquakes are located by the DSIR national network each year
0 - - - --- - - - -
FIG 13
1SEISMIC ZONES FOR BUILDING CONSTRUCTION
- -- IN PAPUA NEW GUINEA
i 1d - - - - - _
(I -lt 53-0Fef cs r i eat a 1 982))j --_ _ -- r L - - --- a a V bull
N i - O(r-tIbd t
__ __ Po --shy
-- -- -
[i ~5- E I
Is-O I ___ oh - - --- - --shy-- shy
4 __J ft - - I- S 4 E jshy
_ _ _-i - _ j -z -
_____ _U 511
ZONE CLASSIFICATION OF CITIES I lZONE 30 1 I 3 1 153--ZONE3 4u shyW-t -~- 6--v 4- bull -
I == 1 --by- Ll _
Figure A4 Seismic zones for building construction in Papua New Guinea (jury et al 1982)
CAPE REINGA
ONERAHI
GREAT BARRIER AUCKLAND - C
5OCT 1914 WHITE ISLAND
KARAPIO EAST CAPE 0r WHAKATANE 15 WAIRKEIp I TUI 28 JUN 1921 t SEP19_-
CHATEAU TARADALE N U 2 FEB 19317 1897 1a Ju DEC 84
MANGAHAO 5 MAR 934 8 AUG 1904 - CASTLEPOINT ( A 1942
COs ELLINGTON IS5CT 18408 2C18BJN562 JAN 1855 23 MAY 1989
Figure A5 Seismograph stations of the national network (left) and the distribution of large shallow earthquakes (right) in New Zealand From Seismological Observatory Wellington (1980)
112
The network is augmented by long-period instruments operating atKaropiro Roxburgh and Wellington DSIR also operates a three-componentborehole seismometer in Wellington as part of the Seismic Research Obseervatory network supported by the US Geological Survey
Stations in Outlying Territories
New Zealand has also taken an important lead in operating seismographstations in outlying areas of the Southwest Pacific These stations havebeen extremely important in hypocentral control for the Tonga - Kermadec seismic zone and for nuclear event detection in the Pacific DSIR operates three 6 -component Worldwide Standard Seismograph stations at Afiamalu (Western Samoa) Raratonga (Cook Islands) and Scott Base (Antarctica) Short-period stations operate at Apia (Western Samoa)Campbell Island (New Zealand) Chatham Islands (New Zealand) Nadi (Fiji)Nime and Raoul Island (Kermadec Island New Zealand) Readings from these stations are routinely reported to PDE and ISC for global earthquake location
Wellington Network
A small-aperture high-gain seismic network is operated around Wellington an area of greatest seismic risk in New Zealand The stations are telemetered by radio or telephone link to the central recording site The network now consists of eleven stations Earthquakes are presentlydetected by a microprocessor-based Automatic Seismic Monitor and automated location processing is expected to follow The network routinely locates events with ML gt 15
Pukaki Network
A second microearthquake network has operated around Lake Pukaki ahydroelectric project in the South Island New Zealand The network wasestablished in 1975 to monitor reservoir-induced seismicity associated with impoundment of the reservoir The network consisted of nine stationsand was intended to operate on a temporary basis It has been closed since early 1984 with several of the stations continuing to support the national network and to monitor any future reservoir-related activity
Related Seismology Research
In addition to its regular observatory seismology the GeophysicsDivision has an active seismology research program Their studies have focussed on theoretical seismology earthquake prediction crustal structure of New Zealand historical earthquake studies nuclear eventdetection seismic risk in New Zealand strong motion studies and volcanic seismology The monitoring of active volcanoes is closely coordinated withcrustal deformation monitoring conducted by the Earth Deformation Section of the New Zealand Geological Survey
The New Zealand strong motion accelerograph network now consists of225 instruments operated by the Physics and Engineering Laboratory of DSIR Most of these instruments are of a New Zealand design (Mechanicaland Optical Accelerographs) and analog records are made on photographicfilm Three digitally recording accelexographs are now in operation in New
113
Zealand and the MO records are digitized for computational analysisAnalysis of this empirical data is being used for a revision of New Zealands building codes
114
REFERENCES
Berryman K 1979 Seismotectonic zoning study of the Fiji IslandsEarth Deformation Section Report 70 Wellington NZ Dept Sci and Indust Research 40 pp
Franco AB MP Hamnett and J Makasiale 1982 Disaster Preparednessand Disaster Experience in the South Pacific Pacific Islands Developshymental Program Honolulu 380 pp
Geological Survey of Papua New Guinea 1979 Information Booklet Port Moresby Dept Minerals and Energy 12 pp
Government of Western Samoa 1977 Apia Observatory 1902-1977 ApiaApia Observatory 8 pp
Jury RD JP Hollings and IAN Fraser 1982 The development ofseismic zones and the evaluation of lateral loadings for earthquakeresistant design of buildings in Papua New Guinea Bull NZ Nat Soc for Earthq Engr 5 123-140
Lowenstein PL 1982 Problems of volcanic hazards in Papua New GuineaGeol Surv Papua New Guinea Rept 827 Port Moresby Papua New Guinea 62 pp
McCue KF and ID Ripper 1980 The Papua New Guinea Strong MotionAccelerograph Network Geol Surv Papua New Guinea Rept 807 Port Moresby Papua New Guinea 13 pp
Mineral Resources Department Seismology Section 1983 National activityreport Fiji Submitted to Session IX Intl Coord Group for TsunamiWarning System in the Pacific Min Resources Dept Fiji Note 333Suva Fiji 4 pp
Parliament of Fiji 1984 Mineral Resources Department Annual Report forthe Year 1982 Parliam Paper No 13 Suva Fiji 90 pp
Power CA 1978 Earthquake risk in Fiji and the problems of earthquakeengineering Presented to the Fiji Society 17 pp
Prevot R and JL Chatelaiu 1983 Seismicity and Seismic Hazard in Vanuatu ORSTOM Rept 5-F3 Noumda 51 pp
Ripper ID 1982 Accelerogram library Geol Surv Papua New Guinea Rept 198211 Port Moresby Papua New Guinea 44 pp
Seismological Observatory Wellington 1980 The earthquake problem in NewZealand Alpha DSIR Extension Information Wellington NZ 4 pp
Smith WD 1979 Seismology and related research in New Zealand1975-1978 NZ DSIR Information Series No 140 30 pp
115
Smith WD 1983 Seismology and related research in New Zealand 1979-1982 Seismol Observatory Wellington Bull 276 32 pp
Solomon Islands Government 1982 National Disaster Plan 1982 Honiara Solomon Is 14 pp
116
A Rahimin A Simpson R Holmes P Rodda R Singh I Everingham K Draunidalo G Shorten M Mehrotra J Booth J Campbell
R Carter R Byrne G Gauss D Rubin
S Tongilava
D Tappin S Lemoto T Tukia
C Clarke
R Campillo R Foy T Lee J Rdcy J Chatelain R Prdvot
L ioane S losa A Titimaea
S Danitofea
D Tuni R Walshaw J Vunagi D Gwyun
INFORMATION CONTACTS
FIJI
Director Mineral Resources Dept Asst Director (MRD) Princ Geol OffshoreSeismol (MRD) Princ Geol Inform Services (MRD) Principle Geophysicist Senior Seismologist (MRD) Seismologist (MRD) Senior Engineering Geoogist (MRD) Struc Engr Suva City Council Civil Engineer Suva Engineering Geologist A Gibb amp Partners (Monasavu) Marine Geologist (CCOPSOPAC) Marine Geologist (CCOPSOPAC) Marine Geologist (CCOPSOPAC) Marine Geologist (CCOPSOPAC)
TONGA
Superintendent of Lands Surveys and Natural Resources Government Geologist (LSNR) Land Assessor (LSNR) Government Planner (LSNR)
VANUATU
Director Dept Mines Geology and Rural Water Supplies Director ORSTOM Mission Engineer ORSTOM Civil Engineer Public Works Dept Director ORSTOM Dept Geol and Geophys (Noumda) Seismologist ORSTOM (Nouma) Seismologist ORSTOM Nouma)
WESTERN SAMOA
Director Apia Observatory Senior Seismologist (AO) Geologist (AO)
SOLOMON ISLANDS
Chief Geologist Ministry of Lands Energy and Natural Resources
Senior Seismologist (MLENR) Senior Geologist (MLENR) Ministry of Home Affairs and National Development Civil Engineer Public Works Department
117
PAPUA NEW GUINEA
K Doble Chief Geologist Geological Survey I Ripper Chief Seismologist Geophysical Observatory G Seidel Information Officer Volcanological Observatory G Anderson Engineering Geologist Geological Survey J Wilkins Civil Engineer Dept of Works and Supply
NEW ZEALAND
W Smith Director Seismological Observatory Wellington
UNITED STATES
M Hamnett Pacific Islands Development Program G Burton Director Pacific Tsunami Warning Center R Sillcox Seismologist (PTWC) G Pararis-Corayannis Director International Tsunami Information Center
118
APPENDIX V TSUNAMI SAFETY RULES
1 All earthquakes do not cause tsunamis but many do When you hearthat an earthquake has occurred stand by for a tsunami emergency
2 An earthquake in your area is a natural tsunami warning Do not stayin low-lying coastal areas after a local earthquake
3 A tsunami is not a single wave but a series of waves Stay out ofdanger areas until an all-clear is issued by competent authority
4 Approaching tsunamis are sometimes heralded by a noticeable rise orfall of coastal water This is natures tsunami warning and should be heeded
5 A small tsunami at one beach can be a giant a few miles away Dontlet the modest size of one make you lose respect for all
6 The Tsunami Warning System does not issue false alarms When anocean-wide warning is issued a tsunami exists When a regionalwarning is issued a tsunami probably exists The tsunami of May 1960killed 61 people in Hilo Hawaii who thought it was just another false alarm
7 All tsunamis--like hurricanes--are potentially dangerous even thoughthey may not damage every coastline they strike
8 Never go down to the beach to watch for a tsunami When you can seethe wave you are too close to escape it
9 Sooner or later tsunamis visit every coastline in the PacificWarnings apply to you if you live in any Pacific coastal area
10 During a tsunami emergency your local Civil Defense police andother emergency organizations will try to save your life Give them your fullest cooperation
Unless otherwise determined by competent scientists potential danger areasare those less than 50 feet above sea level and within 1 mile of the coastfor tsunamis of distant origin or less than 100 feet above sea level andwithin 1 mile of the coast for tsunamis of local origin
5
establish the boundaries of the lithospheric plates in the modern view of
plate tectonic theory (Figure 10) These plates which are relatively
rigid cover the surface of the earth like a mosaic of rigid caps and move
against each other by sliding (1) past at a transform fault (2) over at a
convergent margin (such as subduction at a deep sea trench) or (3) apart
from one another at a divergent margin (such as spreading at a mid-ocean
rift) Figure 2 shows schematically the spatial relationship of these
different types of boundaries Convergent plate boundaries are responsible
for the majority of the worlds large earthquakes and most of the worlds
tsunamis Many volcanic arcs form parallel to these deep-sea trenches
above the point where the subducted plate reaches about 100 km depth
(Isacks and Barazangi 1977) The relative motion of two convergent
lithospheric plates may be accumulated over a time period of tens to
hundreds of years and then released in large earthquakes or aseismic creep
(motion without earthquakes) may occur instead of earthquakes The area
over which the descending and over-riding plates interact the age of the
sea floor the topography of the sea floor and many other factors appear to
influence the recurrence interval and the size of earthquakes along the
interplate zone
The New Hebrides island arc trends linearly south-southeastward from
IIdegS to approximately 20degS (Figure 3) The northern end of the trench
bends sharply westward to merge with the east-west trending Solomon Trench
The southern end of the trench curves around eastward to merge with the
east-northeast trending Hunter Fracture Zone The arc is a component of
the Melanesian Borderlands that form the boundary between the
Indo-Australian and Pacific lithospheric plates (Figure 4) This
6
AS
M E S
T H
0
E
S
N
P
0 S
H
P H
E R
R
E
ridge
trnsIr
trench
Noauii
-
bull
q
transom al
Figure2 (A) Sketch of the different types of plate tectonic boundariesand their relationships (Isacks et al 1968) (B) Diagrams of the threetypes of boundaries in three dimensional view (Calder 1972)
1600
SOLOMON IS
1650
-
1700 E 1750
PACIFIC OCEAN
1800
100 o
0
-~ ~
1jN~CH
~ A
Ko
$SATA CRUZ IS
-10- K~10
J-shy
ltK14
TitCASTECS
is
k)tANKS
S A ME O
L AMBRY MALEKULA V
FI JI PLATEAU
150
FIJI is
~o eANGO d
250 3 ATT E UNTE PJC
160c 1650 1700 E 1750 1800
Figure 3 Bathymetric map of the New Hebrides Island arc and thesurrounding region taken from Mammerickx et al 1971 The filledtriangles denote Quaternary volcanoes Contours are in fathoms
1600 E 170 1800 W 170 deg 8
CENTRAL PACIFIC BAIN
S040
NOTH2
0
AMOA 0
200
BASIN
bull
o 0
BASIN
FIJI
f d
S 0 BASIN a O
INDV USTIRAL
oamp PLATE
0 ASA
BASIN
r
0
NEW t~Z EALAND
CHAT 11A M
R S
150 160 E 170 180
-a A S
0
30 PACIFIC PL ATE
SOUTHWESiT
PACIFIC 0
BASIN 0
40shy
1700 W Figure 4 Regional setting of the Southwest Pacific Tectonic and morphoshylogic features of the PacificIndo-Australian plate boundary Open arrows indicate direction of relative plate convergence Contour line shows 2-km isobath Holocene volcanoes are indicated by open triangles Data on bathymetry seismicity volcanoes and plate motions are taken from the Circum-Pacific Council for Energy and Mineral Resources (1981) map
9
intra-oceanic arc is unusual in that the subducting slab dips toward the
Pacific Basin The Indo-Australian plate is being subducted at a rate of
approximately eleven centimeters per year (Dubois et al 1977 Pascal et
al 1978 Isacks et al 1981) in a direction perpendicular to the trench
(Isacks et al 1969 Johnson and Molnar 1972 Pascal et al 1978)
Relative to other convergent plate boundaries (eg Chile and Alaska) the
width of the zone of interaction between these two plates is limited to
approximately 50 km in extent because the subducting (Indo-Australian)
degplate is steeply downbent (70 ) at intermediate depths This geometry
produces a narrow ribbon of potentially damaging seismicity rather than a
large region of seismicity The northern and southern portions of the arc
are typical of arc-trench systems but the central portion exhibits several
unusual features (1) The bathymetric expression of the trench is obscured
between 13degS and 17degS where a submarine ridge known as the dEntrecasteaux
Fracture Zone intersects it at approximately 16degS (2) The upper plate
protrudes westward in this central portion of the arc such that the western
coast of Malekula Island is located where the inner slope of the trench is
normally positioned (Karig and Mammerickx 1972 Isacks et al 1981 see
Figure 3)
Shallow Vanuatu earthquakes (Figure 5) are located in the interplate
zone between the two plates They are associated with slippage of the
Indo-Australian Plate as it descends beneath the Pacific Plate Intraplate
earthquakes also occur within the descending and overlying plates in the
trench region and behind the island arc in what is known as the back-arc
region An actual and a schematic vertical cross section near Tanna
perpendicular to the trend of the arc is representative of the
10
1600 E 1700 180 W 1700
I 0 s ee 0 0o
2e 01
6 S
20
30S $
S4b
0
3040 30
4S
400
1 2 40
150 1600 E 1700 I80 170 W
Figure 5 Regional setting of the Southwest Pacific associated with the plate boundaries in this region
Shallow seismicity
relationship of the seismicity to the trench islands and back-arc region
(Figure 6) In Vanuatu earthquakes occur from near the surface to
approximately 300 km depth The earthquakes systematically deepen
eastward from the New Hebrides Trench forming a narrow dipping plane
under islands located in the central portion of the arc and intermediate
depth earthquakes occur-progressively farther eastward Large (Ms gt 7)
earthquakes but few great (Ms 7 34) earthquakes have occurred along
the island arc as a result of the subduction of the Indo-Australian plate
In spite of the anomalous protrusion of the upper plate in the central
part of the arc the Benioff zone and convergent plate boundary appear to
be relatively uniform in configuration and continuous along the entire
length of the arc (Pascal et al 1978 Isacks et al 1981) The linear
distribution of the islands of Vanuatu and their location so close to the
main interplate thrust zone of the convergent plate margin result in a
geometry that is uniquely suited for subduction zone studies in comparison
to most other subduction zones on earth This also results in a unique
earthquake hazard in central Vanuatu Behind and eastward of the New
Hebrides island arc lies the North Fiji Basin (Figure 4) where the presence
of shallow seismicity (Figure 5) fresh basalts little sedimentation
(Karig and Mammerickx 1972 Luyendyk et al 1974) and high values of
heat flow (Sclater End Menard 1967) indicate active tectonism The Vitiaz
Trench forms the northern boundary of the North Fiji Basin and represents
the site of an old subduction zone that existed before the modern New
Hebrides arc formed Subduction (of the Pacific Plate) ceased at the
Vitiaz Trench sometime in mid-Miocene (Falvey 1978) or earlier (Chase
12
NEW HEBRDES VOLCANIC TRENCH ARC CORIOLIS
SW 4 TROUGH NE 00Z_shy
- _shy 2
-vQ 100- DESCENDING
PLATE ~ ~SEISMICf
ZONE -Ishy
200shy
300 00 100 200
DISTANCE KM
Figure 6 A schematic cross secion showing the region where shallow and intermediate-depth earthquakes were recorded (inclined lines) and the inferred geometry of the descending plate beneath the southern New Hebrides arc The inferred geometry of the interplate thrust zone is partly based on the slip vectors (short solid lines) of the shallow thrust-type focal mechanisms The Moho discontinuity of the overriding plate estiated from refraction and gravity studies is also shown (Condert et a 1981)
13
1971 Mitchell and Warden 1971 Karig and Mammerickx 1972) and resumed at
the modern New Hebrides Trench with the opposite polarity (Indo-Australian
Plate underthrusting beneath the Pacific Plate) Deep earthquakes are
still recorded near Vanuatu that result from this episode of subduction
The New Hebrides arc has migrated away from the trend of the older Vitiaz
Trench to its present position (Hamburger 1986)
Geolc-ical Setting
The islands of Vanuatu are volcanic in origin with older islands
fringed or capped with reefal limestones In the central region of the
arc the single chain of islands gives way to a more complex structure
(Figure 7) (1) the eastern Miocene-Pliocene chain with tholeiitic and
calc-alkaline volcanoclastics includes the islands of Maewo Pentecost
Efate and parts of Epi (2) the slightly older western Oligocene-Miocene
chain includes the islands of Santo Malekula and the Torres and (3) the
central late Pliocene-Recent portion contains active aerial and subaerial
alkaline volcanics (Mitchell and Warden 1971) The volcanic rocks of the
western chain are similar to slightly more acidic composition than the
eastern chain Local outcrops of ultramafic rocks are found in several
places in the eastern chain
REGIONAL BACKGROUND INFORMATION
Historical Earthquakes in the Vanuatu Region
An accurate evaluation of the earthquake hazard for a particular
region includes a survey of historical seismicity in the region in
question Historical earthquakes are important because they help to better
determine the potential size frequency of occurrence and possible effects
of future earthquakes
14
170
Tinakula
xd
Torres Is e
Vat Gonoi
Vanua Lava
b Gauagp Merig
- --- -4
- --- Santo Moewo NOR TH
DENTRECASTEAUX FZ ===== Pentecost FIJI
-- tMae ku v Ambry m BASIN
-p -E
0 ioo 200 Km
o Erromang -A IWA
U) TANNA FUTUNA -A
~ANEITYUMOVOLCANIV ASSOCIATIONS 7 UPliacene- Recen- (Central Chain) UMiocene- L Pliocene
Effi (Eastern Belt) ~UOIlgocene - MMiocene
1plusmnZ (Western Belt) Di ofDip ofTune Matthow TECTONIC ELEMENTS selomic zoneHunter
1r~7Uplifted volcanic ridge
~B c- bsn Major fracture zone - -Bock -aorc basin NF -
Zone of flexuring Sedimentary basin and faulting
I I K KIRI
Figure 7 Geology of New Hebrides Arc (Carney and Macfarlane 1979)
15
The earliest reports of earthquakes in the Vanuatu region is a series
of earthquakes which began on 28 March 1875 and were felt on Anatom
(Mercalli intensity VIII-IX for the largest event) and Erromango and in the
Loyalty Islands of Lifou Mare and Ouvea (lida et al 1967) On 10
January 1878 a tsunamigenic earthquake associated with the eruption of
Yasowa Volcano Tanna was felt in Port Resolution Tanna Another strong
tsunamigenic earthquake occurred on 11 February 1878 associated with
another eruption of Yasowa Volcano
Since 1900 5 great earthquakes (Ms gt 7 34) and 52 major earthquakes
(7ltMs lt 7 34) have occurred along the arc (McCann 1980) However the
great earthquakes that occurred near the turn of the century are not
well-constrained in size or place and their magnitudes were probably overshy
estimated (due to the way in which the magnitudes were calculated)
Moderate-sized earthquakes are distributed throughout the arc (Figure 8C)
but the largest events are more clustered especially in the northern
portion of the arc (Figure 8B Marthelot 1983 and Figures 9A and 9B
McCann 1980) There is a distinct gap in the seismicity at the point
where the dEntrecasteau Ridge intersects the line of the trench
Because the occurrence of shallow earthquakes near population centers
are of greatest concern for earthquake hazard in this report we have
focussed on shallow earthquakes near the main islands of Santo Malekula
and Efate in the central portion of the arc Maps of shallow seismicity
(depth lt 70 km) of the region based on the US Geological Surveys
Preliminary Determination of Epicenters (PDE) catalog for the period
1961-1981 are shown in Figure 8B and 8C (from Marthelot 1983) This
with bewen70 and10 Kin sqars betee 10deth andK2N00Kin FriaguresMpete island)arceV00anuat (ail) hongnrhto the argha
std itriagebetween00 and 3e0vkn locte (1) the acnceaoneo largesxise of thereshlwents nthe trnhahrcal diappeanras i thetareshalwents nthe norheialof the arnhh ih thetarch thapconraspuato he acthe reanqig mapis ho the dstrutiorn oaf2thepuxaprton ofearcTive reanqiet regis inothe dsorutrnhaf2the
haviencanue largetthand5an3) earthquakeintermediate-depthofrnestshanppresencanue of intermediate-depth3 ctivitye
17
9 194 (74) s-AFTERSHOCK ZONE
ft 1 (827 _RECOMFUTED OR 2RECENT EVENT
1914 ) EPICENTER
1944(7) 0-FROM
GUTENBERG AND (73) RICHTER
1 7 bull__ EPICENTER FROM RICHTER
192 (7O)(21 ( i9 1945()2)
j50 21926 (71)150 01928(71)
1946(70) 1927 (71)
1903(75)
1944(73) 1925 (76) 2 18754
~ 1878
200 1920(80O 94943(72)
4875 1923(70) 1944(72)
70737 1z945 I941943(757372) shy
1904 (84)
1928(75) 1926(70)
1917 (71)
250 6 I 165 0E 1700 1750
Figure 9A Map showing locations of large (Ms gt 7) and great (Ms gt 7 34)historical earthquakes along the New Hebrides Trench for the time period1900 to 1950 (McCann 1980)
18
I I
Io 953 1963 (73 73)
1966(7473)
19617(70)
9195304) 20 I 1972 (71)
651965(70)197
7150 (7 7 2 1958 (72)
--- 1965 197(71)-
F7873s) od
19616 1 A
2 00 1950 (70727072)
ID
165degE deg170c 1750 Fig~ure 9B Map showing locations of large (Ms gt 7) and great (Ms gt 7 34)historical earthquakes along the New Hebrides Trench for the time period1950 to 1979 (McCann 1980)
19
figure illustrates the dense concentration of interplate events close to
and landward of the New Hebrides Trench
Very little information exits concerning the effects of strong
earthquakes prior to 1961 apart from a few sketchy damage reports The
location accuracy of earthquakes was improved in 1961 Before this time
locations were located to the nearest tenth of a degree and magnitudes were
considerably over-estimated The last major seismic episode of interplate
slippage in central Vanuatu occurred in a sequence of earthquakes in August
1965 (Figure 10) which accumulated a total seismic moment equivalent to a
single magnitude Ms - 77 event (Isacks et al 1981) The 1965 Santo
earthquakes caused significant damage to buildings wharves and bridges in
Luganville on Santo Island and major damage to buildings and water tanks in
Norsup and Sarmet on Malekula Island (Pr6vot and Chatelain 1983)
Coseismic tectonic uplifts on Malekula Island were also measured in
association with the 1965 earthquakes (Figure 10) Over 1 meter of uplift
was detected for the 1965 earthquake sequence (Taylor et al 1980)
Only one sequence of earthquakes has been relatively damaging since
the Cornell-ORSTOM network began operating in 1978 The Mere Lava
earthquake (Ms 61) occurred on 12 May 1980 at 14800S and 16782degE and a
depth of 23 km The worst damage from this event was caused by landslides
SUMMARY OF FACILITIES AND PROGRAMS
Critical Facilities
Port Vila with a population of 15088 in 1979 is the administrative
and commercial center of the country There are a number of multistory
buildings in the capital and most of Vanuatus tourist industry is located
2
1970
140- )O AN OCT
JAN 19731974 0 00-
MAY 0
0--- 1965
S 9000 97150K 15deg AU61973 NOVV
1974
600 x OCT
4 1971 AUG 01966
171965
160shydeg 1 - - 2000
Ms S73 -77
63 -67
0
0
58-62170 1- 1 -_0 1660 1670 E 1680
Figure10 August 1965 earthquake sequence (from Isacks et al 1981)
21
in and near Port Vila A large shipping wharf is located near the center
of the city on Vila Bay
Apart from Port Vila the only significant development in Vanuatu is
at Luganville on Santo Island (pop 5116 in 1979) It remains an
important economic center for the country with agricultural processing and
shipping facilities located there There are several three- and four-story
buildings in the center of Luganville
Earthquake Preparedness Programs
As of late 1983 the Government had requested the assistance of a
consultant from New Zealand to help provide uniform building codes for the
country The Public Works Department enforces New Zealand seismic zone B
codes to construction of public buildings Large buildings for the most
part are designed by overseas engineering firms and generally comply with
the earthquake design standards Smaller buildings are generally designed
close to the New Zealand loading specifications but there continues to be
great difficulty in supervising construction projects
There is no large-scale earthquake education program in Vanuatu
Materials have been prepared by ORSTOM seismologists for distribution to
teachers public officials and planners involved in earthquake hazards
(eg Prdvot and Chatelain 1983)
Seismological Facilities
Seismological observations are necessary to the accurate location
study and ultimate prediction of earthquakes Seismic stations were first
established in Vanuatu in the mid-1960s by the French Office de la
Recherche Scientifique et Technique Outre-Mer (ORSTOM) Staion PVC in
Port Vila has operated continuously from 1964 to the present while LUG in
22
1680 1700140 1660 1670 1690 deg 140
GAUAP FIJI
PLATEAU 0
deg ~ HOG MAEWO -15 150 AOBA
2000 SANTO AB
MAP PENTECOST
160 A MT AM8160A= A 13AMBRYM-16
DENTRECASTEAUX OJi= LMP EPIP1FRACTURE ZONE
170 EME 170 EMAINGOUNA
NGAoS L E_ EFATE
RTVDvpP 18o 0shy180 -
o -180 z 0
o ERROMANGO
190 - Rk90R-190
TAN AN~o 4 FUTUNA
AUSTRALIAN oshy0 0TANNA
200 PLATE ANATOM 0 200
0 0
1650 1660 1670 E 1680 1690 1700
Figure 11 Map showing the seismograph stations in Vanuatu Circles arestations telemetered to the base station PVC on Efate island andunderlined stations have two components--one horizontal and one vertical The triangles are older ORSTOM stations INH and LUG are no longeroperational Strong motion instruments are located at SWB and LMP onMalekula island DVP and PVC on Efate island and LUG on Santo island
Luganville Santo operated through 1980 A third station on Tanna Island
(INH) operated through 1978 Cornell University began cooperative field
programs with ORSTOM in 1975 with a microearthquake experiment on Santo
Island An ocean-bottom seismograph experiment was carried out in southern
Vanuatu in 1977 and in central Vanuatu in 1978 The Cornell-ORSTOM
telemetered seismic network was established in 1978 and has operated
continuously since that time The seismic network now includes 19
telemetered stations (Figure 11) to date over 20000 earthquakes have
been recorded by the network A permanent ORSTOM mission is now based in
Port Vila and takes primary responsibility for day-to-day maintenance of
the network The availability of continuous earthquake monitoring in
Vanuatu is an important component of any earthqi-ke or -arthquake hazard
study for the country Figure 12 shows the seismicity level (magnitudes gt
4) recorded by the Worldwide Seismograph Station Network (WWSSN) Compare
these results with the increased sensitivity (magnitude gt 25) and location
accuracy of the regional Cornell-ORSTOM network which is shown by better
definition of seismic zones in Figure 13 These network data clearly
define the heterogeneous distribution of seismic activity in the central
portion of the arc
These seismological facilities are complemented by studies of ground
deformation using seven bubble-level tiltmeters a two-component longshy
baseline water tube tiltmeters and two levelling arrays
Strong-Motion Accelerographs
As part of the present program of seismic hazard evaluation in
Vanuatu Cornell and ORSTOM have installed five strong-motion
accelerographs on the islands of Efate Malekula and Santo (Figure 11)
__
5 t~j24
0 - 70km
o0 a 0 70-150km 0 C J
5 S S - 0 0 shy
-150-300km
a 0 o 300-700km
0
15S 4 -
bull7 -06 ----
SS
bull bull S
bull iilIIle
Figure I9 1p 4D JE l o shybull =r-
5 NO a~ 40
20 1 a
~ ~- 20Smbull 5m
- S r S st
16 E5 170 E~
165EI bull =W
Figre 2 Epcenresde sesme lcasspa er ea onia de sttos-16-1) PDE ocaionsofvent (167-182) vtand 1983)-- ha-la
25
PROFONDEUR - DEPTH 0 - 70 Km
E
05 0
EE
03 4 3
0I
Figur 13Siete e ~se bulloai~pa le rieuOSO-ONEL(918)
00i
oA
Fi3r1N
a
0--
E iete e e Icls sp rl dspeuOR T M C R E L(9 8 1 8 )
26 These acce2erographs complement the other instruments being used to study the seismicity in the region The accelerographs record the ground accelerations at a particular site fiom an earthquake strong enough to trigger the instrument To date these instruments have already been triggered by five moderate-sized shallow events and will be used to provide a basis for prediction of local ground motion induced by large interplate earthquakes in Vanuatu The high level of seismicity along this plate boundary suggests that a valuable baseline of strong-motion data can be collected in a relatively short period of time
Related Research Programs
The seismology program is carried out in cooperation with the Vanuatu Department of Mines Geology and Rural Water Supplies They are responsible for regional geology studies resource assessment detailed mapping and hydrological activities In addition ORSTOMs geology and geophysics department based in New Caledonia carries out an extensive
program of investigations covering submarine morphology marine geology and geophysics island geology and crustal structure The US Geological Survey has undertaken a series of detailed marine studies in the central and northern portions of the island arc using the research vessel SP Lee (1982 and 19F4) A detailed hydrographic survey was carried out in coastal waters by Australian researchers A tide gauge is maintained by the ORSTOM
mission in Port Vila (Pr6vot and Chatelain 1983)
PREVIOUS STUDIES
Seismicity Studies Along the New Hebrides Arc
Seismicity studies of the New Hebrides Arc by Isacks et al (1981) found that major bathymetric and structural complexities divide the central
27 part of the arc into segments approximately 100 km long The segment near
Santo and northern Malekula islands ruptured during two complex sequences
of events occurring in August 1965 and in late December 1973 through early
January 1974 (Table 1) In contrast the segments near the southern part of Malekula and Efate islands may not have ruptured during the past 75
years Moreover between southern Malekula and Efate islands the
orientation of the horizontal compressive stress within the upper plate
changes from a direction perpendicular to the arc to a more complex and
variable pattern found in the southern portion of the arc
Since the Cornell-ORSTOM network was established in 1978 10 moderate
(58 lt Ms lt 7) earthquakes have occurred within the network (Table 2) A
description of the seismicity recorded by the network follows
(A) Fore- and Aftershock Sequences of the August 1979 and July 1981 Main
shocks
(1) 17 August 1979 Sequence Figures 14A and 14B show earthquakes in the foreshock sequence of the 17 August 1979 earthquake The spatial and
temporal development of this activity was described by Isacks et
al [1981] This section provides a more detailed analysis of a longer
period of time A small zone near the epicenter of the 17 August
earthquake was intermittently active during late June - early July 1979
(Figure 14A) The more immediate foreshock sequence (Figure 14B) started
eight days before the main shock and consisted of five groups of events
Each group of foreshocks began with an earthquake having a magnitude
between 42 and 49 and each was followed by a number of small
aftershocks The first foreshock cluster was located just landward of the
trench Each successive cluster migrated in time northeast toward the
Relocations with all available teleseismic and local data for 1978-1981events except 27 Jan 1979 [Bulletin of the International SeismologicalCentre (ISC) location] remaining locations based on local data only 2Ms surface-wave magnitude taken from Monthly Bulletins of the PreliminaryDetermination of Epicenters (PDE)3MO seismic moments reported by Chinn and Isacks [1982] or in Monthly
Bulletins of the PDE (1981-1985 events)
4Mw is calculated from M0 by Mw - (115) x (log(Mo)-161)
17
0 0 0
0CD 00 aVm01 83 0 0 0
00 0 00 3
0 00 0
000 0 0
167 E 168 0 E
169 167 E
168 0 0
169 167 E 0 1
168 169
Figure 14 (A) Early foreshocks of the 17 August 1979 main shock (shown as a filled square) that occurredat the end of June to the beginning of July 1979 Island contours and 6 km bathymetry are shown (B) Lateforeshock activity preceding the 17 August 1979 earthquake Foreshocks migrated from the trench toward thelocation of the main shock (C) Foreshocks preceding the 15 July 1981 earthquake 0o
31 epicenter of the main shock The foreshock sequence ended with a very
intense concentration of seismicity near the 17 August 1979 main shock
epicenter The final foreshock cluster began eight hours before the main
shock and continued until the region became seismically quiet three hours
before the main shock The main shock occurred at the northeastern end of
these clusters
The development of the aftershock activity in Figure 15 is shown for
two time intervals during the nine days following the main shock During
the first day the aftershocks were initially located close to the epicenter
of the mainshock and rapidly expanded towards the west At the end of this
day aftershocks occurred as far north as the site of the 26 August main
shock and as far south as about 181degS (Figure 15A) Most of the increase
in the aftershock area occurred during the first day as can be seen by
comparing Figures 15A and 15B To the north the expansion of the aftershy
shock zone stopped near the epicenter of the next main shock of the
sequence that occurred nine days later on 26 August In the south aftershy
shocks were located in the same zone defined by the early foreshocks (also
see Figures 18C and 18D)
(B) 26 August 1979 sequence The development of the 26 August
aftershock zone (Figure 16) shows very similar patterns to the development
of the 17 August aftershock zone The activity developed very rapidly
during the first two days following the main shock (26 -- 27 August)
Then as in the case of the 17 August aftershock sequence the cumulative
sequence occupied an area larger by a factor of 2 or 3 than the one
expected for an earthquake of such magnitude [Isacks et al 1981] The
main shock was located on the southern edge of the aftershock zone -- the
aftershock activity developed to the north east and west only while the
aftershock zone of the 17 August event was nearly inactive (Figures 16A
16B) By 27 August aftershocks were located as far north as the epicenter
of the future 15 July 1981 earthquake and as far west as the New Hebrides
32
17
oA B
00
00
18 - 0o - 0 0
0 0
00
167 E 168 169 167 E 168 169
Figure 15 Maps of epicenters showing the development of the 17 August1979 aftershock sequence Format as in Figure 14 (A) 12H59M 17 August1979 to 12H59M 18 August (B) 13HOOM 18 August to 11H46M 26 August(to just before the 26 August main shock)
17
180 0 ogI0
0 00 o0
CP 00 000
0
0 0 0 8V
0 00 0 0(0 0
0 0
C0 0
C 0
167 E 168 I0
159 167 E 168
0
169 167 E
e l 0
168
_o
169
Figure 16 Maps of epicenters showing the development of the 26 August 1979 aftershock sequence Formatas in Figure 14 (A) 11H47M 26 August 1979 to IIH47M 27 August (B) IIH48M 27 August to IIH47M4 September (C) 1lH47M 4 September to IIH47M 26 October 1979
34
trench The aftershock zone ends very abruptly to the north along a
sharply defined east - west trending line which passes close to the
epicenter of the 1 September 1978 earthquake (Figure 18A) After the first
two days the level of aftershock activity decreased rapidly During the
entire period from the main shock to 14 September the aftershock zone of
the 17 August earthquake remained relatively quiet (Figures 16A 16B)
From 15 September to about mid - October both the 17 August and the 26
August aftershock zones were reactivated (Figure 16C) although the level of
activity was much lower than that during the days immediately following
each of the main shocks During this later period some activity occurred
in the back-arc region Northeast of Efate Island a small intense cluster
occurred in 1979 followed by shallow events spread around Efate Island
(Figure 16C) The level of activity then decreased and by the end of
October was back to a more normal background level of seismicity in the
entire region
The two aftershock zones of the 17 and 26 August 1979 earthquakes are
contiguous with some overlap in the area between the two epicenters (Isacks
et al 1981 Chatelain et al 1986) Chatelain et al (1986) show tiat
this area plays a key role in the development of the seismicity in ne
Efate region
(3) The 15 July 1981 earthquake In contrast to the 17 August 1979
earthquake no outstanding foreshock activity occurred prior to the 15 July
event Small clusters occurred on 5-6 and 12 July (see Figure 14C) Both
clusters included few events although each started with a magnitude (mb)
50 earthquake The larger of the two occurred on 12 July near the pending
main shock epicenter In contrast to the 17 August 1979 case no unusual
35
concentration of activity was noticed in the epicentral region during the
months immediately preceding the main shock Possible long-term precursory
activity may be the clusters observed in March and June 1980 and are
discussed in the next section
Figure 17 illustrates several outstanding features of the aftershock
sequence of the 15 July earthquake First an intense zone of activity
develops during the first day and continues throughout the sequence (Figure
17A) This zone is coincident with the aftershock zone of the preceding 26
August 1979 event (compare Figures 17A and 16) The southern boundary of
this activity is quite sharp and coincides with the region between the two
August 1979 epicenters this again emphasizes the importance of the area of
the two 1979 epicenters The epicenter of the main shock is located on the
northern boundary of the region of intense activity
Second the aftershock activity expands in size during the succeeding
nine days primarily northwards [see also Chatelain et al 1983] To the
northwest significant activity develops within the oceanic plate beneath
the trench axis (Figure 17B) This activity is concentrated beneath the
ORSTOM seamount [see USGS map by Chase et al 1983] near 173degS and
1672degE During the second through the ninth days activity continues to
develop in the area west of Epi Island and south of Malekula Island (Figure
17B) while in the succeeding 50 days the area of southern Malekula is
activated with a remarkable cluster occurring beneath the southern coast
(Figure 17C) The region of southern Malekula and Epi has been notably
quiet for much of the period prior to the July 1981 earthquake Back-arc
activity is also notable with a cluster occurring on 29 July east of
16 06 A B deg
0
O0
0 0
0~
o
000
0 0
0
00
0o~$
S 0 08 S
16E0
167 E
1 - C
0 0
168
0
16
0--
0
169 16
t
E
4P0
16
168
_ _ _ _ _ _ _ _
167
16 1o6
0
E 0
o S 0O
0 0
66
o5
0 6
0 24 Ju
q-o
0
6
1G 8HOM(C) 240 in~~ ~~
08OM24 JulJul toto 075M Figur 14
M Setme 1981 ()0H5M1Juy11to0H5M16Jl()0HO16uyto 1515 Setmbr191
I shy37
9Mo 4 o
uy
ON
37
Efate and increased activity in the region of Ambrym and Epi islands
(Figure 17C)
The aftershocks of the 15 July 1981 event thus affected four distinct
regions (1) the former 26 August 1979 aftershock zone presumably on the
interplate boundary (2) a region of the suboceanic plate near the ORSTOM
seamount (3) the region between South Malekula and 172degS presumably also
part of the interplate boundary and (4) upper plate crust cast of Efate
Island The total area affected by this earthquake was about 10 times
larger than the area expected for the rupture zone of an earthquake with
magnitude of the July 1981 event [Chatelain et al 1983]
(B) Prominent Clusters
Aside from aftershocks of the August 1979 and July 1981 events the
Efate -Malekula region also experienced several remarkable earthquake
clusters Some of these have the characteristics of an aftershock
sequence with the initiating event having the largest magnitude (and
sometimes preceded by a few foreshocks) Others have characteristics
intermediate between an aftershock sequence and a swarm [Mogi 1963] where
there may be several dominant shocks within the sequence and a more
symmetric shape to temporal variation of the number of events per unit
time The clusters are shown together with the larger aftershock sequences
in the summary of seismicity presented in Figure 18 For clarity the
aftershocks of the August 1979 and July 1981 events are represented by the
first nine days of activity
(A) Clusters in the forearc region The first cluster recorded by the
local network occurred in late September and early October 1978 near the 1
38
September mainshock (Figure 18A) and can be considered as a late part of
the aftershock sequence of the 1 September event The location of this
cluster however is activated again in later clusters (December 1979
August 1983 and April 1984) Figure 18A shows the next significant
activity in the region a cluster of earthquakes in December 1978 located
west of the August 1979 aftershock zone beneath the New Hebrides trench
The region was then fairly quiet until March 1979 when an intense cluster
of earthquakes occurred over a period of five days (Figure 18B) Activity
in the same area resumed again in April 1979 for a period of two days The
most active parts of both clusters are located at the same place which
defines an east - west trending zone located near the epicenter of the 26
August 1979 event and at the junction of the 17 August and 26 August
aftershock zones
After the August 1979 shocks three clusters occurred in December
1979 March 1980 and June 1980 (Figure 18G and 18H) near the epicenter of
the 1 September 1978 main shock (and also near the mid September 1978
cluster noted above) This location is on the eastern edge of the future
1981 aftershock zone The three clusters also tended to migrate toward the
July 1981 main shock epicenter (Figure 18G) A smaller cluster occurred in
August 1980 beneath Malekula Island (not shown on Figures) Actually the
entire region was rather quiet during 1980 The three 1980 clusters were
relatively small
In February 1981 a cluster of earthqukes occurred just west of the
location of the March -April 1979 clusters between those clusters and the
location of the December 1979 cluster (Figure 18H and 181) This location
39
Figure 18 Maps of epicenters in aftershock zones and clusters located bythe Cornell-ORSTOM network shown sequentially in time Epicenters of main shocks are shown by filled squares In each successive frame the next cluster overlays the preceding one for comparison Only successive clusters are shown in each frame All the activity recorded for the periods chosen is plotted Ten days of aftershock activity are shown for the August 1979 and July 1981 earthquakes
(A) 1 September 1978 main shock with September-October 1978 cluster (open circles) and December 1978 cluster (open squares)
(B) 27 January 1979 mainshock (no aftershock activity) with clusters of March-April 1979 (filled circles)
(C) Foreshock sequence for 17 August 1979 (open circles) (D) 17 August 1979 mainshock and aftershok sequence (filled circles)(E) 26 August 1979 mainshock and afters]ock sequence (open circles)
back-arc activity in September 1979 (crosses) (F) Cluster in December 1979 (filled circles) (G) Clusters in March 1980 (open circles) June 1980 (open squares) and
February 1980 on Efate island (plus signs) (H) Cluster in February 1981 (filled circles) (I) 15 July 1981 foreshocks (open circles) and June 1981 back-arc cluster
(plus signs) (J) 15 July 1981 aftershock sequence (filled circles) and back-arc activity
during July 1981 (plus signs) (K) Clusters in September-October 1981 (open circles) and activity on Efate
island in December 1981 (plus signs) (L) 12 March 1983 earthquake and aftershock sequence (filled circles) (M) Cluster in June 1983 (open circles) (N) 3 August and 5 August 1983 events and aftershock sequence (filled
circles) (0) Clusters in April 1984 (open circles) and in the back-arc near Epi
Island in March 1984 (plus signL) (P) Cluster in October 1984 (filled circles) (Q) Clusters in February 1984 (open circles) and April 1984 (open squares) (R) 3 July 1985 aftershock sequence (filled circles)
17
deg A B c
o 0W
0
03
0
00
(0C
0
00
00
0cn9
0
13g
0
o
000
o
0 000
0 0
0
0o 0
0 o 0S
(So
0
0
17
17 sclo
deg D c
p 0 0-
F
O 0 0 1800
O00 0
000
0 0 00 0
0 +
167 E 168 1690 167 E0 0
168 169 167 E 00
168 169
0 0
17
S
18
a I
0deg0Ck G
06+04
13 degp
~ - Ho
-to+00 0 o0o0o
0+1
I
0 0 +
18-
0
0O
A- V
J
+
- 00 B +o
K0 00 o0
L 0
0
0~
+
17 0
0
0j AbullB
0
0 0 0
0
0e
0 06
0 000
0
g oo
000
0+ 0olo
9
00
f 000
00 eFo 0 Q000
01
0 0
0 o00 1 0
o 0
1 7 E1 8116767E 168 169 167 E 168 169
I-0
16
7
0 o k3 ~
00
00
0 0
o 00
_o-I -
00 0 0
0 00
0
00
17s IP
0
00 00
13
01
0
0
00
000 0shy18
1868
CP 0 0t
00
169 167o
8
0
00
00
3
17E168 169 167 E 168 0 0 169 167 E 168 169
43
is part of the overlapping aftershock zones of the August 1979 events and
is also at the southern limit of the 15 July 1981 aftershock zone
The clusters thus have a very close spatial relationship to the
aftershock zones of the main shocks They occurred near the boundaries of
the aftershock zones and appear to be related to features delimiting or
defining the spatial development of the aftershock zones (see also
Chatelain et al 1986)
From February 1981 until August 1982 except for the aftershock
sequence of the July 1981 earthquake not a single fore arc cluster was
detected in the Efate Malekula region- Starting in September 1982
clusters began to occur around the former July 1981 immediate aftershock
zone In September and October 1982 four clusters occurred south of and
beneath Malekula Island (Figure 18K) Besides the aftershocks of the 15
July 1981 earthquake the September - October 1982 clusters were the most
prominent activity in the Malekula region during the entire 1978-1984
period These clusters did not occur at random places The first one was
located beneath Malekula Island at the site of the previous cluster in
1980 The second cluster is lcated southwest of Epi Island in an area
which experienced significanc activity during the aftershock sequence of
the 15 July 1981 earthquake (compare Figure 17C and 18L) The third
cluster shows a very linear pattern trending southwest - northeast right
along the extension of the northern edge of the 15 July aftershock zone
The fourth cluster then occurred beneath southern Malekula Island
In March and June 1983 two clusters occurred in the southern part of
the Efate zone The March 1983 cluster (Figure 18L and 18M) occurred near
the January 1979 epicenter and comprised a relatively small aftershock
44
sequence of a magnitude (Ms) 58 earthquake The June 1983 cluster
occurred just south of the July 1981 aftershock zone (Figure 18M and 18N)
This cluster affected the same zone which had already been affected by both
foreshocks and aftershocks of the 17 August 1979 mainshock Most of the
cluster occurred after a magnitude (mb) 54 shock which was the largest
event in the cluster The cluster thus has the charactistics of an
aftershock sequence but one with an abnormally large area for the main
shock magnitude The main shock was also preceded by a small foreshock
sequence that started a day before and stopped six hours before the main
shock
In August 1983 a dense cluster following a Ms - 56 and a Ms - 57
event occurred northwest of Efate Island (Figure 18N and 180) The latest
cluster recorded in the region occurred in April 1984 again activating the
same zone (Figure 180)
(2) Clusters in the back-arc region Although the back-arc region is
usually relatively aseismic there were clusters of earthquakes located
east of Efate Island and beneath Efate Island itself The clusters were
shallow and located in the island arc crust The areas affected were much
smaller than those in the forearc clusters Three of the clusters occurred
just before or after the August 1979 and July 1981 main shocks (Figures
18E 18F 181 and 18J) The August 1979 event was followed in September
1979 by a cluster east of Efate and in February 1980 beneath Efate The
July 1981 main shock was preceded in June - July 1981 by a swarm occurring
just south of the cluster following the August 1979 events Another
cluster occurred shortly after the July 1981 event at the same place The
July 1981 main shock was also followed by a swarm on Efate Island at about
45
the same place as the one following the August 1979 earthquakes No
clusters have been located in the Efate back-arc region from December 1981
when the last swarm occurred on Efate Island up to the most recent data
available October 1984 thus giving support to the close temporal
relationship between these clusters and the 1978 - 1983 sequence (see also
Chatelain et al 1986) In December 1980 a larger cluster occurred
farther east near the Coriolis trough (not shown on figures) The only
other back-arc activity occurred in March 1984 farther north just south of
Epi Island (Figure 180)
(3) Summary of Results from the Cornell-ORSTOM Network Investigation
of the patterns of seismicity associated with the earthquakes which have
occurred within the Cornell-ORSTOM network has shown that (1) not all
medium to large size events are associated with foreshock activity (2)
long term precursory activity sometimes occurs but not with enough
consistency to use in forecasting an impending event and (3) some zones
are activated before and after the main shocks without defining any clear
cycle (Chatelain et al in press) These earthquakes and their associated
seismicity suggest that specific features along the interplate zone
produced by the interaction of structures in the overriding and subducted
plates appear to control the seismicity in the Efate region (Chatelain et
al in press Isacks et al 1981)
Seismic Potential Studies Along the New Hebrides Arc
The earthquake hazard from the interplate zone is generally high
because of the rate of relative motion of the two plates (approximately 11
cmyr) and the stick-slip nature of the boundary However in addition to
large to great earthquakes along the plate interface moderate to large
46
magnitude events can occur within either plate and cause considerable
damage locally
One approach to determining the seismic potential of a region is to
identify a seismic gap or portion of an arc that has not produced a large
earthquake for some period of time The identification of a seismic gap
does not mean that a large earthquake will necessarily occur in a given
region because not all gaps will produce large earthquakes The gap may
indicate that (1) the section of the plate boundary is locked stress is
accumulating along the interface and will be the site of a future
earthquake or (2) the relative plate motion is being accommodated by
continuous slippage (aseismic creep andor by slip during small and
moderate events) such that sufficient stress to generate large earthquakes
along that section of the plate boundary does not accummulate Historical
information regarding the occurrence of earthquakes in a particular region
and regional tectonic constraints are necessary to clarify which of these
two possibilities is valid for the region in question In many cases
however the historical record may be incomplete or too short to accurately
determine which option is correct
Evaluation of the recurrence history of a particular region can be
investigated using (1) Teleseismically recorded earthquakes (2)
recurrence relations of smaller earthquakes recorded by seismograph
networks (3) pre-instrumental historical records of large earthquakes and
(4) evidence of prehistoric and historic large earthquakes observable in
the geological record Recurrence relations may help determine return
periods for certain sizes of earthquakes Recurrence intervals are
dependent upon the observations of seismograph networks and-are incomplete
47
since the period of record keeping is short compared to the time necessary
to develop these relationships Indirect evidence of large earthquakes can
sometimes be found in the geologic record in the form of uplift rates and
used to address the problem of recurrence intervals However information
obtained from the geologic record is necessarily limited in accurracy
McCann (1980) has divided the New Hebrides arc into different zones
and assigned values of seismic potential to these zones (Figure 19) based
on his study of historical and instrumental seismicity He has assigned 6
different divisions based on his study of the historical record (1) site
of a great (Ms 7 34) earthquake more than 100 years ago (2) site of a
great earthquake within the past 100 years but more than 30 years (before
1978) (3) incomplete historical record but indication that the region may
have the potential for a large earthquake (4) plate motion is subparallel
to the arc (5) no historical record of a great earthquake and the region
may not have the potential for one and (6) site of a large earthquake
within the past 30 years and presumably the lowest seismic potential
Marthelot (1983) used PDE data to determine some general segmentations
in the seismicity of the New Hebrides arc and the patterns of seismic
activity that characterize these segments (Figure 20) Marthelot (1983)
found that coupled interplate large (Ms lt 79) thrust earthquakes which
are preceded by intense activity dominate the northern end of the New
Hebrides arc near the Santa Cruz islands (between IIdegS and 13degS) Moderate
(Ms lt 72) thrust events concentrate between 13degS and 14degS Coupled
moderate (Ms lt 75) interplate thrust earthquakes occur near Santo and
northern Malekula islands (14degS to 165degS) The southern end of Malekula
and slightly south (165 0S to 1750S) exhibit coupled interplate thrust
48
14 S
2
19
24 I 165 E 170
Figure 19 McCanns seismic potential for New Hebrides island arc (McCann1980 See text for discussion of numbers
____
49
1650 1650 2 6 63 - 41 100
0 COUPLED INTER-INTRAPLATE THRUST
7467 e34 34
w
= EVENTS PRECEDED
BY INTENSE 24
AACTIVITY U I 44 CONCENTRATION
OF THRUST EVENTS
64-72 21O210
3
COUPLED 2061 73 0 _00
s INTERPLATE - 0 0C w THRUST EVENTS 78
PRECEDED BY 45t58C-150
DONUT PATTERNS 16 46 I S
81 03Q STEADY HIGH RATE L2 062 501 4 4
02ONLY ONE THRUST EVENT 61 025 INTRAPLATE200 ACTIVITY A 43
81 _0 2 O V CLUSTERS OF 72 73
RECURRING 76 150Q20 THRUST EVENTS 200
SLOW EXPANSION 4 OI01
OF ACTIVITY 8I 80 26 43 IN 198081- 13Do NO PRECURSORY
PATTERN 0 66 26
170 0 E 1720 170 0E 1720
Figure 20 Summary of the characteristics of the distribution of shallow earthquakes along the New Hebrides island arc The dashed line representsthe axis of the trench The trench disappears in the central part of the arc Horizontal lin separate regions characterized by distinct seismicity patterns Middle figure shows years of occurrence of large(Ms gt 70) and moderate-sized events (ms gt 60) 1961-1981 Right figureshows the large earthquakes that occurred from 1900 through 1960 (Marthelot and Isacks 1984)
50 earthquakes that are not quite as large (Ms lt 72) The zone west of Efate
(175degS to 18degS) exhibits a steady high rate of seismicity with magnitudes
(Ms ) less than or equal to 72 Between 18degS and 20degS intraplate activity
(Ms lt 72) dominates South of Anatom (eg south of 20degS) the seismicity
is characterized by clusters of recurring thrust events that do not exhibit
any precursory activity
In another study utilizing the PDE data set Wyss et al (1983) and
Habermann (1984) have used the shallow New Hebrides seismicity in order to
(1) identify areas of higher and lower strength within the plate interface
which might control the rupture length of future earthquakes and (2) test
for changes in the rate of seismicity prior to large earthquakes using a
statistical procedure The trend toward low stress drops in the central
portion of the arc near the intersection of the dEntrecasteaux Fracture
Zone with the New Hebride Trench is consistent with other studies which
indicate that this region is anomalous However a region of high or low
strength does not indicate anything about the nature of the region and
these regions do not help pinpoint when a large destructive earthquake
will occur within or near them
ASSESSMENT OF EARTHQUAKE HAZARD
Seismotectonic Provinces
We propose the following seismotectonic provinces and the maximum
probable (but not absolute) sizes of earthquakes be considered for the
subregions within Vanuatu when considering a design earthquake for these
regions (Figure 21) These provinces are based on the instrumental history
of earthquakes near Vanuatu The northern end of the New Hebrides Trench
is a complex zone of deformation where the interplate motion is changing
51
M612
13
S 0 0
18
231 165 E 170
Figure21 Earthquake potential for Vanuatu
--
--
52 from thrusting in the southern portion to mostly strike-slip motion in the
northern portion and has the potential for great (Ms 8) earthquakes The
central portion of the New Hebrides Trench here called the Santo
Malekula segment exhibits characteristics different from the rest of the
arc as the result of the dEntrecasteaux ridge interaction and has the
potential for Ms 7 34 earthquakes The southern end of the New Hebrides
Trench here called the Efate Tanna segment may have the potential for
Ms 8 earthquakes The extreme southern end of the New Hebrides Trench is
another complex zone where the interplate motion is changing from thrusting
in the north to strike-slip motion in the south and may be limited to
infrequent moderate (M 7 12) earthquakes Other sources of seismicity
include back-arc spreading east of the New Hebrides Trench (Ms 7 12) and
diffuse shallow activity along the Hazel-Holme Ridge (Ms 7) in the North
Fiji Basin (Ms 6 12)
One method for estimating the maximum possible magnitude earthquake in
a region is to look at the amount of deformation that has accumulated from
past earthquakes The deformation is assumed to be proportional to the
square root of the energy released by a powerful earthquake The energy
(E in joules) of each earthquake can be calculated from its magnitude (Ms)
using a formula developed for the region Pr~vot and Chatelain (1983) have
used the formula
Log E - 48 + (15 x Ms)
to calculate the amount of energy which has been released since 1965 in the
central portion of the arc (Figure 22) The calculated values tend to fall
within a range of values which can be bounded by two parallel lines since
deformation occurs more or less uniformly in time The maximum possible
E1 2 106 600 (joules )
500
400
300
200
136 shy
100
65 70 75 80 82 ANNEES - YEARS
Figure 22 Seismic energy release along the New Hebrides Arc since 1965 (Chatelain and Pr~vot 1983)
54
magnitude earthquake calculated by this method is Ms - 76 Prdvot and
Chatelain (1984) computed a similar result using all of the earthquakes
which have occurred since 1900
Ground Motion
Once the location and magnitude of potential earthquakes have been
determined for a region the next step is to determine the characteristics
of the ground shaking at a particular site This accomplished by the
condsideration of such quantities as earthquake source mechanism
epicentral distance and geometry and physical properties of the geologic
structures located between the source and the site
Strong-motion records provide one measure of site response To date
a relatively large number of strong-motion records have been generated in
the far-field of large earthquakes especially in California and Japan In
contrast relatively few near-field records of moderate and large shocks
have been recorded in island arcs These few have shown large scatter with
unpredictable results The 3 March 1985 Chilean and 19 September 1985
Mexican earthquakes constitute the most important exceptions and are
invaluable additions to the library of strong motion data for subduction
zones Nor-theless these two events do not constitute a databank of
information especially for intraoceanic tectonic settings such as Vanuatu
A major difficulty arises in trying to translate past earthquake size
(intensity values) which are based on cultural effects or magnitudes
derived from widely varying instrumental parameters into values of ground
motion The development of earthquake resistant design is usually based on
intensity of ground motion at a particular site The most widely applied
standard of comparison for strong motion data is the peak ground
55
accelereation (PGA) Figure 23 shows a general relationship between peak
acceleration and distance from hypocenter which has been derived from
worldwide earthquake data Some earthquakes generate relatively high
single peaks of ground accleration which represent little ground energy
Therefore on an absolute basis the use of PGA can be misleading for
smaller events
Peak ground accelerations are easily obtained from accelerogram
records however most historical information consists of earthquake
intensities Numerous relationships between ground acceleration and
Modified Mercalli intensities have been developed (Table 3) Two of these
proposed relationships are shown in Figure 24 For worldwide data Murphy
and OBrien (1977) have computed statistical correlations between Modified
Mercalli intensity values and ground accelerations (horizontal and
vertical) Theresultant relationships and the geometrical standard
deviation (s) are
log Av - 028 Imm - 040 s - 253
log Ah - 024 Imm- 026 s - 219
where -Av peak vertical ground acceleration
Ah - peak horizontal ground acceleration
Imm - Modified Mercalli intensity
Using the relationship of earthquake intensity to distance and size of
Fiji earthquakes Everingham (1984) has produced a plot for the Fiji region
(Figure 25) Although these results are for a nearby region they give a
general indication of what might be expected for Vanuatu Figure 26
(Prdvot and Chatelain 1983) shows the recurrence of Modified Mercalli
intensities per number of earthquakes
56
1000 1 I l I I eO58 M(R 5 -X A= 1320 e R+25)152
5
MEAN + a =2N01 - STANDARD 2-
oe DEVIATIONbullbull- ~0 MEAN + 2
tbull 0o - STANDARD - oo o DEVIATIONS Jf E N o 0
LU0
U 01 0_ o o 0-oo n 00 bull
L) em a00
- MEAN - shy - 4ra 00 L 0 W STANDARD 0-~DEVIATIONWL 000 to
0 ME N -2 1 STANDARDUx 0
DEVIATIONS
101- 10 - 000
D N O oENTE K - 1 so-
10 100 1000
DISTANCE FFROM HYPOCENTEFR IN KILOMETEFRS
Figure 23 Acceleration-attenuation relations derived from worldwide earthquakes (Hays 1980)
57
Table 3 Characteristics of the data samples used in selected studies of the correlation of ModifiedMercalli intensity and peak ground acceleration (modified fom OBrien et al 1977)
Number and Range of location Number Modified Mercalli Distance Acceleration
Study of earthquakes of recordings intensity
Gutenberg and 61 Western 167 n-VIII Richter 1942 United States 1956
Neumann 1954 10 do
Hershberger 1956 60 do Coulter Waldron dodo
and Devine (Not based 1973 entirely on
observed data)
Trifunac and 57 do Brady 1975c
10 V-VIII
108 J-Vil IV-X
187 IV-X
range (kin) range (cms2)
3-450 1-300
Averages of 40-300 25 and 160 (distance dependent) - 1-300 Short distance 6-3000
(Dependent on site geology and local amplification)
Figure 24 Proposed relationships between earth quake intensities and peack accelerations
59
DEPTH 20KM
7shy
6- 6 0
075 502
61 h0
DISTANCE KM
Figure 25 Modified Mercalli earthquake intensities observed in Fiji as a function of magnitude and epicentral distance (Everingham 1984)
60
10
0
5CI I-C)
0i
0
o
01 a)o
PORTVILA = SANTO
00
E
0212
000
E
z
Degres Mercali _ Mercalli degrees
Fiue-2 Frequency of Modified Mercalli earthquake intensities felt in Port Vila and Santo (Chatelain and Prfivot 1983)
61
Tectonic Uplift
Studies of longer term island uplift on Santo and Malekula as
evidenced by the uplift of coral reefs have related segmentation of these
islands to features of the subducting topography of the dEntrecasteaux
fracture zone (Taylor et al 1980) The proximity of these two islands to
the main interplate thrust zone and the growth of the coral reef terraces
around the islands has resulted in preservation of long-term deformation
Taylor et al (1980) have studied late Quaternary coral reefs that have
been uplifted on Santo and Malekula islands They identified four main
blocks based on long-term tilt differences (Figure 27) The rupture zones
of the 1965 and 1973-1974 earthquake sequences correlate to the tectonic
discontinuities in the Santo -- Malekula region Taylor et al (1980)
studied the uplift of coral terraces on Malekula over a period of three
years (976 1177 and 779) and found that just over 1 meter of uplift
had occurred in the northern part of the island as a resalt of the 1965
earthquake (Figure 28 Table 4)
Tsunamis in Vanuatu
Tsunamis (seismic sea waves) are caused by displacements in submarine
topography that are induced by earthquakes andor volcanic activity
occurring below or near the floor of the ocean Low-lying areas near the
shore are particularly vulnerable to damage by these waves The shallow
seismic zones of the Southwest Pacific have a history of earthquakeshy
generated tsunamis (Figure 29) A few tsunamis have originated in the
Vanuatu region A tsunami was produced by the first earthquake of the
March 1875 sequence (Iida et al 1967) The earliest known significant
one was the 10 January 1878 earthquake which produced a large tsunami
62
1167030E
AK-A 150 30 S
Tasmaloum Arkialo
NORTH MALEKULA
X Direction of tilt inferred from reef terraces 16000S
Tilt discontinuity
Pliocene and Quaternary shy sedimentary rocks mostly
coral limestone
r Pre-Pliocene sedimentaryand igneous rocks SOUTH
MALEKULA
160305
Figure 27 Tectonic uplift associated with the 1965 Santo earthquakes (Taylor et al 1980)
63
Contour Interval =02 m 02--- 04 - hp
0-6- shy08 xx16 000Sshy
08 9
06
02 i
00
160 30S a
167 0 00E 167 030E
Figure 28 Measurements (meters) of 1965 uplift made in September 1976November 1977 and July 1979 The letters on the figure represent the places and amounts of uplift given in Table 2 The contours of uplift(contour interval - 02 ) represent one of the simplest interpretations of the uplift pattern consistent with the measurements (Taylor et al 1980)
64
TABLE 4 Uplift Measured Along the Coast of Northern Malekula
Year Number ofStation Place Name Measured Measurements a Southwest Bay 1977 observationb Bamboo Bay 1977 observation c Dixon Reef 1977 Id Lambubu Bay 1976 15 e West Bay 1976 5f Horrok 1976 Ig Brenwe 1976 4h Liwout Point 1976 1979 50i East Leviamp 1976 4j West Leviamp 1976 6k Elephant Point 1976 17I Win 1979 24 m Wihet Bay 1979 23 n Rambak 1979 30 o Npennanavet 1976 10P Matanvat 1976 4 q Potovrou 1977 1 r Atchin Island 1977 observations Wala Island 1977 observation t Norsup 1977 I u Lamp 1977 observation
Insufficient measurements for a standard deviation to be useful
Figure 29 Tsunami history of the Southwest Pacific Filled circles indicate locations of tsunaznigenic events dashed circles indicate inferred locations of tsunamigenic events
66
(12-17 m lida et al 1967) and 6 meters of uplift of the harbor at Port
Resolution (Warden and Mitchell 1974) Other earthquake generated
tsunamis have occurred in 1961 1965 and 2 in 1967 (lida et al 1967)
While major Pacific-wide tsunamis such as those generated along the South
American or Alaskan plate margins apparently do not affect Vanuatu
significant local tsunamis may be generated by large shallow earthquakes
occurring within the region
Volcanic Eruptions in Vanuatu
Volcanic activity is concentrated in the central belt of the Vanuatu
island arc Much of the present activity is confined to solfataric
eruptions however explosive eruptions are known (eg the 1878 Yasowa
eruptions)
In general the potential effects of a volcanic eruption on the
inhabitants of the islands of Vanuatu are small except for those people
who are living in the immediate vicinity of an active volcano However
evacuation of inhabited volcanic islands may be necessary in larger
eruptions Even distant volcanic eruptions such as those at Home Reef in
the Kingdom of Tonga during March 1984 produced large quantities of pumice
some of which rafted across large portions of the Southwest Pacific The
floating pumice interfered with shipping throughout the Southwest Pacific
region (SEAN Bull 1984)
IMPLICATIONS FOR MITIGATION OF EARTHQUAKE RISK
Several significant steps may be taken that will significantly
mitigate the loss of life and property from future earthquakes in Vanuatu
The following five steps provide suggestions for mitigation of the
earthquake risk
67
Earthquake Education
First an earthquake education program such as that adopted in Fiji
or Papua New Guinea is strongly recommended At minimal cost to the
Government such a program may be mounted through the schools Red Cross
programs and through the news media In other countries earthquake
education programs have taught simple methods of strengthening house
construction and minimizing hazardous conditions within the home they
have warned of tsunami hazards to coastal dwellers they have instructed on
proper behavior during an earthquake they have helped to encourage storage
of emergency food water and equipment in many households and
importantly they have helped avoid panic during an earthquake and
stimulated cooperation with government officials following such a disaster
Earthquake education programs are effectively combined with other disaster
preparedness programs (eg cyclones floods and so on) An example of
educational materials prepared by the Fiji Mineral Resou-ces Department is
included in Appendix IV
A few simple measures can be taken to reduce the likelihood of damage
to personal property A system of baffles in water reservoirs can reduce
the chances of seiches being set up in the tanks and the ultimate collapse
of the towex if the motion is large enough Large heavy objects should
not be put in high places where they can be easily dislodged unless they
are anchored in place This would apply to things like stereo speakers and
other objects that might be on shelves Products on shelves in stores and
books in offices can be restrained with wire retainers along fronts of
shelves Heavy objects that could tip over (such as hot water heaters and
gas tanks) can be fastened with anchoring bands This is especially a
68
concern with gas tanks which could fall over rupture lines and result in
fire
Building Codes
Second adoption of building codes for Vanuatu is imperative There
is a real danger of a large earthquake occurring very close to Port Vila or
Luganville In general the adequacy of construction is a major factor
controlling the damage and loss of life brought on by such an earthquake
Building codes designed for areas of similar earthquake hazard such as New
Zealand Code A California Building Codes or Papua New Guinea Codes 1 or
2 would be appropriate for Vanuatu Observation of such codes is most
crucial for public multistory buildings in the major towns of Port Vila
Efate and Luganville Santo As important as the design of such buildings
are the construction methods and guality of construction material used to
implement building design Careful monitoring of construction by competent
engineers is important for critical facilities The traditional houses
have kept down past losses of life and property but increasing population
and rapid urbanization can result in higher potential damage if
earthquake-resistant designs are not implemented One of the primary
reasons for property damage resulting from the Mere Lava earthquakes was
related to the siting of newer homes Houses located on steep slopes
suffered damage when they were not situated on competent substrate (Figure
30) The shaking of the fill and loose soils by the earthquakes caused
unconsolidated materials to shift under the foundations
Emergency Civil Defense Procedures
Third development of specific Civil Defense plans for emergency
procedures following an earthquake or tsunami should be initiated Of
69 a ) Poorly - situated house
and terrace e
house built too far over slope Rear
0 R
near cutting vertical and too backwall of house
bull e
b ) Earthquake- induced slope movements
-7 Rear cutting collapses pushingForward terrace edge - house orward
subsidesunder mining huefrad house foundation shy
Landslippage here
c) Well- situated house and terrace Good distancebetween house and
Good between
distance house
cutting
ond sopr I Rear cutting slope back and planted with natural vegetation
Figure 30 Sche7atic representation of causes of damage to poorly sited houses and suggestions for future house contruction in areas of loosely consolidated soil
70 course earthquake preparedness plans have much in common with hurricane or
other natural disaster planning but specific effects of earthquake
occurrence must be considered structural damage to multistory buildings
interruption of water supply disruption of electrical and gas lines
secondary geological effects such as ground liquefaction or landslides in
the near-source region complicating effects of aftershocks in the days and
weeks following a major earthquake The primary structure for such civil
defence plans already is in place in Tonga Programs specific to the
earthquake hazard may be added following similar programs in Fiji Papua
New Guinea and New Zealand
Long-term Seismicity Observations
Fourth long-term seismicity and strong motion observations should be
continued In the long-term such information will help to refine
estimates of seismic potential along the New Hebrides plate boundary they
will help to more directly and accurately assess the ground motion
parameters of direct concern to engineers for building design in
Vanuatu--ground acceleration frequency spectra horizontal and vertical
components of ground motion local amplification effects and so on
Furthermore seismicity patterns may provide a key to long-term forecasting
and short-term prediction of the location and size of future earthquakes
that may affect Vanuatus population
Internationa Cooperation
Fifth international cooperation among the island countries of the
Southwest Pacific and foreign agencies (eg US Geological Survey
ORSTOM etc) may significantly help in Vanuatus earthquake preparedness
program All of the countries affected by earthquakes (Vanuatu Western
71
Samoa Fiji Tonga Solomon Islands Papua New Guinea and New Zealand)
have to varying degrees developed earthquake preparedness programs
Vanuatu may take advantage of the previous current and any future efforts
of the other countries in the region
72-76
References
Atkin R J (1968) On volcanoes in the New Hebrides and Banks Islands Quarterly J of the Geologvical Society of London 24 305-307
Calder N 1972 The Rescless Earth A Report on the New Geology The Viking Press New York N Y
Carney J N and A Macfarlane (1979) Geology of Tanna AneityumFutuna and Aniwa New Hebrides Geological Survey Regional Report 71 pp Carney J N and R Campillo (1980) An investigation into damage causedby seismic activity on Mere Lava during May 1980 Geological Survey DeptOf Vanuatu Report
Chase C G (1971) Tectonic history of the Fiji Plateau Geol Doc Amer Bull 82 3087-3110
Chase T E B A Seekins J Daniel and J Y Collot (1983)Topography of the Vanuatu region map US Geological Survey Alexandria VA
Chatelain J L R K Cardwell and B L Isacks (1983) Expansion ofthe aftershock zone following the Vanuatu (New Hebrides) earthquake on 15July 1981 Geophys Res Lett 10 385-388
Chatelain J L B L Isacks R K Cardwell R Pr6vot and M Bevis (inpress) Patterns of seismicity associated with asperities in the centralNew Hebrides Island Arc J Geophys ResChinn D S (1982) Accurate source deths and focal mechanisms ofshallow earthquakes in western South America and in the New Hebrides island arc PhD Thesis Cornell University Ithaca NY
Chinn D S and B L Isacks (1983) Accurate source depths and focalmechanisms of shallow earthquakes in western South America and in the NewHebrides island arc Tectonics 2 529-563
Chiu J-M (1982) Structural features of subduction zone determined bydetailed analysis of short period seismic waves from earthquakes recordedin the New Hebrides island arc PhD Thesis Cornell University
Collot J Y J Daniel and R V Burne (1985) Recent tectonicsassociated with the subductioncollisioi of the DEntrecasteaux zone in thecentral New Hebrides Tectonophys 112 325-356
Coudert E B L Isacks M Barazangi R Louat R Cardwell A Chen JDubois G Latham and B Pontoise (1981) Spatial distribution andmechanisms of earthquakes in the southern New Hebrides arc from atemporary land and ocean bottom seismic network and from worldwide observations J Geophys Res 86 5905-5925
77
Dubois J J Lauray J Recy and J Marshall (1977) New Hebrides trench Subduction rate from associated lithospheric bulge Canadian J Earth Sci 14 250-255
Ebel J E (1980) Source processes of the 1965 New Hebrides Islands earthquakes inferred from teleseismic waveforms Geophys J Royal Astron Soc 63 381-403
Everingham I B (1984) Provisional list of felt earthquakes reports in Fiji 1941-1981 Min Resources Dept Fiji Note BP 338 17 pp
Falvey D A (1978) Analysis of paleomagnetic data from New Hebrides Bull Austr Explor Geophys 9 117-123
Geological Map of the New Hebrides Condominium scale 11000000 (1975)Ministry of Overseas Development (Directorate of Overseas Surveys) DOS 1196 British Residency Port Vila New Hebrides
Gilpin L M A L Bloom B L Isacks and M Bevis F W Taylor and C Jouannic (1982) Late Pleistocene coral reef terraces as tiltmeters on Santo Island Vanuatu (New Hebrides) EOS Trans Amer Geophys Union 63 430
Gutenberg B and C F Richter (1954) Seismicity of the Earth 2nd ed Princeton NJ Princeton University Press
Habermann R E (1984) Spatial seismicity variations and asperities in the New Hebrides seismic zone J Geophys Res 89 5891-590
Hamburger M W (1986) Seismicity of the Fiji Islands and Tectonics of the Southwest Pacific PhD thesis 312 pp Cornell University Ithaca NY
Hays W W (1980) Procedures for estimating earthquake ground motions U S Geological Surv Prof Paper 1114 77 pp
Ibrahim A K B Pontoise G Latham M Larue T Chen B Isacks J Recy and R Louat (1980) Structure of the New Hebrides arc-trench system J Geophys Res 85 253-266
lida K D Cox and G Pararas-Carayannis (1967) Preliminary Catalog of Tsunamis Occurring in the Pacific Ocean HIG University of Hawaii
International Seismological Centre (ISC) 1978-1979 Bulletin of the International Seismological Centre Newberry Berkshire United Kingdom
International Seismolog4 cal Centre (ISS) 1918-1963 International Seismoshylogical Summary Newbury Berkshire UK
78
Isacks B L and M Barazangi (1977) Geometry of Benioff zones Lateralsegmentation and downwards bending of the subducted lithosphere in IslandArcs Deep Sea Trenches and Back-Arc Basins Talwani M and W C Pitmaned Maurice Ewing Series 1 Amer Geophys Union Washington D C 99shy114
Isacks B L G Hade R Campillo M Bevis D Chinn J Dubois JRecy and J L Saos (1978) Measurements of tilt in the New Hebrides island arc in Proceedings of Conference VII Stress and StrainMeasurements Related to -Prthquake Prediction US Geological SurveyOpen-rile Report 79-370 176-221
Isacks B L R Cardwell J-L Chatelain M Barazangi J-M MarthelotD Chinn and R Louat (1981) Seismicity and tectonics of the central NewHebrides Island Arc in Earthquake Prediction An International ReviewMaurice Ewing Ser 4 edited by D W Simpson and P G Richards AGUWashington DC 93-116
Johnson T and P Molnar (1972) Focal mechanisms and plate tectonics ofthe southwest Pacific J Geophys Res 77 5000-5032
Karig D E (1971) Origin and development of marginal basins in the western Pacific J Geophys Res 76 2542-2561
Karig D E and J Mammerickx (1972) Tectonic framework of the New Hebrides island arc Marine Geology 12 187-205
Kelleher J J Savino H Rowlett and W McCann (1974) Why and where great thrust earthquakes occur along island arc J Geophys Res 794889-4898
Kroenke L (1984) Cenozoic Tectonic Development of the SouthwestPacific United Nations Econ and Social Commission for Asia and the Pacific Technical Bull 6
Lay T and H Kanamori (1981) An asperity model of large earthquakesequences in Earthquake Prediction An International Review Maurice EwingSer 4 edited by D W Simpson and P G Richards AGU Washington DC 579-592
Luyendyk B P W B Bryan and P A Jezek (1974) Shallow structure ofthe New Hebrides Island Arc Geol Soc Amer 85 1287-1300
Louat R J Daniel and B Isacks (1982) Seismicitd de larc desNouvelles Hebrides in Equipe de GOologie-GOophysique du Centre ORSTOM deNoumda Contribution Aletude godvnamique du Sud-Ouest Pacifique Travau et Documents de lORSTOM 1147 179-186
Mammerickx J T E Chase S M Smith and I L Taylor (1971)Bathymetry of the South Pacific map Scripps Inst of Oceanogr La Jolla Calif
79 Marthelot J-M (1983) Patterns of seismicity in the Vanuatu (NewHebrides) arc Regional variations and systematic evolution PhD Thesis Cornell University
Marthelot J-M J-L Chatelain B L Isacks R K Cardwell and ECoudert (1985) Seismicity and attenuation in the central Vanuatu (NewHebrides) islands A new interpretation of the effect of subduction of theDEntrecasteaux Fracture Zone J Geophys Res 90
McCann W R (1980) Large and moderate size earthquakes Theirrelationship to the tectonics of subduction Ph D thesis Lamont-DohertyGeol Observ of Columbia Univ Palisades NY
McCann W R S P Nishenko L R Sykes and J Krause (1979) Seismicgaps and plate tectonics Seismic potential for major boundaries Pure Appl Geonhys II_7 1082-1147
McGuire R K (1977) Effects of uncertainty in seismicity on estimateof seismic hazard for the East Coast of the United States Bull Seis Soc Amer 67 827-848
Mitchell A H G and A J Warden (1971) Geological evolution of the NewHebrides island arc J Geol Soc London 127 501-529
Mogi K (1963) Some discussions on aftershocks foreshocks andearthquake swarms--The fracture of a semi-infinite body caused by an innerstress origin and its relation to the earthquake phenomena (third paper)Bull Eartho Res Tnst Tokyo Univ 41 615-658
Monzier M J Y Collot and J Daniel (1984) Carte bathymetrique desparties centrale et meridionale de larc insulaire des Nouvelles-Hebridesmap Office de la Recherche Scientifique et Technique Outre-Mer (ORSTOM) Paris
Murphy J R and L J OBrien (1977) Analysis of a worldwide strongmotion data sample to develop an improved correlation between peakacceleration seismic intensity and other physical parameters ComputerSciences Corporation Rept NUREG-0402 to US Nuclear RegulatoryCommission 68 pp
Pascal G B L Isacks M Barazangi and J Dubois (1978) Preciserelocations of earthquakes and seismotectonics of the New Hebrides island arc JGeophys Res 83 4957-4973
Preliminary Determination of Epicenters (PDE) 1961-1981 MonthlyBulletin National Earthquake Information Service US Geological SurveyAlexandria Va
Pr~vot R and J L Chatelain (1982) Seismicity and seismic risk inVanuatu Report No 5-83 Centre ORSTOM Nouma New Caledonia
Richter C F (1958) Elementary Seismology W H Freeman and CompanyInc San Francisco
80
Rothe J (1965) The Seismicity of the Earth 1953-1965 Paris UNESCO 336 ppSanto T (1970) Regional study of the characteristic seismicity of theworld Part III New Hebrides island region Bull Earthquake Res Inst Tokyo Univ 48 1-18
SEAN (Scientific Event Alert Network) Bulletin 9
Taylor F W B L Isacks C Jouannic A L Bloom and J Dubois(1980) Coseismic and Quaternary vertical tectonic movements Santo andMalekula islands New Hebrides-island arc J Geophys Res 85 5367-5381
Taylor F W C Jouannic and A L Bloom (1985) Quaternary uplift ofthe Torres Islands northern New Hebrides frontal arc Comparison withSanto and Malakula Islands central New Hebrides frontal arc J of Geol 93 419-438
Trifunac M D (1976) Preliminary analysis of the peaks of strongearthquake ground motion--dependence of peaks on earthquake magnitudeepicentral distance and recording site condition Bull Seism Soc Amer 66 189-220
Trifunac M D and A G Brady (1975a) Correlations of peakacceleration velocity and displacement with earthquake magnitude andsite condition Intl J Earthquake Engr Struc Dynamics 4 455-471
Trifunac M D and A G Brady (1975b) On the correlation of seismicintensity scales with the peaks of recorded ground motion Bull Seism Soc Amer 65 139-162
Turcotte D L and G Schubert (1982) Geodynamics John Wiley amp Sons New York
US Geological Survey 1961-1985 Preliminiry Determination of Epicenters Denver Colo
Vidale J and H Kanamori (1983) The October 1980 earthquake sequencenear New Hebrides Geophys Res Lett 10 1137-1140
Wellington Seismological Observatory Geophysics Division 1953-1960 NZDept Scientific and Industrial Research Catalog of Earthuakes 1953-1960
Wray S T R K Cardwell B L Isacks E Cudert and J-L Chatelain(1983) Detailed seismicity observations in the forearc region of aconvergent plate boundary Malekula Island Vanuatu (abstract) EOS Trans Am Geophys Union 62 945
Wyss M R E Habermann and C Heiniger (1983) Seismic quiescencestress drops and asperities in the New Hebrides arc Bull Seismol Soc Am 23 219-236
81
APPENDIX I DEFINITIONS
Two measures of the size of an earthquake are magnitude and intensity
Magnitude is a measure of the energy from an earthquake source to indicate the
strength of an earthquake In comparison intensity is a measure of the amount
of ground shaking caused by the earthquake at a particular site Thus an
earthquake of a given magnitude will produce a wide range of intensities
depending largely on distance from the source
In general a small earthquake with a magnitude less than 5 may be felt
only in the area near the source and a moderate earthquake with a magnitude
between 5 and 7 will be felt over a wider area and may produce significant
damage in the area very close to the source A large earthquake refers to an
earthquake with a magnitude greater than 7 Such events are often very desshy
tructive if they are located near population centers A major earthquake
refers to magnitudes between 7 and 7 34 and a great earthquake refers to
magnitudes greater than 7 34 These great earthquakes cause widespread desshy
truction and possible regional tsunamis Generally the potential damage from
earthquakes is multiplied by the secondary effects of earthquake occurrence
such as ground faulting generation of tsunamis landslides slumping or
liquifaction
The depth of earthquakes range from the surface to approximately 700 km
depth Shallow earthquakes refer to those with depths between the surface and
70 km Intermediate earthquakes refer to those with depths between 70 km and
250 km depth Deep earthquakes refer to those with depths greater than 250 km
(but less than 700 km) Intermediate depth earthquakes occasionally produce
damage at the earths surface only if the earthquake is very large Deep
events are generally not felt
82
The seismic (earthquake) potential of a particular region is defined as
the likelihood of that region to experience a (destructive) earthquake within
particular magnitude range within a particular time period The seismic
(earthquake) hazard of a particular location refers to the amount of ground
motion that might be expected from an earthquake within or near that region
Adequate data on seismotectonic features instrumental (strong-motion) and
macroseismic (intensity) records of near-field effects of large earthquakes
source parameters of large earthquakes earthquake spectra and ground attenuashy
tion or amplification are necessary in order to reasonably evaluate earthquake
hazard for any region The seismic potential is the integration of all of
these bits of information The average length of time between earthquakes of a
particular size (recurrence interval) and the amount of time elapsed since the
last earthquake of that size help to define the probability of future earthshy
quake occurrence along a particular seismogenic zone hence the seismic
potential of that zone
Seismic risk of a particular region refers to the expected degree of
losses of people and their property which result from the seismic hazard and
the vulnerability in the region One method that has been widely used for this
risk determination (and is used here) involves the determination of a maximum
probable earthquake (design earthuake) that is likely to occur in the imshy
mediate region Calculations of seismic hazard which are based on design
earthquakes generally yield conservative estimates of risk
The most important conclusion of historical studies of seismicity is to
define the seismogenic zones of a region and extrapolate what the future earthshy
quake potential is for those zones Seismically quiescent regions refer to
regions with a lower level of seismic activity which are surrounded by more
83
active regions Portions of major plate boundaries that have not experienced a
major or great earthquake during a particular time interval are seismic Raps
This time interval is taken to be a significant portion of the earthquake
recurrence interval for a large earthquake An estimate to within several
decades of the location and size (magnitude) of a large earthquake constitutes
a forecast If a precise calculation of the time and probability of occurrence
can be added to the location and size information then the estimation is a
prediction
84
APPENDIX II MODIFIED MERCALLI INTENSITY SCALE (1956 VERSION)
Masonry A B C D To avoid ambiguity of language the quality of masonry brick or otherwise is specified by the following lettering whichhas no connection with the conventional Class A B C construction)
Masonry A Good workmanship mortar and design reinforced especiallylaterally and bound together by using steel concrete etc designed to resist lateral forces
Masonry B Good workmanship and mortar reinforced but not designed in detail to resist lateral forces
Masonry C Ordinary workmanship and mortar no extreme weaknessez likefailing to tie in at corners but neither reinforced nor designed againsthorizontal forces
Masonry D Weak materials such as adobe poor mortar low standards ofworkmanship weak horizontally
DESCRIPTION (INTENSITY VALUES RANGE FROM I TO XII)
I Not felt Marginal and long-period effects of large earthquakes
II Felt by persons at rest on upper floors or favorably placed
III atlt indoors Hanging objects swing Vibration like passing oflight trucks Duration estimated May not be recognized as an earthquake
IV Hanging objects swing Vibration like passing of heavy trucks orsensation of a jolt like a heavy ball striking the wallsStanding motor cars rock Windows dishes doors rattle Glassesclink Crockery clashes In the upper range of IV wooden walls and frames creak
V Felt outdoors direction estimated Sleepers wakened Liquidsdisturbed some spilled Small unstable objects displaced or upset Doors swing close open Shutters pictures move Pendulum clocks stop start change rate
iOriginal 1931 version in Wood H 0 and F Newmann 1931 Modified
Mercalli Intensity Scale of 1931 Bull Seis Soc Amer 53 979-9871956 version prepared by Charles F Richter in Elementary Seismology(1958) 137-138 W H Freeman and Company
VI Felt by all Many frightened and run outdoors Persons walk unsteadily Windows dishes glassware broken Knickknacks booksetc off shelves Pictures off walls Furniture moved or overshyturned Weak plaster and masonry D cracked Small bells ring(church school) Trees bushes shaken (visibly or heard to rustle--CFR)
VII Difficult to stand Noticed by drivers of motor cars Hangingobjects quiver Furniture broken Damage to masonry D includingcracks Weak chimneys broken at roof line Fall of plasterloose bricks stones tiles cornices (also unbraced parapets andarchitectural ornaments--CFR) Some cracks in masonry C Waves on ponds water turbid with mud Small slides and caving in alongsand or gravel banks Large bells ring Concrete irrigationditches damaged
VIII Steering of motor cars affected Damage to masonry C partialcollapse Some damage to masonry B none to A Fall of stucco and some masonry walls Twisting fall of chimneys factory stacks monuments towers elevated tanks Frame houses moved onfoundations if not bolted down loose panel walls thrown outDecayed piling broken off Branches broken from trees Changes inflow or temperature of springs and wells Cracks in wet ground and steep slopes
IX General panic Masonry D destroyed masonry C heavily damagedsome times with complete collapse masonry B seriously damaged(General damage to foundaticns--CFR) Frame structures if notbolted shifted off foundations Framed cracked Serious damageto reservoirs Underground pipes broken Conspicuous cracks inground In alluviated areas sand and mud ejected earthquakefountains sand craters
X Most masonry and frame structures and bridges destroyed Seriousdamage to dams dikes embankments Large landslides Water thrown on banks of canals rivers lakes etc Sand and mudshifted horizontally on beaches and flat land Rails bent slightly
XI Damage nearly total Large rock masses displaced Lines of sightand level distorted Objects thrown into the air
86 APPENDIX III EARTHQUAKE EDUCATION PAMPHLET PUBLISHED IN FIJI
EARTHQUAKE What to do how to help
-
bull - -C II
deg
Damage at Suva wharf caused by the 1953 -earthquakelw hich was followed by a tidal wave within 30 seconds
1 411_0- shy
87 from theA message Minister for Lands
Recent earthquakes in Waya tsunamis might be the most Island and the even more recent one effective means of mitigating which rocked the city of Suva short- the worst effects of a sudden ly after 9am on Decanber 171975 calamity in these two potentshyand the ensuing panic reaction of ially dangerous forms is to the people are sharp reminders to us know more about them that although Fiji is situated in an
Indeed the suddennessearthquake zone there is little in-the severity of a wideshyformation available to the public on and
spread disaster could disruptearthquakes and tsunamis (tidal which are often associated all communications and paralysewaves)
with the type of earthquakes we have even the most efficient and experienced in Fiji well-drilled emergency organishy
sation it is hopeZ that the infor-
Survival in those cirshymation pamphlet prepared by myministry on earthqkes and tsunamis Ceatnces would depend on
will allay some of the natural alarm each individuals own knowshy
which people exp -ence during even
the minor tremor- Because we are in an
It has been brought to my earthquake belt it would be
notice that at least one expert has prudent for people living in Fiji to make themselvespredicted the chance of a serious
earthquake in Fiji as 140 years thoroughly familiar with the
one earthquake every 40 years information contained in this pamphlet
However with the exception of the earthquake and tidal waves in I wish to take This 1953 we are fortunate not to have opportunity to appeal for your suffered a more serious earthquake full co-operation in answeringthe questionnaire on earth-
They are probably the most quakes and tsunamis which terrifying and devastating phenomena appears on page nine of known to man this pamphlet as accurately
Unlike other natural disas- as possible
ters such as hurricanes and flood- The aim of the ing the tragedy of earthquakes is questionnaire is to locate that there is no forewarning of their and map the fault-line zones coming from which it is suspected
The very recent earthquake that most of our earthquakes in Hawaii is an obvious in- originatedisaster
dicator that the science of predicting The success and the earthquakes is still in the early efficiency of any kind of stages of development emergency relief system may
Although the recent occurrence depend on your co-operation in Hawaii might not rank among the in providing the informationworlds most serious earthquakes we sought- SNWqanivavalagi
orldssrios msteathqakes weMinister for Lands and Mineralknow from the experiences of other Resources countries that earthquakes can be totally devastating
However remote the possibishyity of a serious earthquake and
2
88
7 -
Part of the damage to the Suva Harbour reef caused by the 1953 earthquake
70 per cent from FIJI area About 70 per cent of the masonry landslides or drowning
worlds deep earthquakes are recorded in the tsunami from the Fiji area Most of them are Another earthquake with not felt because they occur at great an intensity of four to five was depths of about 400 to 600 kilometres ecperienced in Suva in 1961but (24845 to 37267 miles) beneath thecasdolmirdmget
surfac of te ebuildings
These types of earthquakes are not dangerous or damaging because of the depths at which they occur ButOtra they ore scientifically interesting
because they help geologists to deduce
the structure of the crust
The types of earthquakes which can be very damaging are those of large magnitude which occur in thebecase tey Todedueelp eolgist top 50 kilemetres (3106 miles) of the earths crust
The 1953 earthquake which hcd on epicentre (origin) 15 miles west of Suva was of this type That earth-quake had an intensity of seven out of a Mercalli scale of 12 and result-ed in a tsunami (tidal wave) which occurred 30 seconds after the quake and affectedoiSuva and davu About seven people were killed by falling
Several smaller shocks have been reported since then
w here re oftenearthquake fe arrtua aaso avun
fhlare laldes odrwi savu Taveuni and recentlythe WayA - Nadi - Lautoka area
Reports received after the 1953 earthquakes also show f l itle dmage incstes t that several very strong earthshyquakes have been felt in the
Fiji area since the early 1800s A o the
caused lthu d thse in tha the increasing density of popushyltion and buildings would make the area more prone to damage unless buildings are properly reinforced to withstand strong lateral motions from earthrukes
89 Quakes come In two main types
Volcanic earthquakes are asso-ciated with the movement of molten rocks underground usually at depths of less than 30 kilometre5 near active or inactive (at surface) volcanoes
These volcanic earthquakes are
often called tremors because they tend to occur frequently and almost continuously and are often associat-ed with possible forthcoming erupt-ions of volcanoes
Fortunately it has been over a million years since volcanoes erupted in most parts of Fiji al-though the most recent volcano was probably active less than 2000 years ago in the Taveuni area
Because of the long period of
time since previous eruptions vol-
canoes in most parts of Fiji can be or least inshyconsidered extinct at
active
The possibility of another
eruption occurring at some future time cannot be totally discounted
But it should be reassuring to note that with modern advances in instru-mentation it is becoming increasing-ly possible to predict the likeli-hood of impending volcanic activity
Tectonic earthquakes the other
major (and more common) type are due
to the movements of relatively solid parts of the earths crust against each other
Such motions c 3n be in the form of the swallowing of a large portion (or plate) of the crust into a trench area
For example the Eastern Pacific plate is postulated to be drifting westward at the rate of about 10 centimetres (roughly 394
inches) a year and is being swallowed or subducted under the Western Pacific plate in the Tonga trench area
The subduction of one plate under another causes friction between the plates and causes numerous earthquakes fortunately at great depthsshyabout 500 to 600 kilometres (31056 to 37267 miles)
Tectonic earthquakes occur also along fault lines which are zones of weakness in the earths crust usually at fairly shallow crustal depth
Geologists have mapped a number of fault areas in Fiji where it is apparent that one rock mass has been moved (or displaced) relative to an
adjacent rock mass through the release of stresses and strainsbrought about during the geoshylogca dvlp n the islands
Fortunately again most
of the faults which have been mapped are thought to be inshyactive
But there are some fault zones which could be active and it is quite likely that the strong 1953 earthquake was caused by fault movement offshyshore from the Kalokolevu shyso ara
The recent earthquakes felt in the Waya - Nadi -Lautoka area could be due to fault movements several miles offshore south-west of Waya
In 1976 the Mineral Reshysources Division intends to do
detailed mapping of these possibly active fault-zone areas near Suva and in the west of Waya
Other plans are for the division to make greater use of instruments and become inshyvalved in the recording of earthquakes
9
THE MAIN DANGERS Collapse of buildings due to
lack of reinforcement poor building materials (eg adobe type) or un-satisfactory foundations
Broken overJ ead power lines can
occur quite easily and are partishy
cularly dcnprous because many people have the inclination to run outdoors when they feel a strong earthquake
Landslides are possible alongLandlidsposibe aongofae fault zones or very wet areas pbrti-cularly where hillsides are steep
One person was killed in the Namosi area by landslides during the 1953 earthquake
Earth movements and chasms People naturally tend to have a very strong fear that the earth will open up and swallow them during an earth-quake However there is only one pro-perly documented case in recorded history of a person being crushed in a fissure Basically the danger of falling into chasms is minimal and the natural terroz of people from this is apparently the result of ex-
Fire can be one of the most dangerous effects of earthquake as evidenced by the disasters in Son Francisco in 1906 and Tokyo in 1923 Perhaps the worst problem from fires caused by earthquakes is that water pipes are often broken and firemen are forced to use less accessible alternative sources such as a river or the sea
Tsunamis are a particular kind
of sea wave which can build up follow-ing an earthquake In the past they have devastated cities and small settlements along the coasts of Chile Peru Alaska Hawaii Japan and other countries These waves travel across the Pacific Ocean at jet speed (more than 600 miles an hour)
In shallow wters t5unamis become a threat to life and property because they can reach up to miore than 100ft high at wave crest levels and strike with devastating force
5
We have no official record of any extensive tsunamis in Fiji except for the one caused by the 1953 earthquake which claimed some lives in Suva andKadavu
Other tsunamis are likely to have occurred in earlier times but were not identified especially as tsunamis becauseour lack of experience with them
The barrier reef round much of the islands helps to dissipate some of the wave
energy and therefore some ofthe dangers
But we should realise that we can still bevulnerable to waves especially from a southerly direction where our reef systems are less extensive
If a very strong earthshyquake is felt in Fiji you should prudently assume that it has originated within the Fiji group and is likely to have generated a tsunami
In the 1953 case the tsunami was about csft high when it hit the reef outside Suva within 10 seconds after the earthquake
A 6ft wave then travelled across the harbour and hit the waterfront about three to four minutes later causing only
slight damage and leaving many
But the tide was low at that time If it had been high tide the waves could have been about 9ft high and the effects could have been disastrous
Waves 5ft to 6ft high
also hit Lami Deubq Be--Island and Koro Island and a 15ft-high wave claimed two lives at Nakasaleka Kadavu Smaller waves were felt at Ovalauthe southern coast of Vanua Levu and in the western Lou Group
Precautons to take Because earthquakes occur
suddenly and without warning there ore only a few precouton5 people can take such as ensuring that houses are on firm foundations and are suitably reinforced to withstand earthquakes
The following modified version of on earthquake notice is reproduc-ed from a California Geology article published in October 1975
When an earthquake occurs For a minute or two the earth may pitch and roll like the deck of a ship The motion is frighteningbut unless it shakes something down on you it is probably harmless in itself Keep calm and ride 4t out Your chances of survival are good if you know how to act
During the shaking If indoors stay indoors Got under sturdy fur-niture such as a table Stay near the centre of a building and stay away from glass Do not use condles matches or other open flames
Do not run through or near buildings particularly concrete ones where there is danger of fall-ing debris If outside stay in the open away from buildings and power lines
If in a moving ccr stop but stay inside
After the r akinq Check your water and electricity
If water pipes are damaged or electric wires are shorting turn off at primary control point If in a low-lying coastal area which can be affected by tsunamis leave house and make for higher ground (see tsunami safety rules below) Turn on radio for emergency bulletins Stay out ofaamaged buildings- aftershocks can shake them down
In a 1961 study of earthquake risks in Fiji RHoutz estimated that the chance of a strong quake occurring here -was about 140 ie
6
once every 40 years This figure should be reassuring But one must remember that it is only an estimate -and that once in 40 years could be toshymorrow
Tsunami Safety Rules Tsunamis follow no disshy
cernible pattern of occurrence When you receive a tsunami warning you must assume that a dangerous wave is on its way
History shows that when the great waves finally strike they claim those who have ihed the wnin ve
ignored the warning The following tsunami
rules were extracted from a pamphlet prepared by the US Environmental Science Services Administration and they should be noted 1 An earthquake in your
area is a natural tsunami warnshying Do not stay in 1-yving coastal areas after a strong local earthquake
2 A tsunami is not a single wave but a series of waves Stay out of danger areas until on all-clear is issued by a competent authority
3 Approaching tsunamis are sometimes heralded by a noticeshyable rise or full of coastal water This is nature s tsunami
warning and should be heeded 4 A small tsunamiat one
beach can be a giant one a few bea a Do nt le the milesaway Do not let the modestse ofowve ma you lose reect for whut may follow
5 All tsunamis - like hurricanes -are potentially dangerous even though they may not damage every coastline they strike
6 Never go down to the beach to watch for a tsunami
92
yocn thetoo L see wave you are After 5Oft
too close to escape it
7 Sooner or later tsunamishit visit every coastline in the Pacific Warnings apply to yollif you live in Suva reef any Pacific coastal Olrea
8 During a tsunami emergency A section of the Suva Harbour reef your local emergency organisations forced upwards by the 1953 earthshywill try to save your life Give quake A tsunami -(tidalwave) 50ft them your fullest co-operation high hit the reef within 10 seconds
Unless otherwise determined by after the quake and sent a 6ft wavecompetent scientists potential to the shoreThis struckdanger areas are hose less than watershyfront about three to four Ainutes 50f above sea level and within one later and caused minor Cdamage but
mile of the coast for tsunamis of only because it was at low tide any origin
7
Measuring their size Earthquake magnitudes are
measured on very sensitive seismolo-
gical instruments Theseare often referred to as the Richter scale and the largest shock known to date had a magnitude of 89 on Richter scale (compared to 675 for the 1953 Suva earthquake on the same scale)
hat is in commonAnother scale use and depends on physical effects and observations is the modified Mercalli scale which is reproduced here It measures the intensity of earthquake and is graduated from one to 12 for measuring
Modifiedl Mercalli scale1956 versiont
Earthquake intensity
1 Not felt except by a very few under especially favourable (for
the arthuak)crcustanesamountsthe earthquakes) circumstances
2 Felt only by a few persons at rest especially on upper floors of buildings Delicately suspended objects may swing
3 Felt quite noticeably indoors especially on upper floors of build-ings but many people do not recog-nise it as c earthquake Standing motor cars muy rock slightly Vib-ration like passing truck Duration can be estimated
4 During the day felt indoors by many outdoors by few At night some awakened Dishes windowsdoors disturbed walls make creaking sound Sensation like heavy truck striking building Standing motor cars rocked noticeably
5 Felt by nearly everyone many
awakened Some dishes windowsetc broken a fewinstances of cracked plaster unstable objects overturned Disturbances of trees poles and other tall objects sometimes noticed Pendulum clocks may stop
6 Felt by all many frightened
and run outdoors Some heavy furni-
ture moved a few instances of fallen plaster or damaged chimneys Damage slight
8
7 Everybody runs outdoors Damage negligible in buildings of good design and construction slight to moderate in wellshybuilt ordinary structures considerable in poorly built or badly designed structures some chimneys broken Noticed
by persons driving motor cars
8 Damage slight in specialshyly designed structures conshysiderable in ordinary substantshyial buildings with partial collapse great in poorly built structures Panel walls thrown out of frame strucTures Fall
f fameystrctresasof chimneyq factory stcks
columns monuments walls Eeavy furniture overturned Savy fniur e -turned
Sand and mud ejected in small Changes in well water
Disturbs persons driving motor
cars 9 Damage considerable in
specially designed structures well-designed frame structures
thrown out of plumb great in substantial buildings with partial collapse Buildings shifted off foundations Ground cracked conspicuously Undershyground pipes broken
10 Some well-builtwooden
structures destroyed most masonry and frame structures destroyed with foundations ground badly cracked Rails bent Landslides considerable from river banks and steep slopes Shifted sand and mud Water splashed over banks
11 Few if any (masonry) Ltructures remain standing Bridges destroyed Broad fissures in ground Underground pipelines completely out of service Earth slumps and land
slips in soft ground Rails bent greatly
12 Damage total Waves seen on ground surfaces Lines of sight and level distorted Objects thrown upward into the air
FILL THIS IN TO HELP THE EARTHQUAKE STUDY
To enable an improved study of shallow local earthquakes the coshyoperation of the public is required in filling out the following questionshynaire whenever an earthquake is felt Many earthquakes are very small and sometimes are not recorded on seismological instruments This questionnaire system will enable the Mineral Resources Division to better determine the location of earthquake zones which can then be mapped in detail
EARTHQUAKE QUESTIONNAIRE
1 An earthquake was felt on at am or pm
Place
2 What direction did the shock come from
o ooo mge oe e o o o o
3 How many seconds did the quake last
4 Was the shaking rapid or slow
5 Where were you when the earthquake occurred
6 Were you awake asleep or awakened
7 Were you walking working standing sitting or lying down
8 Did the people around you feel the earthquake too
9 Did people run outside
10 Did cracks occur in the buildings you were in
11 Was the building damaged in any otherway
o
12 What is the building made of
13 Did the windows doors dishes rattle
14 Did hanging objects doors etc swing 0000000000600
Turn to next page 9
95 15 Did vases small objects furniture overturn
e
16 Did things fall off shelves
17 Did you notice any unusual waves in the sea after the quake 00 0a -0 0 000aV0a0a0 000000a000 00
18 1f so h6w soonafterwards 0 BO
e a 0000000amp000000000amp0000 a a
What were the waves like 00000619
20 Did anything else unusual happen
0 o a o e e o o 0o e o e e eo o eo 6 o e e e oIe e e o o o adegdeg e odegI e o o oo oo oe 1 8 aampv a
21o Any other remarks e
N me a
Complete formtear out this whole page and mail to
The Director of Mineral Development Mineral Resources Division Private Bag GPO SUVA
This special booklet is published by the Ministry of Information at Government Buildings in Suva for the Ministry of Lands and Mineral Resources
(JANUARY 1976)
10
96
In the wake of the 1953 quake
1M
Crack in the coral
A -rac) in the main Suva reef after the earthquake and tidal wave in 1953
12
T SANERIVE Government Printer Suva Fiji
98
APPENDIX IV SEISMOLOGICAL FACILITIES AND EARTHQUAKE HAZARD PROGRAMS IN THE SOUTHWEST PACIFIC
As part of our program of field investigations in Fiji Tonga andVanuatu our researcher was able to visit the neighboring island countries of the Southwest Pacific region During these visits he was able to meetwith scientists and public officials involved with the earthquake hazard problem facing each country In every case the governments are aware ofand have taken some action to mitigate the potential losses due to destrucshytive earthquakes but these governmental responses have varied widely fromcountry to country This report focusses on the seismological institutionsand facilities in each of the countries and their capablities in assessingand planning for carthquake hazards In the following sections we conshysider each of the island countries of this area which face a severe earthshyquake risk Fiji Tonga Vanuatu Western Samoa Solomon Islands PapuaNew Guinea and New Zealand
FIJI
Seismological Facilities
Seismological observations in Fiji are conducted by the Mineral Resources Department a subdivision of the Ministry of Energy and MineralResourcs The government has made a major commitment to seismologicalwork since the establishment of the AID-supported seismic network in 1979In fact seismological observations in Fiji have been carried out since theearly part of this century supported at first by the New Zealand scienshytific organizations and subsequently strengthened by Lamont GeologicalObservatorys Upper Mantle Project in the 1950s and 1960s In late 1979the 8 -station US AID network was established to complement three permanent stations in Viti Levu The network was significantly expanded byinstallation of a five-station telemetered network in 1981 supported byJapanese aid (Figure Al) Additional stations were installed in 1983 and 1984 the network has now expanded to an eighteen-station national networkwith excellent coverage of the Fiji region In addition MRD now has available five MEQ-800 portable seismographs for occupation of temporaryfield sites telemetered station testing and special refraction experiments While the Fiji network has experienced considerable technical difficulties it has recorded over 2000 earthquakes since its installationand provides an invaluable basis for seismological study of the Fiji region
Strong Motion Accelerographs
The Mineral Resources Department also operates a network of strongmotion accelerographs now numbering ten Kinemetrics SMA-ls (Figure A2)The initial six instruments of this network were granted to Fiji by AIDthe remainder were purchased by the Fiji government Since establishment of the SMA network three accelerogram records have been obtained from moderate-sized earthquakes in Viti Levu Records obtained from thisnetwork are expected in the long run to provide the basis for predicting
tTT Illt EAST OF +NWICH IS0 WEST OF GREENWICH III
Y 7sdeg NATIONAL NETWORK OF SEISMOGRAPHIC STATIONS 1982
AC7
DEELLAAIKOORROOMTRE
23O~~~~ ROTUMU
YASAWAIRAR C1
00
A0 KORO
-W
0
I VUNH SOUTHRIOGE A
~)AVALAU 0
NADI A A ONASAVULAU
MAGOORO A VUNIOAWALAU
VIT LE U _LAKEPe NAMOSI AUNIAA -GAJ
ALOAA0A NAMORO SUVA
VITICLEVU
13 BEOA
LEGEND A E-isting Station
I RAKRAKI A Proposed Station Toloyo
Motulu Fuloo amp
EAST OF GREENWoICH ISO WEST Of GREENWICH ITS
Figure Al Network of seismic stations in Fiji established through the assistance of US AID and Japanese aid programs
_ _ _1_ Q__
NATIOqAL NETWORK OF EAST
STRONG OF OEEwICH
MOTION IO WEST 0 OREV-1CM
ACCELEROGRAPHS 79
LEGEND
A Accelerograph
0 30 60 KLOLETRES
LBS
YASAWA
lt ---shyVANUA LEVU U
T EUW r
S|bullKORO 0
T
V2anua bala~u
N
0
LA IV)DI A MON~ASAVU V
9LAU
VITI LEVU OKA1)
(4)
GAU
LAKE1A
0 11-
Kld
A S T O r
Maluku
GREN Wa
Toloyc
I 0 W E S T O f C REEM CN I
Figure 2A Location of strong-motion accelerographs in Fiji
100
ground accelerations and thus for development of building codes specific to Fijis tectonic setting
Related Scientific Programs
The Mineral Resources Department includes an Offshore Geology sectionwhich has an active program of marine geological and geophysicalinvestigations in and around Fiji waters MRD also employs an engineeringgeologist whose work includes microzonation of the Suva area mapping ofactive faults in southeastern Viti Levu and investigation of soils subjectto earthquake-induced liquefaction An active program of geologicalmapping and structural studies is also carried out by MRD They aresupported by personncl assistance from Australia and Great Britain
Suva is also the home of the United Nations Committee for Coordinationof Offshore Prospecting in South Pacific Offshore Areas (CCOPSOPAC) Thisorganization coordinates much of the international marine research carried on in the region and has been particularly helpful with Fijisinvestigation of its offshore waters
Critical Facilities
The major development in Fiji has been in and around the capital cityof Suva The population of the metropolitan area now exceeds 130000 and most of the government commercial and industrial operations are concentrated there The city has become a major commercialtransportation and regional political center and has developed rapidly inthe past ten years Development in this period has included constructionof multistory buildings a major electric power plant expansion of theSuva harbor and most recently completion of the thirteen-story CentralMonetary Authority building in downtown Suva Much of this development hastaken place on an area of filled land close to sea level particularlyvulnerable to earthquake and tsunami damage This area was extensivelydamaged by the 1953 Suva earthquake and tsunami and is thus at significantrisk from a repeat occurrence of an event of comparable size
Other population centers with significant development include thetowns of Lautoka (pop 29000) Nadi (13000) and Ba (9000) on the islandof Viti Levu and Labasa (13000) on Vanua Levu The tourist industrywhich is a major part of Fijis economy is concentrated on the southernand western coasts of Viti Levu and is also vulnerable to earthquake andtsunami damage The major development project in Fiji is the 87-meter highMonasavu Dam in the interior of Viti Levu The earthfill dam was completedin 1983 and is planned to provide most of the countrys electric powerneeds through the end of the century
Earthquake Preparedness Programs
In awareness of the serious earthquake risk to development in Fijithe government has adopted New Zealand earthquake design codes for most ofthe urban areas of the country Seismic zone B codes applicable to areas of moderate seismic activity in New Zealand have been chosen asappropriate and are applied (in theory at least) to all domestic andcommercial construction in urban areas Considerable difficulty remains in
101
enforcement of these regulations particularly in construction of privatedwellings Major multistory building design is generally handled by overseas (Australia or New Zealand) engineers and dynamic modelling tests are generally applied for earthquake loadings at least as large as those required by the New Zealand codes The Monasavu Dam underwent dyiamictesting by Australian consulting engineers
Disaster preparedness is the responsibility of the Emergency Services Committee (EMSEC) and the Prime Ministers Relief and Rehabilitation Committee (PMRRC) EMSEC is responsible for coordination of disaster plans maintenance of essential services advice to the Cabinet on emergency measures and direction of relief work It is comprised of representativer of the related ministries and public agencies PMRRC is chaired by the Prime Minister of Fiji and has responsibility for long-termrelief policy and rehabilitation programs Fijis experience with recurrent weather-related disasters has spurred efforts for emergencycommunication systems supply distribution temporary shelters and so on Much of this hurricane disaster planning is applicable as well to earthquake and tsunami damage Fiji is also a participant in the International Tsunami Warning System
Educational programs have been handled through the Fiji BroadcastingSystem the Red Cross and the school sysem To a limited dgree the Public Works Department and the Mineral Resources Department have producededucational materials related to earthquake hazards in Fiji
TONGA
Seismological Facilities
Seismological observations in Tonga are the responsibility of the Ministry of Lands Surveys and Natural Resources Due to fiscal constraiits however these efforts have in the past been entirelydependent on foreign assistance Seismological experiments began in Tongain the mid-1960s with Lamont-Dohertys Upper Mantle Project Seismic stations were operated by Lamont-Doherty and subsequently by Cornell scientists through the early 1970s when operations were suspended In late 1983 as part of the present AID-supported seismic hazard programCornell reinstalled a three-component short-period seismograph in the capital Nukualofa The seismograph was installed upon the request of the government geologist to be operated by the Tongan government with technical assistance from Cornell Unfortunately after operation of the seismograph for eight months Tongas Cabinet decided that the drain on its resources and personnel was excessive and the instruments were disconnected in May 1984 with the components transferred to Fiji and Vanuatu where they can be utilized There are presently no plans to reinstall permanent seismographs in Tonga
Strong Motion Acceierographs
Two strong-motion accelerographs provided by the AID seismic hazard program are presently operating in Tonga one in Nukualofa and one in the northern Vavau Islands They have been in operation for one year and
102
have not to date recorded any large earthquakes They require a minimum of maintenance and their operation will continue to be supervised by the government geologists with assistance from Cornell A third accelerograph may be made available to tonga by the British Geological Survey and could bB installed on Eua Island in a zone of high activity close to the Tonga Trench Related Research Programs
The Ministry of Lands Surveys and Natural Resources employs a singlegovernment geologist whose responsibilities include coordination of oil prospecting geolcgical mapping of the islands and assessment of earthquakeand tsunami hazards There has been considerable scientific study of the Tonga Trench subduction zone by research groups from the United StatesJapan New Zealand Australia Germany and the Soviet Union More detailed marine geophysical data have been collected near Tongatapu Island byAmerican petroleum exploration groups
Critical Facilities
The capital city of Nukualofa has a population of only 20000 butdoes include several three- and four-story buildings The larger buildingshave in general been designed by foreign engineers and have included earthquake- resistant design specifications Other significantdevelopment projects include the expansion of the government wharf in Nukualofa and development of tourist resorts on Tongatapu and several of the outer islands
Earthquake Preparedness Programs
There are no building codes presently enforced in Tonga Howeverconstruction of public buildings must be approvei by the Ministries of Works and Health The largest office buildings and hotels are designed byoverseas engineering firms and generally include some earthquake loadingcriteria The Land and Environment Act currently under consideration bythe Tongan government would require review of all development projects bythe government planner application of building codes largely adapted from New Zealand codes is expected to follow
Disaster preparedness programs are the responsibility of the Cabinets National Disaster Committee including representatives from the related government ministries and departments Subcommittees focus on disaster preparedness action planning and long-term relief and rehabilitation There is no earthquake education program in Tonga
WESTERN SAMOA
Seismological Facilities
One of the earliest seismic stations in the Pacific was established atthe Apia Observatory in 1902 during the German colonial period through the University of Gbttingen In 1921 control of the observatory was transferred to the New Zealand Government Weichert seismographs were
103
operated continuously at Apia through 1957 when they were replaced by Benioff instruments at Afiamalu and by short-period Wood-Anderson instruments at Apia Since Samoan independence in 1963 the Observatory has been operated jointly by the Samoan Government and the Department of Scientific and Industrial Research (DSIR) New Zealand In 1963 a Worldwide Standard Seismograph Station was established at Afiamalu Operation of this six-component station is supported by the US Geological Survey In 1980 the station was upgraded to allow digital reccrding equipment was added to upgrade the station to the status of a Global Digital Seismic Network station Seismic records are sent to DSIR in Wellington for permanent storage
Strong Motion AccelerograDhs
A simple strong motion instrument has been operating in Apia since 1979 It is an event-triggered low-gain seismograph recording on an ink-stylus recorder At the time of our visit to Western Samoa the instrument had been out of service for several months Only one event has to date triggered the instrument
Related Scientific Programs
The Apia Observatory has also made continuous magnetic field measurements since 1905 Measurements are currently made using a Schultze earth inductor an Askania declinometer and a proton magnetometer The observatory maintains two tide guages as part of the Pacific Tsunami Warning System Offshore resource studies have been carried out through CCOPSOPAC and by various international research groups Much of the reconnaissance geological work in Western Samoa has been carried out by DSIR in New Zealand
Critical Facilities
Like many of the other island countries of the Pacific Western Samoas development has been concentrated around the capital Apia (pop 34000) A major deep-water harbor and the countrys tourist industry are based in Apia Several multistory buildings have been erected in Apia in the past several years A hydroelectric dam on Upolu Island was completed in 1978
Earthquake Preparedness Programs
There is presently no disaster plan in effect in Western Samoa The various agencies involved with emergency action are coordinated through the Police Commissioner New Zealand seismic zone B codes are applied to construction in Western Samoa Enforcement is handled by the Public Works Department Modest educational materials have been prepared by the Apia Observatory staff in English and Samoan for distribution through schools and public agencies
104
SOLOMON ISLANDS
Seismological Facilities
Seismological Observatories in the Solomon Islands are conducted bythe Ministry of Lands Energy and Natural Resources They have operated aWorldwide Standard Seismic Station in Honiara since 1962 operation of the station is supported by funds from the US Geological Survey The station was augmented by two short-period telemetered seismic stations in 1982 This three-station necwork was provided through the British GeologicalSurvey with the aim o identifying volcanic earthquakes associated with theactive volcano Savo located close to the capital
In awareness of the high volcanic risk to population centers in theSolomon Islands the Ministry has drawn up plans for two three-station telemetered arrays to be deployed around the active volcanoes on Simbo Island (New Georgia Group) and on Tinakula Island (Santa Cruz Group) Theyare presently seekirg foreign aid in the form of seismic instrumentation and technical asistance to establish the network
The Ministry also has responsibility for field surveys following majorearthquakes in the Solomon islands Studies of ground deformation and cultural effects of the large 1977 and 1984 earthquakes were made by seismology officers
Strong Motion Accelerographs
Two strong motion accelerogaphs were installed on Guadalcanal by theMinistry in late 1984 They will be responsible for maintaining the instruments but have requested Cornells assistance in analyzingaccelerograms obtained during their operation The high level of shallow activity near Guadalcanal suggests that a significant number of strong-motion records will be obtained during the lifetime of the instruments
Related Scientific Programs
The Ministry also carries out related research programs in regionalgeology minerals assessment groundwater studies and so on Extensive marine surveys have been caried out in the Solomon Islands by the USGeological Surveys Resource Assessment Program Local offshore surveyshave been carried out through CCOPSOPAC A tide gauge is maintained bythe Solomon Islands Hydrographic Unit Six proton-precession magnetometers are operated in the Solomon Islands by the Queensland University (Australia)
Critical Facilities
Over 90 of the Solomon Islands population remains in rural areas The major development is in Honiara the administrative and commercial center of the country Honiara (pop 15000) is the major shipping center of the country and now includes several multistory buildings
105
Earthquake Preparedness Programs
The Solomon Islands implemented a National Disaster Plan in 1980 subsequently revised in 1982 The Plan gives the Ministry for Home Affairs and National Development overall responsibility for coord~lation of efforts in earthquake volcanic and tsunami disasters Operational relief effort are carried out through the Disaster Operations Coordinator and the Provincial governments
The government has adopted the most stringent earthquake building code (Zone A) from New Zealand for multistory building construction in Honiara Implementation of these guidelines continues to be a problem One multistory building in Honiara (Australian High Commission Building) was severely damaged during the 1984 earthquake Some efforts have been made to develop small-scale earthquake-resistant building techniques appropriatefor rural areas The Pacific Islands Development Program organized a model house construction and workshop during early 1984 A modest outreach program has developed through the school system adult education programs and the government broadcasting company
PAPUA NEW GUINEA Seismological Facilities
The government of Papua New Guinea has made an extensive commitment to earthquake and volcanic hazard mitigation through construction of a national network of seismographs and accelerographs (Figure A3) A ten-station national network of seismographs is monitored by the Port Moresby Geophysical Observatory (Department of Minerals and Energy) Three of the remote stations are telemetered to Port Moresby via microwave links four stations operate as permanent field stations and two are operated at temporary sites on outlying islands Port Moresby is presently the site of a Worldwide Standard Seismic Station that has operated since 1958 The national network reports arrival times to the US Geological SurveysPreliminary Determination of Epicenters and the International Seismological Centre but does not routinely locate events independently
In addition to the national seismic network the Rabaul VolcanologicalObservatory operates seven seismic stations near active volcanoes around the country and a nine-station telemetry network around the Rabaul Caldera Bougainville Copper Limited opeates a 5-station network on Bougainville Island (North Solomons Province)
Strong Motion Accelerographs
The Port Moresby Geophysical Observatory maintains a national network of thirteen strong motion accelerographs distributed in the highly seismic areas of the country (Figure A3) This includes a closely spacedfour-station network around the Rabaul Caldera A single strong motion accelerograph is situated on Bougainville Island and is maintained byBougainville Copper Limited The network uses Kinemetrics SMA-I and New Zealand DSIR MO-2 instruments and has recorded tens of accelerograms since its establishment in 1967 The Observatory ispresently trying to to establish an engineering seismologist position to analyze the accumulating data and to further upgrade the accelerograph network
I I I I I I I I I I
Re--o -joso shy
Mooo u J4D (Ro-js
bull~~vASeA saxA+ Samp-cUong sloon
(twu lueoaott koRowq (KvG) jjj ccurodAj a~OlF
Accv~tj (8~Cli
Raboul (PART 2bLo(MOG) C GoTo and -4-A Duke of Tok
vie W~~IiTUI = a
Rogno SGA Kowumbukae0
lebub-gn ITPAc l-O MARCH agno BGAI
Tank ( F -goono PAAl
Coo Glooclslb Island I OSOGRAP SEISM A-D ACCELEOGR -
_____ L I IS IIsI I I
IPUGI
PAPUA NeW GUI NEeAr rp n w k
hTTWORKS MARCH 1384
IG -nol 1v
Figure A3 Papua New Guinea seismograph and accelerograph networks a
107-108
Related Scientific Activities
In addition to the Geophysical Observatory the Department of Mineralsand Energy includes the Geological Survey of Papua New Guinea The Surveyundertakes a wide range of geological investigations including regionalgeological mapping petroleum and mineral exploration engineering andenvironmental geology and energy resource development Offshore surveyshave been carried out through CCOPSOPAC as well as American and Austrrlianresearch vessels Continuous monitoring of the magnetic field is carriedout by the University of Queensland (Australia) Ten tiltmeters have beendeployed by the Volcanological Observatory to monitor ground deformation near Papua New Guineas active volcanoes Four of these instruments are deployed around Rabaul Caldera
Critical Facilities
Papua New Guinea is the most developed of the island countries of theSouthwest Pacific with a population of over 3000000 and extensive urbandevelopment The capital city of Port Moresby has a population of over 130000 with major multistory construction in the downtown area a majordeep water harbor and significant commercial and industrial activity in thePort Moresby area There is significant development as well in the smaller towns of Rabaul Lae Madang Wewak Goroka Mount Hagen Wau BuloloDaru and Kerema Major hydroelectric schemes have been established on theRamu and Rouna rivers with additional hydroelectric plans at various stages of evaluation and development Extensive mineral development hastaken place in the North Solomons Morobe and Western provinces of PapuaNew Guinea Extensive natural gas and limited oil deposits have beenlocated these may become commercially exploited in the near future
Earthquake Preparedness Programs
Papua New Guinea has a long history of earthquake and volcano-relateddisasters A national disaster program was established in 1981 and provides for a National Disaster Emergency Committee which formulates emergency government policy and a Disaster Civil Defence Committee which is responsible for implementation of short-term relief efforts Theprovincial governments are given major responsibility for initial coordination and assessment of disasters assistance is subsequentlyrequested from the federal government for major disasters Many of theprovincial governments have not revised preparedness plans since thecolonial period However particularly intense effort has been directed inEast New Britain province because of the imminence of a potentiallydestructive volcanic eruption in Rabaul Caldera
The town of Rabaul (pop 15000) is a major commercial center forPapua New Guinea and is situated directly within the caldera of an activevolcano A relatively small eruption took place at a secondary eruptivecenter near Rabaul in 1937 killing over five hundred nearby residents andforcing the evacuation of the town In order to avoid a repeat of such adisaster the government established the Volcanological Observatory withfour full-time volcanologists and real-time earthquake location andanalysis of tilt data A drastic increase in volcanic seismicity in mid-1983 led to a volcanic hazard alert and intensification ofseismological and ground deformation studies around Rabaul In addition
109
the alert allowed the provincial and national Disaster Emergency Committees to make extensive evacuation and relief plans for a possible eruption at Rabaul including preparation of a new airstrip improvement of roads and emergency water supplies communications systems detailed evacuation plans education programs and so on To date there has been remarkable cooperation of efforts by provincial national and overseas officials to mitigate the potentially devastating effects of a volcanic eruption at Rabaul
Papua New Guinea is the only country of the developing nations of the Southwest Pacific to have devised its own seismic zoning system (Figure A4)
The Nationwide Housing Code for Papua New Guinea sets up a four-level system of seismic loading oriented toward moderate-sized (to 8 stories)buildings Major buildings require independent dynamic analysis usuallycarried out by overseas engineering firms Seismic Zone 1 of the HousingCode is among the most stringent earthquake loading codes in the world and includes the town of Rabaul and much of the East New Britain and North Solomons provinces Seismic zone 2 includes the towns of Lae Wewak and Madang and is approximately equivalent to New Zealand Zone A or California loading designs The capital Port Moresby is in the lowest seismic zone (4) but buildings constructed there still require designsallowing for significant lateral loadings
Earthquake education is handled through the National Radio Government Printing Office the Civil Defence Department and the school system with information supplied by the Geophysical and Volcanological Observatories A particularly intense education effort has been mounted in Rabaul where educational materials have been produced and distributed in three languages and public involvement in preparedness plans has been emphasized
NEW ZEALAND
While New Zealand cannot be considered one of the developing countries of the Southwest Pacific its seismology programs have been responsible for much of the observational data available for the entire region Because of its importance to the other national seismology programs we briefly review here the New Zealands observational facilities Its extensive programs in engineering seismology its critical facilities and its earthquake preparedness programs will not be covered here
National Seismic Network
Seismological facilities in New Zealand are maintained by the Geophysics Division of the Department of Scientific and Industrial Research (DSIR) in Wellington The natioal standard seismograph network presentlyconsisting of thirty short-period stations is shown in Figure A5 The network routinely locates all earthquakes of ML gt 38 within New Zealandand earthquakes with Ms gt 50 for the region within 100 of New Zealand Arrival time data are routinely transmitted to the US Geological Surveyand the International Seismological Centre The events located by the network are reported in the annual New Zealand Seismological ReportSeveral hundred earthquakes are located by the DSIR national network each year
0 - - - --- - - - -
FIG 13
1SEISMIC ZONES FOR BUILDING CONSTRUCTION
- -- IN PAPUA NEW GUINEA
i 1d - - - - - _
(I -lt 53-0Fef cs r i eat a 1 982))j --_ _ -- r L - - --- a a V bull
N i - O(r-tIbd t
__ __ Po --shy
-- -- -
[i ~5- E I
Is-O I ___ oh - - --- - --shy-- shy
4 __J ft - - I- S 4 E jshy
_ _ _-i - _ j -z -
_____ _U 511
ZONE CLASSIFICATION OF CITIES I lZONE 30 1 I 3 1 153--ZONE3 4u shyW-t -~- 6--v 4- bull -
I == 1 --by- Ll _
Figure A4 Seismic zones for building construction in Papua New Guinea (jury et al 1982)
CAPE REINGA
ONERAHI
GREAT BARRIER AUCKLAND - C
5OCT 1914 WHITE ISLAND
KARAPIO EAST CAPE 0r WHAKATANE 15 WAIRKEIp I TUI 28 JUN 1921 t SEP19_-
CHATEAU TARADALE N U 2 FEB 19317 1897 1a Ju DEC 84
MANGAHAO 5 MAR 934 8 AUG 1904 - CASTLEPOINT ( A 1942
COs ELLINGTON IS5CT 18408 2C18BJN562 JAN 1855 23 MAY 1989
Figure A5 Seismograph stations of the national network (left) and the distribution of large shallow earthquakes (right) in New Zealand From Seismological Observatory Wellington (1980)
112
The network is augmented by long-period instruments operating atKaropiro Roxburgh and Wellington DSIR also operates a three-componentborehole seismometer in Wellington as part of the Seismic Research Obseervatory network supported by the US Geological Survey
Stations in Outlying Territories
New Zealand has also taken an important lead in operating seismographstations in outlying areas of the Southwest Pacific These stations havebeen extremely important in hypocentral control for the Tonga - Kermadec seismic zone and for nuclear event detection in the Pacific DSIR operates three 6 -component Worldwide Standard Seismograph stations at Afiamalu (Western Samoa) Raratonga (Cook Islands) and Scott Base (Antarctica) Short-period stations operate at Apia (Western Samoa)Campbell Island (New Zealand) Chatham Islands (New Zealand) Nadi (Fiji)Nime and Raoul Island (Kermadec Island New Zealand) Readings from these stations are routinely reported to PDE and ISC for global earthquake location
Wellington Network
A small-aperture high-gain seismic network is operated around Wellington an area of greatest seismic risk in New Zealand The stations are telemetered by radio or telephone link to the central recording site The network now consists of eleven stations Earthquakes are presentlydetected by a microprocessor-based Automatic Seismic Monitor and automated location processing is expected to follow The network routinely locates events with ML gt 15
Pukaki Network
A second microearthquake network has operated around Lake Pukaki ahydroelectric project in the South Island New Zealand The network wasestablished in 1975 to monitor reservoir-induced seismicity associated with impoundment of the reservoir The network consisted of nine stationsand was intended to operate on a temporary basis It has been closed since early 1984 with several of the stations continuing to support the national network and to monitor any future reservoir-related activity
Related Seismology Research
In addition to its regular observatory seismology the GeophysicsDivision has an active seismology research program Their studies have focussed on theoretical seismology earthquake prediction crustal structure of New Zealand historical earthquake studies nuclear eventdetection seismic risk in New Zealand strong motion studies and volcanic seismology The monitoring of active volcanoes is closely coordinated withcrustal deformation monitoring conducted by the Earth Deformation Section of the New Zealand Geological Survey
The New Zealand strong motion accelerograph network now consists of225 instruments operated by the Physics and Engineering Laboratory of DSIR Most of these instruments are of a New Zealand design (Mechanicaland Optical Accelerographs) and analog records are made on photographicfilm Three digitally recording accelexographs are now in operation in New
113
Zealand and the MO records are digitized for computational analysisAnalysis of this empirical data is being used for a revision of New Zealands building codes
114
REFERENCES
Berryman K 1979 Seismotectonic zoning study of the Fiji IslandsEarth Deformation Section Report 70 Wellington NZ Dept Sci and Indust Research 40 pp
Franco AB MP Hamnett and J Makasiale 1982 Disaster Preparednessand Disaster Experience in the South Pacific Pacific Islands Developshymental Program Honolulu 380 pp
Geological Survey of Papua New Guinea 1979 Information Booklet Port Moresby Dept Minerals and Energy 12 pp
Government of Western Samoa 1977 Apia Observatory 1902-1977 ApiaApia Observatory 8 pp
Jury RD JP Hollings and IAN Fraser 1982 The development ofseismic zones and the evaluation of lateral loadings for earthquakeresistant design of buildings in Papua New Guinea Bull NZ Nat Soc for Earthq Engr 5 123-140
Lowenstein PL 1982 Problems of volcanic hazards in Papua New GuineaGeol Surv Papua New Guinea Rept 827 Port Moresby Papua New Guinea 62 pp
McCue KF and ID Ripper 1980 The Papua New Guinea Strong MotionAccelerograph Network Geol Surv Papua New Guinea Rept 807 Port Moresby Papua New Guinea 13 pp
Mineral Resources Department Seismology Section 1983 National activityreport Fiji Submitted to Session IX Intl Coord Group for TsunamiWarning System in the Pacific Min Resources Dept Fiji Note 333Suva Fiji 4 pp
Parliament of Fiji 1984 Mineral Resources Department Annual Report forthe Year 1982 Parliam Paper No 13 Suva Fiji 90 pp
Power CA 1978 Earthquake risk in Fiji and the problems of earthquakeengineering Presented to the Fiji Society 17 pp
Prevot R and JL Chatelaiu 1983 Seismicity and Seismic Hazard in Vanuatu ORSTOM Rept 5-F3 Noumda 51 pp
Ripper ID 1982 Accelerogram library Geol Surv Papua New Guinea Rept 198211 Port Moresby Papua New Guinea 44 pp
Seismological Observatory Wellington 1980 The earthquake problem in NewZealand Alpha DSIR Extension Information Wellington NZ 4 pp
Smith WD 1979 Seismology and related research in New Zealand1975-1978 NZ DSIR Information Series No 140 30 pp
115
Smith WD 1983 Seismology and related research in New Zealand 1979-1982 Seismol Observatory Wellington Bull 276 32 pp
Solomon Islands Government 1982 National Disaster Plan 1982 Honiara Solomon Is 14 pp
116
A Rahimin A Simpson R Holmes P Rodda R Singh I Everingham K Draunidalo G Shorten M Mehrotra J Booth J Campbell
R Carter R Byrne G Gauss D Rubin
S Tongilava
D Tappin S Lemoto T Tukia
C Clarke
R Campillo R Foy T Lee J Rdcy J Chatelain R Prdvot
L ioane S losa A Titimaea
S Danitofea
D Tuni R Walshaw J Vunagi D Gwyun
INFORMATION CONTACTS
FIJI
Director Mineral Resources Dept Asst Director (MRD) Princ Geol OffshoreSeismol (MRD) Princ Geol Inform Services (MRD) Principle Geophysicist Senior Seismologist (MRD) Seismologist (MRD) Senior Engineering Geoogist (MRD) Struc Engr Suva City Council Civil Engineer Suva Engineering Geologist A Gibb amp Partners (Monasavu) Marine Geologist (CCOPSOPAC) Marine Geologist (CCOPSOPAC) Marine Geologist (CCOPSOPAC) Marine Geologist (CCOPSOPAC)
TONGA
Superintendent of Lands Surveys and Natural Resources Government Geologist (LSNR) Land Assessor (LSNR) Government Planner (LSNR)
VANUATU
Director Dept Mines Geology and Rural Water Supplies Director ORSTOM Mission Engineer ORSTOM Civil Engineer Public Works Dept Director ORSTOM Dept Geol and Geophys (Noumda) Seismologist ORSTOM (Nouma) Seismologist ORSTOM Nouma)
WESTERN SAMOA
Director Apia Observatory Senior Seismologist (AO) Geologist (AO)
SOLOMON ISLANDS
Chief Geologist Ministry of Lands Energy and Natural Resources
Senior Seismologist (MLENR) Senior Geologist (MLENR) Ministry of Home Affairs and National Development Civil Engineer Public Works Department
117
PAPUA NEW GUINEA
K Doble Chief Geologist Geological Survey I Ripper Chief Seismologist Geophysical Observatory G Seidel Information Officer Volcanological Observatory G Anderson Engineering Geologist Geological Survey J Wilkins Civil Engineer Dept of Works and Supply
NEW ZEALAND
W Smith Director Seismological Observatory Wellington
UNITED STATES
M Hamnett Pacific Islands Development Program G Burton Director Pacific Tsunami Warning Center R Sillcox Seismologist (PTWC) G Pararis-Corayannis Director International Tsunami Information Center
118
APPENDIX V TSUNAMI SAFETY RULES
1 All earthquakes do not cause tsunamis but many do When you hearthat an earthquake has occurred stand by for a tsunami emergency
2 An earthquake in your area is a natural tsunami warning Do not stayin low-lying coastal areas after a local earthquake
3 A tsunami is not a single wave but a series of waves Stay out ofdanger areas until an all-clear is issued by competent authority
4 Approaching tsunamis are sometimes heralded by a noticeable rise orfall of coastal water This is natures tsunami warning and should be heeded
5 A small tsunami at one beach can be a giant a few miles away Dontlet the modest size of one make you lose respect for all
6 The Tsunami Warning System does not issue false alarms When anocean-wide warning is issued a tsunami exists When a regionalwarning is issued a tsunami probably exists The tsunami of May 1960killed 61 people in Hilo Hawaii who thought it was just another false alarm
7 All tsunamis--like hurricanes--are potentially dangerous even thoughthey may not damage every coastline they strike
8 Never go down to the beach to watch for a tsunami When you can seethe wave you are too close to escape it
9 Sooner or later tsunamis visit every coastline in the PacificWarnings apply to you if you live in any Pacific coastal area
10 During a tsunami emergency your local Civil Defense police andother emergency organizations will try to save your life Give them your fullest cooperation
Unless otherwise determined by competent scientists potential danger areasare those less than 50 feet above sea level and within 1 mile of the coastfor tsunamis of distant origin or less than 100 feet above sea level andwithin 1 mile of the coast for tsunamis of local origin
6
AS
M E S
T H
0
E
S
N
P
0 S
H
P H
E R
R
E
ridge
trnsIr
trench
Noauii
-
bull
q
transom al
Figure2 (A) Sketch of the different types of plate tectonic boundariesand their relationships (Isacks et al 1968) (B) Diagrams of the threetypes of boundaries in three dimensional view (Calder 1972)
1600
SOLOMON IS
1650
-
1700 E 1750
PACIFIC OCEAN
1800
100 o
0
-~ ~
1jN~CH
~ A
Ko
$SATA CRUZ IS
-10- K~10
J-shy
ltK14
TitCASTECS
is
k)tANKS
S A ME O
L AMBRY MALEKULA V
FI JI PLATEAU
150
FIJI is
~o eANGO d
250 3 ATT E UNTE PJC
160c 1650 1700 E 1750 1800
Figure 3 Bathymetric map of the New Hebrides Island arc and thesurrounding region taken from Mammerickx et al 1971 The filledtriangles denote Quaternary volcanoes Contours are in fathoms
1600 E 170 1800 W 170 deg 8
CENTRAL PACIFIC BAIN
S040
NOTH2
0
AMOA 0
200
BASIN
bull
o 0
BASIN
FIJI
f d
S 0 BASIN a O
INDV USTIRAL
oamp PLATE
0 ASA
BASIN
r
0
NEW t~Z EALAND
CHAT 11A M
R S
150 160 E 170 180
-a A S
0
30 PACIFIC PL ATE
SOUTHWESiT
PACIFIC 0
BASIN 0
40shy
1700 W Figure 4 Regional setting of the Southwest Pacific Tectonic and morphoshylogic features of the PacificIndo-Australian plate boundary Open arrows indicate direction of relative plate convergence Contour line shows 2-km isobath Holocene volcanoes are indicated by open triangles Data on bathymetry seismicity volcanoes and plate motions are taken from the Circum-Pacific Council for Energy and Mineral Resources (1981) map
9
intra-oceanic arc is unusual in that the subducting slab dips toward the
Pacific Basin The Indo-Australian plate is being subducted at a rate of
approximately eleven centimeters per year (Dubois et al 1977 Pascal et
al 1978 Isacks et al 1981) in a direction perpendicular to the trench
(Isacks et al 1969 Johnson and Molnar 1972 Pascal et al 1978)
Relative to other convergent plate boundaries (eg Chile and Alaska) the
width of the zone of interaction between these two plates is limited to
approximately 50 km in extent because the subducting (Indo-Australian)
degplate is steeply downbent (70 ) at intermediate depths This geometry
produces a narrow ribbon of potentially damaging seismicity rather than a
large region of seismicity The northern and southern portions of the arc
are typical of arc-trench systems but the central portion exhibits several
unusual features (1) The bathymetric expression of the trench is obscured
between 13degS and 17degS where a submarine ridge known as the dEntrecasteaux
Fracture Zone intersects it at approximately 16degS (2) The upper plate
protrudes westward in this central portion of the arc such that the western
coast of Malekula Island is located where the inner slope of the trench is
normally positioned (Karig and Mammerickx 1972 Isacks et al 1981 see
Figure 3)
Shallow Vanuatu earthquakes (Figure 5) are located in the interplate
zone between the two plates They are associated with slippage of the
Indo-Australian Plate as it descends beneath the Pacific Plate Intraplate
earthquakes also occur within the descending and overlying plates in the
trench region and behind the island arc in what is known as the back-arc
region An actual and a schematic vertical cross section near Tanna
perpendicular to the trend of the arc is representative of the
10
1600 E 1700 180 W 1700
I 0 s ee 0 0o
2e 01
6 S
20
30S $
S4b
0
3040 30
4S
400
1 2 40
150 1600 E 1700 I80 170 W
Figure 5 Regional setting of the Southwest Pacific associated with the plate boundaries in this region
Shallow seismicity
relationship of the seismicity to the trench islands and back-arc region
(Figure 6) In Vanuatu earthquakes occur from near the surface to
approximately 300 km depth The earthquakes systematically deepen
eastward from the New Hebrides Trench forming a narrow dipping plane
under islands located in the central portion of the arc and intermediate
depth earthquakes occur-progressively farther eastward Large (Ms gt 7)
earthquakes but few great (Ms 7 34) earthquakes have occurred along
the island arc as a result of the subduction of the Indo-Australian plate
In spite of the anomalous protrusion of the upper plate in the central
part of the arc the Benioff zone and convergent plate boundary appear to
be relatively uniform in configuration and continuous along the entire
length of the arc (Pascal et al 1978 Isacks et al 1981) The linear
distribution of the islands of Vanuatu and their location so close to the
main interplate thrust zone of the convergent plate margin result in a
geometry that is uniquely suited for subduction zone studies in comparison
to most other subduction zones on earth This also results in a unique
earthquake hazard in central Vanuatu Behind and eastward of the New
Hebrides island arc lies the North Fiji Basin (Figure 4) where the presence
of shallow seismicity (Figure 5) fresh basalts little sedimentation
(Karig and Mammerickx 1972 Luyendyk et al 1974) and high values of
heat flow (Sclater End Menard 1967) indicate active tectonism The Vitiaz
Trench forms the northern boundary of the North Fiji Basin and represents
the site of an old subduction zone that existed before the modern New
Hebrides arc formed Subduction (of the Pacific Plate) ceased at the
Vitiaz Trench sometime in mid-Miocene (Falvey 1978) or earlier (Chase
12
NEW HEBRDES VOLCANIC TRENCH ARC CORIOLIS
SW 4 TROUGH NE 00Z_shy
- _shy 2
-vQ 100- DESCENDING
PLATE ~ ~SEISMICf
ZONE -Ishy
200shy
300 00 100 200
DISTANCE KM
Figure 6 A schematic cross secion showing the region where shallow and intermediate-depth earthquakes were recorded (inclined lines) and the inferred geometry of the descending plate beneath the southern New Hebrides arc The inferred geometry of the interplate thrust zone is partly based on the slip vectors (short solid lines) of the shallow thrust-type focal mechanisms The Moho discontinuity of the overriding plate estiated from refraction and gravity studies is also shown (Condert et a 1981)
13
1971 Mitchell and Warden 1971 Karig and Mammerickx 1972) and resumed at
the modern New Hebrides Trench with the opposite polarity (Indo-Australian
Plate underthrusting beneath the Pacific Plate) Deep earthquakes are
still recorded near Vanuatu that result from this episode of subduction
The New Hebrides arc has migrated away from the trend of the older Vitiaz
Trench to its present position (Hamburger 1986)
Geolc-ical Setting
The islands of Vanuatu are volcanic in origin with older islands
fringed or capped with reefal limestones In the central region of the
arc the single chain of islands gives way to a more complex structure
(Figure 7) (1) the eastern Miocene-Pliocene chain with tholeiitic and
calc-alkaline volcanoclastics includes the islands of Maewo Pentecost
Efate and parts of Epi (2) the slightly older western Oligocene-Miocene
chain includes the islands of Santo Malekula and the Torres and (3) the
central late Pliocene-Recent portion contains active aerial and subaerial
alkaline volcanics (Mitchell and Warden 1971) The volcanic rocks of the
western chain are similar to slightly more acidic composition than the
eastern chain Local outcrops of ultramafic rocks are found in several
places in the eastern chain
REGIONAL BACKGROUND INFORMATION
Historical Earthquakes in the Vanuatu Region
An accurate evaluation of the earthquake hazard for a particular
region includes a survey of historical seismicity in the region in
question Historical earthquakes are important because they help to better
determine the potential size frequency of occurrence and possible effects
of future earthquakes
14
170
Tinakula
xd
Torres Is e
Vat Gonoi
Vanua Lava
b Gauagp Merig
- --- -4
- --- Santo Moewo NOR TH
DENTRECASTEAUX FZ ===== Pentecost FIJI
-- tMae ku v Ambry m BASIN
-p -E
0 ioo 200 Km
o Erromang -A IWA
U) TANNA FUTUNA -A
~ANEITYUMOVOLCANIV ASSOCIATIONS 7 UPliacene- Recen- (Central Chain) UMiocene- L Pliocene
Effi (Eastern Belt) ~UOIlgocene - MMiocene
1plusmnZ (Western Belt) Di ofDip ofTune Matthow TECTONIC ELEMENTS selomic zoneHunter
1r~7Uplifted volcanic ridge
~B c- bsn Major fracture zone - -Bock -aorc basin NF -
Zone of flexuring Sedimentary basin and faulting
I I K KIRI
Figure 7 Geology of New Hebrides Arc (Carney and Macfarlane 1979)
15
The earliest reports of earthquakes in the Vanuatu region is a series
of earthquakes which began on 28 March 1875 and were felt on Anatom
(Mercalli intensity VIII-IX for the largest event) and Erromango and in the
Loyalty Islands of Lifou Mare and Ouvea (lida et al 1967) On 10
January 1878 a tsunamigenic earthquake associated with the eruption of
Yasowa Volcano Tanna was felt in Port Resolution Tanna Another strong
tsunamigenic earthquake occurred on 11 February 1878 associated with
another eruption of Yasowa Volcano
Since 1900 5 great earthquakes (Ms gt 7 34) and 52 major earthquakes
(7ltMs lt 7 34) have occurred along the arc (McCann 1980) However the
great earthquakes that occurred near the turn of the century are not
well-constrained in size or place and their magnitudes were probably overshy
estimated (due to the way in which the magnitudes were calculated)
Moderate-sized earthquakes are distributed throughout the arc (Figure 8C)
but the largest events are more clustered especially in the northern
portion of the arc (Figure 8B Marthelot 1983 and Figures 9A and 9B
McCann 1980) There is a distinct gap in the seismicity at the point
where the dEntrecasteau Ridge intersects the line of the trench
Because the occurrence of shallow earthquakes near population centers
are of greatest concern for earthquake hazard in this report we have
focussed on shallow earthquakes near the main islands of Santo Malekula
and Efate in the central portion of the arc Maps of shallow seismicity
(depth lt 70 km) of the region based on the US Geological Surveys
Preliminary Determination of Epicenters (PDE) catalog for the period
1961-1981 are shown in Figure 8B and 8C (from Marthelot 1983) This
with bewen70 and10 Kin sqars betee 10deth andK2N00Kin FriaguresMpete island)arceV00anuat (ail) hongnrhto the argha
std itriagebetween00 and 3e0vkn locte (1) the acnceaoneo largesxise of thereshlwents nthe trnhahrcal diappeanras i thetareshalwents nthe norheialof the arnhh ih thetarch thapconraspuato he acthe reanqig mapis ho the dstrutiorn oaf2thepuxaprton ofearcTive reanqiet regis inothe dsorutrnhaf2the
haviencanue largetthand5an3) earthquakeintermediate-depthofrnestshanppresencanue of intermediate-depth3 ctivitye
17
9 194 (74) s-AFTERSHOCK ZONE
ft 1 (827 _RECOMFUTED OR 2RECENT EVENT
1914 ) EPICENTER
1944(7) 0-FROM
GUTENBERG AND (73) RICHTER
1 7 bull__ EPICENTER FROM RICHTER
192 (7O)(21 ( i9 1945()2)
j50 21926 (71)150 01928(71)
1946(70) 1927 (71)
1903(75)
1944(73) 1925 (76) 2 18754
~ 1878
200 1920(80O 94943(72)
4875 1923(70) 1944(72)
70737 1z945 I941943(757372) shy
1904 (84)
1928(75) 1926(70)
1917 (71)
250 6 I 165 0E 1700 1750
Figure 9A Map showing locations of large (Ms gt 7) and great (Ms gt 7 34)historical earthquakes along the New Hebrides Trench for the time period1900 to 1950 (McCann 1980)
18
I I
Io 953 1963 (73 73)
1966(7473)
19617(70)
9195304) 20 I 1972 (71)
651965(70)197
7150 (7 7 2 1958 (72)
--- 1965 197(71)-
F7873s) od
19616 1 A
2 00 1950 (70727072)
ID
165degE deg170c 1750 Fig~ure 9B Map showing locations of large (Ms gt 7) and great (Ms gt 7 34)historical earthquakes along the New Hebrides Trench for the time period1950 to 1979 (McCann 1980)
19
figure illustrates the dense concentration of interplate events close to
and landward of the New Hebrides Trench
Very little information exits concerning the effects of strong
earthquakes prior to 1961 apart from a few sketchy damage reports The
location accuracy of earthquakes was improved in 1961 Before this time
locations were located to the nearest tenth of a degree and magnitudes were
considerably over-estimated The last major seismic episode of interplate
slippage in central Vanuatu occurred in a sequence of earthquakes in August
1965 (Figure 10) which accumulated a total seismic moment equivalent to a
single magnitude Ms - 77 event (Isacks et al 1981) The 1965 Santo
earthquakes caused significant damage to buildings wharves and bridges in
Luganville on Santo Island and major damage to buildings and water tanks in
Norsup and Sarmet on Malekula Island (Pr6vot and Chatelain 1983)
Coseismic tectonic uplifts on Malekula Island were also measured in
association with the 1965 earthquakes (Figure 10) Over 1 meter of uplift
was detected for the 1965 earthquake sequence (Taylor et al 1980)
Only one sequence of earthquakes has been relatively damaging since
the Cornell-ORSTOM network began operating in 1978 The Mere Lava
earthquake (Ms 61) occurred on 12 May 1980 at 14800S and 16782degE and a
depth of 23 km The worst damage from this event was caused by landslides
SUMMARY OF FACILITIES AND PROGRAMS
Critical Facilities
Port Vila with a population of 15088 in 1979 is the administrative
and commercial center of the country There are a number of multistory
buildings in the capital and most of Vanuatus tourist industry is located
2
1970
140- )O AN OCT
JAN 19731974 0 00-
MAY 0
0--- 1965
S 9000 97150K 15deg AU61973 NOVV
1974
600 x OCT
4 1971 AUG 01966
171965
160shydeg 1 - - 2000
Ms S73 -77
63 -67
0
0
58-62170 1- 1 -_0 1660 1670 E 1680
Figure10 August 1965 earthquake sequence (from Isacks et al 1981)
21
in and near Port Vila A large shipping wharf is located near the center
of the city on Vila Bay
Apart from Port Vila the only significant development in Vanuatu is
at Luganville on Santo Island (pop 5116 in 1979) It remains an
important economic center for the country with agricultural processing and
shipping facilities located there There are several three- and four-story
buildings in the center of Luganville
Earthquake Preparedness Programs
As of late 1983 the Government had requested the assistance of a
consultant from New Zealand to help provide uniform building codes for the
country The Public Works Department enforces New Zealand seismic zone B
codes to construction of public buildings Large buildings for the most
part are designed by overseas engineering firms and generally comply with
the earthquake design standards Smaller buildings are generally designed
close to the New Zealand loading specifications but there continues to be
great difficulty in supervising construction projects
There is no large-scale earthquake education program in Vanuatu
Materials have been prepared by ORSTOM seismologists for distribution to
teachers public officials and planners involved in earthquake hazards
(eg Prdvot and Chatelain 1983)
Seismological Facilities
Seismological observations are necessary to the accurate location
study and ultimate prediction of earthquakes Seismic stations were first
established in Vanuatu in the mid-1960s by the French Office de la
Recherche Scientifique et Technique Outre-Mer (ORSTOM) Staion PVC in
Port Vila has operated continuously from 1964 to the present while LUG in
22
1680 1700140 1660 1670 1690 deg 140
GAUAP FIJI
PLATEAU 0
deg ~ HOG MAEWO -15 150 AOBA
2000 SANTO AB
MAP PENTECOST
160 A MT AM8160A= A 13AMBRYM-16
DENTRECASTEAUX OJi= LMP EPIP1FRACTURE ZONE
170 EME 170 EMAINGOUNA
NGAoS L E_ EFATE
RTVDvpP 18o 0shy180 -
o -180 z 0
o ERROMANGO
190 - Rk90R-190
TAN AN~o 4 FUTUNA
AUSTRALIAN oshy0 0TANNA
200 PLATE ANATOM 0 200
0 0
1650 1660 1670 E 1680 1690 1700
Figure 11 Map showing the seismograph stations in Vanuatu Circles arestations telemetered to the base station PVC on Efate island andunderlined stations have two components--one horizontal and one vertical The triangles are older ORSTOM stations INH and LUG are no longeroperational Strong motion instruments are located at SWB and LMP onMalekula island DVP and PVC on Efate island and LUG on Santo island
Luganville Santo operated through 1980 A third station on Tanna Island
(INH) operated through 1978 Cornell University began cooperative field
programs with ORSTOM in 1975 with a microearthquake experiment on Santo
Island An ocean-bottom seismograph experiment was carried out in southern
Vanuatu in 1977 and in central Vanuatu in 1978 The Cornell-ORSTOM
telemetered seismic network was established in 1978 and has operated
continuously since that time The seismic network now includes 19
telemetered stations (Figure 11) to date over 20000 earthquakes have
been recorded by the network A permanent ORSTOM mission is now based in
Port Vila and takes primary responsibility for day-to-day maintenance of
the network The availability of continuous earthquake monitoring in
Vanuatu is an important component of any earthqi-ke or -arthquake hazard
study for the country Figure 12 shows the seismicity level (magnitudes gt
4) recorded by the Worldwide Seismograph Station Network (WWSSN) Compare
these results with the increased sensitivity (magnitude gt 25) and location
accuracy of the regional Cornell-ORSTOM network which is shown by better
definition of seismic zones in Figure 13 These network data clearly
define the heterogeneous distribution of seismic activity in the central
portion of the arc
These seismological facilities are complemented by studies of ground
deformation using seven bubble-level tiltmeters a two-component longshy
baseline water tube tiltmeters and two levelling arrays
Strong-Motion Accelerographs
As part of the present program of seismic hazard evaluation in
Vanuatu Cornell and ORSTOM have installed five strong-motion
accelerographs on the islands of Efate Malekula and Santo (Figure 11)
__
5 t~j24
0 - 70km
o0 a 0 70-150km 0 C J
5 S S - 0 0 shy
-150-300km
a 0 o 300-700km
0
15S 4 -
bull7 -06 ----
SS
bull bull S
bull iilIIle
Figure I9 1p 4D JE l o shybull =r-
5 NO a~ 40
20 1 a
~ ~- 20Smbull 5m
- S r S st
16 E5 170 E~
165EI bull =W
Figre 2 Epcenresde sesme lcasspa er ea onia de sttos-16-1) PDE ocaionsofvent (167-182) vtand 1983)-- ha-la
25
PROFONDEUR - DEPTH 0 - 70 Km
E
05 0
EE
03 4 3
0I
Figur 13Siete e ~se bulloai~pa le rieuOSO-ONEL(918)
00i
oA
Fi3r1N
a
0--
E iete e e Icls sp rl dspeuOR T M C R E L(9 8 1 8 )
26 These acce2erographs complement the other instruments being used to study the seismicity in the region The accelerographs record the ground accelerations at a particular site fiom an earthquake strong enough to trigger the instrument To date these instruments have already been triggered by five moderate-sized shallow events and will be used to provide a basis for prediction of local ground motion induced by large interplate earthquakes in Vanuatu The high level of seismicity along this plate boundary suggests that a valuable baseline of strong-motion data can be collected in a relatively short period of time
Related Research Programs
The seismology program is carried out in cooperation with the Vanuatu Department of Mines Geology and Rural Water Supplies They are responsible for regional geology studies resource assessment detailed mapping and hydrological activities In addition ORSTOMs geology and geophysics department based in New Caledonia carries out an extensive
program of investigations covering submarine morphology marine geology and geophysics island geology and crustal structure The US Geological Survey has undertaken a series of detailed marine studies in the central and northern portions of the island arc using the research vessel SP Lee (1982 and 19F4) A detailed hydrographic survey was carried out in coastal waters by Australian researchers A tide gauge is maintained by the ORSTOM
mission in Port Vila (Pr6vot and Chatelain 1983)
PREVIOUS STUDIES
Seismicity Studies Along the New Hebrides Arc
Seismicity studies of the New Hebrides Arc by Isacks et al (1981) found that major bathymetric and structural complexities divide the central
27 part of the arc into segments approximately 100 km long The segment near
Santo and northern Malekula islands ruptured during two complex sequences
of events occurring in August 1965 and in late December 1973 through early
January 1974 (Table 1) In contrast the segments near the southern part of Malekula and Efate islands may not have ruptured during the past 75
years Moreover between southern Malekula and Efate islands the
orientation of the horizontal compressive stress within the upper plate
changes from a direction perpendicular to the arc to a more complex and
variable pattern found in the southern portion of the arc
Since the Cornell-ORSTOM network was established in 1978 10 moderate
(58 lt Ms lt 7) earthquakes have occurred within the network (Table 2) A
description of the seismicity recorded by the network follows
(A) Fore- and Aftershock Sequences of the August 1979 and July 1981 Main
shocks
(1) 17 August 1979 Sequence Figures 14A and 14B show earthquakes in the foreshock sequence of the 17 August 1979 earthquake The spatial and
temporal development of this activity was described by Isacks et
al [1981] This section provides a more detailed analysis of a longer
period of time A small zone near the epicenter of the 17 August
earthquake was intermittently active during late June - early July 1979
(Figure 14A) The more immediate foreshock sequence (Figure 14B) started
eight days before the main shock and consisted of five groups of events
Each group of foreshocks began with an earthquake having a magnitude
between 42 and 49 and each was followed by a number of small
aftershocks The first foreshock cluster was located just landward of the
trench Each successive cluster migrated in time northeast toward the
Relocations with all available teleseismic and local data for 1978-1981events except 27 Jan 1979 [Bulletin of the International SeismologicalCentre (ISC) location] remaining locations based on local data only 2Ms surface-wave magnitude taken from Monthly Bulletins of the PreliminaryDetermination of Epicenters (PDE)3MO seismic moments reported by Chinn and Isacks [1982] or in Monthly
Bulletins of the PDE (1981-1985 events)
4Mw is calculated from M0 by Mw - (115) x (log(Mo)-161)
17
0 0 0
0CD 00 aVm01 83 0 0 0
00 0 00 3
0 00 0
000 0 0
167 E 168 0 E
169 167 E
168 0 0
169 167 E 0 1
168 169
Figure 14 (A) Early foreshocks of the 17 August 1979 main shock (shown as a filled square) that occurredat the end of June to the beginning of July 1979 Island contours and 6 km bathymetry are shown (B) Lateforeshock activity preceding the 17 August 1979 earthquake Foreshocks migrated from the trench toward thelocation of the main shock (C) Foreshocks preceding the 15 July 1981 earthquake 0o
31 epicenter of the main shock The foreshock sequence ended with a very
intense concentration of seismicity near the 17 August 1979 main shock
epicenter The final foreshock cluster began eight hours before the main
shock and continued until the region became seismically quiet three hours
before the main shock The main shock occurred at the northeastern end of
these clusters
The development of the aftershock activity in Figure 15 is shown for
two time intervals during the nine days following the main shock During
the first day the aftershocks were initially located close to the epicenter
of the mainshock and rapidly expanded towards the west At the end of this
day aftershocks occurred as far north as the site of the 26 August main
shock and as far south as about 181degS (Figure 15A) Most of the increase
in the aftershock area occurred during the first day as can be seen by
comparing Figures 15A and 15B To the north the expansion of the aftershy
shock zone stopped near the epicenter of the next main shock of the
sequence that occurred nine days later on 26 August In the south aftershy
shocks were located in the same zone defined by the early foreshocks (also
see Figures 18C and 18D)
(B) 26 August 1979 sequence The development of the 26 August
aftershock zone (Figure 16) shows very similar patterns to the development
of the 17 August aftershock zone The activity developed very rapidly
during the first two days following the main shock (26 -- 27 August)
Then as in the case of the 17 August aftershock sequence the cumulative
sequence occupied an area larger by a factor of 2 or 3 than the one
expected for an earthquake of such magnitude [Isacks et al 1981] The
main shock was located on the southern edge of the aftershock zone -- the
aftershock activity developed to the north east and west only while the
aftershock zone of the 17 August event was nearly inactive (Figures 16A
16B) By 27 August aftershocks were located as far north as the epicenter
of the future 15 July 1981 earthquake and as far west as the New Hebrides
32
17
oA B
00
00
18 - 0o - 0 0
0 0
00
167 E 168 169 167 E 168 169
Figure 15 Maps of epicenters showing the development of the 17 August1979 aftershock sequence Format as in Figure 14 (A) 12H59M 17 August1979 to 12H59M 18 August (B) 13HOOM 18 August to 11H46M 26 August(to just before the 26 August main shock)
17
180 0 ogI0
0 00 o0
CP 00 000
0
0 0 0 8V
0 00 0 0(0 0
0 0
C0 0
C 0
167 E 168 I0
159 167 E 168
0
169 167 E
e l 0
168
_o
169
Figure 16 Maps of epicenters showing the development of the 26 August 1979 aftershock sequence Formatas in Figure 14 (A) 11H47M 26 August 1979 to IIH47M 27 August (B) IIH48M 27 August to IIH47M4 September (C) 1lH47M 4 September to IIH47M 26 October 1979
34
trench The aftershock zone ends very abruptly to the north along a
sharply defined east - west trending line which passes close to the
epicenter of the 1 September 1978 earthquake (Figure 18A) After the first
two days the level of aftershock activity decreased rapidly During the
entire period from the main shock to 14 September the aftershock zone of
the 17 August earthquake remained relatively quiet (Figures 16A 16B)
From 15 September to about mid - October both the 17 August and the 26
August aftershock zones were reactivated (Figure 16C) although the level of
activity was much lower than that during the days immediately following
each of the main shocks During this later period some activity occurred
in the back-arc region Northeast of Efate Island a small intense cluster
occurred in 1979 followed by shallow events spread around Efate Island
(Figure 16C) The level of activity then decreased and by the end of
October was back to a more normal background level of seismicity in the
entire region
The two aftershock zones of the 17 and 26 August 1979 earthquakes are
contiguous with some overlap in the area between the two epicenters (Isacks
et al 1981 Chatelain et al 1986) Chatelain et al (1986) show tiat
this area plays a key role in the development of the seismicity in ne
Efate region
(3) The 15 July 1981 earthquake In contrast to the 17 August 1979
earthquake no outstanding foreshock activity occurred prior to the 15 July
event Small clusters occurred on 5-6 and 12 July (see Figure 14C) Both
clusters included few events although each started with a magnitude (mb)
50 earthquake The larger of the two occurred on 12 July near the pending
main shock epicenter In contrast to the 17 August 1979 case no unusual
35
concentration of activity was noticed in the epicentral region during the
months immediately preceding the main shock Possible long-term precursory
activity may be the clusters observed in March and June 1980 and are
discussed in the next section
Figure 17 illustrates several outstanding features of the aftershock
sequence of the 15 July earthquake First an intense zone of activity
develops during the first day and continues throughout the sequence (Figure
17A) This zone is coincident with the aftershock zone of the preceding 26
August 1979 event (compare Figures 17A and 16) The southern boundary of
this activity is quite sharp and coincides with the region between the two
August 1979 epicenters this again emphasizes the importance of the area of
the two 1979 epicenters The epicenter of the main shock is located on the
northern boundary of the region of intense activity
Second the aftershock activity expands in size during the succeeding
nine days primarily northwards [see also Chatelain et al 1983] To the
northwest significant activity develops within the oceanic plate beneath
the trench axis (Figure 17B) This activity is concentrated beneath the
ORSTOM seamount [see USGS map by Chase et al 1983] near 173degS and
1672degE During the second through the ninth days activity continues to
develop in the area west of Epi Island and south of Malekula Island (Figure
17B) while in the succeeding 50 days the area of southern Malekula is
activated with a remarkable cluster occurring beneath the southern coast
(Figure 17C) The region of southern Malekula and Epi has been notably
quiet for much of the period prior to the July 1981 earthquake Back-arc
activity is also notable with a cluster occurring on 29 July east of
16 06 A B deg
0
O0
0 0
0~
o
000
0 0
0
00
0o~$
S 0 08 S
16E0
167 E
1 - C
0 0
168
0
16
0--
0
169 16
t
E
4P0
16
168
_ _ _ _ _ _ _ _
167
16 1o6
0
E 0
o S 0O
0 0
66
o5
0 6
0 24 Ju
q-o
0
6
1G 8HOM(C) 240 in~~ ~~
08OM24 JulJul toto 075M Figur 14
M Setme 1981 ()0H5M1Juy11to0H5M16Jl()0HO16uyto 1515 Setmbr191
I shy37
9Mo 4 o
uy
ON
37
Efate and increased activity in the region of Ambrym and Epi islands
(Figure 17C)
The aftershocks of the 15 July 1981 event thus affected four distinct
regions (1) the former 26 August 1979 aftershock zone presumably on the
interplate boundary (2) a region of the suboceanic plate near the ORSTOM
seamount (3) the region between South Malekula and 172degS presumably also
part of the interplate boundary and (4) upper plate crust cast of Efate
Island The total area affected by this earthquake was about 10 times
larger than the area expected for the rupture zone of an earthquake with
magnitude of the July 1981 event [Chatelain et al 1983]
(B) Prominent Clusters
Aside from aftershocks of the August 1979 and July 1981 events the
Efate -Malekula region also experienced several remarkable earthquake
clusters Some of these have the characteristics of an aftershock
sequence with the initiating event having the largest magnitude (and
sometimes preceded by a few foreshocks) Others have characteristics
intermediate between an aftershock sequence and a swarm [Mogi 1963] where
there may be several dominant shocks within the sequence and a more
symmetric shape to temporal variation of the number of events per unit
time The clusters are shown together with the larger aftershock sequences
in the summary of seismicity presented in Figure 18 For clarity the
aftershocks of the August 1979 and July 1981 events are represented by the
first nine days of activity
(A) Clusters in the forearc region The first cluster recorded by the
local network occurred in late September and early October 1978 near the 1
38
September mainshock (Figure 18A) and can be considered as a late part of
the aftershock sequence of the 1 September event The location of this
cluster however is activated again in later clusters (December 1979
August 1983 and April 1984) Figure 18A shows the next significant
activity in the region a cluster of earthquakes in December 1978 located
west of the August 1979 aftershock zone beneath the New Hebrides trench
The region was then fairly quiet until March 1979 when an intense cluster
of earthquakes occurred over a period of five days (Figure 18B) Activity
in the same area resumed again in April 1979 for a period of two days The
most active parts of both clusters are located at the same place which
defines an east - west trending zone located near the epicenter of the 26
August 1979 event and at the junction of the 17 August and 26 August
aftershock zones
After the August 1979 shocks three clusters occurred in December
1979 March 1980 and June 1980 (Figure 18G and 18H) near the epicenter of
the 1 September 1978 main shock (and also near the mid September 1978
cluster noted above) This location is on the eastern edge of the future
1981 aftershock zone The three clusters also tended to migrate toward the
July 1981 main shock epicenter (Figure 18G) A smaller cluster occurred in
August 1980 beneath Malekula Island (not shown on Figures) Actually the
entire region was rather quiet during 1980 The three 1980 clusters were
relatively small
In February 1981 a cluster of earthqukes occurred just west of the
location of the March -April 1979 clusters between those clusters and the
location of the December 1979 cluster (Figure 18H and 181) This location
39
Figure 18 Maps of epicenters in aftershock zones and clusters located bythe Cornell-ORSTOM network shown sequentially in time Epicenters of main shocks are shown by filled squares In each successive frame the next cluster overlays the preceding one for comparison Only successive clusters are shown in each frame All the activity recorded for the periods chosen is plotted Ten days of aftershock activity are shown for the August 1979 and July 1981 earthquakes
(A) 1 September 1978 main shock with September-October 1978 cluster (open circles) and December 1978 cluster (open squares)
(B) 27 January 1979 mainshock (no aftershock activity) with clusters of March-April 1979 (filled circles)
(C) Foreshock sequence for 17 August 1979 (open circles) (D) 17 August 1979 mainshock and aftershok sequence (filled circles)(E) 26 August 1979 mainshock and afters]ock sequence (open circles)
back-arc activity in September 1979 (crosses) (F) Cluster in December 1979 (filled circles) (G) Clusters in March 1980 (open circles) June 1980 (open squares) and
February 1980 on Efate island (plus signs) (H) Cluster in February 1981 (filled circles) (I) 15 July 1981 foreshocks (open circles) and June 1981 back-arc cluster
(plus signs) (J) 15 July 1981 aftershock sequence (filled circles) and back-arc activity
during July 1981 (plus signs) (K) Clusters in September-October 1981 (open circles) and activity on Efate
island in December 1981 (plus signs) (L) 12 March 1983 earthquake and aftershock sequence (filled circles) (M) Cluster in June 1983 (open circles) (N) 3 August and 5 August 1983 events and aftershock sequence (filled
circles) (0) Clusters in April 1984 (open circles) and in the back-arc near Epi
Island in March 1984 (plus signL) (P) Cluster in October 1984 (filled circles) (Q) Clusters in February 1984 (open circles) and April 1984 (open squares) (R) 3 July 1985 aftershock sequence (filled circles)
17
deg A B c
o 0W
0
03
0
00
(0C
0
00
00
0cn9
0
13g
0
o
000
o
0 000
0 0
0
0o 0
0 o 0S
(So
0
0
17
17 sclo
deg D c
p 0 0-
F
O 0 0 1800
O00 0
000
0 0 00 0
0 +
167 E 168 1690 167 E0 0
168 169 167 E 00
168 169
0 0
17
S
18
a I
0deg0Ck G
06+04
13 degp
~ - Ho
-to+00 0 o0o0o
0+1
I
0 0 +
18-
0
0O
A- V
J
+
- 00 B +o
K0 00 o0
L 0
0
0~
+
17 0
0
0j AbullB
0
0 0 0
0
0e
0 06
0 000
0
g oo
000
0+ 0olo
9
00
f 000
00 eFo 0 Q000
01
0 0
0 o00 1 0
o 0
1 7 E1 8116767E 168 169 167 E 168 169
I-0
16
7
0 o k3 ~
00
00
0 0
o 00
_o-I -
00 0 0
0 00
0
00
17s IP
0
00 00
13
01
0
0
00
000 0shy18
1868
CP 0 0t
00
169 167o
8
0
00
00
3
17E168 169 167 E 168 0 0 169 167 E 168 169
43
is part of the overlapping aftershock zones of the August 1979 events and
is also at the southern limit of the 15 July 1981 aftershock zone
The clusters thus have a very close spatial relationship to the
aftershock zones of the main shocks They occurred near the boundaries of
the aftershock zones and appear to be related to features delimiting or
defining the spatial development of the aftershock zones (see also
Chatelain et al 1986)
From February 1981 until August 1982 except for the aftershock
sequence of the July 1981 earthquake not a single fore arc cluster was
detected in the Efate Malekula region- Starting in September 1982
clusters began to occur around the former July 1981 immediate aftershock
zone In September and October 1982 four clusters occurred south of and
beneath Malekula Island (Figure 18K) Besides the aftershocks of the 15
July 1981 earthquake the September - October 1982 clusters were the most
prominent activity in the Malekula region during the entire 1978-1984
period These clusters did not occur at random places The first one was
located beneath Malekula Island at the site of the previous cluster in
1980 The second cluster is lcated southwest of Epi Island in an area
which experienced significanc activity during the aftershock sequence of
the 15 July 1981 earthquake (compare Figure 17C and 18L) The third
cluster shows a very linear pattern trending southwest - northeast right
along the extension of the northern edge of the 15 July aftershock zone
The fourth cluster then occurred beneath southern Malekula Island
In March and June 1983 two clusters occurred in the southern part of
the Efate zone The March 1983 cluster (Figure 18L and 18M) occurred near
the January 1979 epicenter and comprised a relatively small aftershock
44
sequence of a magnitude (Ms) 58 earthquake The June 1983 cluster
occurred just south of the July 1981 aftershock zone (Figure 18M and 18N)
This cluster affected the same zone which had already been affected by both
foreshocks and aftershocks of the 17 August 1979 mainshock Most of the
cluster occurred after a magnitude (mb) 54 shock which was the largest
event in the cluster The cluster thus has the charactistics of an
aftershock sequence but one with an abnormally large area for the main
shock magnitude The main shock was also preceded by a small foreshock
sequence that started a day before and stopped six hours before the main
shock
In August 1983 a dense cluster following a Ms - 56 and a Ms - 57
event occurred northwest of Efate Island (Figure 18N and 180) The latest
cluster recorded in the region occurred in April 1984 again activating the
same zone (Figure 180)
(2) Clusters in the back-arc region Although the back-arc region is
usually relatively aseismic there were clusters of earthquakes located
east of Efate Island and beneath Efate Island itself The clusters were
shallow and located in the island arc crust The areas affected were much
smaller than those in the forearc clusters Three of the clusters occurred
just before or after the August 1979 and July 1981 main shocks (Figures
18E 18F 181 and 18J) The August 1979 event was followed in September
1979 by a cluster east of Efate and in February 1980 beneath Efate The
July 1981 main shock was preceded in June - July 1981 by a swarm occurring
just south of the cluster following the August 1979 events Another
cluster occurred shortly after the July 1981 event at the same place The
July 1981 main shock was also followed by a swarm on Efate Island at about
45
the same place as the one following the August 1979 earthquakes No
clusters have been located in the Efate back-arc region from December 1981
when the last swarm occurred on Efate Island up to the most recent data
available October 1984 thus giving support to the close temporal
relationship between these clusters and the 1978 - 1983 sequence (see also
Chatelain et al 1986) In December 1980 a larger cluster occurred
farther east near the Coriolis trough (not shown on figures) The only
other back-arc activity occurred in March 1984 farther north just south of
Epi Island (Figure 180)
(3) Summary of Results from the Cornell-ORSTOM Network Investigation
of the patterns of seismicity associated with the earthquakes which have
occurred within the Cornell-ORSTOM network has shown that (1) not all
medium to large size events are associated with foreshock activity (2)
long term precursory activity sometimes occurs but not with enough
consistency to use in forecasting an impending event and (3) some zones
are activated before and after the main shocks without defining any clear
cycle (Chatelain et al in press) These earthquakes and their associated
seismicity suggest that specific features along the interplate zone
produced by the interaction of structures in the overriding and subducted
plates appear to control the seismicity in the Efate region (Chatelain et
al in press Isacks et al 1981)
Seismic Potential Studies Along the New Hebrides Arc
The earthquake hazard from the interplate zone is generally high
because of the rate of relative motion of the two plates (approximately 11
cmyr) and the stick-slip nature of the boundary However in addition to
large to great earthquakes along the plate interface moderate to large
46
magnitude events can occur within either plate and cause considerable
damage locally
One approach to determining the seismic potential of a region is to
identify a seismic gap or portion of an arc that has not produced a large
earthquake for some period of time The identification of a seismic gap
does not mean that a large earthquake will necessarily occur in a given
region because not all gaps will produce large earthquakes The gap may
indicate that (1) the section of the plate boundary is locked stress is
accumulating along the interface and will be the site of a future
earthquake or (2) the relative plate motion is being accommodated by
continuous slippage (aseismic creep andor by slip during small and
moderate events) such that sufficient stress to generate large earthquakes
along that section of the plate boundary does not accummulate Historical
information regarding the occurrence of earthquakes in a particular region
and regional tectonic constraints are necessary to clarify which of these
two possibilities is valid for the region in question In many cases
however the historical record may be incomplete or too short to accurately
determine which option is correct
Evaluation of the recurrence history of a particular region can be
investigated using (1) Teleseismically recorded earthquakes (2)
recurrence relations of smaller earthquakes recorded by seismograph
networks (3) pre-instrumental historical records of large earthquakes and
(4) evidence of prehistoric and historic large earthquakes observable in
the geological record Recurrence relations may help determine return
periods for certain sizes of earthquakes Recurrence intervals are
dependent upon the observations of seismograph networks and-are incomplete
47
since the period of record keeping is short compared to the time necessary
to develop these relationships Indirect evidence of large earthquakes can
sometimes be found in the geologic record in the form of uplift rates and
used to address the problem of recurrence intervals However information
obtained from the geologic record is necessarily limited in accurracy
McCann (1980) has divided the New Hebrides arc into different zones
and assigned values of seismic potential to these zones (Figure 19) based
on his study of historical and instrumental seismicity He has assigned 6
different divisions based on his study of the historical record (1) site
of a great (Ms 7 34) earthquake more than 100 years ago (2) site of a
great earthquake within the past 100 years but more than 30 years (before
1978) (3) incomplete historical record but indication that the region may
have the potential for a large earthquake (4) plate motion is subparallel
to the arc (5) no historical record of a great earthquake and the region
may not have the potential for one and (6) site of a large earthquake
within the past 30 years and presumably the lowest seismic potential
Marthelot (1983) used PDE data to determine some general segmentations
in the seismicity of the New Hebrides arc and the patterns of seismic
activity that characterize these segments (Figure 20) Marthelot (1983)
found that coupled interplate large (Ms lt 79) thrust earthquakes which
are preceded by intense activity dominate the northern end of the New
Hebrides arc near the Santa Cruz islands (between IIdegS and 13degS) Moderate
(Ms lt 72) thrust events concentrate between 13degS and 14degS Coupled
moderate (Ms lt 75) interplate thrust earthquakes occur near Santo and
northern Malekula islands (14degS to 165degS) The southern end of Malekula
and slightly south (165 0S to 1750S) exhibit coupled interplate thrust
48
14 S
2
19
24 I 165 E 170
Figure 19 McCanns seismic potential for New Hebrides island arc (McCann1980 See text for discussion of numbers
____
49
1650 1650 2 6 63 - 41 100
0 COUPLED INTER-INTRAPLATE THRUST
7467 e34 34
w
= EVENTS PRECEDED
BY INTENSE 24
AACTIVITY U I 44 CONCENTRATION
OF THRUST EVENTS
64-72 21O210
3
COUPLED 2061 73 0 _00
s INTERPLATE - 0 0C w THRUST EVENTS 78
PRECEDED BY 45t58C-150
DONUT PATTERNS 16 46 I S
81 03Q STEADY HIGH RATE L2 062 501 4 4
02ONLY ONE THRUST EVENT 61 025 INTRAPLATE200 ACTIVITY A 43
81 _0 2 O V CLUSTERS OF 72 73
RECURRING 76 150Q20 THRUST EVENTS 200
SLOW EXPANSION 4 OI01
OF ACTIVITY 8I 80 26 43 IN 198081- 13Do NO PRECURSORY
PATTERN 0 66 26
170 0 E 1720 170 0E 1720
Figure 20 Summary of the characteristics of the distribution of shallow earthquakes along the New Hebrides island arc The dashed line representsthe axis of the trench The trench disappears in the central part of the arc Horizontal lin separate regions characterized by distinct seismicity patterns Middle figure shows years of occurrence of large(Ms gt 70) and moderate-sized events (ms gt 60) 1961-1981 Right figureshows the large earthquakes that occurred from 1900 through 1960 (Marthelot and Isacks 1984)
50 earthquakes that are not quite as large (Ms lt 72) The zone west of Efate
(175degS to 18degS) exhibits a steady high rate of seismicity with magnitudes
(Ms ) less than or equal to 72 Between 18degS and 20degS intraplate activity
(Ms lt 72) dominates South of Anatom (eg south of 20degS) the seismicity
is characterized by clusters of recurring thrust events that do not exhibit
any precursory activity
In another study utilizing the PDE data set Wyss et al (1983) and
Habermann (1984) have used the shallow New Hebrides seismicity in order to
(1) identify areas of higher and lower strength within the plate interface
which might control the rupture length of future earthquakes and (2) test
for changes in the rate of seismicity prior to large earthquakes using a
statistical procedure The trend toward low stress drops in the central
portion of the arc near the intersection of the dEntrecasteaux Fracture
Zone with the New Hebride Trench is consistent with other studies which
indicate that this region is anomalous However a region of high or low
strength does not indicate anything about the nature of the region and
these regions do not help pinpoint when a large destructive earthquake
will occur within or near them
ASSESSMENT OF EARTHQUAKE HAZARD
Seismotectonic Provinces
We propose the following seismotectonic provinces and the maximum
probable (but not absolute) sizes of earthquakes be considered for the
subregions within Vanuatu when considering a design earthquake for these
regions (Figure 21) These provinces are based on the instrumental history
of earthquakes near Vanuatu The northern end of the New Hebrides Trench
is a complex zone of deformation where the interplate motion is changing
51
M612
13
S 0 0
18
231 165 E 170
Figure21 Earthquake potential for Vanuatu
--
--
52 from thrusting in the southern portion to mostly strike-slip motion in the
northern portion and has the potential for great (Ms 8) earthquakes The
central portion of the New Hebrides Trench here called the Santo
Malekula segment exhibits characteristics different from the rest of the
arc as the result of the dEntrecasteaux ridge interaction and has the
potential for Ms 7 34 earthquakes The southern end of the New Hebrides
Trench here called the Efate Tanna segment may have the potential for
Ms 8 earthquakes The extreme southern end of the New Hebrides Trench is
another complex zone where the interplate motion is changing from thrusting
in the north to strike-slip motion in the south and may be limited to
infrequent moderate (M 7 12) earthquakes Other sources of seismicity
include back-arc spreading east of the New Hebrides Trench (Ms 7 12) and
diffuse shallow activity along the Hazel-Holme Ridge (Ms 7) in the North
Fiji Basin (Ms 6 12)
One method for estimating the maximum possible magnitude earthquake in
a region is to look at the amount of deformation that has accumulated from
past earthquakes The deformation is assumed to be proportional to the
square root of the energy released by a powerful earthquake The energy
(E in joules) of each earthquake can be calculated from its magnitude (Ms)
using a formula developed for the region Pr~vot and Chatelain (1983) have
used the formula
Log E - 48 + (15 x Ms)
to calculate the amount of energy which has been released since 1965 in the
central portion of the arc (Figure 22) The calculated values tend to fall
within a range of values which can be bounded by two parallel lines since
deformation occurs more or less uniformly in time The maximum possible
E1 2 106 600 (joules )
500
400
300
200
136 shy
100
65 70 75 80 82 ANNEES - YEARS
Figure 22 Seismic energy release along the New Hebrides Arc since 1965 (Chatelain and Pr~vot 1983)
54
magnitude earthquake calculated by this method is Ms - 76 Prdvot and
Chatelain (1984) computed a similar result using all of the earthquakes
which have occurred since 1900
Ground Motion
Once the location and magnitude of potential earthquakes have been
determined for a region the next step is to determine the characteristics
of the ground shaking at a particular site This accomplished by the
condsideration of such quantities as earthquake source mechanism
epicentral distance and geometry and physical properties of the geologic
structures located between the source and the site
Strong-motion records provide one measure of site response To date
a relatively large number of strong-motion records have been generated in
the far-field of large earthquakes especially in California and Japan In
contrast relatively few near-field records of moderate and large shocks
have been recorded in island arcs These few have shown large scatter with
unpredictable results The 3 March 1985 Chilean and 19 September 1985
Mexican earthquakes constitute the most important exceptions and are
invaluable additions to the library of strong motion data for subduction
zones Nor-theless these two events do not constitute a databank of
information especially for intraoceanic tectonic settings such as Vanuatu
A major difficulty arises in trying to translate past earthquake size
(intensity values) which are based on cultural effects or magnitudes
derived from widely varying instrumental parameters into values of ground
motion The development of earthquake resistant design is usually based on
intensity of ground motion at a particular site The most widely applied
standard of comparison for strong motion data is the peak ground
55
accelereation (PGA) Figure 23 shows a general relationship between peak
acceleration and distance from hypocenter which has been derived from
worldwide earthquake data Some earthquakes generate relatively high
single peaks of ground accleration which represent little ground energy
Therefore on an absolute basis the use of PGA can be misleading for
smaller events
Peak ground accelerations are easily obtained from accelerogram
records however most historical information consists of earthquake
intensities Numerous relationships between ground acceleration and
Modified Mercalli intensities have been developed (Table 3) Two of these
proposed relationships are shown in Figure 24 For worldwide data Murphy
and OBrien (1977) have computed statistical correlations between Modified
Mercalli intensity values and ground accelerations (horizontal and
vertical) Theresultant relationships and the geometrical standard
deviation (s) are
log Av - 028 Imm - 040 s - 253
log Ah - 024 Imm- 026 s - 219
where -Av peak vertical ground acceleration
Ah - peak horizontal ground acceleration
Imm - Modified Mercalli intensity
Using the relationship of earthquake intensity to distance and size of
Fiji earthquakes Everingham (1984) has produced a plot for the Fiji region
(Figure 25) Although these results are for a nearby region they give a
general indication of what might be expected for Vanuatu Figure 26
(Prdvot and Chatelain 1983) shows the recurrence of Modified Mercalli
intensities per number of earthquakes
56
1000 1 I l I I eO58 M(R 5 -X A= 1320 e R+25)152
5
MEAN + a =2N01 - STANDARD 2-
oe DEVIATIONbullbull- ~0 MEAN + 2
tbull 0o - STANDARD - oo o DEVIATIONS Jf E N o 0
LU0
U 01 0_ o o 0-oo n 00 bull
L) em a00
- MEAN - shy - 4ra 00 L 0 W STANDARD 0-~DEVIATIONWL 000 to
0 ME N -2 1 STANDARDUx 0
DEVIATIONS
101- 10 - 000
D N O oENTE K - 1 so-
10 100 1000
DISTANCE FFROM HYPOCENTEFR IN KILOMETEFRS
Figure 23 Acceleration-attenuation relations derived from worldwide earthquakes (Hays 1980)
57
Table 3 Characteristics of the data samples used in selected studies of the correlation of ModifiedMercalli intensity and peak ground acceleration (modified fom OBrien et al 1977)
Number and Range of location Number Modified Mercalli Distance Acceleration
Study of earthquakes of recordings intensity
Gutenberg and 61 Western 167 n-VIII Richter 1942 United States 1956
Neumann 1954 10 do
Hershberger 1956 60 do Coulter Waldron dodo
and Devine (Not based 1973 entirely on
observed data)
Trifunac and 57 do Brady 1975c
10 V-VIII
108 J-Vil IV-X
187 IV-X
range (kin) range (cms2)
3-450 1-300
Averages of 40-300 25 and 160 (distance dependent) - 1-300 Short distance 6-3000
(Dependent on site geology and local amplification)
Figure 24 Proposed relationships between earth quake intensities and peack accelerations
59
DEPTH 20KM
7shy
6- 6 0
075 502
61 h0
DISTANCE KM
Figure 25 Modified Mercalli earthquake intensities observed in Fiji as a function of magnitude and epicentral distance (Everingham 1984)
60
10
0
5CI I-C)
0i
0
o
01 a)o
PORTVILA = SANTO
00
E
0212
000
E
z
Degres Mercali _ Mercalli degrees
Fiue-2 Frequency of Modified Mercalli earthquake intensities felt in Port Vila and Santo (Chatelain and Prfivot 1983)
61
Tectonic Uplift
Studies of longer term island uplift on Santo and Malekula as
evidenced by the uplift of coral reefs have related segmentation of these
islands to features of the subducting topography of the dEntrecasteaux
fracture zone (Taylor et al 1980) The proximity of these two islands to
the main interplate thrust zone and the growth of the coral reef terraces
around the islands has resulted in preservation of long-term deformation
Taylor et al (1980) have studied late Quaternary coral reefs that have
been uplifted on Santo and Malekula islands They identified four main
blocks based on long-term tilt differences (Figure 27) The rupture zones
of the 1965 and 1973-1974 earthquake sequences correlate to the tectonic
discontinuities in the Santo -- Malekula region Taylor et al (1980)
studied the uplift of coral terraces on Malekula over a period of three
years (976 1177 and 779) and found that just over 1 meter of uplift
had occurred in the northern part of the island as a resalt of the 1965
earthquake (Figure 28 Table 4)
Tsunamis in Vanuatu
Tsunamis (seismic sea waves) are caused by displacements in submarine
topography that are induced by earthquakes andor volcanic activity
occurring below or near the floor of the ocean Low-lying areas near the
shore are particularly vulnerable to damage by these waves The shallow
seismic zones of the Southwest Pacific have a history of earthquakeshy
generated tsunamis (Figure 29) A few tsunamis have originated in the
Vanuatu region A tsunami was produced by the first earthquake of the
March 1875 sequence (Iida et al 1967) The earliest known significant
one was the 10 January 1878 earthquake which produced a large tsunami
62
1167030E
AK-A 150 30 S
Tasmaloum Arkialo
NORTH MALEKULA
X Direction of tilt inferred from reef terraces 16000S
Tilt discontinuity
Pliocene and Quaternary shy sedimentary rocks mostly
coral limestone
r Pre-Pliocene sedimentaryand igneous rocks SOUTH
MALEKULA
160305
Figure 27 Tectonic uplift associated with the 1965 Santo earthquakes (Taylor et al 1980)
63
Contour Interval =02 m 02--- 04 - hp
0-6- shy08 xx16 000Sshy
08 9
06
02 i
00
160 30S a
167 0 00E 167 030E
Figure 28 Measurements (meters) of 1965 uplift made in September 1976November 1977 and July 1979 The letters on the figure represent the places and amounts of uplift given in Table 2 The contours of uplift(contour interval - 02 ) represent one of the simplest interpretations of the uplift pattern consistent with the measurements (Taylor et al 1980)
64
TABLE 4 Uplift Measured Along the Coast of Northern Malekula
Year Number ofStation Place Name Measured Measurements a Southwest Bay 1977 observationb Bamboo Bay 1977 observation c Dixon Reef 1977 Id Lambubu Bay 1976 15 e West Bay 1976 5f Horrok 1976 Ig Brenwe 1976 4h Liwout Point 1976 1979 50i East Leviamp 1976 4j West Leviamp 1976 6k Elephant Point 1976 17I Win 1979 24 m Wihet Bay 1979 23 n Rambak 1979 30 o Npennanavet 1976 10P Matanvat 1976 4 q Potovrou 1977 1 r Atchin Island 1977 observations Wala Island 1977 observation t Norsup 1977 I u Lamp 1977 observation
Insufficient measurements for a standard deviation to be useful
Figure 29 Tsunami history of the Southwest Pacific Filled circles indicate locations of tsunaznigenic events dashed circles indicate inferred locations of tsunamigenic events
66
(12-17 m lida et al 1967) and 6 meters of uplift of the harbor at Port
Resolution (Warden and Mitchell 1974) Other earthquake generated
tsunamis have occurred in 1961 1965 and 2 in 1967 (lida et al 1967)
While major Pacific-wide tsunamis such as those generated along the South
American or Alaskan plate margins apparently do not affect Vanuatu
significant local tsunamis may be generated by large shallow earthquakes
occurring within the region
Volcanic Eruptions in Vanuatu
Volcanic activity is concentrated in the central belt of the Vanuatu
island arc Much of the present activity is confined to solfataric
eruptions however explosive eruptions are known (eg the 1878 Yasowa
eruptions)
In general the potential effects of a volcanic eruption on the
inhabitants of the islands of Vanuatu are small except for those people
who are living in the immediate vicinity of an active volcano However
evacuation of inhabited volcanic islands may be necessary in larger
eruptions Even distant volcanic eruptions such as those at Home Reef in
the Kingdom of Tonga during March 1984 produced large quantities of pumice
some of which rafted across large portions of the Southwest Pacific The
floating pumice interfered with shipping throughout the Southwest Pacific
region (SEAN Bull 1984)
IMPLICATIONS FOR MITIGATION OF EARTHQUAKE RISK
Several significant steps may be taken that will significantly
mitigate the loss of life and property from future earthquakes in Vanuatu
The following five steps provide suggestions for mitigation of the
earthquake risk
67
Earthquake Education
First an earthquake education program such as that adopted in Fiji
or Papua New Guinea is strongly recommended At minimal cost to the
Government such a program may be mounted through the schools Red Cross
programs and through the news media In other countries earthquake
education programs have taught simple methods of strengthening house
construction and minimizing hazardous conditions within the home they
have warned of tsunami hazards to coastal dwellers they have instructed on
proper behavior during an earthquake they have helped to encourage storage
of emergency food water and equipment in many households and
importantly they have helped avoid panic during an earthquake and
stimulated cooperation with government officials following such a disaster
Earthquake education programs are effectively combined with other disaster
preparedness programs (eg cyclones floods and so on) An example of
educational materials prepared by the Fiji Mineral Resou-ces Department is
included in Appendix IV
A few simple measures can be taken to reduce the likelihood of damage
to personal property A system of baffles in water reservoirs can reduce
the chances of seiches being set up in the tanks and the ultimate collapse
of the towex if the motion is large enough Large heavy objects should
not be put in high places where they can be easily dislodged unless they
are anchored in place This would apply to things like stereo speakers and
other objects that might be on shelves Products on shelves in stores and
books in offices can be restrained with wire retainers along fronts of
shelves Heavy objects that could tip over (such as hot water heaters and
gas tanks) can be fastened with anchoring bands This is especially a
68
concern with gas tanks which could fall over rupture lines and result in
fire
Building Codes
Second adoption of building codes for Vanuatu is imperative There
is a real danger of a large earthquake occurring very close to Port Vila or
Luganville In general the adequacy of construction is a major factor
controlling the damage and loss of life brought on by such an earthquake
Building codes designed for areas of similar earthquake hazard such as New
Zealand Code A California Building Codes or Papua New Guinea Codes 1 or
2 would be appropriate for Vanuatu Observation of such codes is most
crucial for public multistory buildings in the major towns of Port Vila
Efate and Luganville Santo As important as the design of such buildings
are the construction methods and guality of construction material used to
implement building design Careful monitoring of construction by competent
engineers is important for critical facilities The traditional houses
have kept down past losses of life and property but increasing population
and rapid urbanization can result in higher potential damage if
earthquake-resistant designs are not implemented One of the primary
reasons for property damage resulting from the Mere Lava earthquakes was
related to the siting of newer homes Houses located on steep slopes
suffered damage when they were not situated on competent substrate (Figure
30) The shaking of the fill and loose soils by the earthquakes caused
unconsolidated materials to shift under the foundations
Emergency Civil Defense Procedures
Third development of specific Civil Defense plans for emergency
procedures following an earthquake or tsunami should be initiated Of
69 a ) Poorly - situated house
and terrace e
house built too far over slope Rear
0 R
near cutting vertical and too backwall of house
bull e
b ) Earthquake- induced slope movements
-7 Rear cutting collapses pushingForward terrace edge - house orward
subsidesunder mining huefrad house foundation shy
Landslippage here
c) Well- situated house and terrace Good distancebetween house and
Good between
distance house
cutting
ond sopr I Rear cutting slope back and planted with natural vegetation
Figure 30 Sche7atic representation of causes of damage to poorly sited houses and suggestions for future house contruction in areas of loosely consolidated soil
70 course earthquake preparedness plans have much in common with hurricane or
other natural disaster planning but specific effects of earthquake
occurrence must be considered structural damage to multistory buildings
interruption of water supply disruption of electrical and gas lines
secondary geological effects such as ground liquefaction or landslides in
the near-source region complicating effects of aftershocks in the days and
weeks following a major earthquake The primary structure for such civil
defence plans already is in place in Tonga Programs specific to the
earthquake hazard may be added following similar programs in Fiji Papua
New Guinea and New Zealand
Long-term Seismicity Observations
Fourth long-term seismicity and strong motion observations should be
continued In the long-term such information will help to refine
estimates of seismic potential along the New Hebrides plate boundary they
will help to more directly and accurately assess the ground motion
parameters of direct concern to engineers for building design in
Vanuatu--ground acceleration frequency spectra horizontal and vertical
components of ground motion local amplification effects and so on
Furthermore seismicity patterns may provide a key to long-term forecasting
and short-term prediction of the location and size of future earthquakes
that may affect Vanuatus population
Internationa Cooperation
Fifth international cooperation among the island countries of the
Southwest Pacific and foreign agencies (eg US Geological Survey
ORSTOM etc) may significantly help in Vanuatus earthquake preparedness
program All of the countries affected by earthquakes (Vanuatu Western
71
Samoa Fiji Tonga Solomon Islands Papua New Guinea and New Zealand)
have to varying degrees developed earthquake preparedness programs
Vanuatu may take advantage of the previous current and any future efforts
of the other countries in the region
72-76
References
Atkin R J (1968) On volcanoes in the New Hebrides and Banks Islands Quarterly J of the Geologvical Society of London 24 305-307
Calder N 1972 The Rescless Earth A Report on the New Geology The Viking Press New York N Y
Carney J N and A Macfarlane (1979) Geology of Tanna AneityumFutuna and Aniwa New Hebrides Geological Survey Regional Report 71 pp Carney J N and R Campillo (1980) An investigation into damage causedby seismic activity on Mere Lava during May 1980 Geological Survey DeptOf Vanuatu Report
Chase C G (1971) Tectonic history of the Fiji Plateau Geol Doc Amer Bull 82 3087-3110
Chase T E B A Seekins J Daniel and J Y Collot (1983)Topography of the Vanuatu region map US Geological Survey Alexandria VA
Chatelain J L R K Cardwell and B L Isacks (1983) Expansion ofthe aftershock zone following the Vanuatu (New Hebrides) earthquake on 15July 1981 Geophys Res Lett 10 385-388
Chatelain J L B L Isacks R K Cardwell R Pr6vot and M Bevis (inpress) Patterns of seismicity associated with asperities in the centralNew Hebrides Island Arc J Geophys ResChinn D S (1982) Accurate source deths and focal mechanisms ofshallow earthquakes in western South America and in the New Hebrides island arc PhD Thesis Cornell University Ithaca NY
Chinn D S and B L Isacks (1983) Accurate source depths and focalmechanisms of shallow earthquakes in western South America and in the NewHebrides island arc Tectonics 2 529-563
Chiu J-M (1982) Structural features of subduction zone determined bydetailed analysis of short period seismic waves from earthquakes recordedin the New Hebrides island arc PhD Thesis Cornell University
Collot J Y J Daniel and R V Burne (1985) Recent tectonicsassociated with the subductioncollisioi of the DEntrecasteaux zone in thecentral New Hebrides Tectonophys 112 325-356
Coudert E B L Isacks M Barazangi R Louat R Cardwell A Chen JDubois G Latham and B Pontoise (1981) Spatial distribution andmechanisms of earthquakes in the southern New Hebrides arc from atemporary land and ocean bottom seismic network and from worldwide observations J Geophys Res 86 5905-5925
77
Dubois J J Lauray J Recy and J Marshall (1977) New Hebrides trench Subduction rate from associated lithospheric bulge Canadian J Earth Sci 14 250-255
Ebel J E (1980) Source processes of the 1965 New Hebrides Islands earthquakes inferred from teleseismic waveforms Geophys J Royal Astron Soc 63 381-403
Everingham I B (1984) Provisional list of felt earthquakes reports in Fiji 1941-1981 Min Resources Dept Fiji Note BP 338 17 pp
Falvey D A (1978) Analysis of paleomagnetic data from New Hebrides Bull Austr Explor Geophys 9 117-123
Geological Map of the New Hebrides Condominium scale 11000000 (1975)Ministry of Overseas Development (Directorate of Overseas Surveys) DOS 1196 British Residency Port Vila New Hebrides
Gilpin L M A L Bloom B L Isacks and M Bevis F W Taylor and C Jouannic (1982) Late Pleistocene coral reef terraces as tiltmeters on Santo Island Vanuatu (New Hebrides) EOS Trans Amer Geophys Union 63 430
Gutenberg B and C F Richter (1954) Seismicity of the Earth 2nd ed Princeton NJ Princeton University Press
Habermann R E (1984) Spatial seismicity variations and asperities in the New Hebrides seismic zone J Geophys Res 89 5891-590
Hamburger M W (1986) Seismicity of the Fiji Islands and Tectonics of the Southwest Pacific PhD thesis 312 pp Cornell University Ithaca NY
Hays W W (1980) Procedures for estimating earthquake ground motions U S Geological Surv Prof Paper 1114 77 pp
Ibrahim A K B Pontoise G Latham M Larue T Chen B Isacks J Recy and R Louat (1980) Structure of the New Hebrides arc-trench system J Geophys Res 85 253-266
lida K D Cox and G Pararas-Carayannis (1967) Preliminary Catalog of Tsunamis Occurring in the Pacific Ocean HIG University of Hawaii
International Seismological Centre (ISC) 1978-1979 Bulletin of the International Seismological Centre Newberry Berkshire United Kingdom
International Seismolog4 cal Centre (ISS) 1918-1963 International Seismoshylogical Summary Newbury Berkshire UK
78
Isacks B L and M Barazangi (1977) Geometry of Benioff zones Lateralsegmentation and downwards bending of the subducted lithosphere in IslandArcs Deep Sea Trenches and Back-Arc Basins Talwani M and W C Pitmaned Maurice Ewing Series 1 Amer Geophys Union Washington D C 99shy114
Isacks B L G Hade R Campillo M Bevis D Chinn J Dubois JRecy and J L Saos (1978) Measurements of tilt in the New Hebrides island arc in Proceedings of Conference VII Stress and StrainMeasurements Related to -Prthquake Prediction US Geological SurveyOpen-rile Report 79-370 176-221
Isacks B L R Cardwell J-L Chatelain M Barazangi J-M MarthelotD Chinn and R Louat (1981) Seismicity and tectonics of the central NewHebrides Island Arc in Earthquake Prediction An International ReviewMaurice Ewing Ser 4 edited by D W Simpson and P G Richards AGUWashington DC 93-116
Johnson T and P Molnar (1972) Focal mechanisms and plate tectonics ofthe southwest Pacific J Geophys Res 77 5000-5032
Karig D E (1971) Origin and development of marginal basins in the western Pacific J Geophys Res 76 2542-2561
Karig D E and J Mammerickx (1972) Tectonic framework of the New Hebrides island arc Marine Geology 12 187-205
Kelleher J J Savino H Rowlett and W McCann (1974) Why and where great thrust earthquakes occur along island arc J Geophys Res 794889-4898
Kroenke L (1984) Cenozoic Tectonic Development of the SouthwestPacific United Nations Econ and Social Commission for Asia and the Pacific Technical Bull 6
Lay T and H Kanamori (1981) An asperity model of large earthquakesequences in Earthquake Prediction An International Review Maurice EwingSer 4 edited by D W Simpson and P G Richards AGU Washington DC 579-592
Luyendyk B P W B Bryan and P A Jezek (1974) Shallow structure ofthe New Hebrides Island Arc Geol Soc Amer 85 1287-1300
Louat R J Daniel and B Isacks (1982) Seismicitd de larc desNouvelles Hebrides in Equipe de GOologie-GOophysique du Centre ORSTOM deNoumda Contribution Aletude godvnamique du Sud-Ouest Pacifique Travau et Documents de lORSTOM 1147 179-186
Mammerickx J T E Chase S M Smith and I L Taylor (1971)Bathymetry of the South Pacific map Scripps Inst of Oceanogr La Jolla Calif
79 Marthelot J-M (1983) Patterns of seismicity in the Vanuatu (NewHebrides) arc Regional variations and systematic evolution PhD Thesis Cornell University
Marthelot J-M J-L Chatelain B L Isacks R K Cardwell and ECoudert (1985) Seismicity and attenuation in the central Vanuatu (NewHebrides) islands A new interpretation of the effect of subduction of theDEntrecasteaux Fracture Zone J Geophys Res 90
McCann W R (1980) Large and moderate size earthquakes Theirrelationship to the tectonics of subduction Ph D thesis Lamont-DohertyGeol Observ of Columbia Univ Palisades NY
McCann W R S P Nishenko L R Sykes and J Krause (1979) Seismicgaps and plate tectonics Seismic potential for major boundaries Pure Appl Geonhys II_7 1082-1147
McGuire R K (1977) Effects of uncertainty in seismicity on estimateof seismic hazard for the East Coast of the United States Bull Seis Soc Amer 67 827-848
Mitchell A H G and A J Warden (1971) Geological evolution of the NewHebrides island arc J Geol Soc London 127 501-529
Mogi K (1963) Some discussions on aftershocks foreshocks andearthquake swarms--The fracture of a semi-infinite body caused by an innerstress origin and its relation to the earthquake phenomena (third paper)Bull Eartho Res Tnst Tokyo Univ 41 615-658
Monzier M J Y Collot and J Daniel (1984) Carte bathymetrique desparties centrale et meridionale de larc insulaire des Nouvelles-Hebridesmap Office de la Recherche Scientifique et Technique Outre-Mer (ORSTOM) Paris
Murphy J R and L J OBrien (1977) Analysis of a worldwide strongmotion data sample to develop an improved correlation between peakacceleration seismic intensity and other physical parameters ComputerSciences Corporation Rept NUREG-0402 to US Nuclear RegulatoryCommission 68 pp
Pascal G B L Isacks M Barazangi and J Dubois (1978) Preciserelocations of earthquakes and seismotectonics of the New Hebrides island arc JGeophys Res 83 4957-4973
Preliminary Determination of Epicenters (PDE) 1961-1981 MonthlyBulletin National Earthquake Information Service US Geological SurveyAlexandria Va
Pr~vot R and J L Chatelain (1982) Seismicity and seismic risk inVanuatu Report No 5-83 Centre ORSTOM Nouma New Caledonia
Richter C F (1958) Elementary Seismology W H Freeman and CompanyInc San Francisco
80
Rothe J (1965) The Seismicity of the Earth 1953-1965 Paris UNESCO 336 ppSanto T (1970) Regional study of the characteristic seismicity of theworld Part III New Hebrides island region Bull Earthquake Res Inst Tokyo Univ 48 1-18
SEAN (Scientific Event Alert Network) Bulletin 9
Taylor F W B L Isacks C Jouannic A L Bloom and J Dubois(1980) Coseismic and Quaternary vertical tectonic movements Santo andMalekula islands New Hebrides-island arc J Geophys Res 85 5367-5381
Taylor F W C Jouannic and A L Bloom (1985) Quaternary uplift ofthe Torres Islands northern New Hebrides frontal arc Comparison withSanto and Malakula Islands central New Hebrides frontal arc J of Geol 93 419-438
Trifunac M D (1976) Preliminary analysis of the peaks of strongearthquake ground motion--dependence of peaks on earthquake magnitudeepicentral distance and recording site condition Bull Seism Soc Amer 66 189-220
Trifunac M D and A G Brady (1975a) Correlations of peakacceleration velocity and displacement with earthquake magnitude andsite condition Intl J Earthquake Engr Struc Dynamics 4 455-471
Trifunac M D and A G Brady (1975b) On the correlation of seismicintensity scales with the peaks of recorded ground motion Bull Seism Soc Amer 65 139-162
Turcotte D L and G Schubert (1982) Geodynamics John Wiley amp Sons New York
US Geological Survey 1961-1985 Preliminiry Determination of Epicenters Denver Colo
Vidale J and H Kanamori (1983) The October 1980 earthquake sequencenear New Hebrides Geophys Res Lett 10 1137-1140
Wellington Seismological Observatory Geophysics Division 1953-1960 NZDept Scientific and Industrial Research Catalog of Earthuakes 1953-1960
Wray S T R K Cardwell B L Isacks E Cudert and J-L Chatelain(1983) Detailed seismicity observations in the forearc region of aconvergent plate boundary Malekula Island Vanuatu (abstract) EOS Trans Am Geophys Union 62 945
Wyss M R E Habermann and C Heiniger (1983) Seismic quiescencestress drops and asperities in the New Hebrides arc Bull Seismol Soc Am 23 219-236
81
APPENDIX I DEFINITIONS
Two measures of the size of an earthquake are magnitude and intensity
Magnitude is a measure of the energy from an earthquake source to indicate the
strength of an earthquake In comparison intensity is a measure of the amount
of ground shaking caused by the earthquake at a particular site Thus an
earthquake of a given magnitude will produce a wide range of intensities
depending largely on distance from the source
In general a small earthquake with a magnitude less than 5 may be felt
only in the area near the source and a moderate earthquake with a magnitude
between 5 and 7 will be felt over a wider area and may produce significant
damage in the area very close to the source A large earthquake refers to an
earthquake with a magnitude greater than 7 Such events are often very desshy
tructive if they are located near population centers A major earthquake
refers to magnitudes between 7 and 7 34 and a great earthquake refers to
magnitudes greater than 7 34 These great earthquakes cause widespread desshy
truction and possible regional tsunamis Generally the potential damage from
earthquakes is multiplied by the secondary effects of earthquake occurrence
such as ground faulting generation of tsunamis landslides slumping or
liquifaction
The depth of earthquakes range from the surface to approximately 700 km
depth Shallow earthquakes refer to those with depths between the surface and
70 km Intermediate earthquakes refer to those with depths between 70 km and
250 km depth Deep earthquakes refer to those with depths greater than 250 km
(but less than 700 km) Intermediate depth earthquakes occasionally produce
damage at the earths surface only if the earthquake is very large Deep
events are generally not felt
82
The seismic (earthquake) potential of a particular region is defined as
the likelihood of that region to experience a (destructive) earthquake within
particular magnitude range within a particular time period The seismic
(earthquake) hazard of a particular location refers to the amount of ground
motion that might be expected from an earthquake within or near that region
Adequate data on seismotectonic features instrumental (strong-motion) and
macroseismic (intensity) records of near-field effects of large earthquakes
source parameters of large earthquakes earthquake spectra and ground attenuashy
tion or amplification are necessary in order to reasonably evaluate earthquake
hazard for any region The seismic potential is the integration of all of
these bits of information The average length of time between earthquakes of a
particular size (recurrence interval) and the amount of time elapsed since the
last earthquake of that size help to define the probability of future earthshy
quake occurrence along a particular seismogenic zone hence the seismic
potential of that zone
Seismic risk of a particular region refers to the expected degree of
losses of people and their property which result from the seismic hazard and
the vulnerability in the region One method that has been widely used for this
risk determination (and is used here) involves the determination of a maximum
probable earthquake (design earthuake) that is likely to occur in the imshy
mediate region Calculations of seismic hazard which are based on design
earthquakes generally yield conservative estimates of risk
The most important conclusion of historical studies of seismicity is to
define the seismogenic zones of a region and extrapolate what the future earthshy
quake potential is for those zones Seismically quiescent regions refer to
regions with a lower level of seismic activity which are surrounded by more
83
active regions Portions of major plate boundaries that have not experienced a
major or great earthquake during a particular time interval are seismic Raps
This time interval is taken to be a significant portion of the earthquake
recurrence interval for a large earthquake An estimate to within several
decades of the location and size (magnitude) of a large earthquake constitutes
a forecast If a precise calculation of the time and probability of occurrence
can be added to the location and size information then the estimation is a
prediction
84
APPENDIX II MODIFIED MERCALLI INTENSITY SCALE (1956 VERSION)
Masonry A B C D To avoid ambiguity of language the quality of masonry brick or otherwise is specified by the following lettering whichhas no connection with the conventional Class A B C construction)
Masonry A Good workmanship mortar and design reinforced especiallylaterally and bound together by using steel concrete etc designed to resist lateral forces
Masonry B Good workmanship and mortar reinforced but not designed in detail to resist lateral forces
Masonry C Ordinary workmanship and mortar no extreme weaknessez likefailing to tie in at corners but neither reinforced nor designed againsthorizontal forces
Masonry D Weak materials such as adobe poor mortar low standards ofworkmanship weak horizontally
DESCRIPTION (INTENSITY VALUES RANGE FROM I TO XII)
I Not felt Marginal and long-period effects of large earthquakes
II Felt by persons at rest on upper floors or favorably placed
III atlt indoors Hanging objects swing Vibration like passing oflight trucks Duration estimated May not be recognized as an earthquake
IV Hanging objects swing Vibration like passing of heavy trucks orsensation of a jolt like a heavy ball striking the wallsStanding motor cars rock Windows dishes doors rattle Glassesclink Crockery clashes In the upper range of IV wooden walls and frames creak
V Felt outdoors direction estimated Sleepers wakened Liquidsdisturbed some spilled Small unstable objects displaced or upset Doors swing close open Shutters pictures move Pendulum clocks stop start change rate
iOriginal 1931 version in Wood H 0 and F Newmann 1931 Modified
Mercalli Intensity Scale of 1931 Bull Seis Soc Amer 53 979-9871956 version prepared by Charles F Richter in Elementary Seismology(1958) 137-138 W H Freeman and Company
VI Felt by all Many frightened and run outdoors Persons walk unsteadily Windows dishes glassware broken Knickknacks booksetc off shelves Pictures off walls Furniture moved or overshyturned Weak plaster and masonry D cracked Small bells ring(church school) Trees bushes shaken (visibly or heard to rustle--CFR)
VII Difficult to stand Noticed by drivers of motor cars Hangingobjects quiver Furniture broken Damage to masonry D includingcracks Weak chimneys broken at roof line Fall of plasterloose bricks stones tiles cornices (also unbraced parapets andarchitectural ornaments--CFR) Some cracks in masonry C Waves on ponds water turbid with mud Small slides and caving in alongsand or gravel banks Large bells ring Concrete irrigationditches damaged
VIII Steering of motor cars affected Damage to masonry C partialcollapse Some damage to masonry B none to A Fall of stucco and some masonry walls Twisting fall of chimneys factory stacks monuments towers elevated tanks Frame houses moved onfoundations if not bolted down loose panel walls thrown outDecayed piling broken off Branches broken from trees Changes inflow or temperature of springs and wells Cracks in wet ground and steep slopes
IX General panic Masonry D destroyed masonry C heavily damagedsome times with complete collapse masonry B seriously damaged(General damage to foundaticns--CFR) Frame structures if notbolted shifted off foundations Framed cracked Serious damageto reservoirs Underground pipes broken Conspicuous cracks inground In alluviated areas sand and mud ejected earthquakefountains sand craters
X Most masonry and frame structures and bridges destroyed Seriousdamage to dams dikes embankments Large landslides Water thrown on banks of canals rivers lakes etc Sand and mudshifted horizontally on beaches and flat land Rails bent slightly
XI Damage nearly total Large rock masses displaced Lines of sightand level distorted Objects thrown into the air
86 APPENDIX III EARTHQUAKE EDUCATION PAMPHLET PUBLISHED IN FIJI
EARTHQUAKE What to do how to help
-
bull - -C II
deg
Damage at Suva wharf caused by the 1953 -earthquakelw hich was followed by a tidal wave within 30 seconds
1 411_0- shy
87 from theA message Minister for Lands
Recent earthquakes in Waya tsunamis might be the most Island and the even more recent one effective means of mitigating which rocked the city of Suva short- the worst effects of a sudden ly after 9am on Decanber 171975 calamity in these two potentshyand the ensuing panic reaction of ially dangerous forms is to the people are sharp reminders to us know more about them that although Fiji is situated in an
Indeed the suddennessearthquake zone there is little in-the severity of a wideshyformation available to the public on and
spread disaster could disruptearthquakes and tsunamis (tidal which are often associated all communications and paralysewaves)
with the type of earthquakes we have even the most efficient and experienced in Fiji well-drilled emergency organishy
sation it is hopeZ that the infor-
Survival in those cirshymation pamphlet prepared by myministry on earthqkes and tsunamis Ceatnces would depend on
will allay some of the natural alarm each individuals own knowshy
which people exp -ence during even
the minor tremor- Because we are in an
It has been brought to my earthquake belt it would be
notice that at least one expert has prudent for people living in Fiji to make themselvespredicted the chance of a serious
earthquake in Fiji as 140 years thoroughly familiar with the
one earthquake every 40 years information contained in this pamphlet
However with the exception of the earthquake and tidal waves in I wish to take This 1953 we are fortunate not to have opportunity to appeal for your suffered a more serious earthquake full co-operation in answeringthe questionnaire on earth-
They are probably the most quakes and tsunamis which terrifying and devastating phenomena appears on page nine of known to man this pamphlet as accurately
Unlike other natural disas- as possible
ters such as hurricanes and flood- The aim of the ing the tragedy of earthquakes is questionnaire is to locate that there is no forewarning of their and map the fault-line zones coming from which it is suspected
The very recent earthquake that most of our earthquakes in Hawaii is an obvious in- originatedisaster
dicator that the science of predicting The success and the earthquakes is still in the early efficiency of any kind of stages of development emergency relief system may
Although the recent occurrence depend on your co-operation in Hawaii might not rank among the in providing the informationworlds most serious earthquakes we sought- SNWqanivavalagi
orldssrios msteathqakes weMinister for Lands and Mineralknow from the experiences of other Resources countries that earthquakes can be totally devastating
However remote the possibishyity of a serious earthquake and
2
88
7 -
Part of the damage to the Suva Harbour reef caused by the 1953 earthquake
70 per cent from FIJI area About 70 per cent of the masonry landslides or drowning
worlds deep earthquakes are recorded in the tsunami from the Fiji area Most of them are Another earthquake with not felt because they occur at great an intensity of four to five was depths of about 400 to 600 kilometres ecperienced in Suva in 1961but (24845 to 37267 miles) beneath thecasdolmirdmget
surfac of te ebuildings
These types of earthquakes are not dangerous or damaging because of the depths at which they occur ButOtra they ore scientifically interesting
because they help geologists to deduce
the structure of the crust
The types of earthquakes which can be very damaging are those of large magnitude which occur in thebecase tey Todedueelp eolgist top 50 kilemetres (3106 miles) of the earths crust
The 1953 earthquake which hcd on epicentre (origin) 15 miles west of Suva was of this type That earth-quake had an intensity of seven out of a Mercalli scale of 12 and result-ed in a tsunami (tidal wave) which occurred 30 seconds after the quake and affectedoiSuva and davu About seven people were killed by falling
Several smaller shocks have been reported since then
w here re oftenearthquake fe arrtua aaso avun
fhlare laldes odrwi savu Taveuni and recentlythe WayA - Nadi - Lautoka area
Reports received after the 1953 earthquakes also show f l itle dmage incstes t that several very strong earthshyquakes have been felt in the
Fiji area since the early 1800s A o the
caused lthu d thse in tha the increasing density of popushyltion and buildings would make the area more prone to damage unless buildings are properly reinforced to withstand strong lateral motions from earthrukes
89 Quakes come In two main types
Volcanic earthquakes are asso-ciated with the movement of molten rocks underground usually at depths of less than 30 kilometre5 near active or inactive (at surface) volcanoes
These volcanic earthquakes are
often called tremors because they tend to occur frequently and almost continuously and are often associat-ed with possible forthcoming erupt-ions of volcanoes
Fortunately it has been over a million years since volcanoes erupted in most parts of Fiji al-though the most recent volcano was probably active less than 2000 years ago in the Taveuni area
Because of the long period of
time since previous eruptions vol-
canoes in most parts of Fiji can be or least inshyconsidered extinct at
active
The possibility of another
eruption occurring at some future time cannot be totally discounted
But it should be reassuring to note that with modern advances in instru-mentation it is becoming increasing-ly possible to predict the likeli-hood of impending volcanic activity
Tectonic earthquakes the other
major (and more common) type are due
to the movements of relatively solid parts of the earths crust against each other
Such motions c 3n be in the form of the swallowing of a large portion (or plate) of the crust into a trench area
For example the Eastern Pacific plate is postulated to be drifting westward at the rate of about 10 centimetres (roughly 394
inches) a year and is being swallowed or subducted under the Western Pacific plate in the Tonga trench area
The subduction of one plate under another causes friction between the plates and causes numerous earthquakes fortunately at great depthsshyabout 500 to 600 kilometres (31056 to 37267 miles)
Tectonic earthquakes occur also along fault lines which are zones of weakness in the earths crust usually at fairly shallow crustal depth
Geologists have mapped a number of fault areas in Fiji where it is apparent that one rock mass has been moved (or displaced) relative to an
adjacent rock mass through the release of stresses and strainsbrought about during the geoshylogca dvlp n the islands
Fortunately again most
of the faults which have been mapped are thought to be inshyactive
But there are some fault zones which could be active and it is quite likely that the strong 1953 earthquake was caused by fault movement offshyshore from the Kalokolevu shyso ara
The recent earthquakes felt in the Waya - Nadi -Lautoka area could be due to fault movements several miles offshore south-west of Waya
In 1976 the Mineral Reshysources Division intends to do
detailed mapping of these possibly active fault-zone areas near Suva and in the west of Waya
Other plans are for the division to make greater use of instruments and become inshyvalved in the recording of earthquakes
9
THE MAIN DANGERS Collapse of buildings due to
lack of reinforcement poor building materials (eg adobe type) or un-satisfactory foundations
Broken overJ ead power lines can
occur quite easily and are partishy
cularly dcnprous because many people have the inclination to run outdoors when they feel a strong earthquake
Landslides are possible alongLandlidsposibe aongofae fault zones or very wet areas pbrti-cularly where hillsides are steep
One person was killed in the Namosi area by landslides during the 1953 earthquake
Earth movements and chasms People naturally tend to have a very strong fear that the earth will open up and swallow them during an earth-quake However there is only one pro-perly documented case in recorded history of a person being crushed in a fissure Basically the danger of falling into chasms is minimal and the natural terroz of people from this is apparently the result of ex-
Fire can be one of the most dangerous effects of earthquake as evidenced by the disasters in Son Francisco in 1906 and Tokyo in 1923 Perhaps the worst problem from fires caused by earthquakes is that water pipes are often broken and firemen are forced to use less accessible alternative sources such as a river or the sea
Tsunamis are a particular kind
of sea wave which can build up follow-ing an earthquake In the past they have devastated cities and small settlements along the coasts of Chile Peru Alaska Hawaii Japan and other countries These waves travel across the Pacific Ocean at jet speed (more than 600 miles an hour)
In shallow wters t5unamis become a threat to life and property because they can reach up to miore than 100ft high at wave crest levels and strike with devastating force
5
We have no official record of any extensive tsunamis in Fiji except for the one caused by the 1953 earthquake which claimed some lives in Suva andKadavu
Other tsunamis are likely to have occurred in earlier times but were not identified especially as tsunamis becauseour lack of experience with them
The barrier reef round much of the islands helps to dissipate some of the wave
energy and therefore some ofthe dangers
But we should realise that we can still bevulnerable to waves especially from a southerly direction where our reef systems are less extensive
If a very strong earthshyquake is felt in Fiji you should prudently assume that it has originated within the Fiji group and is likely to have generated a tsunami
In the 1953 case the tsunami was about csft high when it hit the reef outside Suva within 10 seconds after the earthquake
A 6ft wave then travelled across the harbour and hit the waterfront about three to four minutes later causing only
slight damage and leaving many
But the tide was low at that time If it had been high tide the waves could have been about 9ft high and the effects could have been disastrous
Waves 5ft to 6ft high
also hit Lami Deubq Be--Island and Koro Island and a 15ft-high wave claimed two lives at Nakasaleka Kadavu Smaller waves were felt at Ovalauthe southern coast of Vanua Levu and in the western Lou Group
Precautons to take Because earthquakes occur
suddenly and without warning there ore only a few precouton5 people can take such as ensuring that houses are on firm foundations and are suitably reinforced to withstand earthquakes
The following modified version of on earthquake notice is reproduc-ed from a California Geology article published in October 1975
When an earthquake occurs For a minute or two the earth may pitch and roll like the deck of a ship The motion is frighteningbut unless it shakes something down on you it is probably harmless in itself Keep calm and ride 4t out Your chances of survival are good if you know how to act
During the shaking If indoors stay indoors Got under sturdy fur-niture such as a table Stay near the centre of a building and stay away from glass Do not use condles matches or other open flames
Do not run through or near buildings particularly concrete ones where there is danger of fall-ing debris If outside stay in the open away from buildings and power lines
If in a moving ccr stop but stay inside
After the r akinq Check your water and electricity
If water pipes are damaged or electric wires are shorting turn off at primary control point If in a low-lying coastal area which can be affected by tsunamis leave house and make for higher ground (see tsunami safety rules below) Turn on radio for emergency bulletins Stay out ofaamaged buildings- aftershocks can shake them down
In a 1961 study of earthquake risks in Fiji RHoutz estimated that the chance of a strong quake occurring here -was about 140 ie
6
once every 40 years This figure should be reassuring But one must remember that it is only an estimate -and that once in 40 years could be toshymorrow
Tsunami Safety Rules Tsunamis follow no disshy
cernible pattern of occurrence When you receive a tsunami warning you must assume that a dangerous wave is on its way
History shows that when the great waves finally strike they claim those who have ihed the wnin ve
ignored the warning The following tsunami
rules were extracted from a pamphlet prepared by the US Environmental Science Services Administration and they should be noted 1 An earthquake in your
area is a natural tsunami warnshying Do not stay in 1-yving coastal areas after a strong local earthquake
2 A tsunami is not a single wave but a series of waves Stay out of danger areas until on all-clear is issued by a competent authority
3 Approaching tsunamis are sometimes heralded by a noticeshyable rise or full of coastal water This is nature s tsunami
warning and should be heeded 4 A small tsunamiat one
beach can be a giant one a few bea a Do nt le the milesaway Do not let the modestse ofowve ma you lose reect for whut may follow
5 All tsunamis - like hurricanes -are potentially dangerous even though they may not damage every coastline they strike
6 Never go down to the beach to watch for a tsunami
92
yocn thetoo L see wave you are After 5Oft
too close to escape it
7 Sooner or later tsunamishit visit every coastline in the Pacific Warnings apply to yollif you live in Suva reef any Pacific coastal Olrea
8 During a tsunami emergency A section of the Suva Harbour reef your local emergency organisations forced upwards by the 1953 earthshywill try to save your life Give quake A tsunami -(tidalwave) 50ft them your fullest co-operation high hit the reef within 10 seconds
Unless otherwise determined by after the quake and sent a 6ft wavecompetent scientists potential to the shoreThis struckdanger areas are hose less than watershyfront about three to four Ainutes 50f above sea level and within one later and caused minor Cdamage but
mile of the coast for tsunamis of only because it was at low tide any origin
7
Measuring their size Earthquake magnitudes are
measured on very sensitive seismolo-
gical instruments Theseare often referred to as the Richter scale and the largest shock known to date had a magnitude of 89 on Richter scale (compared to 675 for the 1953 Suva earthquake on the same scale)
hat is in commonAnother scale use and depends on physical effects and observations is the modified Mercalli scale which is reproduced here It measures the intensity of earthquake and is graduated from one to 12 for measuring
Modifiedl Mercalli scale1956 versiont
Earthquake intensity
1 Not felt except by a very few under especially favourable (for
the arthuak)crcustanesamountsthe earthquakes) circumstances
2 Felt only by a few persons at rest especially on upper floors of buildings Delicately suspended objects may swing
3 Felt quite noticeably indoors especially on upper floors of build-ings but many people do not recog-nise it as c earthquake Standing motor cars muy rock slightly Vib-ration like passing truck Duration can be estimated
4 During the day felt indoors by many outdoors by few At night some awakened Dishes windowsdoors disturbed walls make creaking sound Sensation like heavy truck striking building Standing motor cars rocked noticeably
5 Felt by nearly everyone many
awakened Some dishes windowsetc broken a fewinstances of cracked plaster unstable objects overturned Disturbances of trees poles and other tall objects sometimes noticed Pendulum clocks may stop
6 Felt by all many frightened
and run outdoors Some heavy furni-
ture moved a few instances of fallen plaster or damaged chimneys Damage slight
8
7 Everybody runs outdoors Damage negligible in buildings of good design and construction slight to moderate in wellshybuilt ordinary structures considerable in poorly built or badly designed structures some chimneys broken Noticed
by persons driving motor cars
8 Damage slight in specialshyly designed structures conshysiderable in ordinary substantshyial buildings with partial collapse great in poorly built structures Panel walls thrown out of frame strucTures Fall
f fameystrctresasof chimneyq factory stcks
columns monuments walls Eeavy furniture overturned Savy fniur e -turned
Sand and mud ejected in small Changes in well water
Disturbs persons driving motor
cars 9 Damage considerable in
specially designed structures well-designed frame structures
thrown out of plumb great in substantial buildings with partial collapse Buildings shifted off foundations Ground cracked conspicuously Undershyground pipes broken
10 Some well-builtwooden
structures destroyed most masonry and frame structures destroyed with foundations ground badly cracked Rails bent Landslides considerable from river banks and steep slopes Shifted sand and mud Water splashed over banks
11 Few if any (masonry) Ltructures remain standing Bridges destroyed Broad fissures in ground Underground pipelines completely out of service Earth slumps and land
slips in soft ground Rails bent greatly
12 Damage total Waves seen on ground surfaces Lines of sight and level distorted Objects thrown upward into the air
FILL THIS IN TO HELP THE EARTHQUAKE STUDY
To enable an improved study of shallow local earthquakes the coshyoperation of the public is required in filling out the following questionshynaire whenever an earthquake is felt Many earthquakes are very small and sometimes are not recorded on seismological instruments This questionnaire system will enable the Mineral Resources Division to better determine the location of earthquake zones which can then be mapped in detail
EARTHQUAKE QUESTIONNAIRE
1 An earthquake was felt on at am or pm
Place
2 What direction did the shock come from
o ooo mge oe e o o o o
3 How many seconds did the quake last
4 Was the shaking rapid or slow
5 Where were you when the earthquake occurred
6 Were you awake asleep or awakened
7 Were you walking working standing sitting or lying down
8 Did the people around you feel the earthquake too
9 Did people run outside
10 Did cracks occur in the buildings you were in
11 Was the building damaged in any otherway
o
12 What is the building made of
13 Did the windows doors dishes rattle
14 Did hanging objects doors etc swing 0000000000600
Turn to next page 9
95 15 Did vases small objects furniture overturn
e
16 Did things fall off shelves
17 Did you notice any unusual waves in the sea after the quake 00 0a -0 0 000aV0a0a0 000000a000 00
18 1f so h6w soonafterwards 0 BO
e a 0000000amp000000000amp0000 a a
What were the waves like 00000619
20 Did anything else unusual happen
0 o a o e e o o 0o e o e e eo o eo 6 o e e e oIe e e o o o adegdeg e odegI e o o oo oo oe 1 8 aampv a
21o Any other remarks e
N me a
Complete formtear out this whole page and mail to
The Director of Mineral Development Mineral Resources Division Private Bag GPO SUVA
This special booklet is published by the Ministry of Information at Government Buildings in Suva for the Ministry of Lands and Mineral Resources
(JANUARY 1976)
10
96
In the wake of the 1953 quake
1M
Crack in the coral
A -rac) in the main Suva reef after the earthquake and tidal wave in 1953
12
T SANERIVE Government Printer Suva Fiji
98
APPENDIX IV SEISMOLOGICAL FACILITIES AND EARTHQUAKE HAZARD PROGRAMS IN THE SOUTHWEST PACIFIC
As part of our program of field investigations in Fiji Tonga andVanuatu our researcher was able to visit the neighboring island countries of the Southwest Pacific region During these visits he was able to meetwith scientists and public officials involved with the earthquake hazard problem facing each country In every case the governments are aware ofand have taken some action to mitigate the potential losses due to destrucshytive earthquakes but these governmental responses have varied widely fromcountry to country This report focusses on the seismological institutionsand facilities in each of the countries and their capablities in assessingand planning for carthquake hazards In the following sections we conshysider each of the island countries of this area which face a severe earthshyquake risk Fiji Tonga Vanuatu Western Samoa Solomon Islands PapuaNew Guinea and New Zealand
FIJI
Seismological Facilities
Seismological observations in Fiji are conducted by the Mineral Resources Department a subdivision of the Ministry of Energy and MineralResourcs The government has made a major commitment to seismologicalwork since the establishment of the AID-supported seismic network in 1979In fact seismological observations in Fiji have been carried out since theearly part of this century supported at first by the New Zealand scienshytific organizations and subsequently strengthened by Lamont GeologicalObservatorys Upper Mantle Project in the 1950s and 1960s In late 1979the 8 -station US AID network was established to complement three permanent stations in Viti Levu The network was significantly expanded byinstallation of a five-station telemetered network in 1981 supported byJapanese aid (Figure Al) Additional stations were installed in 1983 and 1984 the network has now expanded to an eighteen-station national networkwith excellent coverage of the Fiji region In addition MRD now has available five MEQ-800 portable seismographs for occupation of temporaryfield sites telemetered station testing and special refraction experiments While the Fiji network has experienced considerable technical difficulties it has recorded over 2000 earthquakes since its installationand provides an invaluable basis for seismological study of the Fiji region
Strong Motion Accelerographs
The Mineral Resources Department also operates a network of strongmotion accelerographs now numbering ten Kinemetrics SMA-ls (Figure A2)The initial six instruments of this network were granted to Fiji by AIDthe remainder were purchased by the Fiji government Since establishment of the SMA network three accelerogram records have been obtained from moderate-sized earthquakes in Viti Levu Records obtained from thisnetwork are expected in the long run to provide the basis for predicting
tTT Illt EAST OF +NWICH IS0 WEST OF GREENWICH III
Y 7sdeg NATIONAL NETWORK OF SEISMOGRAPHIC STATIONS 1982
AC7
DEELLAAIKOORROOMTRE
23O~~~~ ROTUMU
YASAWAIRAR C1
00
A0 KORO
-W
0
I VUNH SOUTHRIOGE A
~)AVALAU 0
NADI A A ONASAVULAU
MAGOORO A VUNIOAWALAU
VIT LE U _LAKEPe NAMOSI AUNIAA -GAJ
ALOAA0A NAMORO SUVA
VITICLEVU
13 BEOA
LEGEND A E-isting Station
I RAKRAKI A Proposed Station Toloyo
Motulu Fuloo amp
EAST OF GREENWoICH ISO WEST Of GREENWICH ITS
Figure Al Network of seismic stations in Fiji established through the assistance of US AID and Japanese aid programs
_ _ _1_ Q__
NATIOqAL NETWORK OF EAST
STRONG OF OEEwICH
MOTION IO WEST 0 OREV-1CM
ACCELEROGRAPHS 79
LEGEND
A Accelerograph
0 30 60 KLOLETRES
LBS
YASAWA
lt ---shyVANUA LEVU U
T EUW r
S|bullKORO 0
T
V2anua bala~u
N
0
LA IV)DI A MON~ASAVU V
9LAU
VITI LEVU OKA1)
(4)
GAU
LAKE1A
0 11-
Kld
A S T O r
Maluku
GREN Wa
Toloyc
I 0 W E S T O f C REEM CN I
Figure 2A Location of strong-motion accelerographs in Fiji
100
ground accelerations and thus for development of building codes specific to Fijis tectonic setting
Related Scientific Programs
The Mineral Resources Department includes an Offshore Geology sectionwhich has an active program of marine geological and geophysicalinvestigations in and around Fiji waters MRD also employs an engineeringgeologist whose work includes microzonation of the Suva area mapping ofactive faults in southeastern Viti Levu and investigation of soils subjectto earthquake-induced liquefaction An active program of geologicalmapping and structural studies is also carried out by MRD They aresupported by personncl assistance from Australia and Great Britain
Suva is also the home of the United Nations Committee for Coordinationof Offshore Prospecting in South Pacific Offshore Areas (CCOPSOPAC) Thisorganization coordinates much of the international marine research carried on in the region and has been particularly helpful with Fijisinvestigation of its offshore waters
Critical Facilities
The major development in Fiji has been in and around the capital cityof Suva The population of the metropolitan area now exceeds 130000 and most of the government commercial and industrial operations are concentrated there The city has become a major commercialtransportation and regional political center and has developed rapidly inthe past ten years Development in this period has included constructionof multistory buildings a major electric power plant expansion of theSuva harbor and most recently completion of the thirteen-story CentralMonetary Authority building in downtown Suva Much of this development hastaken place on an area of filled land close to sea level particularlyvulnerable to earthquake and tsunami damage This area was extensivelydamaged by the 1953 Suva earthquake and tsunami and is thus at significantrisk from a repeat occurrence of an event of comparable size
Other population centers with significant development include thetowns of Lautoka (pop 29000) Nadi (13000) and Ba (9000) on the islandof Viti Levu and Labasa (13000) on Vanua Levu The tourist industrywhich is a major part of Fijis economy is concentrated on the southernand western coasts of Viti Levu and is also vulnerable to earthquake andtsunami damage The major development project in Fiji is the 87-meter highMonasavu Dam in the interior of Viti Levu The earthfill dam was completedin 1983 and is planned to provide most of the countrys electric powerneeds through the end of the century
Earthquake Preparedness Programs
In awareness of the serious earthquake risk to development in Fijithe government has adopted New Zealand earthquake design codes for most ofthe urban areas of the country Seismic zone B codes applicable to areas of moderate seismic activity in New Zealand have been chosen asappropriate and are applied (in theory at least) to all domestic andcommercial construction in urban areas Considerable difficulty remains in
101
enforcement of these regulations particularly in construction of privatedwellings Major multistory building design is generally handled by overseas (Australia or New Zealand) engineers and dynamic modelling tests are generally applied for earthquake loadings at least as large as those required by the New Zealand codes The Monasavu Dam underwent dyiamictesting by Australian consulting engineers
Disaster preparedness is the responsibility of the Emergency Services Committee (EMSEC) and the Prime Ministers Relief and Rehabilitation Committee (PMRRC) EMSEC is responsible for coordination of disaster plans maintenance of essential services advice to the Cabinet on emergency measures and direction of relief work It is comprised of representativer of the related ministries and public agencies PMRRC is chaired by the Prime Minister of Fiji and has responsibility for long-termrelief policy and rehabilitation programs Fijis experience with recurrent weather-related disasters has spurred efforts for emergencycommunication systems supply distribution temporary shelters and so on Much of this hurricane disaster planning is applicable as well to earthquake and tsunami damage Fiji is also a participant in the International Tsunami Warning System
Educational programs have been handled through the Fiji BroadcastingSystem the Red Cross and the school sysem To a limited dgree the Public Works Department and the Mineral Resources Department have producededucational materials related to earthquake hazards in Fiji
TONGA
Seismological Facilities
Seismological observations in Tonga are the responsibility of the Ministry of Lands Surveys and Natural Resources Due to fiscal constraiits however these efforts have in the past been entirelydependent on foreign assistance Seismological experiments began in Tongain the mid-1960s with Lamont-Dohertys Upper Mantle Project Seismic stations were operated by Lamont-Doherty and subsequently by Cornell scientists through the early 1970s when operations were suspended In late 1983 as part of the present AID-supported seismic hazard programCornell reinstalled a three-component short-period seismograph in the capital Nukualofa The seismograph was installed upon the request of the government geologist to be operated by the Tongan government with technical assistance from Cornell Unfortunately after operation of the seismograph for eight months Tongas Cabinet decided that the drain on its resources and personnel was excessive and the instruments were disconnected in May 1984 with the components transferred to Fiji and Vanuatu where they can be utilized There are presently no plans to reinstall permanent seismographs in Tonga
Strong Motion Acceierographs
Two strong-motion accelerographs provided by the AID seismic hazard program are presently operating in Tonga one in Nukualofa and one in the northern Vavau Islands They have been in operation for one year and
102
have not to date recorded any large earthquakes They require a minimum of maintenance and their operation will continue to be supervised by the government geologists with assistance from Cornell A third accelerograph may be made available to tonga by the British Geological Survey and could bB installed on Eua Island in a zone of high activity close to the Tonga Trench Related Research Programs
The Ministry of Lands Surveys and Natural Resources employs a singlegovernment geologist whose responsibilities include coordination of oil prospecting geolcgical mapping of the islands and assessment of earthquakeand tsunami hazards There has been considerable scientific study of the Tonga Trench subduction zone by research groups from the United StatesJapan New Zealand Australia Germany and the Soviet Union More detailed marine geophysical data have been collected near Tongatapu Island byAmerican petroleum exploration groups
Critical Facilities
The capital city of Nukualofa has a population of only 20000 butdoes include several three- and four-story buildings The larger buildingshave in general been designed by foreign engineers and have included earthquake- resistant design specifications Other significantdevelopment projects include the expansion of the government wharf in Nukualofa and development of tourist resorts on Tongatapu and several of the outer islands
Earthquake Preparedness Programs
There are no building codes presently enforced in Tonga Howeverconstruction of public buildings must be approvei by the Ministries of Works and Health The largest office buildings and hotels are designed byoverseas engineering firms and generally include some earthquake loadingcriteria The Land and Environment Act currently under consideration bythe Tongan government would require review of all development projects bythe government planner application of building codes largely adapted from New Zealand codes is expected to follow
Disaster preparedness programs are the responsibility of the Cabinets National Disaster Committee including representatives from the related government ministries and departments Subcommittees focus on disaster preparedness action planning and long-term relief and rehabilitation There is no earthquake education program in Tonga
WESTERN SAMOA
Seismological Facilities
One of the earliest seismic stations in the Pacific was established atthe Apia Observatory in 1902 during the German colonial period through the University of Gbttingen In 1921 control of the observatory was transferred to the New Zealand Government Weichert seismographs were
103
operated continuously at Apia through 1957 when they were replaced by Benioff instruments at Afiamalu and by short-period Wood-Anderson instruments at Apia Since Samoan independence in 1963 the Observatory has been operated jointly by the Samoan Government and the Department of Scientific and Industrial Research (DSIR) New Zealand In 1963 a Worldwide Standard Seismograph Station was established at Afiamalu Operation of this six-component station is supported by the US Geological Survey In 1980 the station was upgraded to allow digital reccrding equipment was added to upgrade the station to the status of a Global Digital Seismic Network station Seismic records are sent to DSIR in Wellington for permanent storage
Strong Motion AccelerograDhs
A simple strong motion instrument has been operating in Apia since 1979 It is an event-triggered low-gain seismograph recording on an ink-stylus recorder At the time of our visit to Western Samoa the instrument had been out of service for several months Only one event has to date triggered the instrument
Related Scientific Programs
The Apia Observatory has also made continuous magnetic field measurements since 1905 Measurements are currently made using a Schultze earth inductor an Askania declinometer and a proton magnetometer The observatory maintains two tide guages as part of the Pacific Tsunami Warning System Offshore resource studies have been carried out through CCOPSOPAC and by various international research groups Much of the reconnaissance geological work in Western Samoa has been carried out by DSIR in New Zealand
Critical Facilities
Like many of the other island countries of the Pacific Western Samoas development has been concentrated around the capital Apia (pop 34000) A major deep-water harbor and the countrys tourist industry are based in Apia Several multistory buildings have been erected in Apia in the past several years A hydroelectric dam on Upolu Island was completed in 1978
Earthquake Preparedness Programs
There is presently no disaster plan in effect in Western Samoa The various agencies involved with emergency action are coordinated through the Police Commissioner New Zealand seismic zone B codes are applied to construction in Western Samoa Enforcement is handled by the Public Works Department Modest educational materials have been prepared by the Apia Observatory staff in English and Samoan for distribution through schools and public agencies
104
SOLOMON ISLANDS
Seismological Facilities
Seismological Observatories in the Solomon Islands are conducted bythe Ministry of Lands Energy and Natural Resources They have operated aWorldwide Standard Seismic Station in Honiara since 1962 operation of the station is supported by funds from the US Geological Survey The station was augmented by two short-period telemetered seismic stations in 1982 This three-station necwork was provided through the British GeologicalSurvey with the aim o identifying volcanic earthquakes associated with theactive volcano Savo located close to the capital
In awareness of the high volcanic risk to population centers in theSolomon Islands the Ministry has drawn up plans for two three-station telemetered arrays to be deployed around the active volcanoes on Simbo Island (New Georgia Group) and on Tinakula Island (Santa Cruz Group) Theyare presently seekirg foreign aid in the form of seismic instrumentation and technical asistance to establish the network
The Ministry also has responsibility for field surveys following majorearthquakes in the Solomon islands Studies of ground deformation and cultural effects of the large 1977 and 1984 earthquakes were made by seismology officers
Strong Motion Accelerographs
Two strong motion accelerogaphs were installed on Guadalcanal by theMinistry in late 1984 They will be responsible for maintaining the instruments but have requested Cornells assistance in analyzingaccelerograms obtained during their operation The high level of shallow activity near Guadalcanal suggests that a significant number of strong-motion records will be obtained during the lifetime of the instruments
Related Scientific Programs
The Ministry also carries out related research programs in regionalgeology minerals assessment groundwater studies and so on Extensive marine surveys have been caried out in the Solomon Islands by the USGeological Surveys Resource Assessment Program Local offshore surveyshave been carried out through CCOPSOPAC A tide gauge is maintained bythe Solomon Islands Hydrographic Unit Six proton-precession magnetometers are operated in the Solomon Islands by the Queensland University (Australia)
Critical Facilities
Over 90 of the Solomon Islands population remains in rural areas The major development is in Honiara the administrative and commercial center of the country Honiara (pop 15000) is the major shipping center of the country and now includes several multistory buildings
105
Earthquake Preparedness Programs
The Solomon Islands implemented a National Disaster Plan in 1980 subsequently revised in 1982 The Plan gives the Ministry for Home Affairs and National Development overall responsibility for coord~lation of efforts in earthquake volcanic and tsunami disasters Operational relief effort are carried out through the Disaster Operations Coordinator and the Provincial governments
The government has adopted the most stringent earthquake building code (Zone A) from New Zealand for multistory building construction in Honiara Implementation of these guidelines continues to be a problem One multistory building in Honiara (Australian High Commission Building) was severely damaged during the 1984 earthquake Some efforts have been made to develop small-scale earthquake-resistant building techniques appropriatefor rural areas The Pacific Islands Development Program organized a model house construction and workshop during early 1984 A modest outreach program has developed through the school system adult education programs and the government broadcasting company
PAPUA NEW GUINEA Seismological Facilities
The government of Papua New Guinea has made an extensive commitment to earthquake and volcanic hazard mitigation through construction of a national network of seismographs and accelerographs (Figure A3) A ten-station national network of seismographs is monitored by the Port Moresby Geophysical Observatory (Department of Minerals and Energy) Three of the remote stations are telemetered to Port Moresby via microwave links four stations operate as permanent field stations and two are operated at temporary sites on outlying islands Port Moresby is presently the site of a Worldwide Standard Seismic Station that has operated since 1958 The national network reports arrival times to the US Geological SurveysPreliminary Determination of Epicenters and the International Seismological Centre but does not routinely locate events independently
In addition to the national seismic network the Rabaul VolcanologicalObservatory operates seven seismic stations near active volcanoes around the country and a nine-station telemetry network around the Rabaul Caldera Bougainville Copper Limited opeates a 5-station network on Bougainville Island (North Solomons Province)
Strong Motion Accelerographs
The Port Moresby Geophysical Observatory maintains a national network of thirteen strong motion accelerographs distributed in the highly seismic areas of the country (Figure A3) This includes a closely spacedfour-station network around the Rabaul Caldera A single strong motion accelerograph is situated on Bougainville Island and is maintained byBougainville Copper Limited The network uses Kinemetrics SMA-I and New Zealand DSIR MO-2 instruments and has recorded tens of accelerograms since its establishment in 1967 The Observatory ispresently trying to to establish an engineering seismologist position to analyze the accumulating data and to further upgrade the accelerograph network
I I I I I I I I I I
Re--o -joso shy
Mooo u J4D (Ro-js
bull~~vASeA saxA+ Samp-cUong sloon
(twu lueoaott koRowq (KvG) jjj ccurodAj a~OlF
Accv~tj (8~Cli
Raboul (PART 2bLo(MOG) C GoTo and -4-A Duke of Tok
vie W~~IiTUI = a
Rogno SGA Kowumbukae0
lebub-gn ITPAc l-O MARCH agno BGAI
Tank ( F -goono PAAl
Coo Glooclslb Island I OSOGRAP SEISM A-D ACCELEOGR -
_____ L I IS IIsI I I
IPUGI
PAPUA NeW GUI NEeAr rp n w k
hTTWORKS MARCH 1384
IG -nol 1v
Figure A3 Papua New Guinea seismograph and accelerograph networks a
107-108
Related Scientific Activities
In addition to the Geophysical Observatory the Department of Mineralsand Energy includes the Geological Survey of Papua New Guinea The Surveyundertakes a wide range of geological investigations including regionalgeological mapping petroleum and mineral exploration engineering andenvironmental geology and energy resource development Offshore surveyshave been carried out through CCOPSOPAC as well as American and Austrrlianresearch vessels Continuous monitoring of the magnetic field is carriedout by the University of Queensland (Australia) Ten tiltmeters have beendeployed by the Volcanological Observatory to monitor ground deformation near Papua New Guineas active volcanoes Four of these instruments are deployed around Rabaul Caldera
Critical Facilities
Papua New Guinea is the most developed of the island countries of theSouthwest Pacific with a population of over 3000000 and extensive urbandevelopment The capital city of Port Moresby has a population of over 130000 with major multistory construction in the downtown area a majordeep water harbor and significant commercial and industrial activity in thePort Moresby area There is significant development as well in the smaller towns of Rabaul Lae Madang Wewak Goroka Mount Hagen Wau BuloloDaru and Kerema Major hydroelectric schemes have been established on theRamu and Rouna rivers with additional hydroelectric plans at various stages of evaluation and development Extensive mineral development hastaken place in the North Solomons Morobe and Western provinces of PapuaNew Guinea Extensive natural gas and limited oil deposits have beenlocated these may become commercially exploited in the near future
Earthquake Preparedness Programs
Papua New Guinea has a long history of earthquake and volcano-relateddisasters A national disaster program was established in 1981 and provides for a National Disaster Emergency Committee which formulates emergency government policy and a Disaster Civil Defence Committee which is responsible for implementation of short-term relief efforts Theprovincial governments are given major responsibility for initial coordination and assessment of disasters assistance is subsequentlyrequested from the federal government for major disasters Many of theprovincial governments have not revised preparedness plans since thecolonial period However particularly intense effort has been directed inEast New Britain province because of the imminence of a potentiallydestructive volcanic eruption in Rabaul Caldera
The town of Rabaul (pop 15000) is a major commercial center forPapua New Guinea and is situated directly within the caldera of an activevolcano A relatively small eruption took place at a secondary eruptivecenter near Rabaul in 1937 killing over five hundred nearby residents andforcing the evacuation of the town In order to avoid a repeat of such adisaster the government established the Volcanological Observatory withfour full-time volcanologists and real-time earthquake location andanalysis of tilt data A drastic increase in volcanic seismicity in mid-1983 led to a volcanic hazard alert and intensification ofseismological and ground deformation studies around Rabaul In addition
109
the alert allowed the provincial and national Disaster Emergency Committees to make extensive evacuation and relief plans for a possible eruption at Rabaul including preparation of a new airstrip improvement of roads and emergency water supplies communications systems detailed evacuation plans education programs and so on To date there has been remarkable cooperation of efforts by provincial national and overseas officials to mitigate the potentially devastating effects of a volcanic eruption at Rabaul
Papua New Guinea is the only country of the developing nations of the Southwest Pacific to have devised its own seismic zoning system (Figure A4)
The Nationwide Housing Code for Papua New Guinea sets up a four-level system of seismic loading oriented toward moderate-sized (to 8 stories)buildings Major buildings require independent dynamic analysis usuallycarried out by overseas engineering firms Seismic Zone 1 of the HousingCode is among the most stringent earthquake loading codes in the world and includes the town of Rabaul and much of the East New Britain and North Solomons provinces Seismic zone 2 includes the towns of Lae Wewak and Madang and is approximately equivalent to New Zealand Zone A or California loading designs The capital Port Moresby is in the lowest seismic zone (4) but buildings constructed there still require designsallowing for significant lateral loadings
Earthquake education is handled through the National Radio Government Printing Office the Civil Defence Department and the school system with information supplied by the Geophysical and Volcanological Observatories A particularly intense education effort has been mounted in Rabaul where educational materials have been produced and distributed in three languages and public involvement in preparedness plans has been emphasized
NEW ZEALAND
While New Zealand cannot be considered one of the developing countries of the Southwest Pacific its seismology programs have been responsible for much of the observational data available for the entire region Because of its importance to the other national seismology programs we briefly review here the New Zealands observational facilities Its extensive programs in engineering seismology its critical facilities and its earthquake preparedness programs will not be covered here
National Seismic Network
Seismological facilities in New Zealand are maintained by the Geophysics Division of the Department of Scientific and Industrial Research (DSIR) in Wellington The natioal standard seismograph network presentlyconsisting of thirty short-period stations is shown in Figure A5 The network routinely locates all earthquakes of ML gt 38 within New Zealandand earthquakes with Ms gt 50 for the region within 100 of New Zealand Arrival time data are routinely transmitted to the US Geological Surveyand the International Seismological Centre The events located by the network are reported in the annual New Zealand Seismological ReportSeveral hundred earthquakes are located by the DSIR national network each year
0 - - - --- - - - -
FIG 13
1SEISMIC ZONES FOR BUILDING CONSTRUCTION
- -- IN PAPUA NEW GUINEA
i 1d - - - - - _
(I -lt 53-0Fef cs r i eat a 1 982))j --_ _ -- r L - - --- a a V bull
N i - O(r-tIbd t
__ __ Po --shy
-- -- -
[i ~5- E I
Is-O I ___ oh - - --- - --shy-- shy
4 __J ft - - I- S 4 E jshy
_ _ _-i - _ j -z -
_____ _U 511
ZONE CLASSIFICATION OF CITIES I lZONE 30 1 I 3 1 153--ZONE3 4u shyW-t -~- 6--v 4- bull -
I == 1 --by- Ll _
Figure A4 Seismic zones for building construction in Papua New Guinea (jury et al 1982)
CAPE REINGA
ONERAHI
GREAT BARRIER AUCKLAND - C
5OCT 1914 WHITE ISLAND
KARAPIO EAST CAPE 0r WHAKATANE 15 WAIRKEIp I TUI 28 JUN 1921 t SEP19_-
CHATEAU TARADALE N U 2 FEB 19317 1897 1a Ju DEC 84
MANGAHAO 5 MAR 934 8 AUG 1904 - CASTLEPOINT ( A 1942
COs ELLINGTON IS5CT 18408 2C18BJN562 JAN 1855 23 MAY 1989
Figure A5 Seismograph stations of the national network (left) and the distribution of large shallow earthquakes (right) in New Zealand From Seismological Observatory Wellington (1980)
112
The network is augmented by long-period instruments operating atKaropiro Roxburgh and Wellington DSIR also operates a three-componentborehole seismometer in Wellington as part of the Seismic Research Obseervatory network supported by the US Geological Survey
Stations in Outlying Territories
New Zealand has also taken an important lead in operating seismographstations in outlying areas of the Southwest Pacific These stations havebeen extremely important in hypocentral control for the Tonga - Kermadec seismic zone and for nuclear event detection in the Pacific DSIR operates three 6 -component Worldwide Standard Seismograph stations at Afiamalu (Western Samoa) Raratonga (Cook Islands) and Scott Base (Antarctica) Short-period stations operate at Apia (Western Samoa)Campbell Island (New Zealand) Chatham Islands (New Zealand) Nadi (Fiji)Nime and Raoul Island (Kermadec Island New Zealand) Readings from these stations are routinely reported to PDE and ISC for global earthquake location
Wellington Network
A small-aperture high-gain seismic network is operated around Wellington an area of greatest seismic risk in New Zealand The stations are telemetered by radio or telephone link to the central recording site The network now consists of eleven stations Earthquakes are presentlydetected by a microprocessor-based Automatic Seismic Monitor and automated location processing is expected to follow The network routinely locates events with ML gt 15
Pukaki Network
A second microearthquake network has operated around Lake Pukaki ahydroelectric project in the South Island New Zealand The network wasestablished in 1975 to monitor reservoir-induced seismicity associated with impoundment of the reservoir The network consisted of nine stationsand was intended to operate on a temporary basis It has been closed since early 1984 with several of the stations continuing to support the national network and to monitor any future reservoir-related activity
Related Seismology Research
In addition to its regular observatory seismology the GeophysicsDivision has an active seismology research program Their studies have focussed on theoretical seismology earthquake prediction crustal structure of New Zealand historical earthquake studies nuclear eventdetection seismic risk in New Zealand strong motion studies and volcanic seismology The monitoring of active volcanoes is closely coordinated withcrustal deformation monitoring conducted by the Earth Deformation Section of the New Zealand Geological Survey
The New Zealand strong motion accelerograph network now consists of225 instruments operated by the Physics and Engineering Laboratory of DSIR Most of these instruments are of a New Zealand design (Mechanicaland Optical Accelerographs) and analog records are made on photographicfilm Three digitally recording accelexographs are now in operation in New
113
Zealand and the MO records are digitized for computational analysisAnalysis of this empirical data is being used for a revision of New Zealands building codes
114
REFERENCES
Berryman K 1979 Seismotectonic zoning study of the Fiji IslandsEarth Deformation Section Report 70 Wellington NZ Dept Sci and Indust Research 40 pp
Franco AB MP Hamnett and J Makasiale 1982 Disaster Preparednessand Disaster Experience in the South Pacific Pacific Islands Developshymental Program Honolulu 380 pp
Geological Survey of Papua New Guinea 1979 Information Booklet Port Moresby Dept Minerals and Energy 12 pp
Government of Western Samoa 1977 Apia Observatory 1902-1977 ApiaApia Observatory 8 pp
Jury RD JP Hollings and IAN Fraser 1982 The development ofseismic zones and the evaluation of lateral loadings for earthquakeresistant design of buildings in Papua New Guinea Bull NZ Nat Soc for Earthq Engr 5 123-140
Lowenstein PL 1982 Problems of volcanic hazards in Papua New GuineaGeol Surv Papua New Guinea Rept 827 Port Moresby Papua New Guinea 62 pp
McCue KF and ID Ripper 1980 The Papua New Guinea Strong MotionAccelerograph Network Geol Surv Papua New Guinea Rept 807 Port Moresby Papua New Guinea 13 pp
Mineral Resources Department Seismology Section 1983 National activityreport Fiji Submitted to Session IX Intl Coord Group for TsunamiWarning System in the Pacific Min Resources Dept Fiji Note 333Suva Fiji 4 pp
Parliament of Fiji 1984 Mineral Resources Department Annual Report forthe Year 1982 Parliam Paper No 13 Suva Fiji 90 pp
Power CA 1978 Earthquake risk in Fiji and the problems of earthquakeengineering Presented to the Fiji Society 17 pp
Prevot R and JL Chatelaiu 1983 Seismicity and Seismic Hazard in Vanuatu ORSTOM Rept 5-F3 Noumda 51 pp
Ripper ID 1982 Accelerogram library Geol Surv Papua New Guinea Rept 198211 Port Moresby Papua New Guinea 44 pp
Seismological Observatory Wellington 1980 The earthquake problem in NewZealand Alpha DSIR Extension Information Wellington NZ 4 pp
Smith WD 1979 Seismology and related research in New Zealand1975-1978 NZ DSIR Information Series No 140 30 pp
115
Smith WD 1983 Seismology and related research in New Zealand 1979-1982 Seismol Observatory Wellington Bull 276 32 pp
Solomon Islands Government 1982 National Disaster Plan 1982 Honiara Solomon Is 14 pp
116
A Rahimin A Simpson R Holmes P Rodda R Singh I Everingham K Draunidalo G Shorten M Mehrotra J Booth J Campbell
R Carter R Byrne G Gauss D Rubin
S Tongilava
D Tappin S Lemoto T Tukia
C Clarke
R Campillo R Foy T Lee J Rdcy J Chatelain R Prdvot
L ioane S losa A Titimaea
S Danitofea
D Tuni R Walshaw J Vunagi D Gwyun
INFORMATION CONTACTS
FIJI
Director Mineral Resources Dept Asst Director (MRD) Princ Geol OffshoreSeismol (MRD) Princ Geol Inform Services (MRD) Principle Geophysicist Senior Seismologist (MRD) Seismologist (MRD) Senior Engineering Geoogist (MRD) Struc Engr Suva City Council Civil Engineer Suva Engineering Geologist A Gibb amp Partners (Monasavu) Marine Geologist (CCOPSOPAC) Marine Geologist (CCOPSOPAC) Marine Geologist (CCOPSOPAC) Marine Geologist (CCOPSOPAC)
TONGA
Superintendent of Lands Surveys and Natural Resources Government Geologist (LSNR) Land Assessor (LSNR) Government Planner (LSNR)
VANUATU
Director Dept Mines Geology and Rural Water Supplies Director ORSTOM Mission Engineer ORSTOM Civil Engineer Public Works Dept Director ORSTOM Dept Geol and Geophys (Noumda) Seismologist ORSTOM (Nouma) Seismologist ORSTOM Nouma)
WESTERN SAMOA
Director Apia Observatory Senior Seismologist (AO) Geologist (AO)
SOLOMON ISLANDS
Chief Geologist Ministry of Lands Energy and Natural Resources
Senior Seismologist (MLENR) Senior Geologist (MLENR) Ministry of Home Affairs and National Development Civil Engineer Public Works Department
117
PAPUA NEW GUINEA
K Doble Chief Geologist Geological Survey I Ripper Chief Seismologist Geophysical Observatory G Seidel Information Officer Volcanological Observatory G Anderson Engineering Geologist Geological Survey J Wilkins Civil Engineer Dept of Works and Supply
NEW ZEALAND
W Smith Director Seismological Observatory Wellington
UNITED STATES
M Hamnett Pacific Islands Development Program G Burton Director Pacific Tsunami Warning Center R Sillcox Seismologist (PTWC) G Pararis-Corayannis Director International Tsunami Information Center
118
APPENDIX V TSUNAMI SAFETY RULES
1 All earthquakes do not cause tsunamis but many do When you hearthat an earthquake has occurred stand by for a tsunami emergency
2 An earthquake in your area is a natural tsunami warning Do not stayin low-lying coastal areas after a local earthquake
3 A tsunami is not a single wave but a series of waves Stay out ofdanger areas until an all-clear is issued by competent authority
4 Approaching tsunamis are sometimes heralded by a noticeable rise orfall of coastal water This is natures tsunami warning and should be heeded
5 A small tsunami at one beach can be a giant a few miles away Dontlet the modest size of one make you lose respect for all
6 The Tsunami Warning System does not issue false alarms When anocean-wide warning is issued a tsunami exists When a regionalwarning is issued a tsunami probably exists The tsunami of May 1960killed 61 people in Hilo Hawaii who thought it was just another false alarm
7 All tsunamis--like hurricanes--are potentially dangerous even thoughthey may not damage every coastline they strike
8 Never go down to the beach to watch for a tsunami When you can seethe wave you are too close to escape it
9 Sooner or later tsunamis visit every coastline in the PacificWarnings apply to you if you live in any Pacific coastal area
10 During a tsunami emergency your local Civil Defense police andother emergency organizations will try to save your life Give them your fullest cooperation
Unless otherwise determined by competent scientists potential danger areasare those less than 50 feet above sea level and within 1 mile of the coastfor tsunamis of distant origin or less than 100 feet above sea level andwithin 1 mile of the coast for tsunamis of local origin
9
intra-oceanic arc is unusual in that the subducting slab dips toward the
Pacific Basin The Indo-Australian plate is being subducted at a rate of
approximately eleven centimeters per year (Dubois et al 1977 Pascal et
al 1978 Isacks et al 1981) in a direction perpendicular to the trench
(Isacks et al 1969 Johnson and Molnar 1972 Pascal et al 1978)
Relative to other convergent plate boundaries (eg Chile and Alaska) the
width of the zone of interaction between these two plates is limited to
approximately 50 km in extent because the subducting (Indo-Australian)
degplate is steeply downbent (70 ) at intermediate depths This geometry
produces a narrow ribbon of potentially damaging seismicity rather than a
large region of seismicity The northern and southern portions of the arc
are typical of arc-trench systems but the central portion exhibits several
unusual features (1) The bathymetric expression of the trench is obscured
between 13degS and 17degS where a submarine ridge known as the dEntrecasteaux
Fracture Zone intersects it at approximately 16degS (2) The upper plate
protrudes westward in this central portion of the arc such that the western
coast of Malekula Island is located where the inner slope of the trench is
normally positioned (Karig and Mammerickx 1972 Isacks et al 1981 see
Figure 3)
Shallow Vanuatu earthquakes (Figure 5) are located in the interplate
zone between the two plates They are associated with slippage of the
Indo-Australian Plate as it descends beneath the Pacific Plate Intraplate
earthquakes also occur within the descending and overlying plates in the
trench region and behind the island arc in what is known as the back-arc
region An actual and a schematic vertical cross section near Tanna
perpendicular to the trend of the arc is representative of the
10
1600 E 1700 180 W 1700
I 0 s ee 0 0o
2e 01
6 S
20
30S $
S4b
0
3040 30
4S
400
1 2 40
150 1600 E 1700 I80 170 W
Figure 5 Regional setting of the Southwest Pacific associated with the plate boundaries in this region
Shallow seismicity
relationship of the seismicity to the trench islands and back-arc region
(Figure 6) In Vanuatu earthquakes occur from near the surface to
approximately 300 km depth The earthquakes systematically deepen
eastward from the New Hebrides Trench forming a narrow dipping plane
under islands located in the central portion of the arc and intermediate
depth earthquakes occur-progressively farther eastward Large (Ms gt 7)
earthquakes but few great (Ms 7 34) earthquakes have occurred along
the island arc as a result of the subduction of the Indo-Australian plate
In spite of the anomalous protrusion of the upper plate in the central
part of the arc the Benioff zone and convergent plate boundary appear to
be relatively uniform in configuration and continuous along the entire
length of the arc (Pascal et al 1978 Isacks et al 1981) The linear
distribution of the islands of Vanuatu and their location so close to the
main interplate thrust zone of the convergent plate margin result in a
geometry that is uniquely suited for subduction zone studies in comparison
to most other subduction zones on earth This also results in a unique
earthquake hazard in central Vanuatu Behind and eastward of the New
Hebrides island arc lies the North Fiji Basin (Figure 4) where the presence
of shallow seismicity (Figure 5) fresh basalts little sedimentation
(Karig and Mammerickx 1972 Luyendyk et al 1974) and high values of
heat flow (Sclater End Menard 1967) indicate active tectonism The Vitiaz
Trench forms the northern boundary of the North Fiji Basin and represents
the site of an old subduction zone that existed before the modern New
Hebrides arc formed Subduction (of the Pacific Plate) ceased at the
Vitiaz Trench sometime in mid-Miocene (Falvey 1978) or earlier (Chase
12
NEW HEBRDES VOLCANIC TRENCH ARC CORIOLIS
SW 4 TROUGH NE 00Z_shy
- _shy 2
-vQ 100- DESCENDING
PLATE ~ ~SEISMICf
ZONE -Ishy
200shy
300 00 100 200
DISTANCE KM
Figure 6 A schematic cross secion showing the region where shallow and intermediate-depth earthquakes were recorded (inclined lines) and the inferred geometry of the descending plate beneath the southern New Hebrides arc The inferred geometry of the interplate thrust zone is partly based on the slip vectors (short solid lines) of the shallow thrust-type focal mechanisms The Moho discontinuity of the overriding plate estiated from refraction and gravity studies is also shown (Condert et a 1981)
13
1971 Mitchell and Warden 1971 Karig and Mammerickx 1972) and resumed at
the modern New Hebrides Trench with the opposite polarity (Indo-Australian
Plate underthrusting beneath the Pacific Plate) Deep earthquakes are
still recorded near Vanuatu that result from this episode of subduction
The New Hebrides arc has migrated away from the trend of the older Vitiaz
Trench to its present position (Hamburger 1986)
Geolc-ical Setting
The islands of Vanuatu are volcanic in origin with older islands
fringed or capped with reefal limestones In the central region of the
arc the single chain of islands gives way to a more complex structure
(Figure 7) (1) the eastern Miocene-Pliocene chain with tholeiitic and
calc-alkaline volcanoclastics includes the islands of Maewo Pentecost
Efate and parts of Epi (2) the slightly older western Oligocene-Miocene
chain includes the islands of Santo Malekula and the Torres and (3) the
central late Pliocene-Recent portion contains active aerial and subaerial
alkaline volcanics (Mitchell and Warden 1971) The volcanic rocks of the
western chain are similar to slightly more acidic composition than the
eastern chain Local outcrops of ultramafic rocks are found in several
places in the eastern chain
REGIONAL BACKGROUND INFORMATION
Historical Earthquakes in the Vanuatu Region
An accurate evaluation of the earthquake hazard for a particular
region includes a survey of historical seismicity in the region in
question Historical earthquakes are important because they help to better
determine the potential size frequency of occurrence and possible effects
of future earthquakes
14
170
Tinakula
xd
Torres Is e
Vat Gonoi
Vanua Lava
b Gauagp Merig
- --- -4
- --- Santo Moewo NOR TH
DENTRECASTEAUX FZ ===== Pentecost FIJI
-- tMae ku v Ambry m BASIN
-p -E
0 ioo 200 Km
o Erromang -A IWA
U) TANNA FUTUNA -A
~ANEITYUMOVOLCANIV ASSOCIATIONS 7 UPliacene- Recen- (Central Chain) UMiocene- L Pliocene
Effi (Eastern Belt) ~UOIlgocene - MMiocene
1plusmnZ (Western Belt) Di ofDip ofTune Matthow TECTONIC ELEMENTS selomic zoneHunter
1r~7Uplifted volcanic ridge
~B c- bsn Major fracture zone - -Bock -aorc basin NF -
Zone of flexuring Sedimentary basin and faulting
I I K KIRI
Figure 7 Geology of New Hebrides Arc (Carney and Macfarlane 1979)
15
The earliest reports of earthquakes in the Vanuatu region is a series
of earthquakes which began on 28 March 1875 and were felt on Anatom
(Mercalli intensity VIII-IX for the largest event) and Erromango and in the
Loyalty Islands of Lifou Mare and Ouvea (lida et al 1967) On 10
January 1878 a tsunamigenic earthquake associated with the eruption of
Yasowa Volcano Tanna was felt in Port Resolution Tanna Another strong
tsunamigenic earthquake occurred on 11 February 1878 associated with
another eruption of Yasowa Volcano
Since 1900 5 great earthquakes (Ms gt 7 34) and 52 major earthquakes
(7ltMs lt 7 34) have occurred along the arc (McCann 1980) However the
great earthquakes that occurred near the turn of the century are not
well-constrained in size or place and their magnitudes were probably overshy
estimated (due to the way in which the magnitudes were calculated)
Moderate-sized earthquakes are distributed throughout the arc (Figure 8C)
but the largest events are more clustered especially in the northern
portion of the arc (Figure 8B Marthelot 1983 and Figures 9A and 9B
McCann 1980) There is a distinct gap in the seismicity at the point
where the dEntrecasteau Ridge intersects the line of the trench
Because the occurrence of shallow earthquakes near population centers
are of greatest concern for earthquake hazard in this report we have
focussed on shallow earthquakes near the main islands of Santo Malekula
and Efate in the central portion of the arc Maps of shallow seismicity
(depth lt 70 km) of the region based on the US Geological Surveys
Preliminary Determination of Epicenters (PDE) catalog for the period
1961-1981 are shown in Figure 8B and 8C (from Marthelot 1983) This
with bewen70 and10 Kin sqars betee 10deth andK2N00Kin FriaguresMpete island)arceV00anuat (ail) hongnrhto the argha
std itriagebetween00 and 3e0vkn locte (1) the acnceaoneo largesxise of thereshlwents nthe trnhahrcal diappeanras i thetareshalwents nthe norheialof the arnhh ih thetarch thapconraspuato he acthe reanqig mapis ho the dstrutiorn oaf2thepuxaprton ofearcTive reanqiet regis inothe dsorutrnhaf2the
haviencanue largetthand5an3) earthquakeintermediate-depthofrnestshanppresencanue of intermediate-depth3 ctivitye
17
9 194 (74) s-AFTERSHOCK ZONE
ft 1 (827 _RECOMFUTED OR 2RECENT EVENT
1914 ) EPICENTER
1944(7) 0-FROM
GUTENBERG AND (73) RICHTER
1 7 bull__ EPICENTER FROM RICHTER
192 (7O)(21 ( i9 1945()2)
j50 21926 (71)150 01928(71)
1946(70) 1927 (71)
1903(75)
1944(73) 1925 (76) 2 18754
~ 1878
200 1920(80O 94943(72)
4875 1923(70) 1944(72)
70737 1z945 I941943(757372) shy
1904 (84)
1928(75) 1926(70)
1917 (71)
250 6 I 165 0E 1700 1750
Figure 9A Map showing locations of large (Ms gt 7) and great (Ms gt 7 34)historical earthquakes along the New Hebrides Trench for the time period1900 to 1950 (McCann 1980)
18
I I
Io 953 1963 (73 73)
1966(7473)
19617(70)
9195304) 20 I 1972 (71)
651965(70)197
7150 (7 7 2 1958 (72)
--- 1965 197(71)-
F7873s) od
19616 1 A
2 00 1950 (70727072)
ID
165degE deg170c 1750 Fig~ure 9B Map showing locations of large (Ms gt 7) and great (Ms gt 7 34)historical earthquakes along the New Hebrides Trench for the time period1950 to 1979 (McCann 1980)
19
figure illustrates the dense concentration of interplate events close to
and landward of the New Hebrides Trench
Very little information exits concerning the effects of strong
earthquakes prior to 1961 apart from a few sketchy damage reports The
location accuracy of earthquakes was improved in 1961 Before this time
locations were located to the nearest tenth of a degree and magnitudes were
considerably over-estimated The last major seismic episode of interplate
slippage in central Vanuatu occurred in a sequence of earthquakes in August
1965 (Figure 10) which accumulated a total seismic moment equivalent to a
single magnitude Ms - 77 event (Isacks et al 1981) The 1965 Santo
earthquakes caused significant damage to buildings wharves and bridges in
Luganville on Santo Island and major damage to buildings and water tanks in
Norsup and Sarmet on Malekula Island (Pr6vot and Chatelain 1983)
Coseismic tectonic uplifts on Malekula Island were also measured in
association with the 1965 earthquakes (Figure 10) Over 1 meter of uplift
was detected for the 1965 earthquake sequence (Taylor et al 1980)
Only one sequence of earthquakes has been relatively damaging since
the Cornell-ORSTOM network began operating in 1978 The Mere Lava
earthquake (Ms 61) occurred on 12 May 1980 at 14800S and 16782degE and a
depth of 23 km The worst damage from this event was caused by landslides
SUMMARY OF FACILITIES AND PROGRAMS
Critical Facilities
Port Vila with a population of 15088 in 1979 is the administrative
and commercial center of the country There are a number of multistory
buildings in the capital and most of Vanuatus tourist industry is located
2
1970
140- )O AN OCT
JAN 19731974 0 00-
MAY 0
0--- 1965
S 9000 97150K 15deg AU61973 NOVV
1974
600 x OCT
4 1971 AUG 01966
171965
160shydeg 1 - - 2000
Ms S73 -77
63 -67
0
0
58-62170 1- 1 -_0 1660 1670 E 1680
Figure10 August 1965 earthquake sequence (from Isacks et al 1981)
21
in and near Port Vila A large shipping wharf is located near the center
of the city on Vila Bay
Apart from Port Vila the only significant development in Vanuatu is
at Luganville on Santo Island (pop 5116 in 1979) It remains an
important economic center for the country with agricultural processing and
shipping facilities located there There are several three- and four-story
buildings in the center of Luganville
Earthquake Preparedness Programs
As of late 1983 the Government had requested the assistance of a
consultant from New Zealand to help provide uniform building codes for the
country The Public Works Department enforces New Zealand seismic zone B
codes to construction of public buildings Large buildings for the most
part are designed by overseas engineering firms and generally comply with
the earthquake design standards Smaller buildings are generally designed
close to the New Zealand loading specifications but there continues to be
great difficulty in supervising construction projects
There is no large-scale earthquake education program in Vanuatu
Materials have been prepared by ORSTOM seismologists for distribution to
teachers public officials and planners involved in earthquake hazards
(eg Prdvot and Chatelain 1983)
Seismological Facilities
Seismological observations are necessary to the accurate location
study and ultimate prediction of earthquakes Seismic stations were first
established in Vanuatu in the mid-1960s by the French Office de la
Recherche Scientifique et Technique Outre-Mer (ORSTOM) Staion PVC in
Port Vila has operated continuously from 1964 to the present while LUG in
22
1680 1700140 1660 1670 1690 deg 140
GAUAP FIJI
PLATEAU 0
deg ~ HOG MAEWO -15 150 AOBA
2000 SANTO AB
MAP PENTECOST
160 A MT AM8160A= A 13AMBRYM-16
DENTRECASTEAUX OJi= LMP EPIP1FRACTURE ZONE
170 EME 170 EMAINGOUNA
NGAoS L E_ EFATE
RTVDvpP 18o 0shy180 -
o -180 z 0
o ERROMANGO
190 - Rk90R-190
TAN AN~o 4 FUTUNA
AUSTRALIAN oshy0 0TANNA
200 PLATE ANATOM 0 200
0 0
1650 1660 1670 E 1680 1690 1700
Figure 11 Map showing the seismograph stations in Vanuatu Circles arestations telemetered to the base station PVC on Efate island andunderlined stations have two components--one horizontal and one vertical The triangles are older ORSTOM stations INH and LUG are no longeroperational Strong motion instruments are located at SWB and LMP onMalekula island DVP and PVC on Efate island and LUG on Santo island
Luganville Santo operated through 1980 A third station on Tanna Island
(INH) operated through 1978 Cornell University began cooperative field
programs with ORSTOM in 1975 with a microearthquake experiment on Santo
Island An ocean-bottom seismograph experiment was carried out in southern
Vanuatu in 1977 and in central Vanuatu in 1978 The Cornell-ORSTOM
telemetered seismic network was established in 1978 and has operated
continuously since that time The seismic network now includes 19
telemetered stations (Figure 11) to date over 20000 earthquakes have
been recorded by the network A permanent ORSTOM mission is now based in
Port Vila and takes primary responsibility for day-to-day maintenance of
the network The availability of continuous earthquake monitoring in
Vanuatu is an important component of any earthqi-ke or -arthquake hazard
study for the country Figure 12 shows the seismicity level (magnitudes gt
4) recorded by the Worldwide Seismograph Station Network (WWSSN) Compare
these results with the increased sensitivity (magnitude gt 25) and location
accuracy of the regional Cornell-ORSTOM network which is shown by better
definition of seismic zones in Figure 13 These network data clearly
define the heterogeneous distribution of seismic activity in the central
portion of the arc
These seismological facilities are complemented by studies of ground
deformation using seven bubble-level tiltmeters a two-component longshy
baseline water tube tiltmeters and two levelling arrays
Strong-Motion Accelerographs
As part of the present program of seismic hazard evaluation in
Vanuatu Cornell and ORSTOM have installed five strong-motion
accelerographs on the islands of Efate Malekula and Santo (Figure 11)
__
5 t~j24
0 - 70km
o0 a 0 70-150km 0 C J
5 S S - 0 0 shy
-150-300km
a 0 o 300-700km
0
15S 4 -
bull7 -06 ----
SS
bull bull S
bull iilIIle
Figure I9 1p 4D JE l o shybull =r-
5 NO a~ 40
20 1 a
~ ~- 20Smbull 5m
- S r S st
16 E5 170 E~
165EI bull =W
Figre 2 Epcenresde sesme lcasspa er ea onia de sttos-16-1) PDE ocaionsofvent (167-182) vtand 1983)-- ha-la
25
PROFONDEUR - DEPTH 0 - 70 Km
E
05 0
EE
03 4 3
0I
Figur 13Siete e ~se bulloai~pa le rieuOSO-ONEL(918)
00i
oA
Fi3r1N
a
0--
E iete e e Icls sp rl dspeuOR T M C R E L(9 8 1 8 )
26 These acce2erographs complement the other instruments being used to study the seismicity in the region The accelerographs record the ground accelerations at a particular site fiom an earthquake strong enough to trigger the instrument To date these instruments have already been triggered by five moderate-sized shallow events and will be used to provide a basis for prediction of local ground motion induced by large interplate earthquakes in Vanuatu The high level of seismicity along this plate boundary suggests that a valuable baseline of strong-motion data can be collected in a relatively short period of time
Related Research Programs
The seismology program is carried out in cooperation with the Vanuatu Department of Mines Geology and Rural Water Supplies They are responsible for regional geology studies resource assessment detailed mapping and hydrological activities In addition ORSTOMs geology and geophysics department based in New Caledonia carries out an extensive
program of investigations covering submarine morphology marine geology and geophysics island geology and crustal structure The US Geological Survey has undertaken a series of detailed marine studies in the central and northern portions of the island arc using the research vessel SP Lee (1982 and 19F4) A detailed hydrographic survey was carried out in coastal waters by Australian researchers A tide gauge is maintained by the ORSTOM
mission in Port Vila (Pr6vot and Chatelain 1983)
PREVIOUS STUDIES
Seismicity Studies Along the New Hebrides Arc
Seismicity studies of the New Hebrides Arc by Isacks et al (1981) found that major bathymetric and structural complexities divide the central
27 part of the arc into segments approximately 100 km long The segment near
Santo and northern Malekula islands ruptured during two complex sequences
of events occurring in August 1965 and in late December 1973 through early
January 1974 (Table 1) In contrast the segments near the southern part of Malekula and Efate islands may not have ruptured during the past 75
years Moreover between southern Malekula and Efate islands the
orientation of the horizontal compressive stress within the upper plate
changes from a direction perpendicular to the arc to a more complex and
variable pattern found in the southern portion of the arc
Since the Cornell-ORSTOM network was established in 1978 10 moderate
(58 lt Ms lt 7) earthquakes have occurred within the network (Table 2) A
description of the seismicity recorded by the network follows
(A) Fore- and Aftershock Sequences of the August 1979 and July 1981 Main
shocks
(1) 17 August 1979 Sequence Figures 14A and 14B show earthquakes in the foreshock sequence of the 17 August 1979 earthquake The spatial and
temporal development of this activity was described by Isacks et
al [1981] This section provides a more detailed analysis of a longer
period of time A small zone near the epicenter of the 17 August
earthquake was intermittently active during late June - early July 1979
(Figure 14A) The more immediate foreshock sequence (Figure 14B) started
eight days before the main shock and consisted of five groups of events
Each group of foreshocks began with an earthquake having a magnitude
between 42 and 49 and each was followed by a number of small
aftershocks The first foreshock cluster was located just landward of the
trench Each successive cluster migrated in time northeast toward the
Relocations with all available teleseismic and local data for 1978-1981events except 27 Jan 1979 [Bulletin of the International SeismologicalCentre (ISC) location] remaining locations based on local data only 2Ms surface-wave magnitude taken from Monthly Bulletins of the PreliminaryDetermination of Epicenters (PDE)3MO seismic moments reported by Chinn and Isacks [1982] or in Monthly
Bulletins of the PDE (1981-1985 events)
4Mw is calculated from M0 by Mw - (115) x (log(Mo)-161)
17
0 0 0
0CD 00 aVm01 83 0 0 0
00 0 00 3
0 00 0
000 0 0
167 E 168 0 E
169 167 E
168 0 0
169 167 E 0 1
168 169
Figure 14 (A) Early foreshocks of the 17 August 1979 main shock (shown as a filled square) that occurredat the end of June to the beginning of July 1979 Island contours and 6 km bathymetry are shown (B) Lateforeshock activity preceding the 17 August 1979 earthquake Foreshocks migrated from the trench toward thelocation of the main shock (C) Foreshocks preceding the 15 July 1981 earthquake 0o
31 epicenter of the main shock The foreshock sequence ended with a very
intense concentration of seismicity near the 17 August 1979 main shock
epicenter The final foreshock cluster began eight hours before the main
shock and continued until the region became seismically quiet three hours
before the main shock The main shock occurred at the northeastern end of
these clusters
The development of the aftershock activity in Figure 15 is shown for
two time intervals during the nine days following the main shock During
the first day the aftershocks were initially located close to the epicenter
of the mainshock and rapidly expanded towards the west At the end of this
day aftershocks occurred as far north as the site of the 26 August main
shock and as far south as about 181degS (Figure 15A) Most of the increase
in the aftershock area occurred during the first day as can be seen by
comparing Figures 15A and 15B To the north the expansion of the aftershy
shock zone stopped near the epicenter of the next main shock of the
sequence that occurred nine days later on 26 August In the south aftershy
shocks were located in the same zone defined by the early foreshocks (also
see Figures 18C and 18D)
(B) 26 August 1979 sequence The development of the 26 August
aftershock zone (Figure 16) shows very similar patterns to the development
of the 17 August aftershock zone The activity developed very rapidly
during the first two days following the main shock (26 -- 27 August)
Then as in the case of the 17 August aftershock sequence the cumulative
sequence occupied an area larger by a factor of 2 or 3 than the one
expected for an earthquake of such magnitude [Isacks et al 1981] The
main shock was located on the southern edge of the aftershock zone -- the
aftershock activity developed to the north east and west only while the
aftershock zone of the 17 August event was nearly inactive (Figures 16A
16B) By 27 August aftershocks were located as far north as the epicenter
of the future 15 July 1981 earthquake and as far west as the New Hebrides
32
17
oA B
00
00
18 - 0o - 0 0
0 0
00
167 E 168 169 167 E 168 169
Figure 15 Maps of epicenters showing the development of the 17 August1979 aftershock sequence Format as in Figure 14 (A) 12H59M 17 August1979 to 12H59M 18 August (B) 13HOOM 18 August to 11H46M 26 August(to just before the 26 August main shock)
17
180 0 ogI0
0 00 o0
CP 00 000
0
0 0 0 8V
0 00 0 0(0 0
0 0
C0 0
C 0
167 E 168 I0
159 167 E 168
0
169 167 E
e l 0
168
_o
169
Figure 16 Maps of epicenters showing the development of the 26 August 1979 aftershock sequence Formatas in Figure 14 (A) 11H47M 26 August 1979 to IIH47M 27 August (B) IIH48M 27 August to IIH47M4 September (C) 1lH47M 4 September to IIH47M 26 October 1979
34
trench The aftershock zone ends very abruptly to the north along a
sharply defined east - west trending line which passes close to the
epicenter of the 1 September 1978 earthquake (Figure 18A) After the first
two days the level of aftershock activity decreased rapidly During the
entire period from the main shock to 14 September the aftershock zone of
the 17 August earthquake remained relatively quiet (Figures 16A 16B)
From 15 September to about mid - October both the 17 August and the 26
August aftershock zones were reactivated (Figure 16C) although the level of
activity was much lower than that during the days immediately following
each of the main shocks During this later period some activity occurred
in the back-arc region Northeast of Efate Island a small intense cluster
occurred in 1979 followed by shallow events spread around Efate Island
(Figure 16C) The level of activity then decreased and by the end of
October was back to a more normal background level of seismicity in the
entire region
The two aftershock zones of the 17 and 26 August 1979 earthquakes are
contiguous with some overlap in the area between the two epicenters (Isacks
et al 1981 Chatelain et al 1986) Chatelain et al (1986) show tiat
this area plays a key role in the development of the seismicity in ne
Efate region
(3) The 15 July 1981 earthquake In contrast to the 17 August 1979
earthquake no outstanding foreshock activity occurred prior to the 15 July
event Small clusters occurred on 5-6 and 12 July (see Figure 14C) Both
clusters included few events although each started with a magnitude (mb)
50 earthquake The larger of the two occurred on 12 July near the pending
main shock epicenter In contrast to the 17 August 1979 case no unusual
35
concentration of activity was noticed in the epicentral region during the
months immediately preceding the main shock Possible long-term precursory
activity may be the clusters observed in March and June 1980 and are
discussed in the next section
Figure 17 illustrates several outstanding features of the aftershock
sequence of the 15 July earthquake First an intense zone of activity
develops during the first day and continues throughout the sequence (Figure
17A) This zone is coincident with the aftershock zone of the preceding 26
August 1979 event (compare Figures 17A and 16) The southern boundary of
this activity is quite sharp and coincides with the region between the two
August 1979 epicenters this again emphasizes the importance of the area of
the two 1979 epicenters The epicenter of the main shock is located on the
northern boundary of the region of intense activity
Second the aftershock activity expands in size during the succeeding
nine days primarily northwards [see also Chatelain et al 1983] To the
northwest significant activity develops within the oceanic plate beneath
the trench axis (Figure 17B) This activity is concentrated beneath the
ORSTOM seamount [see USGS map by Chase et al 1983] near 173degS and
1672degE During the second through the ninth days activity continues to
develop in the area west of Epi Island and south of Malekula Island (Figure
17B) while in the succeeding 50 days the area of southern Malekula is
activated with a remarkable cluster occurring beneath the southern coast
(Figure 17C) The region of southern Malekula and Epi has been notably
quiet for much of the period prior to the July 1981 earthquake Back-arc
activity is also notable with a cluster occurring on 29 July east of
16 06 A B deg
0
O0
0 0
0~
o
000
0 0
0
00
0o~$
S 0 08 S
16E0
167 E
1 - C
0 0
168
0
16
0--
0
169 16
t
E
4P0
16
168
_ _ _ _ _ _ _ _
167
16 1o6
0
E 0
o S 0O
0 0
66
o5
0 6
0 24 Ju
q-o
0
6
1G 8HOM(C) 240 in~~ ~~
08OM24 JulJul toto 075M Figur 14
M Setme 1981 ()0H5M1Juy11to0H5M16Jl()0HO16uyto 1515 Setmbr191
I shy37
9Mo 4 o
uy
ON
37
Efate and increased activity in the region of Ambrym and Epi islands
(Figure 17C)
The aftershocks of the 15 July 1981 event thus affected four distinct
regions (1) the former 26 August 1979 aftershock zone presumably on the
interplate boundary (2) a region of the suboceanic plate near the ORSTOM
seamount (3) the region between South Malekula and 172degS presumably also
part of the interplate boundary and (4) upper plate crust cast of Efate
Island The total area affected by this earthquake was about 10 times
larger than the area expected for the rupture zone of an earthquake with
magnitude of the July 1981 event [Chatelain et al 1983]
(B) Prominent Clusters
Aside from aftershocks of the August 1979 and July 1981 events the
Efate -Malekula region also experienced several remarkable earthquake
clusters Some of these have the characteristics of an aftershock
sequence with the initiating event having the largest magnitude (and
sometimes preceded by a few foreshocks) Others have characteristics
intermediate between an aftershock sequence and a swarm [Mogi 1963] where
there may be several dominant shocks within the sequence and a more
symmetric shape to temporal variation of the number of events per unit
time The clusters are shown together with the larger aftershock sequences
in the summary of seismicity presented in Figure 18 For clarity the
aftershocks of the August 1979 and July 1981 events are represented by the
first nine days of activity
(A) Clusters in the forearc region The first cluster recorded by the
local network occurred in late September and early October 1978 near the 1
38
September mainshock (Figure 18A) and can be considered as a late part of
the aftershock sequence of the 1 September event The location of this
cluster however is activated again in later clusters (December 1979
August 1983 and April 1984) Figure 18A shows the next significant
activity in the region a cluster of earthquakes in December 1978 located
west of the August 1979 aftershock zone beneath the New Hebrides trench
The region was then fairly quiet until March 1979 when an intense cluster
of earthquakes occurred over a period of five days (Figure 18B) Activity
in the same area resumed again in April 1979 for a period of two days The
most active parts of both clusters are located at the same place which
defines an east - west trending zone located near the epicenter of the 26
August 1979 event and at the junction of the 17 August and 26 August
aftershock zones
After the August 1979 shocks three clusters occurred in December
1979 March 1980 and June 1980 (Figure 18G and 18H) near the epicenter of
the 1 September 1978 main shock (and also near the mid September 1978
cluster noted above) This location is on the eastern edge of the future
1981 aftershock zone The three clusters also tended to migrate toward the
July 1981 main shock epicenter (Figure 18G) A smaller cluster occurred in
August 1980 beneath Malekula Island (not shown on Figures) Actually the
entire region was rather quiet during 1980 The three 1980 clusters were
relatively small
In February 1981 a cluster of earthqukes occurred just west of the
location of the March -April 1979 clusters between those clusters and the
location of the December 1979 cluster (Figure 18H and 181) This location
39
Figure 18 Maps of epicenters in aftershock zones and clusters located bythe Cornell-ORSTOM network shown sequentially in time Epicenters of main shocks are shown by filled squares In each successive frame the next cluster overlays the preceding one for comparison Only successive clusters are shown in each frame All the activity recorded for the periods chosen is plotted Ten days of aftershock activity are shown for the August 1979 and July 1981 earthquakes
(A) 1 September 1978 main shock with September-October 1978 cluster (open circles) and December 1978 cluster (open squares)
(B) 27 January 1979 mainshock (no aftershock activity) with clusters of March-April 1979 (filled circles)
(C) Foreshock sequence for 17 August 1979 (open circles) (D) 17 August 1979 mainshock and aftershok sequence (filled circles)(E) 26 August 1979 mainshock and afters]ock sequence (open circles)
back-arc activity in September 1979 (crosses) (F) Cluster in December 1979 (filled circles) (G) Clusters in March 1980 (open circles) June 1980 (open squares) and
February 1980 on Efate island (plus signs) (H) Cluster in February 1981 (filled circles) (I) 15 July 1981 foreshocks (open circles) and June 1981 back-arc cluster
(plus signs) (J) 15 July 1981 aftershock sequence (filled circles) and back-arc activity
during July 1981 (plus signs) (K) Clusters in September-October 1981 (open circles) and activity on Efate
island in December 1981 (plus signs) (L) 12 March 1983 earthquake and aftershock sequence (filled circles) (M) Cluster in June 1983 (open circles) (N) 3 August and 5 August 1983 events and aftershock sequence (filled
circles) (0) Clusters in April 1984 (open circles) and in the back-arc near Epi
Island in March 1984 (plus signL) (P) Cluster in October 1984 (filled circles) (Q) Clusters in February 1984 (open circles) and April 1984 (open squares) (R) 3 July 1985 aftershock sequence (filled circles)
17
deg A B c
o 0W
0
03
0
00
(0C
0
00
00
0cn9
0
13g
0
o
000
o
0 000
0 0
0
0o 0
0 o 0S
(So
0
0
17
17 sclo
deg D c
p 0 0-
F
O 0 0 1800
O00 0
000
0 0 00 0
0 +
167 E 168 1690 167 E0 0
168 169 167 E 00
168 169
0 0
17
S
18
a I
0deg0Ck G
06+04
13 degp
~ - Ho
-to+00 0 o0o0o
0+1
I
0 0 +
18-
0
0O
A- V
J
+
- 00 B +o
K0 00 o0
L 0
0
0~
+
17 0
0
0j AbullB
0
0 0 0
0
0e
0 06
0 000
0
g oo
000
0+ 0olo
9
00
f 000
00 eFo 0 Q000
01
0 0
0 o00 1 0
o 0
1 7 E1 8116767E 168 169 167 E 168 169
I-0
16
7
0 o k3 ~
00
00
0 0
o 00
_o-I -
00 0 0
0 00
0
00
17s IP
0
00 00
13
01
0
0
00
000 0shy18
1868
CP 0 0t
00
169 167o
8
0
00
00
3
17E168 169 167 E 168 0 0 169 167 E 168 169
43
is part of the overlapping aftershock zones of the August 1979 events and
is also at the southern limit of the 15 July 1981 aftershock zone
The clusters thus have a very close spatial relationship to the
aftershock zones of the main shocks They occurred near the boundaries of
the aftershock zones and appear to be related to features delimiting or
defining the spatial development of the aftershock zones (see also
Chatelain et al 1986)
From February 1981 until August 1982 except for the aftershock
sequence of the July 1981 earthquake not a single fore arc cluster was
detected in the Efate Malekula region- Starting in September 1982
clusters began to occur around the former July 1981 immediate aftershock
zone In September and October 1982 four clusters occurred south of and
beneath Malekula Island (Figure 18K) Besides the aftershocks of the 15
July 1981 earthquake the September - October 1982 clusters were the most
prominent activity in the Malekula region during the entire 1978-1984
period These clusters did not occur at random places The first one was
located beneath Malekula Island at the site of the previous cluster in
1980 The second cluster is lcated southwest of Epi Island in an area
which experienced significanc activity during the aftershock sequence of
the 15 July 1981 earthquake (compare Figure 17C and 18L) The third
cluster shows a very linear pattern trending southwest - northeast right
along the extension of the northern edge of the 15 July aftershock zone
The fourth cluster then occurred beneath southern Malekula Island
In March and June 1983 two clusters occurred in the southern part of
the Efate zone The March 1983 cluster (Figure 18L and 18M) occurred near
the January 1979 epicenter and comprised a relatively small aftershock
44
sequence of a magnitude (Ms) 58 earthquake The June 1983 cluster
occurred just south of the July 1981 aftershock zone (Figure 18M and 18N)
This cluster affected the same zone which had already been affected by both
foreshocks and aftershocks of the 17 August 1979 mainshock Most of the
cluster occurred after a magnitude (mb) 54 shock which was the largest
event in the cluster The cluster thus has the charactistics of an
aftershock sequence but one with an abnormally large area for the main
shock magnitude The main shock was also preceded by a small foreshock
sequence that started a day before and stopped six hours before the main
shock
In August 1983 a dense cluster following a Ms - 56 and a Ms - 57
event occurred northwest of Efate Island (Figure 18N and 180) The latest
cluster recorded in the region occurred in April 1984 again activating the
same zone (Figure 180)
(2) Clusters in the back-arc region Although the back-arc region is
usually relatively aseismic there were clusters of earthquakes located
east of Efate Island and beneath Efate Island itself The clusters were
shallow and located in the island arc crust The areas affected were much
smaller than those in the forearc clusters Three of the clusters occurred
just before or after the August 1979 and July 1981 main shocks (Figures
18E 18F 181 and 18J) The August 1979 event was followed in September
1979 by a cluster east of Efate and in February 1980 beneath Efate The
July 1981 main shock was preceded in June - July 1981 by a swarm occurring
just south of the cluster following the August 1979 events Another
cluster occurred shortly after the July 1981 event at the same place The
July 1981 main shock was also followed by a swarm on Efate Island at about
45
the same place as the one following the August 1979 earthquakes No
clusters have been located in the Efate back-arc region from December 1981
when the last swarm occurred on Efate Island up to the most recent data
available October 1984 thus giving support to the close temporal
relationship between these clusters and the 1978 - 1983 sequence (see also
Chatelain et al 1986) In December 1980 a larger cluster occurred
farther east near the Coriolis trough (not shown on figures) The only
other back-arc activity occurred in March 1984 farther north just south of
Epi Island (Figure 180)
(3) Summary of Results from the Cornell-ORSTOM Network Investigation
of the patterns of seismicity associated with the earthquakes which have
occurred within the Cornell-ORSTOM network has shown that (1) not all
medium to large size events are associated with foreshock activity (2)
long term precursory activity sometimes occurs but not with enough
consistency to use in forecasting an impending event and (3) some zones
are activated before and after the main shocks without defining any clear
cycle (Chatelain et al in press) These earthquakes and their associated
seismicity suggest that specific features along the interplate zone
produced by the interaction of structures in the overriding and subducted
plates appear to control the seismicity in the Efate region (Chatelain et
al in press Isacks et al 1981)
Seismic Potential Studies Along the New Hebrides Arc
The earthquake hazard from the interplate zone is generally high
because of the rate of relative motion of the two plates (approximately 11
cmyr) and the stick-slip nature of the boundary However in addition to
large to great earthquakes along the plate interface moderate to large
46
magnitude events can occur within either plate and cause considerable
damage locally
One approach to determining the seismic potential of a region is to
identify a seismic gap or portion of an arc that has not produced a large
earthquake for some period of time The identification of a seismic gap
does not mean that a large earthquake will necessarily occur in a given
region because not all gaps will produce large earthquakes The gap may
indicate that (1) the section of the plate boundary is locked stress is
accumulating along the interface and will be the site of a future
earthquake or (2) the relative plate motion is being accommodated by
continuous slippage (aseismic creep andor by slip during small and
moderate events) such that sufficient stress to generate large earthquakes
along that section of the plate boundary does not accummulate Historical
information regarding the occurrence of earthquakes in a particular region
and regional tectonic constraints are necessary to clarify which of these
two possibilities is valid for the region in question In many cases
however the historical record may be incomplete or too short to accurately
determine which option is correct
Evaluation of the recurrence history of a particular region can be
investigated using (1) Teleseismically recorded earthquakes (2)
recurrence relations of smaller earthquakes recorded by seismograph
networks (3) pre-instrumental historical records of large earthquakes and
(4) evidence of prehistoric and historic large earthquakes observable in
the geological record Recurrence relations may help determine return
periods for certain sizes of earthquakes Recurrence intervals are
dependent upon the observations of seismograph networks and-are incomplete
47
since the period of record keeping is short compared to the time necessary
to develop these relationships Indirect evidence of large earthquakes can
sometimes be found in the geologic record in the form of uplift rates and
used to address the problem of recurrence intervals However information
obtained from the geologic record is necessarily limited in accurracy
McCann (1980) has divided the New Hebrides arc into different zones
and assigned values of seismic potential to these zones (Figure 19) based
on his study of historical and instrumental seismicity He has assigned 6
different divisions based on his study of the historical record (1) site
of a great (Ms 7 34) earthquake more than 100 years ago (2) site of a
great earthquake within the past 100 years but more than 30 years (before
1978) (3) incomplete historical record but indication that the region may
have the potential for a large earthquake (4) plate motion is subparallel
to the arc (5) no historical record of a great earthquake and the region
may not have the potential for one and (6) site of a large earthquake
within the past 30 years and presumably the lowest seismic potential
Marthelot (1983) used PDE data to determine some general segmentations
in the seismicity of the New Hebrides arc and the patterns of seismic
activity that characterize these segments (Figure 20) Marthelot (1983)
found that coupled interplate large (Ms lt 79) thrust earthquakes which
are preceded by intense activity dominate the northern end of the New
Hebrides arc near the Santa Cruz islands (between IIdegS and 13degS) Moderate
(Ms lt 72) thrust events concentrate between 13degS and 14degS Coupled
moderate (Ms lt 75) interplate thrust earthquakes occur near Santo and
northern Malekula islands (14degS to 165degS) The southern end of Malekula
and slightly south (165 0S to 1750S) exhibit coupled interplate thrust
48
14 S
2
19
24 I 165 E 170
Figure 19 McCanns seismic potential for New Hebrides island arc (McCann1980 See text for discussion of numbers
____
49
1650 1650 2 6 63 - 41 100
0 COUPLED INTER-INTRAPLATE THRUST
7467 e34 34
w
= EVENTS PRECEDED
BY INTENSE 24
AACTIVITY U I 44 CONCENTRATION
OF THRUST EVENTS
64-72 21O210
3
COUPLED 2061 73 0 _00
s INTERPLATE - 0 0C w THRUST EVENTS 78
PRECEDED BY 45t58C-150
DONUT PATTERNS 16 46 I S
81 03Q STEADY HIGH RATE L2 062 501 4 4
02ONLY ONE THRUST EVENT 61 025 INTRAPLATE200 ACTIVITY A 43
81 _0 2 O V CLUSTERS OF 72 73
RECURRING 76 150Q20 THRUST EVENTS 200
SLOW EXPANSION 4 OI01
OF ACTIVITY 8I 80 26 43 IN 198081- 13Do NO PRECURSORY
PATTERN 0 66 26
170 0 E 1720 170 0E 1720
Figure 20 Summary of the characteristics of the distribution of shallow earthquakes along the New Hebrides island arc The dashed line representsthe axis of the trench The trench disappears in the central part of the arc Horizontal lin separate regions characterized by distinct seismicity patterns Middle figure shows years of occurrence of large(Ms gt 70) and moderate-sized events (ms gt 60) 1961-1981 Right figureshows the large earthquakes that occurred from 1900 through 1960 (Marthelot and Isacks 1984)
50 earthquakes that are not quite as large (Ms lt 72) The zone west of Efate
(175degS to 18degS) exhibits a steady high rate of seismicity with magnitudes
(Ms ) less than or equal to 72 Between 18degS and 20degS intraplate activity
(Ms lt 72) dominates South of Anatom (eg south of 20degS) the seismicity
is characterized by clusters of recurring thrust events that do not exhibit
any precursory activity
In another study utilizing the PDE data set Wyss et al (1983) and
Habermann (1984) have used the shallow New Hebrides seismicity in order to
(1) identify areas of higher and lower strength within the plate interface
which might control the rupture length of future earthquakes and (2) test
for changes in the rate of seismicity prior to large earthquakes using a
statistical procedure The trend toward low stress drops in the central
portion of the arc near the intersection of the dEntrecasteaux Fracture
Zone with the New Hebride Trench is consistent with other studies which
indicate that this region is anomalous However a region of high or low
strength does not indicate anything about the nature of the region and
these regions do not help pinpoint when a large destructive earthquake
will occur within or near them
ASSESSMENT OF EARTHQUAKE HAZARD
Seismotectonic Provinces
We propose the following seismotectonic provinces and the maximum
probable (but not absolute) sizes of earthquakes be considered for the
subregions within Vanuatu when considering a design earthquake for these
regions (Figure 21) These provinces are based on the instrumental history
of earthquakes near Vanuatu The northern end of the New Hebrides Trench
is a complex zone of deformation where the interplate motion is changing
51
M612
13
S 0 0
18
231 165 E 170
Figure21 Earthquake potential for Vanuatu
--
--
52 from thrusting in the southern portion to mostly strike-slip motion in the
northern portion and has the potential for great (Ms 8) earthquakes The
central portion of the New Hebrides Trench here called the Santo
Malekula segment exhibits characteristics different from the rest of the
arc as the result of the dEntrecasteaux ridge interaction and has the
potential for Ms 7 34 earthquakes The southern end of the New Hebrides
Trench here called the Efate Tanna segment may have the potential for
Ms 8 earthquakes The extreme southern end of the New Hebrides Trench is
another complex zone where the interplate motion is changing from thrusting
in the north to strike-slip motion in the south and may be limited to
infrequent moderate (M 7 12) earthquakes Other sources of seismicity
include back-arc spreading east of the New Hebrides Trench (Ms 7 12) and
diffuse shallow activity along the Hazel-Holme Ridge (Ms 7) in the North
Fiji Basin (Ms 6 12)
One method for estimating the maximum possible magnitude earthquake in
a region is to look at the amount of deformation that has accumulated from
past earthquakes The deformation is assumed to be proportional to the
square root of the energy released by a powerful earthquake The energy
(E in joules) of each earthquake can be calculated from its magnitude (Ms)
using a formula developed for the region Pr~vot and Chatelain (1983) have
used the formula
Log E - 48 + (15 x Ms)
to calculate the amount of energy which has been released since 1965 in the
central portion of the arc (Figure 22) The calculated values tend to fall
within a range of values which can be bounded by two parallel lines since
deformation occurs more or less uniformly in time The maximum possible
E1 2 106 600 (joules )
500
400
300
200
136 shy
100
65 70 75 80 82 ANNEES - YEARS
Figure 22 Seismic energy release along the New Hebrides Arc since 1965 (Chatelain and Pr~vot 1983)
54
magnitude earthquake calculated by this method is Ms - 76 Prdvot and
Chatelain (1984) computed a similar result using all of the earthquakes
which have occurred since 1900
Ground Motion
Once the location and magnitude of potential earthquakes have been
determined for a region the next step is to determine the characteristics
of the ground shaking at a particular site This accomplished by the
condsideration of such quantities as earthquake source mechanism
epicentral distance and geometry and physical properties of the geologic
structures located between the source and the site
Strong-motion records provide one measure of site response To date
a relatively large number of strong-motion records have been generated in
the far-field of large earthquakes especially in California and Japan In
contrast relatively few near-field records of moderate and large shocks
have been recorded in island arcs These few have shown large scatter with
unpredictable results The 3 March 1985 Chilean and 19 September 1985
Mexican earthquakes constitute the most important exceptions and are
invaluable additions to the library of strong motion data for subduction
zones Nor-theless these two events do not constitute a databank of
information especially for intraoceanic tectonic settings such as Vanuatu
A major difficulty arises in trying to translate past earthquake size
(intensity values) which are based on cultural effects or magnitudes
derived from widely varying instrumental parameters into values of ground
motion The development of earthquake resistant design is usually based on
intensity of ground motion at a particular site The most widely applied
standard of comparison for strong motion data is the peak ground
55
accelereation (PGA) Figure 23 shows a general relationship between peak
acceleration and distance from hypocenter which has been derived from
worldwide earthquake data Some earthquakes generate relatively high
single peaks of ground accleration which represent little ground energy
Therefore on an absolute basis the use of PGA can be misleading for
smaller events
Peak ground accelerations are easily obtained from accelerogram
records however most historical information consists of earthquake
intensities Numerous relationships between ground acceleration and
Modified Mercalli intensities have been developed (Table 3) Two of these
proposed relationships are shown in Figure 24 For worldwide data Murphy
and OBrien (1977) have computed statistical correlations between Modified
Mercalli intensity values and ground accelerations (horizontal and
vertical) Theresultant relationships and the geometrical standard
deviation (s) are
log Av - 028 Imm - 040 s - 253
log Ah - 024 Imm- 026 s - 219
where -Av peak vertical ground acceleration
Ah - peak horizontal ground acceleration
Imm - Modified Mercalli intensity
Using the relationship of earthquake intensity to distance and size of
Fiji earthquakes Everingham (1984) has produced a plot for the Fiji region
(Figure 25) Although these results are for a nearby region they give a
general indication of what might be expected for Vanuatu Figure 26
(Prdvot and Chatelain 1983) shows the recurrence of Modified Mercalli
intensities per number of earthquakes
56
1000 1 I l I I eO58 M(R 5 -X A= 1320 e R+25)152
5
MEAN + a =2N01 - STANDARD 2-
oe DEVIATIONbullbull- ~0 MEAN + 2
tbull 0o - STANDARD - oo o DEVIATIONS Jf E N o 0
LU0
U 01 0_ o o 0-oo n 00 bull
L) em a00
- MEAN - shy - 4ra 00 L 0 W STANDARD 0-~DEVIATIONWL 000 to
0 ME N -2 1 STANDARDUx 0
DEVIATIONS
101- 10 - 000
D N O oENTE K - 1 so-
10 100 1000
DISTANCE FFROM HYPOCENTEFR IN KILOMETEFRS
Figure 23 Acceleration-attenuation relations derived from worldwide earthquakes (Hays 1980)
57
Table 3 Characteristics of the data samples used in selected studies of the correlation of ModifiedMercalli intensity and peak ground acceleration (modified fom OBrien et al 1977)
Number and Range of location Number Modified Mercalli Distance Acceleration
Study of earthquakes of recordings intensity
Gutenberg and 61 Western 167 n-VIII Richter 1942 United States 1956
Neumann 1954 10 do
Hershberger 1956 60 do Coulter Waldron dodo
and Devine (Not based 1973 entirely on
observed data)
Trifunac and 57 do Brady 1975c
10 V-VIII
108 J-Vil IV-X
187 IV-X
range (kin) range (cms2)
3-450 1-300
Averages of 40-300 25 and 160 (distance dependent) - 1-300 Short distance 6-3000
(Dependent on site geology and local amplification)
Figure 24 Proposed relationships between earth quake intensities and peack accelerations
59
DEPTH 20KM
7shy
6- 6 0
075 502
61 h0
DISTANCE KM
Figure 25 Modified Mercalli earthquake intensities observed in Fiji as a function of magnitude and epicentral distance (Everingham 1984)
60
10
0
5CI I-C)
0i
0
o
01 a)o
PORTVILA = SANTO
00
E
0212
000
E
z
Degres Mercali _ Mercalli degrees
Fiue-2 Frequency of Modified Mercalli earthquake intensities felt in Port Vila and Santo (Chatelain and Prfivot 1983)
61
Tectonic Uplift
Studies of longer term island uplift on Santo and Malekula as
evidenced by the uplift of coral reefs have related segmentation of these
islands to features of the subducting topography of the dEntrecasteaux
fracture zone (Taylor et al 1980) The proximity of these two islands to
the main interplate thrust zone and the growth of the coral reef terraces
around the islands has resulted in preservation of long-term deformation
Taylor et al (1980) have studied late Quaternary coral reefs that have
been uplifted on Santo and Malekula islands They identified four main
blocks based on long-term tilt differences (Figure 27) The rupture zones
of the 1965 and 1973-1974 earthquake sequences correlate to the tectonic
discontinuities in the Santo -- Malekula region Taylor et al (1980)
studied the uplift of coral terraces on Malekula over a period of three
years (976 1177 and 779) and found that just over 1 meter of uplift
had occurred in the northern part of the island as a resalt of the 1965
earthquake (Figure 28 Table 4)
Tsunamis in Vanuatu
Tsunamis (seismic sea waves) are caused by displacements in submarine
topography that are induced by earthquakes andor volcanic activity
occurring below or near the floor of the ocean Low-lying areas near the
shore are particularly vulnerable to damage by these waves The shallow
seismic zones of the Southwest Pacific have a history of earthquakeshy
generated tsunamis (Figure 29) A few tsunamis have originated in the
Vanuatu region A tsunami was produced by the first earthquake of the
March 1875 sequence (Iida et al 1967) The earliest known significant
one was the 10 January 1878 earthquake which produced a large tsunami
62
1167030E
AK-A 150 30 S
Tasmaloum Arkialo
NORTH MALEKULA
X Direction of tilt inferred from reef terraces 16000S
Tilt discontinuity
Pliocene and Quaternary shy sedimentary rocks mostly
coral limestone
r Pre-Pliocene sedimentaryand igneous rocks SOUTH
MALEKULA
160305
Figure 27 Tectonic uplift associated with the 1965 Santo earthquakes (Taylor et al 1980)
63
Contour Interval =02 m 02--- 04 - hp
0-6- shy08 xx16 000Sshy
08 9
06
02 i
00
160 30S a
167 0 00E 167 030E
Figure 28 Measurements (meters) of 1965 uplift made in September 1976November 1977 and July 1979 The letters on the figure represent the places and amounts of uplift given in Table 2 The contours of uplift(contour interval - 02 ) represent one of the simplest interpretations of the uplift pattern consistent with the measurements (Taylor et al 1980)
64
TABLE 4 Uplift Measured Along the Coast of Northern Malekula
Year Number ofStation Place Name Measured Measurements a Southwest Bay 1977 observationb Bamboo Bay 1977 observation c Dixon Reef 1977 Id Lambubu Bay 1976 15 e West Bay 1976 5f Horrok 1976 Ig Brenwe 1976 4h Liwout Point 1976 1979 50i East Leviamp 1976 4j West Leviamp 1976 6k Elephant Point 1976 17I Win 1979 24 m Wihet Bay 1979 23 n Rambak 1979 30 o Npennanavet 1976 10P Matanvat 1976 4 q Potovrou 1977 1 r Atchin Island 1977 observations Wala Island 1977 observation t Norsup 1977 I u Lamp 1977 observation
Insufficient measurements for a standard deviation to be useful
Figure 29 Tsunami history of the Southwest Pacific Filled circles indicate locations of tsunaznigenic events dashed circles indicate inferred locations of tsunamigenic events
66
(12-17 m lida et al 1967) and 6 meters of uplift of the harbor at Port
Resolution (Warden and Mitchell 1974) Other earthquake generated
tsunamis have occurred in 1961 1965 and 2 in 1967 (lida et al 1967)
While major Pacific-wide tsunamis such as those generated along the South
American or Alaskan plate margins apparently do not affect Vanuatu
significant local tsunamis may be generated by large shallow earthquakes
occurring within the region
Volcanic Eruptions in Vanuatu
Volcanic activity is concentrated in the central belt of the Vanuatu
island arc Much of the present activity is confined to solfataric
eruptions however explosive eruptions are known (eg the 1878 Yasowa
eruptions)
In general the potential effects of a volcanic eruption on the
inhabitants of the islands of Vanuatu are small except for those people
who are living in the immediate vicinity of an active volcano However
evacuation of inhabited volcanic islands may be necessary in larger
eruptions Even distant volcanic eruptions such as those at Home Reef in
the Kingdom of Tonga during March 1984 produced large quantities of pumice
some of which rafted across large portions of the Southwest Pacific The
floating pumice interfered with shipping throughout the Southwest Pacific
region (SEAN Bull 1984)
IMPLICATIONS FOR MITIGATION OF EARTHQUAKE RISK
Several significant steps may be taken that will significantly
mitigate the loss of life and property from future earthquakes in Vanuatu
The following five steps provide suggestions for mitigation of the
earthquake risk
67
Earthquake Education
First an earthquake education program such as that adopted in Fiji
or Papua New Guinea is strongly recommended At minimal cost to the
Government such a program may be mounted through the schools Red Cross
programs and through the news media In other countries earthquake
education programs have taught simple methods of strengthening house
construction and minimizing hazardous conditions within the home they
have warned of tsunami hazards to coastal dwellers they have instructed on
proper behavior during an earthquake they have helped to encourage storage
of emergency food water and equipment in many households and
importantly they have helped avoid panic during an earthquake and
stimulated cooperation with government officials following such a disaster
Earthquake education programs are effectively combined with other disaster
preparedness programs (eg cyclones floods and so on) An example of
educational materials prepared by the Fiji Mineral Resou-ces Department is
included in Appendix IV
A few simple measures can be taken to reduce the likelihood of damage
to personal property A system of baffles in water reservoirs can reduce
the chances of seiches being set up in the tanks and the ultimate collapse
of the towex if the motion is large enough Large heavy objects should
not be put in high places where they can be easily dislodged unless they
are anchored in place This would apply to things like stereo speakers and
other objects that might be on shelves Products on shelves in stores and
books in offices can be restrained with wire retainers along fronts of
shelves Heavy objects that could tip over (such as hot water heaters and
gas tanks) can be fastened with anchoring bands This is especially a
68
concern with gas tanks which could fall over rupture lines and result in
fire
Building Codes
Second adoption of building codes for Vanuatu is imperative There
is a real danger of a large earthquake occurring very close to Port Vila or
Luganville In general the adequacy of construction is a major factor
controlling the damage and loss of life brought on by such an earthquake
Building codes designed for areas of similar earthquake hazard such as New
Zealand Code A California Building Codes or Papua New Guinea Codes 1 or
2 would be appropriate for Vanuatu Observation of such codes is most
crucial for public multistory buildings in the major towns of Port Vila
Efate and Luganville Santo As important as the design of such buildings
are the construction methods and guality of construction material used to
implement building design Careful monitoring of construction by competent
engineers is important for critical facilities The traditional houses
have kept down past losses of life and property but increasing population
and rapid urbanization can result in higher potential damage if
earthquake-resistant designs are not implemented One of the primary
reasons for property damage resulting from the Mere Lava earthquakes was
related to the siting of newer homes Houses located on steep slopes
suffered damage when they were not situated on competent substrate (Figure
30) The shaking of the fill and loose soils by the earthquakes caused
unconsolidated materials to shift under the foundations
Emergency Civil Defense Procedures
Third development of specific Civil Defense plans for emergency
procedures following an earthquake or tsunami should be initiated Of
69 a ) Poorly - situated house
and terrace e
house built too far over slope Rear
0 R
near cutting vertical and too backwall of house
bull e
b ) Earthquake- induced slope movements
-7 Rear cutting collapses pushingForward terrace edge - house orward
subsidesunder mining huefrad house foundation shy
Landslippage here
c) Well- situated house and terrace Good distancebetween house and
Good between
distance house
cutting
ond sopr I Rear cutting slope back and planted with natural vegetation
Figure 30 Sche7atic representation of causes of damage to poorly sited houses and suggestions for future house contruction in areas of loosely consolidated soil
70 course earthquake preparedness plans have much in common with hurricane or
other natural disaster planning but specific effects of earthquake
occurrence must be considered structural damage to multistory buildings
interruption of water supply disruption of electrical and gas lines
secondary geological effects such as ground liquefaction or landslides in
the near-source region complicating effects of aftershocks in the days and
weeks following a major earthquake The primary structure for such civil
defence plans already is in place in Tonga Programs specific to the
earthquake hazard may be added following similar programs in Fiji Papua
New Guinea and New Zealand
Long-term Seismicity Observations
Fourth long-term seismicity and strong motion observations should be
continued In the long-term such information will help to refine
estimates of seismic potential along the New Hebrides plate boundary they
will help to more directly and accurately assess the ground motion
parameters of direct concern to engineers for building design in
Vanuatu--ground acceleration frequency spectra horizontal and vertical
components of ground motion local amplification effects and so on
Furthermore seismicity patterns may provide a key to long-term forecasting
and short-term prediction of the location and size of future earthquakes
that may affect Vanuatus population
Internationa Cooperation
Fifth international cooperation among the island countries of the
Southwest Pacific and foreign agencies (eg US Geological Survey
ORSTOM etc) may significantly help in Vanuatus earthquake preparedness
program All of the countries affected by earthquakes (Vanuatu Western
71
Samoa Fiji Tonga Solomon Islands Papua New Guinea and New Zealand)
have to varying degrees developed earthquake preparedness programs
Vanuatu may take advantage of the previous current and any future efforts
of the other countries in the region
72-76
References
Atkin R J (1968) On volcanoes in the New Hebrides and Banks Islands Quarterly J of the Geologvical Society of London 24 305-307
Calder N 1972 The Rescless Earth A Report on the New Geology The Viking Press New York N Y
Carney J N and A Macfarlane (1979) Geology of Tanna AneityumFutuna and Aniwa New Hebrides Geological Survey Regional Report 71 pp Carney J N and R Campillo (1980) An investigation into damage causedby seismic activity on Mere Lava during May 1980 Geological Survey DeptOf Vanuatu Report
Chase C G (1971) Tectonic history of the Fiji Plateau Geol Doc Amer Bull 82 3087-3110
Chase T E B A Seekins J Daniel and J Y Collot (1983)Topography of the Vanuatu region map US Geological Survey Alexandria VA
Chatelain J L R K Cardwell and B L Isacks (1983) Expansion ofthe aftershock zone following the Vanuatu (New Hebrides) earthquake on 15July 1981 Geophys Res Lett 10 385-388
Chatelain J L B L Isacks R K Cardwell R Pr6vot and M Bevis (inpress) Patterns of seismicity associated with asperities in the centralNew Hebrides Island Arc J Geophys ResChinn D S (1982) Accurate source deths and focal mechanisms ofshallow earthquakes in western South America and in the New Hebrides island arc PhD Thesis Cornell University Ithaca NY
Chinn D S and B L Isacks (1983) Accurate source depths and focalmechanisms of shallow earthquakes in western South America and in the NewHebrides island arc Tectonics 2 529-563
Chiu J-M (1982) Structural features of subduction zone determined bydetailed analysis of short period seismic waves from earthquakes recordedin the New Hebrides island arc PhD Thesis Cornell University
Collot J Y J Daniel and R V Burne (1985) Recent tectonicsassociated with the subductioncollisioi of the DEntrecasteaux zone in thecentral New Hebrides Tectonophys 112 325-356
Coudert E B L Isacks M Barazangi R Louat R Cardwell A Chen JDubois G Latham and B Pontoise (1981) Spatial distribution andmechanisms of earthquakes in the southern New Hebrides arc from atemporary land and ocean bottom seismic network and from worldwide observations J Geophys Res 86 5905-5925
77
Dubois J J Lauray J Recy and J Marshall (1977) New Hebrides trench Subduction rate from associated lithospheric bulge Canadian J Earth Sci 14 250-255
Ebel J E (1980) Source processes of the 1965 New Hebrides Islands earthquakes inferred from teleseismic waveforms Geophys J Royal Astron Soc 63 381-403
Everingham I B (1984) Provisional list of felt earthquakes reports in Fiji 1941-1981 Min Resources Dept Fiji Note BP 338 17 pp
Falvey D A (1978) Analysis of paleomagnetic data from New Hebrides Bull Austr Explor Geophys 9 117-123
Geological Map of the New Hebrides Condominium scale 11000000 (1975)Ministry of Overseas Development (Directorate of Overseas Surveys) DOS 1196 British Residency Port Vila New Hebrides
Gilpin L M A L Bloom B L Isacks and M Bevis F W Taylor and C Jouannic (1982) Late Pleistocene coral reef terraces as tiltmeters on Santo Island Vanuatu (New Hebrides) EOS Trans Amer Geophys Union 63 430
Gutenberg B and C F Richter (1954) Seismicity of the Earth 2nd ed Princeton NJ Princeton University Press
Habermann R E (1984) Spatial seismicity variations and asperities in the New Hebrides seismic zone J Geophys Res 89 5891-590
Hamburger M W (1986) Seismicity of the Fiji Islands and Tectonics of the Southwest Pacific PhD thesis 312 pp Cornell University Ithaca NY
Hays W W (1980) Procedures for estimating earthquake ground motions U S Geological Surv Prof Paper 1114 77 pp
Ibrahim A K B Pontoise G Latham M Larue T Chen B Isacks J Recy and R Louat (1980) Structure of the New Hebrides arc-trench system J Geophys Res 85 253-266
lida K D Cox and G Pararas-Carayannis (1967) Preliminary Catalog of Tsunamis Occurring in the Pacific Ocean HIG University of Hawaii
International Seismological Centre (ISC) 1978-1979 Bulletin of the International Seismological Centre Newberry Berkshire United Kingdom
International Seismolog4 cal Centre (ISS) 1918-1963 International Seismoshylogical Summary Newbury Berkshire UK
78
Isacks B L and M Barazangi (1977) Geometry of Benioff zones Lateralsegmentation and downwards bending of the subducted lithosphere in IslandArcs Deep Sea Trenches and Back-Arc Basins Talwani M and W C Pitmaned Maurice Ewing Series 1 Amer Geophys Union Washington D C 99shy114
Isacks B L G Hade R Campillo M Bevis D Chinn J Dubois JRecy and J L Saos (1978) Measurements of tilt in the New Hebrides island arc in Proceedings of Conference VII Stress and StrainMeasurements Related to -Prthquake Prediction US Geological SurveyOpen-rile Report 79-370 176-221
Isacks B L R Cardwell J-L Chatelain M Barazangi J-M MarthelotD Chinn and R Louat (1981) Seismicity and tectonics of the central NewHebrides Island Arc in Earthquake Prediction An International ReviewMaurice Ewing Ser 4 edited by D W Simpson and P G Richards AGUWashington DC 93-116
Johnson T and P Molnar (1972) Focal mechanisms and plate tectonics ofthe southwest Pacific J Geophys Res 77 5000-5032
Karig D E (1971) Origin and development of marginal basins in the western Pacific J Geophys Res 76 2542-2561
Karig D E and J Mammerickx (1972) Tectonic framework of the New Hebrides island arc Marine Geology 12 187-205
Kelleher J J Savino H Rowlett and W McCann (1974) Why and where great thrust earthquakes occur along island arc J Geophys Res 794889-4898
Kroenke L (1984) Cenozoic Tectonic Development of the SouthwestPacific United Nations Econ and Social Commission for Asia and the Pacific Technical Bull 6
Lay T and H Kanamori (1981) An asperity model of large earthquakesequences in Earthquake Prediction An International Review Maurice EwingSer 4 edited by D W Simpson and P G Richards AGU Washington DC 579-592
Luyendyk B P W B Bryan and P A Jezek (1974) Shallow structure ofthe New Hebrides Island Arc Geol Soc Amer 85 1287-1300
Louat R J Daniel and B Isacks (1982) Seismicitd de larc desNouvelles Hebrides in Equipe de GOologie-GOophysique du Centre ORSTOM deNoumda Contribution Aletude godvnamique du Sud-Ouest Pacifique Travau et Documents de lORSTOM 1147 179-186
Mammerickx J T E Chase S M Smith and I L Taylor (1971)Bathymetry of the South Pacific map Scripps Inst of Oceanogr La Jolla Calif
79 Marthelot J-M (1983) Patterns of seismicity in the Vanuatu (NewHebrides) arc Regional variations and systematic evolution PhD Thesis Cornell University
Marthelot J-M J-L Chatelain B L Isacks R K Cardwell and ECoudert (1985) Seismicity and attenuation in the central Vanuatu (NewHebrides) islands A new interpretation of the effect of subduction of theDEntrecasteaux Fracture Zone J Geophys Res 90
McCann W R (1980) Large and moderate size earthquakes Theirrelationship to the tectonics of subduction Ph D thesis Lamont-DohertyGeol Observ of Columbia Univ Palisades NY
McCann W R S P Nishenko L R Sykes and J Krause (1979) Seismicgaps and plate tectonics Seismic potential for major boundaries Pure Appl Geonhys II_7 1082-1147
McGuire R K (1977) Effects of uncertainty in seismicity on estimateof seismic hazard for the East Coast of the United States Bull Seis Soc Amer 67 827-848
Mitchell A H G and A J Warden (1971) Geological evolution of the NewHebrides island arc J Geol Soc London 127 501-529
Mogi K (1963) Some discussions on aftershocks foreshocks andearthquake swarms--The fracture of a semi-infinite body caused by an innerstress origin and its relation to the earthquake phenomena (third paper)Bull Eartho Res Tnst Tokyo Univ 41 615-658
Monzier M J Y Collot and J Daniel (1984) Carte bathymetrique desparties centrale et meridionale de larc insulaire des Nouvelles-Hebridesmap Office de la Recherche Scientifique et Technique Outre-Mer (ORSTOM) Paris
Murphy J R and L J OBrien (1977) Analysis of a worldwide strongmotion data sample to develop an improved correlation between peakacceleration seismic intensity and other physical parameters ComputerSciences Corporation Rept NUREG-0402 to US Nuclear RegulatoryCommission 68 pp
Pascal G B L Isacks M Barazangi and J Dubois (1978) Preciserelocations of earthquakes and seismotectonics of the New Hebrides island arc JGeophys Res 83 4957-4973
Preliminary Determination of Epicenters (PDE) 1961-1981 MonthlyBulletin National Earthquake Information Service US Geological SurveyAlexandria Va
Pr~vot R and J L Chatelain (1982) Seismicity and seismic risk inVanuatu Report No 5-83 Centre ORSTOM Nouma New Caledonia
Richter C F (1958) Elementary Seismology W H Freeman and CompanyInc San Francisco
80
Rothe J (1965) The Seismicity of the Earth 1953-1965 Paris UNESCO 336 ppSanto T (1970) Regional study of the characteristic seismicity of theworld Part III New Hebrides island region Bull Earthquake Res Inst Tokyo Univ 48 1-18
SEAN (Scientific Event Alert Network) Bulletin 9
Taylor F W B L Isacks C Jouannic A L Bloom and J Dubois(1980) Coseismic and Quaternary vertical tectonic movements Santo andMalekula islands New Hebrides-island arc J Geophys Res 85 5367-5381
Taylor F W C Jouannic and A L Bloom (1985) Quaternary uplift ofthe Torres Islands northern New Hebrides frontal arc Comparison withSanto and Malakula Islands central New Hebrides frontal arc J of Geol 93 419-438
Trifunac M D (1976) Preliminary analysis of the peaks of strongearthquake ground motion--dependence of peaks on earthquake magnitudeepicentral distance and recording site condition Bull Seism Soc Amer 66 189-220
Trifunac M D and A G Brady (1975a) Correlations of peakacceleration velocity and displacement with earthquake magnitude andsite condition Intl J Earthquake Engr Struc Dynamics 4 455-471
Trifunac M D and A G Brady (1975b) On the correlation of seismicintensity scales with the peaks of recorded ground motion Bull Seism Soc Amer 65 139-162
Turcotte D L and G Schubert (1982) Geodynamics John Wiley amp Sons New York
US Geological Survey 1961-1985 Preliminiry Determination of Epicenters Denver Colo
Vidale J and H Kanamori (1983) The October 1980 earthquake sequencenear New Hebrides Geophys Res Lett 10 1137-1140
Wellington Seismological Observatory Geophysics Division 1953-1960 NZDept Scientific and Industrial Research Catalog of Earthuakes 1953-1960
Wray S T R K Cardwell B L Isacks E Cudert and J-L Chatelain(1983) Detailed seismicity observations in the forearc region of aconvergent plate boundary Malekula Island Vanuatu (abstract) EOS Trans Am Geophys Union 62 945
Wyss M R E Habermann and C Heiniger (1983) Seismic quiescencestress drops and asperities in the New Hebrides arc Bull Seismol Soc Am 23 219-236
81
APPENDIX I DEFINITIONS
Two measures of the size of an earthquake are magnitude and intensity
Magnitude is a measure of the energy from an earthquake source to indicate the
strength of an earthquake In comparison intensity is a measure of the amount
of ground shaking caused by the earthquake at a particular site Thus an
earthquake of a given magnitude will produce a wide range of intensities
depending largely on distance from the source
In general a small earthquake with a magnitude less than 5 may be felt
only in the area near the source and a moderate earthquake with a magnitude
between 5 and 7 will be felt over a wider area and may produce significant
damage in the area very close to the source A large earthquake refers to an
earthquake with a magnitude greater than 7 Such events are often very desshy
tructive if they are located near population centers A major earthquake
refers to magnitudes between 7 and 7 34 and a great earthquake refers to
magnitudes greater than 7 34 These great earthquakes cause widespread desshy
truction and possible regional tsunamis Generally the potential damage from
earthquakes is multiplied by the secondary effects of earthquake occurrence
such as ground faulting generation of tsunamis landslides slumping or
liquifaction
The depth of earthquakes range from the surface to approximately 700 km
depth Shallow earthquakes refer to those with depths between the surface and
70 km Intermediate earthquakes refer to those with depths between 70 km and
250 km depth Deep earthquakes refer to those with depths greater than 250 km
(but less than 700 km) Intermediate depth earthquakes occasionally produce
damage at the earths surface only if the earthquake is very large Deep
events are generally not felt
82
The seismic (earthquake) potential of a particular region is defined as
the likelihood of that region to experience a (destructive) earthquake within
particular magnitude range within a particular time period The seismic
(earthquake) hazard of a particular location refers to the amount of ground
motion that might be expected from an earthquake within or near that region
Adequate data on seismotectonic features instrumental (strong-motion) and
macroseismic (intensity) records of near-field effects of large earthquakes
source parameters of large earthquakes earthquake spectra and ground attenuashy
tion or amplification are necessary in order to reasonably evaluate earthquake
hazard for any region The seismic potential is the integration of all of
these bits of information The average length of time between earthquakes of a
particular size (recurrence interval) and the amount of time elapsed since the
last earthquake of that size help to define the probability of future earthshy
quake occurrence along a particular seismogenic zone hence the seismic
potential of that zone
Seismic risk of a particular region refers to the expected degree of
losses of people and their property which result from the seismic hazard and
the vulnerability in the region One method that has been widely used for this
risk determination (and is used here) involves the determination of a maximum
probable earthquake (design earthuake) that is likely to occur in the imshy
mediate region Calculations of seismic hazard which are based on design
earthquakes generally yield conservative estimates of risk
The most important conclusion of historical studies of seismicity is to
define the seismogenic zones of a region and extrapolate what the future earthshy
quake potential is for those zones Seismically quiescent regions refer to
regions with a lower level of seismic activity which are surrounded by more
83
active regions Portions of major plate boundaries that have not experienced a
major or great earthquake during a particular time interval are seismic Raps
This time interval is taken to be a significant portion of the earthquake
recurrence interval for a large earthquake An estimate to within several
decades of the location and size (magnitude) of a large earthquake constitutes
a forecast If a precise calculation of the time and probability of occurrence
can be added to the location and size information then the estimation is a
prediction
84
APPENDIX II MODIFIED MERCALLI INTENSITY SCALE (1956 VERSION)
Masonry A B C D To avoid ambiguity of language the quality of masonry brick or otherwise is specified by the following lettering whichhas no connection with the conventional Class A B C construction)
Masonry A Good workmanship mortar and design reinforced especiallylaterally and bound together by using steel concrete etc designed to resist lateral forces
Masonry B Good workmanship and mortar reinforced but not designed in detail to resist lateral forces
Masonry C Ordinary workmanship and mortar no extreme weaknessez likefailing to tie in at corners but neither reinforced nor designed againsthorizontal forces
Masonry D Weak materials such as adobe poor mortar low standards ofworkmanship weak horizontally
DESCRIPTION (INTENSITY VALUES RANGE FROM I TO XII)
I Not felt Marginal and long-period effects of large earthquakes
II Felt by persons at rest on upper floors or favorably placed
III atlt indoors Hanging objects swing Vibration like passing oflight trucks Duration estimated May not be recognized as an earthquake
IV Hanging objects swing Vibration like passing of heavy trucks orsensation of a jolt like a heavy ball striking the wallsStanding motor cars rock Windows dishes doors rattle Glassesclink Crockery clashes In the upper range of IV wooden walls and frames creak
V Felt outdoors direction estimated Sleepers wakened Liquidsdisturbed some spilled Small unstable objects displaced or upset Doors swing close open Shutters pictures move Pendulum clocks stop start change rate
iOriginal 1931 version in Wood H 0 and F Newmann 1931 Modified
Mercalli Intensity Scale of 1931 Bull Seis Soc Amer 53 979-9871956 version prepared by Charles F Richter in Elementary Seismology(1958) 137-138 W H Freeman and Company
VI Felt by all Many frightened and run outdoors Persons walk unsteadily Windows dishes glassware broken Knickknacks booksetc off shelves Pictures off walls Furniture moved or overshyturned Weak plaster and masonry D cracked Small bells ring(church school) Trees bushes shaken (visibly or heard to rustle--CFR)
VII Difficult to stand Noticed by drivers of motor cars Hangingobjects quiver Furniture broken Damage to masonry D includingcracks Weak chimneys broken at roof line Fall of plasterloose bricks stones tiles cornices (also unbraced parapets andarchitectural ornaments--CFR) Some cracks in masonry C Waves on ponds water turbid with mud Small slides and caving in alongsand or gravel banks Large bells ring Concrete irrigationditches damaged
VIII Steering of motor cars affected Damage to masonry C partialcollapse Some damage to masonry B none to A Fall of stucco and some masonry walls Twisting fall of chimneys factory stacks monuments towers elevated tanks Frame houses moved onfoundations if not bolted down loose panel walls thrown outDecayed piling broken off Branches broken from trees Changes inflow or temperature of springs and wells Cracks in wet ground and steep slopes
IX General panic Masonry D destroyed masonry C heavily damagedsome times with complete collapse masonry B seriously damaged(General damage to foundaticns--CFR) Frame structures if notbolted shifted off foundations Framed cracked Serious damageto reservoirs Underground pipes broken Conspicuous cracks inground In alluviated areas sand and mud ejected earthquakefountains sand craters
X Most masonry and frame structures and bridges destroyed Seriousdamage to dams dikes embankments Large landslides Water thrown on banks of canals rivers lakes etc Sand and mudshifted horizontally on beaches and flat land Rails bent slightly
XI Damage nearly total Large rock masses displaced Lines of sightand level distorted Objects thrown into the air
86 APPENDIX III EARTHQUAKE EDUCATION PAMPHLET PUBLISHED IN FIJI
EARTHQUAKE What to do how to help
-
bull - -C II
deg
Damage at Suva wharf caused by the 1953 -earthquakelw hich was followed by a tidal wave within 30 seconds
1 411_0- shy
87 from theA message Minister for Lands
Recent earthquakes in Waya tsunamis might be the most Island and the even more recent one effective means of mitigating which rocked the city of Suva short- the worst effects of a sudden ly after 9am on Decanber 171975 calamity in these two potentshyand the ensuing panic reaction of ially dangerous forms is to the people are sharp reminders to us know more about them that although Fiji is situated in an
Indeed the suddennessearthquake zone there is little in-the severity of a wideshyformation available to the public on and
spread disaster could disruptearthquakes and tsunamis (tidal which are often associated all communications and paralysewaves)
with the type of earthquakes we have even the most efficient and experienced in Fiji well-drilled emergency organishy
sation it is hopeZ that the infor-
Survival in those cirshymation pamphlet prepared by myministry on earthqkes and tsunamis Ceatnces would depend on
will allay some of the natural alarm each individuals own knowshy
which people exp -ence during even
the minor tremor- Because we are in an
It has been brought to my earthquake belt it would be
notice that at least one expert has prudent for people living in Fiji to make themselvespredicted the chance of a serious
earthquake in Fiji as 140 years thoroughly familiar with the
one earthquake every 40 years information contained in this pamphlet
However with the exception of the earthquake and tidal waves in I wish to take This 1953 we are fortunate not to have opportunity to appeal for your suffered a more serious earthquake full co-operation in answeringthe questionnaire on earth-
They are probably the most quakes and tsunamis which terrifying and devastating phenomena appears on page nine of known to man this pamphlet as accurately
Unlike other natural disas- as possible
ters such as hurricanes and flood- The aim of the ing the tragedy of earthquakes is questionnaire is to locate that there is no forewarning of their and map the fault-line zones coming from which it is suspected
The very recent earthquake that most of our earthquakes in Hawaii is an obvious in- originatedisaster
dicator that the science of predicting The success and the earthquakes is still in the early efficiency of any kind of stages of development emergency relief system may
Although the recent occurrence depend on your co-operation in Hawaii might not rank among the in providing the informationworlds most serious earthquakes we sought- SNWqanivavalagi
orldssrios msteathqakes weMinister for Lands and Mineralknow from the experiences of other Resources countries that earthquakes can be totally devastating
However remote the possibishyity of a serious earthquake and
2
88
7 -
Part of the damage to the Suva Harbour reef caused by the 1953 earthquake
70 per cent from FIJI area About 70 per cent of the masonry landslides or drowning
worlds deep earthquakes are recorded in the tsunami from the Fiji area Most of them are Another earthquake with not felt because they occur at great an intensity of four to five was depths of about 400 to 600 kilometres ecperienced in Suva in 1961but (24845 to 37267 miles) beneath thecasdolmirdmget
surfac of te ebuildings
These types of earthquakes are not dangerous or damaging because of the depths at which they occur ButOtra they ore scientifically interesting
because they help geologists to deduce
the structure of the crust
The types of earthquakes which can be very damaging are those of large magnitude which occur in thebecase tey Todedueelp eolgist top 50 kilemetres (3106 miles) of the earths crust
The 1953 earthquake which hcd on epicentre (origin) 15 miles west of Suva was of this type That earth-quake had an intensity of seven out of a Mercalli scale of 12 and result-ed in a tsunami (tidal wave) which occurred 30 seconds after the quake and affectedoiSuva and davu About seven people were killed by falling
Several smaller shocks have been reported since then
w here re oftenearthquake fe arrtua aaso avun
fhlare laldes odrwi savu Taveuni and recentlythe WayA - Nadi - Lautoka area
Reports received after the 1953 earthquakes also show f l itle dmage incstes t that several very strong earthshyquakes have been felt in the
Fiji area since the early 1800s A o the
caused lthu d thse in tha the increasing density of popushyltion and buildings would make the area more prone to damage unless buildings are properly reinforced to withstand strong lateral motions from earthrukes
89 Quakes come In two main types
Volcanic earthquakes are asso-ciated with the movement of molten rocks underground usually at depths of less than 30 kilometre5 near active or inactive (at surface) volcanoes
These volcanic earthquakes are
often called tremors because they tend to occur frequently and almost continuously and are often associat-ed with possible forthcoming erupt-ions of volcanoes
Fortunately it has been over a million years since volcanoes erupted in most parts of Fiji al-though the most recent volcano was probably active less than 2000 years ago in the Taveuni area
Because of the long period of
time since previous eruptions vol-
canoes in most parts of Fiji can be or least inshyconsidered extinct at
active
The possibility of another
eruption occurring at some future time cannot be totally discounted
But it should be reassuring to note that with modern advances in instru-mentation it is becoming increasing-ly possible to predict the likeli-hood of impending volcanic activity
Tectonic earthquakes the other
major (and more common) type are due
to the movements of relatively solid parts of the earths crust against each other
Such motions c 3n be in the form of the swallowing of a large portion (or plate) of the crust into a trench area
For example the Eastern Pacific plate is postulated to be drifting westward at the rate of about 10 centimetres (roughly 394
inches) a year and is being swallowed or subducted under the Western Pacific plate in the Tonga trench area
The subduction of one plate under another causes friction between the plates and causes numerous earthquakes fortunately at great depthsshyabout 500 to 600 kilometres (31056 to 37267 miles)
Tectonic earthquakes occur also along fault lines which are zones of weakness in the earths crust usually at fairly shallow crustal depth
Geologists have mapped a number of fault areas in Fiji where it is apparent that one rock mass has been moved (or displaced) relative to an
adjacent rock mass through the release of stresses and strainsbrought about during the geoshylogca dvlp n the islands
Fortunately again most
of the faults which have been mapped are thought to be inshyactive
But there are some fault zones which could be active and it is quite likely that the strong 1953 earthquake was caused by fault movement offshyshore from the Kalokolevu shyso ara
The recent earthquakes felt in the Waya - Nadi -Lautoka area could be due to fault movements several miles offshore south-west of Waya
In 1976 the Mineral Reshysources Division intends to do
detailed mapping of these possibly active fault-zone areas near Suva and in the west of Waya
Other plans are for the division to make greater use of instruments and become inshyvalved in the recording of earthquakes
9
THE MAIN DANGERS Collapse of buildings due to
lack of reinforcement poor building materials (eg adobe type) or un-satisfactory foundations
Broken overJ ead power lines can
occur quite easily and are partishy
cularly dcnprous because many people have the inclination to run outdoors when they feel a strong earthquake
Landslides are possible alongLandlidsposibe aongofae fault zones or very wet areas pbrti-cularly where hillsides are steep
One person was killed in the Namosi area by landslides during the 1953 earthquake
Earth movements and chasms People naturally tend to have a very strong fear that the earth will open up and swallow them during an earth-quake However there is only one pro-perly documented case in recorded history of a person being crushed in a fissure Basically the danger of falling into chasms is minimal and the natural terroz of people from this is apparently the result of ex-
Fire can be one of the most dangerous effects of earthquake as evidenced by the disasters in Son Francisco in 1906 and Tokyo in 1923 Perhaps the worst problem from fires caused by earthquakes is that water pipes are often broken and firemen are forced to use less accessible alternative sources such as a river or the sea
Tsunamis are a particular kind
of sea wave which can build up follow-ing an earthquake In the past they have devastated cities and small settlements along the coasts of Chile Peru Alaska Hawaii Japan and other countries These waves travel across the Pacific Ocean at jet speed (more than 600 miles an hour)
In shallow wters t5unamis become a threat to life and property because they can reach up to miore than 100ft high at wave crest levels and strike with devastating force
5
We have no official record of any extensive tsunamis in Fiji except for the one caused by the 1953 earthquake which claimed some lives in Suva andKadavu
Other tsunamis are likely to have occurred in earlier times but were not identified especially as tsunamis becauseour lack of experience with them
The barrier reef round much of the islands helps to dissipate some of the wave
energy and therefore some ofthe dangers
But we should realise that we can still bevulnerable to waves especially from a southerly direction where our reef systems are less extensive
If a very strong earthshyquake is felt in Fiji you should prudently assume that it has originated within the Fiji group and is likely to have generated a tsunami
In the 1953 case the tsunami was about csft high when it hit the reef outside Suva within 10 seconds after the earthquake
A 6ft wave then travelled across the harbour and hit the waterfront about three to four minutes later causing only
slight damage and leaving many
But the tide was low at that time If it had been high tide the waves could have been about 9ft high and the effects could have been disastrous
Waves 5ft to 6ft high
also hit Lami Deubq Be--Island and Koro Island and a 15ft-high wave claimed two lives at Nakasaleka Kadavu Smaller waves were felt at Ovalauthe southern coast of Vanua Levu and in the western Lou Group
Precautons to take Because earthquakes occur
suddenly and without warning there ore only a few precouton5 people can take such as ensuring that houses are on firm foundations and are suitably reinforced to withstand earthquakes
The following modified version of on earthquake notice is reproduc-ed from a California Geology article published in October 1975
When an earthquake occurs For a minute or two the earth may pitch and roll like the deck of a ship The motion is frighteningbut unless it shakes something down on you it is probably harmless in itself Keep calm and ride 4t out Your chances of survival are good if you know how to act
During the shaking If indoors stay indoors Got under sturdy fur-niture such as a table Stay near the centre of a building and stay away from glass Do not use condles matches or other open flames
Do not run through or near buildings particularly concrete ones where there is danger of fall-ing debris If outside stay in the open away from buildings and power lines
If in a moving ccr stop but stay inside
After the r akinq Check your water and electricity
If water pipes are damaged or electric wires are shorting turn off at primary control point If in a low-lying coastal area which can be affected by tsunamis leave house and make for higher ground (see tsunami safety rules below) Turn on radio for emergency bulletins Stay out ofaamaged buildings- aftershocks can shake them down
In a 1961 study of earthquake risks in Fiji RHoutz estimated that the chance of a strong quake occurring here -was about 140 ie
6
once every 40 years This figure should be reassuring But one must remember that it is only an estimate -and that once in 40 years could be toshymorrow
Tsunami Safety Rules Tsunamis follow no disshy
cernible pattern of occurrence When you receive a tsunami warning you must assume that a dangerous wave is on its way
History shows that when the great waves finally strike they claim those who have ihed the wnin ve
ignored the warning The following tsunami
rules were extracted from a pamphlet prepared by the US Environmental Science Services Administration and they should be noted 1 An earthquake in your
area is a natural tsunami warnshying Do not stay in 1-yving coastal areas after a strong local earthquake
2 A tsunami is not a single wave but a series of waves Stay out of danger areas until on all-clear is issued by a competent authority
3 Approaching tsunamis are sometimes heralded by a noticeshyable rise or full of coastal water This is nature s tsunami
warning and should be heeded 4 A small tsunamiat one
beach can be a giant one a few bea a Do nt le the milesaway Do not let the modestse ofowve ma you lose reect for whut may follow
5 All tsunamis - like hurricanes -are potentially dangerous even though they may not damage every coastline they strike
6 Never go down to the beach to watch for a tsunami
92
yocn thetoo L see wave you are After 5Oft
too close to escape it
7 Sooner or later tsunamishit visit every coastline in the Pacific Warnings apply to yollif you live in Suva reef any Pacific coastal Olrea
8 During a tsunami emergency A section of the Suva Harbour reef your local emergency organisations forced upwards by the 1953 earthshywill try to save your life Give quake A tsunami -(tidalwave) 50ft them your fullest co-operation high hit the reef within 10 seconds
Unless otherwise determined by after the quake and sent a 6ft wavecompetent scientists potential to the shoreThis struckdanger areas are hose less than watershyfront about three to four Ainutes 50f above sea level and within one later and caused minor Cdamage but
mile of the coast for tsunamis of only because it was at low tide any origin
7
Measuring their size Earthquake magnitudes are
measured on very sensitive seismolo-
gical instruments Theseare often referred to as the Richter scale and the largest shock known to date had a magnitude of 89 on Richter scale (compared to 675 for the 1953 Suva earthquake on the same scale)
hat is in commonAnother scale use and depends on physical effects and observations is the modified Mercalli scale which is reproduced here It measures the intensity of earthquake and is graduated from one to 12 for measuring
Modifiedl Mercalli scale1956 versiont
Earthquake intensity
1 Not felt except by a very few under especially favourable (for
the arthuak)crcustanesamountsthe earthquakes) circumstances
2 Felt only by a few persons at rest especially on upper floors of buildings Delicately suspended objects may swing
3 Felt quite noticeably indoors especially on upper floors of build-ings but many people do not recog-nise it as c earthquake Standing motor cars muy rock slightly Vib-ration like passing truck Duration can be estimated
4 During the day felt indoors by many outdoors by few At night some awakened Dishes windowsdoors disturbed walls make creaking sound Sensation like heavy truck striking building Standing motor cars rocked noticeably
5 Felt by nearly everyone many
awakened Some dishes windowsetc broken a fewinstances of cracked plaster unstable objects overturned Disturbances of trees poles and other tall objects sometimes noticed Pendulum clocks may stop
6 Felt by all many frightened
and run outdoors Some heavy furni-
ture moved a few instances of fallen plaster or damaged chimneys Damage slight
8
7 Everybody runs outdoors Damage negligible in buildings of good design and construction slight to moderate in wellshybuilt ordinary structures considerable in poorly built or badly designed structures some chimneys broken Noticed
by persons driving motor cars
8 Damage slight in specialshyly designed structures conshysiderable in ordinary substantshyial buildings with partial collapse great in poorly built structures Panel walls thrown out of frame strucTures Fall
f fameystrctresasof chimneyq factory stcks
columns monuments walls Eeavy furniture overturned Savy fniur e -turned
Sand and mud ejected in small Changes in well water
Disturbs persons driving motor
cars 9 Damage considerable in
specially designed structures well-designed frame structures
thrown out of plumb great in substantial buildings with partial collapse Buildings shifted off foundations Ground cracked conspicuously Undershyground pipes broken
10 Some well-builtwooden
structures destroyed most masonry and frame structures destroyed with foundations ground badly cracked Rails bent Landslides considerable from river banks and steep slopes Shifted sand and mud Water splashed over banks
11 Few if any (masonry) Ltructures remain standing Bridges destroyed Broad fissures in ground Underground pipelines completely out of service Earth slumps and land
slips in soft ground Rails bent greatly
12 Damage total Waves seen on ground surfaces Lines of sight and level distorted Objects thrown upward into the air
FILL THIS IN TO HELP THE EARTHQUAKE STUDY
To enable an improved study of shallow local earthquakes the coshyoperation of the public is required in filling out the following questionshynaire whenever an earthquake is felt Many earthquakes are very small and sometimes are not recorded on seismological instruments This questionnaire system will enable the Mineral Resources Division to better determine the location of earthquake zones which can then be mapped in detail
EARTHQUAKE QUESTIONNAIRE
1 An earthquake was felt on at am or pm
Place
2 What direction did the shock come from
o ooo mge oe e o o o o
3 How many seconds did the quake last
4 Was the shaking rapid or slow
5 Where were you when the earthquake occurred
6 Were you awake asleep or awakened
7 Were you walking working standing sitting or lying down
8 Did the people around you feel the earthquake too
9 Did people run outside
10 Did cracks occur in the buildings you were in
11 Was the building damaged in any otherway
o
12 What is the building made of
13 Did the windows doors dishes rattle
14 Did hanging objects doors etc swing 0000000000600
Turn to next page 9
95 15 Did vases small objects furniture overturn
e
16 Did things fall off shelves
17 Did you notice any unusual waves in the sea after the quake 00 0a -0 0 000aV0a0a0 000000a000 00
18 1f so h6w soonafterwards 0 BO
e a 0000000amp000000000amp0000 a a
What were the waves like 00000619
20 Did anything else unusual happen
0 o a o e e o o 0o e o e e eo o eo 6 o e e e oIe e e o o o adegdeg e odegI e o o oo oo oe 1 8 aampv a
21o Any other remarks e
N me a
Complete formtear out this whole page and mail to
The Director of Mineral Development Mineral Resources Division Private Bag GPO SUVA
This special booklet is published by the Ministry of Information at Government Buildings in Suva for the Ministry of Lands and Mineral Resources
(JANUARY 1976)
10
96
In the wake of the 1953 quake
1M
Crack in the coral
A -rac) in the main Suva reef after the earthquake and tidal wave in 1953
12
T SANERIVE Government Printer Suva Fiji
98
APPENDIX IV SEISMOLOGICAL FACILITIES AND EARTHQUAKE HAZARD PROGRAMS IN THE SOUTHWEST PACIFIC
As part of our program of field investigations in Fiji Tonga andVanuatu our researcher was able to visit the neighboring island countries of the Southwest Pacific region During these visits he was able to meetwith scientists and public officials involved with the earthquake hazard problem facing each country In every case the governments are aware ofand have taken some action to mitigate the potential losses due to destrucshytive earthquakes but these governmental responses have varied widely fromcountry to country This report focusses on the seismological institutionsand facilities in each of the countries and their capablities in assessingand planning for carthquake hazards In the following sections we conshysider each of the island countries of this area which face a severe earthshyquake risk Fiji Tonga Vanuatu Western Samoa Solomon Islands PapuaNew Guinea and New Zealand
FIJI
Seismological Facilities
Seismological observations in Fiji are conducted by the Mineral Resources Department a subdivision of the Ministry of Energy and MineralResourcs The government has made a major commitment to seismologicalwork since the establishment of the AID-supported seismic network in 1979In fact seismological observations in Fiji have been carried out since theearly part of this century supported at first by the New Zealand scienshytific organizations and subsequently strengthened by Lamont GeologicalObservatorys Upper Mantle Project in the 1950s and 1960s In late 1979the 8 -station US AID network was established to complement three permanent stations in Viti Levu The network was significantly expanded byinstallation of a five-station telemetered network in 1981 supported byJapanese aid (Figure Al) Additional stations were installed in 1983 and 1984 the network has now expanded to an eighteen-station national networkwith excellent coverage of the Fiji region In addition MRD now has available five MEQ-800 portable seismographs for occupation of temporaryfield sites telemetered station testing and special refraction experiments While the Fiji network has experienced considerable technical difficulties it has recorded over 2000 earthquakes since its installationand provides an invaluable basis for seismological study of the Fiji region
Strong Motion Accelerographs
The Mineral Resources Department also operates a network of strongmotion accelerographs now numbering ten Kinemetrics SMA-ls (Figure A2)The initial six instruments of this network were granted to Fiji by AIDthe remainder were purchased by the Fiji government Since establishment of the SMA network three accelerogram records have been obtained from moderate-sized earthquakes in Viti Levu Records obtained from thisnetwork are expected in the long run to provide the basis for predicting
tTT Illt EAST OF +NWICH IS0 WEST OF GREENWICH III
Y 7sdeg NATIONAL NETWORK OF SEISMOGRAPHIC STATIONS 1982
AC7
DEELLAAIKOORROOMTRE
23O~~~~ ROTUMU
YASAWAIRAR C1
00
A0 KORO
-W
0
I VUNH SOUTHRIOGE A
~)AVALAU 0
NADI A A ONASAVULAU
MAGOORO A VUNIOAWALAU
VIT LE U _LAKEPe NAMOSI AUNIAA -GAJ
ALOAA0A NAMORO SUVA
VITICLEVU
13 BEOA
LEGEND A E-isting Station
I RAKRAKI A Proposed Station Toloyo
Motulu Fuloo amp
EAST OF GREENWoICH ISO WEST Of GREENWICH ITS
Figure Al Network of seismic stations in Fiji established through the assistance of US AID and Japanese aid programs
_ _ _1_ Q__
NATIOqAL NETWORK OF EAST
STRONG OF OEEwICH
MOTION IO WEST 0 OREV-1CM
ACCELEROGRAPHS 79
LEGEND
A Accelerograph
0 30 60 KLOLETRES
LBS
YASAWA
lt ---shyVANUA LEVU U
T EUW r
S|bullKORO 0
T
V2anua bala~u
N
0
LA IV)DI A MON~ASAVU V
9LAU
VITI LEVU OKA1)
(4)
GAU
LAKE1A
0 11-
Kld
A S T O r
Maluku
GREN Wa
Toloyc
I 0 W E S T O f C REEM CN I
Figure 2A Location of strong-motion accelerographs in Fiji
100
ground accelerations and thus for development of building codes specific to Fijis tectonic setting
Related Scientific Programs
The Mineral Resources Department includes an Offshore Geology sectionwhich has an active program of marine geological and geophysicalinvestigations in and around Fiji waters MRD also employs an engineeringgeologist whose work includes microzonation of the Suva area mapping ofactive faults in southeastern Viti Levu and investigation of soils subjectto earthquake-induced liquefaction An active program of geologicalmapping and structural studies is also carried out by MRD They aresupported by personncl assistance from Australia and Great Britain
Suva is also the home of the United Nations Committee for Coordinationof Offshore Prospecting in South Pacific Offshore Areas (CCOPSOPAC) Thisorganization coordinates much of the international marine research carried on in the region and has been particularly helpful with Fijisinvestigation of its offshore waters
Critical Facilities
The major development in Fiji has been in and around the capital cityof Suva The population of the metropolitan area now exceeds 130000 and most of the government commercial and industrial operations are concentrated there The city has become a major commercialtransportation and regional political center and has developed rapidly inthe past ten years Development in this period has included constructionof multistory buildings a major electric power plant expansion of theSuva harbor and most recently completion of the thirteen-story CentralMonetary Authority building in downtown Suva Much of this development hastaken place on an area of filled land close to sea level particularlyvulnerable to earthquake and tsunami damage This area was extensivelydamaged by the 1953 Suva earthquake and tsunami and is thus at significantrisk from a repeat occurrence of an event of comparable size
Other population centers with significant development include thetowns of Lautoka (pop 29000) Nadi (13000) and Ba (9000) on the islandof Viti Levu and Labasa (13000) on Vanua Levu The tourist industrywhich is a major part of Fijis economy is concentrated on the southernand western coasts of Viti Levu and is also vulnerable to earthquake andtsunami damage The major development project in Fiji is the 87-meter highMonasavu Dam in the interior of Viti Levu The earthfill dam was completedin 1983 and is planned to provide most of the countrys electric powerneeds through the end of the century
Earthquake Preparedness Programs
In awareness of the serious earthquake risk to development in Fijithe government has adopted New Zealand earthquake design codes for most ofthe urban areas of the country Seismic zone B codes applicable to areas of moderate seismic activity in New Zealand have been chosen asappropriate and are applied (in theory at least) to all domestic andcommercial construction in urban areas Considerable difficulty remains in
101
enforcement of these regulations particularly in construction of privatedwellings Major multistory building design is generally handled by overseas (Australia or New Zealand) engineers and dynamic modelling tests are generally applied for earthquake loadings at least as large as those required by the New Zealand codes The Monasavu Dam underwent dyiamictesting by Australian consulting engineers
Disaster preparedness is the responsibility of the Emergency Services Committee (EMSEC) and the Prime Ministers Relief and Rehabilitation Committee (PMRRC) EMSEC is responsible for coordination of disaster plans maintenance of essential services advice to the Cabinet on emergency measures and direction of relief work It is comprised of representativer of the related ministries and public agencies PMRRC is chaired by the Prime Minister of Fiji and has responsibility for long-termrelief policy and rehabilitation programs Fijis experience with recurrent weather-related disasters has spurred efforts for emergencycommunication systems supply distribution temporary shelters and so on Much of this hurricane disaster planning is applicable as well to earthquake and tsunami damage Fiji is also a participant in the International Tsunami Warning System
Educational programs have been handled through the Fiji BroadcastingSystem the Red Cross and the school sysem To a limited dgree the Public Works Department and the Mineral Resources Department have producededucational materials related to earthquake hazards in Fiji
TONGA
Seismological Facilities
Seismological observations in Tonga are the responsibility of the Ministry of Lands Surveys and Natural Resources Due to fiscal constraiits however these efforts have in the past been entirelydependent on foreign assistance Seismological experiments began in Tongain the mid-1960s with Lamont-Dohertys Upper Mantle Project Seismic stations were operated by Lamont-Doherty and subsequently by Cornell scientists through the early 1970s when operations were suspended In late 1983 as part of the present AID-supported seismic hazard programCornell reinstalled a three-component short-period seismograph in the capital Nukualofa The seismograph was installed upon the request of the government geologist to be operated by the Tongan government with technical assistance from Cornell Unfortunately after operation of the seismograph for eight months Tongas Cabinet decided that the drain on its resources and personnel was excessive and the instruments were disconnected in May 1984 with the components transferred to Fiji and Vanuatu where they can be utilized There are presently no plans to reinstall permanent seismographs in Tonga
Strong Motion Acceierographs
Two strong-motion accelerographs provided by the AID seismic hazard program are presently operating in Tonga one in Nukualofa and one in the northern Vavau Islands They have been in operation for one year and
102
have not to date recorded any large earthquakes They require a minimum of maintenance and their operation will continue to be supervised by the government geologists with assistance from Cornell A third accelerograph may be made available to tonga by the British Geological Survey and could bB installed on Eua Island in a zone of high activity close to the Tonga Trench Related Research Programs
The Ministry of Lands Surveys and Natural Resources employs a singlegovernment geologist whose responsibilities include coordination of oil prospecting geolcgical mapping of the islands and assessment of earthquakeand tsunami hazards There has been considerable scientific study of the Tonga Trench subduction zone by research groups from the United StatesJapan New Zealand Australia Germany and the Soviet Union More detailed marine geophysical data have been collected near Tongatapu Island byAmerican petroleum exploration groups
Critical Facilities
The capital city of Nukualofa has a population of only 20000 butdoes include several three- and four-story buildings The larger buildingshave in general been designed by foreign engineers and have included earthquake- resistant design specifications Other significantdevelopment projects include the expansion of the government wharf in Nukualofa and development of tourist resorts on Tongatapu and several of the outer islands
Earthquake Preparedness Programs
There are no building codes presently enforced in Tonga Howeverconstruction of public buildings must be approvei by the Ministries of Works and Health The largest office buildings and hotels are designed byoverseas engineering firms and generally include some earthquake loadingcriteria The Land and Environment Act currently under consideration bythe Tongan government would require review of all development projects bythe government planner application of building codes largely adapted from New Zealand codes is expected to follow
Disaster preparedness programs are the responsibility of the Cabinets National Disaster Committee including representatives from the related government ministries and departments Subcommittees focus on disaster preparedness action planning and long-term relief and rehabilitation There is no earthquake education program in Tonga
WESTERN SAMOA
Seismological Facilities
One of the earliest seismic stations in the Pacific was established atthe Apia Observatory in 1902 during the German colonial period through the University of Gbttingen In 1921 control of the observatory was transferred to the New Zealand Government Weichert seismographs were
103
operated continuously at Apia through 1957 when they were replaced by Benioff instruments at Afiamalu and by short-period Wood-Anderson instruments at Apia Since Samoan independence in 1963 the Observatory has been operated jointly by the Samoan Government and the Department of Scientific and Industrial Research (DSIR) New Zealand In 1963 a Worldwide Standard Seismograph Station was established at Afiamalu Operation of this six-component station is supported by the US Geological Survey In 1980 the station was upgraded to allow digital reccrding equipment was added to upgrade the station to the status of a Global Digital Seismic Network station Seismic records are sent to DSIR in Wellington for permanent storage
Strong Motion AccelerograDhs
A simple strong motion instrument has been operating in Apia since 1979 It is an event-triggered low-gain seismograph recording on an ink-stylus recorder At the time of our visit to Western Samoa the instrument had been out of service for several months Only one event has to date triggered the instrument
Related Scientific Programs
The Apia Observatory has also made continuous magnetic field measurements since 1905 Measurements are currently made using a Schultze earth inductor an Askania declinometer and a proton magnetometer The observatory maintains two tide guages as part of the Pacific Tsunami Warning System Offshore resource studies have been carried out through CCOPSOPAC and by various international research groups Much of the reconnaissance geological work in Western Samoa has been carried out by DSIR in New Zealand
Critical Facilities
Like many of the other island countries of the Pacific Western Samoas development has been concentrated around the capital Apia (pop 34000) A major deep-water harbor and the countrys tourist industry are based in Apia Several multistory buildings have been erected in Apia in the past several years A hydroelectric dam on Upolu Island was completed in 1978
Earthquake Preparedness Programs
There is presently no disaster plan in effect in Western Samoa The various agencies involved with emergency action are coordinated through the Police Commissioner New Zealand seismic zone B codes are applied to construction in Western Samoa Enforcement is handled by the Public Works Department Modest educational materials have been prepared by the Apia Observatory staff in English and Samoan for distribution through schools and public agencies
104
SOLOMON ISLANDS
Seismological Facilities
Seismological Observatories in the Solomon Islands are conducted bythe Ministry of Lands Energy and Natural Resources They have operated aWorldwide Standard Seismic Station in Honiara since 1962 operation of the station is supported by funds from the US Geological Survey The station was augmented by two short-period telemetered seismic stations in 1982 This three-station necwork was provided through the British GeologicalSurvey with the aim o identifying volcanic earthquakes associated with theactive volcano Savo located close to the capital
In awareness of the high volcanic risk to population centers in theSolomon Islands the Ministry has drawn up plans for two three-station telemetered arrays to be deployed around the active volcanoes on Simbo Island (New Georgia Group) and on Tinakula Island (Santa Cruz Group) Theyare presently seekirg foreign aid in the form of seismic instrumentation and technical asistance to establish the network
The Ministry also has responsibility for field surveys following majorearthquakes in the Solomon islands Studies of ground deformation and cultural effects of the large 1977 and 1984 earthquakes were made by seismology officers
Strong Motion Accelerographs
Two strong motion accelerogaphs were installed on Guadalcanal by theMinistry in late 1984 They will be responsible for maintaining the instruments but have requested Cornells assistance in analyzingaccelerograms obtained during their operation The high level of shallow activity near Guadalcanal suggests that a significant number of strong-motion records will be obtained during the lifetime of the instruments
Related Scientific Programs
The Ministry also carries out related research programs in regionalgeology minerals assessment groundwater studies and so on Extensive marine surveys have been caried out in the Solomon Islands by the USGeological Surveys Resource Assessment Program Local offshore surveyshave been carried out through CCOPSOPAC A tide gauge is maintained bythe Solomon Islands Hydrographic Unit Six proton-precession magnetometers are operated in the Solomon Islands by the Queensland University (Australia)
Critical Facilities
Over 90 of the Solomon Islands population remains in rural areas The major development is in Honiara the administrative and commercial center of the country Honiara (pop 15000) is the major shipping center of the country and now includes several multistory buildings
105
Earthquake Preparedness Programs
The Solomon Islands implemented a National Disaster Plan in 1980 subsequently revised in 1982 The Plan gives the Ministry for Home Affairs and National Development overall responsibility for coord~lation of efforts in earthquake volcanic and tsunami disasters Operational relief effort are carried out through the Disaster Operations Coordinator and the Provincial governments
The government has adopted the most stringent earthquake building code (Zone A) from New Zealand for multistory building construction in Honiara Implementation of these guidelines continues to be a problem One multistory building in Honiara (Australian High Commission Building) was severely damaged during the 1984 earthquake Some efforts have been made to develop small-scale earthquake-resistant building techniques appropriatefor rural areas The Pacific Islands Development Program organized a model house construction and workshop during early 1984 A modest outreach program has developed through the school system adult education programs and the government broadcasting company
PAPUA NEW GUINEA Seismological Facilities
The government of Papua New Guinea has made an extensive commitment to earthquake and volcanic hazard mitigation through construction of a national network of seismographs and accelerographs (Figure A3) A ten-station national network of seismographs is monitored by the Port Moresby Geophysical Observatory (Department of Minerals and Energy) Three of the remote stations are telemetered to Port Moresby via microwave links four stations operate as permanent field stations and two are operated at temporary sites on outlying islands Port Moresby is presently the site of a Worldwide Standard Seismic Station that has operated since 1958 The national network reports arrival times to the US Geological SurveysPreliminary Determination of Epicenters and the International Seismological Centre but does not routinely locate events independently
In addition to the national seismic network the Rabaul VolcanologicalObservatory operates seven seismic stations near active volcanoes around the country and a nine-station telemetry network around the Rabaul Caldera Bougainville Copper Limited opeates a 5-station network on Bougainville Island (North Solomons Province)
Strong Motion Accelerographs
The Port Moresby Geophysical Observatory maintains a national network of thirteen strong motion accelerographs distributed in the highly seismic areas of the country (Figure A3) This includes a closely spacedfour-station network around the Rabaul Caldera A single strong motion accelerograph is situated on Bougainville Island and is maintained byBougainville Copper Limited The network uses Kinemetrics SMA-I and New Zealand DSIR MO-2 instruments and has recorded tens of accelerograms since its establishment in 1967 The Observatory ispresently trying to to establish an engineering seismologist position to analyze the accumulating data and to further upgrade the accelerograph network
I I I I I I I I I I
Re--o -joso shy
Mooo u J4D (Ro-js
bull~~vASeA saxA+ Samp-cUong sloon
(twu lueoaott koRowq (KvG) jjj ccurodAj a~OlF
Accv~tj (8~Cli
Raboul (PART 2bLo(MOG) C GoTo and -4-A Duke of Tok
vie W~~IiTUI = a
Rogno SGA Kowumbukae0
lebub-gn ITPAc l-O MARCH agno BGAI
Tank ( F -goono PAAl
Coo Glooclslb Island I OSOGRAP SEISM A-D ACCELEOGR -
_____ L I IS IIsI I I
IPUGI
PAPUA NeW GUI NEeAr rp n w k
hTTWORKS MARCH 1384
IG -nol 1v
Figure A3 Papua New Guinea seismograph and accelerograph networks a
107-108
Related Scientific Activities
In addition to the Geophysical Observatory the Department of Mineralsand Energy includes the Geological Survey of Papua New Guinea The Surveyundertakes a wide range of geological investigations including regionalgeological mapping petroleum and mineral exploration engineering andenvironmental geology and energy resource development Offshore surveyshave been carried out through CCOPSOPAC as well as American and Austrrlianresearch vessels Continuous monitoring of the magnetic field is carriedout by the University of Queensland (Australia) Ten tiltmeters have beendeployed by the Volcanological Observatory to monitor ground deformation near Papua New Guineas active volcanoes Four of these instruments are deployed around Rabaul Caldera
Critical Facilities
Papua New Guinea is the most developed of the island countries of theSouthwest Pacific with a population of over 3000000 and extensive urbandevelopment The capital city of Port Moresby has a population of over 130000 with major multistory construction in the downtown area a majordeep water harbor and significant commercial and industrial activity in thePort Moresby area There is significant development as well in the smaller towns of Rabaul Lae Madang Wewak Goroka Mount Hagen Wau BuloloDaru and Kerema Major hydroelectric schemes have been established on theRamu and Rouna rivers with additional hydroelectric plans at various stages of evaluation and development Extensive mineral development hastaken place in the North Solomons Morobe and Western provinces of PapuaNew Guinea Extensive natural gas and limited oil deposits have beenlocated these may become commercially exploited in the near future
Earthquake Preparedness Programs
Papua New Guinea has a long history of earthquake and volcano-relateddisasters A national disaster program was established in 1981 and provides for a National Disaster Emergency Committee which formulates emergency government policy and a Disaster Civil Defence Committee which is responsible for implementation of short-term relief efforts Theprovincial governments are given major responsibility for initial coordination and assessment of disasters assistance is subsequentlyrequested from the federal government for major disasters Many of theprovincial governments have not revised preparedness plans since thecolonial period However particularly intense effort has been directed inEast New Britain province because of the imminence of a potentiallydestructive volcanic eruption in Rabaul Caldera
The town of Rabaul (pop 15000) is a major commercial center forPapua New Guinea and is situated directly within the caldera of an activevolcano A relatively small eruption took place at a secondary eruptivecenter near Rabaul in 1937 killing over five hundred nearby residents andforcing the evacuation of the town In order to avoid a repeat of such adisaster the government established the Volcanological Observatory withfour full-time volcanologists and real-time earthquake location andanalysis of tilt data A drastic increase in volcanic seismicity in mid-1983 led to a volcanic hazard alert and intensification ofseismological and ground deformation studies around Rabaul In addition
109
the alert allowed the provincial and national Disaster Emergency Committees to make extensive evacuation and relief plans for a possible eruption at Rabaul including preparation of a new airstrip improvement of roads and emergency water supplies communications systems detailed evacuation plans education programs and so on To date there has been remarkable cooperation of efforts by provincial national and overseas officials to mitigate the potentially devastating effects of a volcanic eruption at Rabaul
Papua New Guinea is the only country of the developing nations of the Southwest Pacific to have devised its own seismic zoning system (Figure A4)
The Nationwide Housing Code for Papua New Guinea sets up a four-level system of seismic loading oriented toward moderate-sized (to 8 stories)buildings Major buildings require independent dynamic analysis usuallycarried out by overseas engineering firms Seismic Zone 1 of the HousingCode is among the most stringent earthquake loading codes in the world and includes the town of Rabaul and much of the East New Britain and North Solomons provinces Seismic zone 2 includes the towns of Lae Wewak and Madang and is approximately equivalent to New Zealand Zone A or California loading designs The capital Port Moresby is in the lowest seismic zone (4) but buildings constructed there still require designsallowing for significant lateral loadings
Earthquake education is handled through the National Radio Government Printing Office the Civil Defence Department and the school system with information supplied by the Geophysical and Volcanological Observatories A particularly intense education effort has been mounted in Rabaul where educational materials have been produced and distributed in three languages and public involvement in preparedness plans has been emphasized
NEW ZEALAND
While New Zealand cannot be considered one of the developing countries of the Southwest Pacific its seismology programs have been responsible for much of the observational data available for the entire region Because of its importance to the other national seismology programs we briefly review here the New Zealands observational facilities Its extensive programs in engineering seismology its critical facilities and its earthquake preparedness programs will not be covered here
National Seismic Network
Seismological facilities in New Zealand are maintained by the Geophysics Division of the Department of Scientific and Industrial Research (DSIR) in Wellington The natioal standard seismograph network presentlyconsisting of thirty short-period stations is shown in Figure A5 The network routinely locates all earthquakes of ML gt 38 within New Zealandand earthquakes with Ms gt 50 for the region within 100 of New Zealand Arrival time data are routinely transmitted to the US Geological Surveyand the International Seismological Centre The events located by the network are reported in the annual New Zealand Seismological ReportSeveral hundred earthquakes are located by the DSIR national network each year
0 - - - --- - - - -
FIG 13
1SEISMIC ZONES FOR BUILDING CONSTRUCTION
- -- IN PAPUA NEW GUINEA
i 1d - - - - - _
(I -lt 53-0Fef cs r i eat a 1 982))j --_ _ -- r L - - --- a a V bull
N i - O(r-tIbd t
__ __ Po --shy
-- -- -
[i ~5- E I
Is-O I ___ oh - - --- - --shy-- shy
4 __J ft - - I- S 4 E jshy
_ _ _-i - _ j -z -
_____ _U 511
ZONE CLASSIFICATION OF CITIES I lZONE 30 1 I 3 1 153--ZONE3 4u shyW-t -~- 6--v 4- bull -
I == 1 --by- Ll _
Figure A4 Seismic zones for building construction in Papua New Guinea (jury et al 1982)
CAPE REINGA
ONERAHI
GREAT BARRIER AUCKLAND - C
5OCT 1914 WHITE ISLAND
KARAPIO EAST CAPE 0r WHAKATANE 15 WAIRKEIp I TUI 28 JUN 1921 t SEP19_-
CHATEAU TARADALE N U 2 FEB 19317 1897 1a Ju DEC 84
MANGAHAO 5 MAR 934 8 AUG 1904 - CASTLEPOINT ( A 1942
COs ELLINGTON IS5CT 18408 2C18BJN562 JAN 1855 23 MAY 1989
Figure A5 Seismograph stations of the national network (left) and the distribution of large shallow earthquakes (right) in New Zealand From Seismological Observatory Wellington (1980)
112
The network is augmented by long-period instruments operating atKaropiro Roxburgh and Wellington DSIR also operates a three-componentborehole seismometer in Wellington as part of the Seismic Research Obseervatory network supported by the US Geological Survey
Stations in Outlying Territories
New Zealand has also taken an important lead in operating seismographstations in outlying areas of the Southwest Pacific These stations havebeen extremely important in hypocentral control for the Tonga - Kermadec seismic zone and for nuclear event detection in the Pacific DSIR operates three 6 -component Worldwide Standard Seismograph stations at Afiamalu (Western Samoa) Raratonga (Cook Islands) and Scott Base (Antarctica) Short-period stations operate at Apia (Western Samoa)Campbell Island (New Zealand) Chatham Islands (New Zealand) Nadi (Fiji)Nime and Raoul Island (Kermadec Island New Zealand) Readings from these stations are routinely reported to PDE and ISC for global earthquake location
Wellington Network
A small-aperture high-gain seismic network is operated around Wellington an area of greatest seismic risk in New Zealand The stations are telemetered by radio or telephone link to the central recording site The network now consists of eleven stations Earthquakes are presentlydetected by a microprocessor-based Automatic Seismic Monitor and automated location processing is expected to follow The network routinely locates events with ML gt 15
Pukaki Network
A second microearthquake network has operated around Lake Pukaki ahydroelectric project in the South Island New Zealand The network wasestablished in 1975 to monitor reservoir-induced seismicity associated with impoundment of the reservoir The network consisted of nine stationsand was intended to operate on a temporary basis It has been closed since early 1984 with several of the stations continuing to support the national network and to monitor any future reservoir-related activity
Related Seismology Research
In addition to its regular observatory seismology the GeophysicsDivision has an active seismology research program Their studies have focussed on theoretical seismology earthquake prediction crustal structure of New Zealand historical earthquake studies nuclear eventdetection seismic risk in New Zealand strong motion studies and volcanic seismology The monitoring of active volcanoes is closely coordinated withcrustal deformation monitoring conducted by the Earth Deformation Section of the New Zealand Geological Survey
The New Zealand strong motion accelerograph network now consists of225 instruments operated by the Physics and Engineering Laboratory of DSIR Most of these instruments are of a New Zealand design (Mechanicaland Optical Accelerographs) and analog records are made on photographicfilm Three digitally recording accelexographs are now in operation in New
113
Zealand and the MO records are digitized for computational analysisAnalysis of this empirical data is being used for a revision of New Zealands building codes
114
REFERENCES
Berryman K 1979 Seismotectonic zoning study of the Fiji IslandsEarth Deformation Section Report 70 Wellington NZ Dept Sci and Indust Research 40 pp
Franco AB MP Hamnett and J Makasiale 1982 Disaster Preparednessand Disaster Experience in the South Pacific Pacific Islands Developshymental Program Honolulu 380 pp
Geological Survey of Papua New Guinea 1979 Information Booklet Port Moresby Dept Minerals and Energy 12 pp
Government of Western Samoa 1977 Apia Observatory 1902-1977 ApiaApia Observatory 8 pp
Jury RD JP Hollings and IAN Fraser 1982 The development ofseismic zones and the evaluation of lateral loadings for earthquakeresistant design of buildings in Papua New Guinea Bull NZ Nat Soc for Earthq Engr 5 123-140
Lowenstein PL 1982 Problems of volcanic hazards in Papua New GuineaGeol Surv Papua New Guinea Rept 827 Port Moresby Papua New Guinea 62 pp
McCue KF and ID Ripper 1980 The Papua New Guinea Strong MotionAccelerograph Network Geol Surv Papua New Guinea Rept 807 Port Moresby Papua New Guinea 13 pp
Mineral Resources Department Seismology Section 1983 National activityreport Fiji Submitted to Session IX Intl Coord Group for TsunamiWarning System in the Pacific Min Resources Dept Fiji Note 333Suva Fiji 4 pp
Parliament of Fiji 1984 Mineral Resources Department Annual Report forthe Year 1982 Parliam Paper No 13 Suva Fiji 90 pp
Power CA 1978 Earthquake risk in Fiji and the problems of earthquakeengineering Presented to the Fiji Society 17 pp
Prevot R and JL Chatelaiu 1983 Seismicity and Seismic Hazard in Vanuatu ORSTOM Rept 5-F3 Noumda 51 pp
Ripper ID 1982 Accelerogram library Geol Surv Papua New Guinea Rept 198211 Port Moresby Papua New Guinea 44 pp
Seismological Observatory Wellington 1980 The earthquake problem in NewZealand Alpha DSIR Extension Information Wellington NZ 4 pp
Smith WD 1979 Seismology and related research in New Zealand1975-1978 NZ DSIR Information Series No 140 30 pp
115
Smith WD 1983 Seismology and related research in New Zealand 1979-1982 Seismol Observatory Wellington Bull 276 32 pp
Solomon Islands Government 1982 National Disaster Plan 1982 Honiara Solomon Is 14 pp
116
A Rahimin A Simpson R Holmes P Rodda R Singh I Everingham K Draunidalo G Shorten M Mehrotra J Booth J Campbell
R Carter R Byrne G Gauss D Rubin
S Tongilava
D Tappin S Lemoto T Tukia
C Clarke
R Campillo R Foy T Lee J Rdcy J Chatelain R Prdvot
L ioane S losa A Titimaea
S Danitofea
D Tuni R Walshaw J Vunagi D Gwyun
INFORMATION CONTACTS
FIJI
Director Mineral Resources Dept Asst Director (MRD) Princ Geol OffshoreSeismol (MRD) Princ Geol Inform Services (MRD) Principle Geophysicist Senior Seismologist (MRD) Seismologist (MRD) Senior Engineering Geoogist (MRD) Struc Engr Suva City Council Civil Engineer Suva Engineering Geologist A Gibb amp Partners (Monasavu) Marine Geologist (CCOPSOPAC) Marine Geologist (CCOPSOPAC) Marine Geologist (CCOPSOPAC) Marine Geologist (CCOPSOPAC)
TONGA
Superintendent of Lands Surveys and Natural Resources Government Geologist (LSNR) Land Assessor (LSNR) Government Planner (LSNR)
VANUATU
Director Dept Mines Geology and Rural Water Supplies Director ORSTOM Mission Engineer ORSTOM Civil Engineer Public Works Dept Director ORSTOM Dept Geol and Geophys (Noumda) Seismologist ORSTOM (Nouma) Seismologist ORSTOM Nouma)
WESTERN SAMOA
Director Apia Observatory Senior Seismologist (AO) Geologist (AO)
SOLOMON ISLANDS
Chief Geologist Ministry of Lands Energy and Natural Resources
Senior Seismologist (MLENR) Senior Geologist (MLENR) Ministry of Home Affairs and National Development Civil Engineer Public Works Department
117
PAPUA NEW GUINEA
K Doble Chief Geologist Geological Survey I Ripper Chief Seismologist Geophysical Observatory G Seidel Information Officer Volcanological Observatory G Anderson Engineering Geologist Geological Survey J Wilkins Civil Engineer Dept of Works and Supply
NEW ZEALAND
W Smith Director Seismological Observatory Wellington
UNITED STATES
M Hamnett Pacific Islands Development Program G Burton Director Pacific Tsunami Warning Center R Sillcox Seismologist (PTWC) G Pararis-Corayannis Director International Tsunami Information Center
118
APPENDIX V TSUNAMI SAFETY RULES
1 All earthquakes do not cause tsunamis but many do When you hearthat an earthquake has occurred stand by for a tsunami emergency
2 An earthquake in your area is a natural tsunami warning Do not stayin low-lying coastal areas after a local earthquake
3 A tsunami is not a single wave but a series of waves Stay out ofdanger areas until an all-clear is issued by competent authority
4 Approaching tsunamis are sometimes heralded by a noticeable rise orfall of coastal water This is natures tsunami warning and should be heeded
5 A small tsunami at one beach can be a giant a few miles away Dontlet the modest size of one make you lose respect for all
6 The Tsunami Warning System does not issue false alarms When anocean-wide warning is issued a tsunami exists When a regionalwarning is issued a tsunami probably exists The tsunami of May 1960killed 61 people in Hilo Hawaii who thought it was just another false alarm
7 All tsunamis--like hurricanes--are potentially dangerous even thoughthey may not damage every coastline they strike
8 Never go down to the beach to watch for a tsunami When you can seethe wave you are too close to escape it
9 Sooner or later tsunamis visit every coastline in the PacificWarnings apply to you if you live in any Pacific coastal area
10 During a tsunami emergency your local Civil Defense police andother emergency organizations will try to save your life Give them your fullest cooperation
Unless otherwise determined by competent scientists potential danger areasare those less than 50 feet above sea level and within 1 mile of the coastfor tsunamis of distant origin or less than 100 feet above sea level andwithin 1 mile of the coast for tsunamis of local origin
10
1600 E 1700 180 W 1700
I 0 s ee 0 0o
2e 01
6 S
20
30S $
S4b
0
3040 30
4S
400
1 2 40
150 1600 E 1700 I80 170 W
Figure 5 Regional setting of the Southwest Pacific associated with the plate boundaries in this region
Shallow seismicity
relationship of the seismicity to the trench islands and back-arc region
(Figure 6) In Vanuatu earthquakes occur from near the surface to
approximately 300 km depth The earthquakes systematically deepen
eastward from the New Hebrides Trench forming a narrow dipping plane
under islands located in the central portion of the arc and intermediate
depth earthquakes occur-progressively farther eastward Large (Ms gt 7)
earthquakes but few great (Ms 7 34) earthquakes have occurred along
the island arc as a result of the subduction of the Indo-Australian plate
In spite of the anomalous protrusion of the upper plate in the central
part of the arc the Benioff zone and convergent plate boundary appear to
be relatively uniform in configuration and continuous along the entire
length of the arc (Pascal et al 1978 Isacks et al 1981) The linear
distribution of the islands of Vanuatu and their location so close to the
main interplate thrust zone of the convergent plate margin result in a
geometry that is uniquely suited for subduction zone studies in comparison
to most other subduction zones on earth This also results in a unique
earthquake hazard in central Vanuatu Behind and eastward of the New
Hebrides island arc lies the North Fiji Basin (Figure 4) where the presence
of shallow seismicity (Figure 5) fresh basalts little sedimentation
(Karig and Mammerickx 1972 Luyendyk et al 1974) and high values of
heat flow (Sclater End Menard 1967) indicate active tectonism The Vitiaz
Trench forms the northern boundary of the North Fiji Basin and represents
the site of an old subduction zone that existed before the modern New
Hebrides arc formed Subduction (of the Pacific Plate) ceased at the
Vitiaz Trench sometime in mid-Miocene (Falvey 1978) or earlier (Chase
12
NEW HEBRDES VOLCANIC TRENCH ARC CORIOLIS
SW 4 TROUGH NE 00Z_shy
- _shy 2
-vQ 100- DESCENDING
PLATE ~ ~SEISMICf
ZONE -Ishy
200shy
300 00 100 200
DISTANCE KM
Figure 6 A schematic cross secion showing the region where shallow and intermediate-depth earthquakes were recorded (inclined lines) and the inferred geometry of the descending plate beneath the southern New Hebrides arc The inferred geometry of the interplate thrust zone is partly based on the slip vectors (short solid lines) of the shallow thrust-type focal mechanisms The Moho discontinuity of the overriding plate estiated from refraction and gravity studies is also shown (Condert et a 1981)
13
1971 Mitchell and Warden 1971 Karig and Mammerickx 1972) and resumed at
the modern New Hebrides Trench with the opposite polarity (Indo-Australian
Plate underthrusting beneath the Pacific Plate) Deep earthquakes are
still recorded near Vanuatu that result from this episode of subduction
The New Hebrides arc has migrated away from the trend of the older Vitiaz
Trench to its present position (Hamburger 1986)
Geolc-ical Setting
The islands of Vanuatu are volcanic in origin with older islands
fringed or capped with reefal limestones In the central region of the
arc the single chain of islands gives way to a more complex structure
(Figure 7) (1) the eastern Miocene-Pliocene chain with tholeiitic and
calc-alkaline volcanoclastics includes the islands of Maewo Pentecost
Efate and parts of Epi (2) the slightly older western Oligocene-Miocene
chain includes the islands of Santo Malekula and the Torres and (3) the
central late Pliocene-Recent portion contains active aerial and subaerial
alkaline volcanics (Mitchell and Warden 1971) The volcanic rocks of the
western chain are similar to slightly more acidic composition than the
eastern chain Local outcrops of ultramafic rocks are found in several
places in the eastern chain
REGIONAL BACKGROUND INFORMATION
Historical Earthquakes in the Vanuatu Region
An accurate evaluation of the earthquake hazard for a particular
region includes a survey of historical seismicity in the region in
question Historical earthquakes are important because they help to better
determine the potential size frequency of occurrence and possible effects
of future earthquakes
14
170
Tinakula
xd
Torres Is e
Vat Gonoi
Vanua Lava
b Gauagp Merig
- --- -4
- --- Santo Moewo NOR TH
DENTRECASTEAUX FZ ===== Pentecost FIJI
-- tMae ku v Ambry m BASIN
-p -E
0 ioo 200 Km
o Erromang -A IWA
U) TANNA FUTUNA -A
~ANEITYUMOVOLCANIV ASSOCIATIONS 7 UPliacene- Recen- (Central Chain) UMiocene- L Pliocene
Effi (Eastern Belt) ~UOIlgocene - MMiocene
1plusmnZ (Western Belt) Di ofDip ofTune Matthow TECTONIC ELEMENTS selomic zoneHunter
1r~7Uplifted volcanic ridge
~B c- bsn Major fracture zone - -Bock -aorc basin NF -
Zone of flexuring Sedimentary basin and faulting
I I K KIRI
Figure 7 Geology of New Hebrides Arc (Carney and Macfarlane 1979)
15
The earliest reports of earthquakes in the Vanuatu region is a series
of earthquakes which began on 28 March 1875 and were felt on Anatom
(Mercalli intensity VIII-IX for the largest event) and Erromango and in the
Loyalty Islands of Lifou Mare and Ouvea (lida et al 1967) On 10
January 1878 a tsunamigenic earthquake associated with the eruption of
Yasowa Volcano Tanna was felt in Port Resolution Tanna Another strong
tsunamigenic earthquake occurred on 11 February 1878 associated with
another eruption of Yasowa Volcano
Since 1900 5 great earthquakes (Ms gt 7 34) and 52 major earthquakes
(7ltMs lt 7 34) have occurred along the arc (McCann 1980) However the
great earthquakes that occurred near the turn of the century are not
well-constrained in size or place and their magnitudes were probably overshy
estimated (due to the way in which the magnitudes were calculated)
Moderate-sized earthquakes are distributed throughout the arc (Figure 8C)
but the largest events are more clustered especially in the northern
portion of the arc (Figure 8B Marthelot 1983 and Figures 9A and 9B
McCann 1980) There is a distinct gap in the seismicity at the point
where the dEntrecasteau Ridge intersects the line of the trench
Because the occurrence of shallow earthquakes near population centers
are of greatest concern for earthquake hazard in this report we have
focussed on shallow earthquakes near the main islands of Santo Malekula
and Efate in the central portion of the arc Maps of shallow seismicity
(depth lt 70 km) of the region based on the US Geological Surveys
Preliminary Determination of Epicenters (PDE) catalog for the period
1961-1981 are shown in Figure 8B and 8C (from Marthelot 1983) This
with bewen70 and10 Kin sqars betee 10deth andK2N00Kin FriaguresMpete island)arceV00anuat (ail) hongnrhto the argha
std itriagebetween00 and 3e0vkn locte (1) the acnceaoneo largesxise of thereshlwents nthe trnhahrcal diappeanras i thetareshalwents nthe norheialof the arnhh ih thetarch thapconraspuato he acthe reanqig mapis ho the dstrutiorn oaf2thepuxaprton ofearcTive reanqiet regis inothe dsorutrnhaf2the
haviencanue largetthand5an3) earthquakeintermediate-depthofrnestshanppresencanue of intermediate-depth3 ctivitye
17
9 194 (74) s-AFTERSHOCK ZONE
ft 1 (827 _RECOMFUTED OR 2RECENT EVENT
1914 ) EPICENTER
1944(7) 0-FROM
GUTENBERG AND (73) RICHTER
1 7 bull__ EPICENTER FROM RICHTER
192 (7O)(21 ( i9 1945()2)
j50 21926 (71)150 01928(71)
1946(70) 1927 (71)
1903(75)
1944(73) 1925 (76) 2 18754
~ 1878
200 1920(80O 94943(72)
4875 1923(70) 1944(72)
70737 1z945 I941943(757372) shy
1904 (84)
1928(75) 1926(70)
1917 (71)
250 6 I 165 0E 1700 1750
Figure 9A Map showing locations of large (Ms gt 7) and great (Ms gt 7 34)historical earthquakes along the New Hebrides Trench for the time period1900 to 1950 (McCann 1980)
18
I I
Io 953 1963 (73 73)
1966(7473)
19617(70)
9195304) 20 I 1972 (71)
651965(70)197
7150 (7 7 2 1958 (72)
--- 1965 197(71)-
F7873s) od
19616 1 A
2 00 1950 (70727072)
ID
165degE deg170c 1750 Fig~ure 9B Map showing locations of large (Ms gt 7) and great (Ms gt 7 34)historical earthquakes along the New Hebrides Trench for the time period1950 to 1979 (McCann 1980)
19
figure illustrates the dense concentration of interplate events close to
and landward of the New Hebrides Trench
Very little information exits concerning the effects of strong
earthquakes prior to 1961 apart from a few sketchy damage reports The
location accuracy of earthquakes was improved in 1961 Before this time
locations were located to the nearest tenth of a degree and magnitudes were
considerably over-estimated The last major seismic episode of interplate
slippage in central Vanuatu occurred in a sequence of earthquakes in August
1965 (Figure 10) which accumulated a total seismic moment equivalent to a
single magnitude Ms - 77 event (Isacks et al 1981) The 1965 Santo
earthquakes caused significant damage to buildings wharves and bridges in
Luganville on Santo Island and major damage to buildings and water tanks in
Norsup and Sarmet on Malekula Island (Pr6vot and Chatelain 1983)
Coseismic tectonic uplifts on Malekula Island were also measured in
association with the 1965 earthquakes (Figure 10) Over 1 meter of uplift
was detected for the 1965 earthquake sequence (Taylor et al 1980)
Only one sequence of earthquakes has been relatively damaging since
the Cornell-ORSTOM network began operating in 1978 The Mere Lava
earthquake (Ms 61) occurred on 12 May 1980 at 14800S and 16782degE and a
depth of 23 km The worst damage from this event was caused by landslides
SUMMARY OF FACILITIES AND PROGRAMS
Critical Facilities
Port Vila with a population of 15088 in 1979 is the administrative
and commercial center of the country There are a number of multistory
buildings in the capital and most of Vanuatus tourist industry is located
2
1970
140- )O AN OCT
JAN 19731974 0 00-
MAY 0
0--- 1965
S 9000 97150K 15deg AU61973 NOVV
1974
600 x OCT
4 1971 AUG 01966
171965
160shydeg 1 - - 2000
Ms S73 -77
63 -67
0
0
58-62170 1- 1 -_0 1660 1670 E 1680
Figure10 August 1965 earthquake sequence (from Isacks et al 1981)
21
in and near Port Vila A large shipping wharf is located near the center
of the city on Vila Bay
Apart from Port Vila the only significant development in Vanuatu is
at Luganville on Santo Island (pop 5116 in 1979) It remains an
important economic center for the country with agricultural processing and
shipping facilities located there There are several three- and four-story
buildings in the center of Luganville
Earthquake Preparedness Programs
As of late 1983 the Government had requested the assistance of a
consultant from New Zealand to help provide uniform building codes for the
country The Public Works Department enforces New Zealand seismic zone B
codes to construction of public buildings Large buildings for the most
part are designed by overseas engineering firms and generally comply with
the earthquake design standards Smaller buildings are generally designed
close to the New Zealand loading specifications but there continues to be
great difficulty in supervising construction projects
There is no large-scale earthquake education program in Vanuatu
Materials have been prepared by ORSTOM seismologists for distribution to
teachers public officials and planners involved in earthquake hazards
(eg Prdvot and Chatelain 1983)
Seismological Facilities
Seismological observations are necessary to the accurate location
study and ultimate prediction of earthquakes Seismic stations were first
established in Vanuatu in the mid-1960s by the French Office de la
Recherche Scientifique et Technique Outre-Mer (ORSTOM) Staion PVC in
Port Vila has operated continuously from 1964 to the present while LUG in
22
1680 1700140 1660 1670 1690 deg 140
GAUAP FIJI
PLATEAU 0
deg ~ HOG MAEWO -15 150 AOBA
2000 SANTO AB
MAP PENTECOST
160 A MT AM8160A= A 13AMBRYM-16
DENTRECASTEAUX OJi= LMP EPIP1FRACTURE ZONE
170 EME 170 EMAINGOUNA
NGAoS L E_ EFATE
RTVDvpP 18o 0shy180 -
o -180 z 0
o ERROMANGO
190 - Rk90R-190
TAN AN~o 4 FUTUNA
AUSTRALIAN oshy0 0TANNA
200 PLATE ANATOM 0 200
0 0
1650 1660 1670 E 1680 1690 1700
Figure 11 Map showing the seismograph stations in Vanuatu Circles arestations telemetered to the base station PVC on Efate island andunderlined stations have two components--one horizontal and one vertical The triangles are older ORSTOM stations INH and LUG are no longeroperational Strong motion instruments are located at SWB and LMP onMalekula island DVP and PVC on Efate island and LUG on Santo island
Luganville Santo operated through 1980 A third station on Tanna Island
(INH) operated through 1978 Cornell University began cooperative field
programs with ORSTOM in 1975 with a microearthquake experiment on Santo
Island An ocean-bottom seismograph experiment was carried out in southern
Vanuatu in 1977 and in central Vanuatu in 1978 The Cornell-ORSTOM
telemetered seismic network was established in 1978 and has operated
continuously since that time The seismic network now includes 19
telemetered stations (Figure 11) to date over 20000 earthquakes have
been recorded by the network A permanent ORSTOM mission is now based in
Port Vila and takes primary responsibility for day-to-day maintenance of
the network The availability of continuous earthquake monitoring in
Vanuatu is an important component of any earthqi-ke or -arthquake hazard
study for the country Figure 12 shows the seismicity level (magnitudes gt
4) recorded by the Worldwide Seismograph Station Network (WWSSN) Compare
these results with the increased sensitivity (magnitude gt 25) and location
accuracy of the regional Cornell-ORSTOM network which is shown by better
definition of seismic zones in Figure 13 These network data clearly
define the heterogeneous distribution of seismic activity in the central
portion of the arc
These seismological facilities are complemented by studies of ground
deformation using seven bubble-level tiltmeters a two-component longshy
baseline water tube tiltmeters and two levelling arrays
Strong-Motion Accelerographs
As part of the present program of seismic hazard evaluation in
Vanuatu Cornell and ORSTOM have installed five strong-motion
accelerographs on the islands of Efate Malekula and Santo (Figure 11)
__
5 t~j24
0 - 70km
o0 a 0 70-150km 0 C J
5 S S - 0 0 shy
-150-300km
a 0 o 300-700km
0
15S 4 -
bull7 -06 ----
SS
bull bull S
bull iilIIle
Figure I9 1p 4D JE l o shybull =r-
5 NO a~ 40
20 1 a
~ ~- 20Smbull 5m
- S r S st
16 E5 170 E~
165EI bull =W
Figre 2 Epcenresde sesme lcasspa er ea onia de sttos-16-1) PDE ocaionsofvent (167-182) vtand 1983)-- ha-la
25
PROFONDEUR - DEPTH 0 - 70 Km
E
05 0
EE
03 4 3
0I
Figur 13Siete e ~se bulloai~pa le rieuOSO-ONEL(918)
00i
oA
Fi3r1N
a
0--
E iete e e Icls sp rl dspeuOR T M C R E L(9 8 1 8 )
26 These acce2erographs complement the other instruments being used to study the seismicity in the region The accelerographs record the ground accelerations at a particular site fiom an earthquake strong enough to trigger the instrument To date these instruments have already been triggered by five moderate-sized shallow events and will be used to provide a basis for prediction of local ground motion induced by large interplate earthquakes in Vanuatu The high level of seismicity along this plate boundary suggests that a valuable baseline of strong-motion data can be collected in a relatively short period of time
Related Research Programs
The seismology program is carried out in cooperation with the Vanuatu Department of Mines Geology and Rural Water Supplies They are responsible for regional geology studies resource assessment detailed mapping and hydrological activities In addition ORSTOMs geology and geophysics department based in New Caledonia carries out an extensive
program of investigations covering submarine morphology marine geology and geophysics island geology and crustal structure The US Geological Survey has undertaken a series of detailed marine studies in the central and northern portions of the island arc using the research vessel SP Lee (1982 and 19F4) A detailed hydrographic survey was carried out in coastal waters by Australian researchers A tide gauge is maintained by the ORSTOM
mission in Port Vila (Pr6vot and Chatelain 1983)
PREVIOUS STUDIES
Seismicity Studies Along the New Hebrides Arc
Seismicity studies of the New Hebrides Arc by Isacks et al (1981) found that major bathymetric and structural complexities divide the central
27 part of the arc into segments approximately 100 km long The segment near
Santo and northern Malekula islands ruptured during two complex sequences
of events occurring in August 1965 and in late December 1973 through early
January 1974 (Table 1) In contrast the segments near the southern part of Malekula and Efate islands may not have ruptured during the past 75
years Moreover between southern Malekula and Efate islands the
orientation of the horizontal compressive stress within the upper plate
changes from a direction perpendicular to the arc to a more complex and
variable pattern found in the southern portion of the arc
Since the Cornell-ORSTOM network was established in 1978 10 moderate
(58 lt Ms lt 7) earthquakes have occurred within the network (Table 2) A
description of the seismicity recorded by the network follows
(A) Fore- and Aftershock Sequences of the August 1979 and July 1981 Main
shocks
(1) 17 August 1979 Sequence Figures 14A and 14B show earthquakes in the foreshock sequence of the 17 August 1979 earthquake The spatial and
temporal development of this activity was described by Isacks et
al [1981] This section provides a more detailed analysis of a longer
period of time A small zone near the epicenter of the 17 August
earthquake was intermittently active during late June - early July 1979
(Figure 14A) The more immediate foreshock sequence (Figure 14B) started
eight days before the main shock and consisted of five groups of events
Each group of foreshocks began with an earthquake having a magnitude
between 42 and 49 and each was followed by a number of small
aftershocks The first foreshock cluster was located just landward of the
trench Each successive cluster migrated in time northeast toward the
Relocations with all available teleseismic and local data for 1978-1981events except 27 Jan 1979 [Bulletin of the International SeismologicalCentre (ISC) location] remaining locations based on local data only 2Ms surface-wave magnitude taken from Monthly Bulletins of the PreliminaryDetermination of Epicenters (PDE)3MO seismic moments reported by Chinn and Isacks [1982] or in Monthly
Bulletins of the PDE (1981-1985 events)
4Mw is calculated from M0 by Mw - (115) x (log(Mo)-161)
17
0 0 0
0CD 00 aVm01 83 0 0 0
00 0 00 3
0 00 0
000 0 0
167 E 168 0 E
169 167 E
168 0 0
169 167 E 0 1
168 169
Figure 14 (A) Early foreshocks of the 17 August 1979 main shock (shown as a filled square) that occurredat the end of June to the beginning of July 1979 Island contours and 6 km bathymetry are shown (B) Lateforeshock activity preceding the 17 August 1979 earthquake Foreshocks migrated from the trench toward thelocation of the main shock (C) Foreshocks preceding the 15 July 1981 earthquake 0o
31 epicenter of the main shock The foreshock sequence ended with a very
intense concentration of seismicity near the 17 August 1979 main shock
epicenter The final foreshock cluster began eight hours before the main
shock and continued until the region became seismically quiet three hours
before the main shock The main shock occurred at the northeastern end of
these clusters
The development of the aftershock activity in Figure 15 is shown for
two time intervals during the nine days following the main shock During
the first day the aftershocks were initially located close to the epicenter
of the mainshock and rapidly expanded towards the west At the end of this
day aftershocks occurred as far north as the site of the 26 August main
shock and as far south as about 181degS (Figure 15A) Most of the increase
in the aftershock area occurred during the first day as can be seen by
comparing Figures 15A and 15B To the north the expansion of the aftershy
shock zone stopped near the epicenter of the next main shock of the
sequence that occurred nine days later on 26 August In the south aftershy
shocks were located in the same zone defined by the early foreshocks (also
see Figures 18C and 18D)
(B) 26 August 1979 sequence The development of the 26 August
aftershock zone (Figure 16) shows very similar patterns to the development
of the 17 August aftershock zone The activity developed very rapidly
during the first two days following the main shock (26 -- 27 August)
Then as in the case of the 17 August aftershock sequence the cumulative
sequence occupied an area larger by a factor of 2 or 3 than the one
expected for an earthquake of such magnitude [Isacks et al 1981] The
main shock was located on the southern edge of the aftershock zone -- the
aftershock activity developed to the north east and west only while the
aftershock zone of the 17 August event was nearly inactive (Figures 16A
16B) By 27 August aftershocks were located as far north as the epicenter
of the future 15 July 1981 earthquake and as far west as the New Hebrides
32
17
oA B
00
00
18 - 0o - 0 0
0 0
00
167 E 168 169 167 E 168 169
Figure 15 Maps of epicenters showing the development of the 17 August1979 aftershock sequence Format as in Figure 14 (A) 12H59M 17 August1979 to 12H59M 18 August (B) 13HOOM 18 August to 11H46M 26 August(to just before the 26 August main shock)
17
180 0 ogI0
0 00 o0
CP 00 000
0
0 0 0 8V
0 00 0 0(0 0
0 0
C0 0
C 0
167 E 168 I0
159 167 E 168
0
169 167 E
e l 0
168
_o
169
Figure 16 Maps of epicenters showing the development of the 26 August 1979 aftershock sequence Formatas in Figure 14 (A) 11H47M 26 August 1979 to IIH47M 27 August (B) IIH48M 27 August to IIH47M4 September (C) 1lH47M 4 September to IIH47M 26 October 1979
34
trench The aftershock zone ends very abruptly to the north along a
sharply defined east - west trending line which passes close to the
epicenter of the 1 September 1978 earthquake (Figure 18A) After the first
two days the level of aftershock activity decreased rapidly During the
entire period from the main shock to 14 September the aftershock zone of
the 17 August earthquake remained relatively quiet (Figures 16A 16B)
From 15 September to about mid - October both the 17 August and the 26
August aftershock zones were reactivated (Figure 16C) although the level of
activity was much lower than that during the days immediately following
each of the main shocks During this later period some activity occurred
in the back-arc region Northeast of Efate Island a small intense cluster
occurred in 1979 followed by shallow events spread around Efate Island
(Figure 16C) The level of activity then decreased and by the end of
October was back to a more normal background level of seismicity in the
entire region
The two aftershock zones of the 17 and 26 August 1979 earthquakes are
contiguous with some overlap in the area between the two epicenters (Isacks
et al 1981 Chatelain et al 1986) Chatelain et al (1986) show tiat
this area plays a key role in the development of the seismicity in ne
Efate region
(3) The 15 July 1981 earthquake In contrast to the 17 August 1979
earthquake no outstanding foreshock activity occurred prior to the 15 July
event Small clusters occurred on 5-6 and 12 July (see Figure 14C) Both
clusters included few events although each started with a magnitude (mb)
50 earthquake The larger of the two occurred on 12 July near the pending
main shock epicenter In contrast to the 17 August 1979 case no unusual
35
concentration of activity was noticed in the epicentral region during the
months immediately preceding the main shock Possible long-term precursory
activity may be the clusters observed in March and June 1980 and are
discussed in the next section
Figure 17 illustrates several outstanding features of the aftershock
sequence of the 15 July earthquake First an intense zone of activity
develops during the first day and continues throughout the sequence (Figure
17A) This zone is coincident with the aftershock zone of the preceding 26
August 1979 event (compare Figures 17A and 16) The southern boundary of
this activity is quite sharp and coincides with the region between the two
August 1979 epicenters this again emphasizes the importance of the area of
the two 1979 epicenters The epicenter of the main shock is located on the
northern boundary of the region of intense activity
Second the aftershock activity expands in size during the succeeding
nine days primarily northwards [see also Chatelain et al 1983] To the
northwest significant activity develops within the oceanic plate beneath
the trench axis (Figure 17B) This activity is concentrated beneath the
ORSTOM seamount [see USGS map by Chase et al 1983] near 173degS and
1672degE During the second through the ninth days activity continues to
develop in the area west of Epi Island and south of Malekula Island (Figure
17B) while in the succeeding 50 days the area of southern Malekula is
activated with a remarkable cluster occurring beneath the southern coast
(Figure 17C) The region of southern Malekula and Epi has been notably
quiet for much of the period prior to the July 1981 earthquake Back-arc
activity is also notable with a cluster occurring on 29 July east of
16 06 A B deg
0
O0
0 0
0~
o
000
0 0
0
00
0o~$
S 0 08 S
16E0
167 E
1 - C
0 0
168
0
16
0--
0
169 16
t
E
4P0
16
168
_ _ _ _ _ _ _ _
167
16 1o6
0
E 0
o S 0O
0 0
66
o5
0 6
0 24 Ju
q-o
0
6
1G 8HOM(C) 240 in~~ ~~
08OM24 JulJul toto 075M Figur 14
M Setme 1981 ()0H5M1Juy11to0H5M16Jl()0HO16uyto 1515 Setmbr191
I shy37
9Mo 4 o
uy
ON
37
Efate and increased activity in the region of Ambrym and Epi islands
(Figure 17C)
The aftershocks of the 15 July 1981 event thus affected four distinct
regions (1) the former 26 August 1979 aftershock zone presumably on the
interplate boundary (2) a region of the suboceanic plate near the ORSTOM
seamount (3) the region between South Malekula and 172degS presumably also
part of the interplate boundary and (4) upper plate crust cast of Efate
Island The total area affected by this earthquake was about 10 times
larger than the area expected for the rupture zone of an earthquake with
magnitude of the July 1981 event [Chatelain et al 1983]
(B) Prominent Clusters
Aside from aftershocks of the August 1979 and July 1981 events the
Efate -Malekula region also experienced several remarkable earthquake
clusters Some of these have the characteristics of an aftershock
sequence with the initiating event having the largest magnitude (and
sometimes preceded by a few foreshocks) Others have characteristics
intermediate between an aftershock sequence and a swarm [Mogi 1963] where
there may be several dominant shocks within the sequence and a more
symmetric shape to temporal variation of the number of events per unit
time The clusters are shown together with the larger aftershock sequences
in the summary of seismicity presented in Figure 18 For clarity the
aftershocks of the August 1979 and July 1981 events are represented by the
first nine days of activity
(A) Clusters in the forearc region The first cluster recorded by the
local network occurred in late September and early October 1978 near the 1
38
September mainshock (Figure 18A) and can be considered as a late part of
the aftershock sequence of the 1 September event The location of this
cluster however is activated again in later clusters (December 1979
August 1983 and April 1984) Figure 18A shows the next significant
activity in the region a cluster of earthquakes in December 1978 located
west of the August 1979 aftershock zone beneath the New Hebrides trench
The region was then fairly quiet until March 1979 when an intense cluster
of earthquakes occurred over a period of five days (Figure 18B) Activity
in the same area resumed again in April 1979 for a period of two days The
most active parts of both clusters are located at the same place which
defines an east - west trending zone located near the epicenter of the 26
August 1979 event and at the junction of the 17 August and 26 August
aftershock zones
After the August 1979 shocks three clusters occurred in December
1979 March 1980 and June 1980 (Figure 18G and 18H) near the epicenter of
the 1 September 1978 main shock (and also near the mid September 1978
cluster noted above) This location is on the eastern edge of the future
1981 aftershock zone The three clusters also tended to migrate toward the
July 1981 main shock epicenter (Figure 18G) A smaller cluster occurred in
August 1980 beneath Malekula Island (not shown on Figures) Actually the
entire region was rather quiet during 1980 The three 1980 clusters were
relatively small
In February 1981 a cluster of earthqukes occurred just west of the
location of the March -April 1979 clusters between those clusters and the
location of the December 1979 cluster (Figure 18H and 181) This location
39
Figure 18 Maps of epicenters in aftershock zones and clusters located bythe Cornell-ORSTOM network shown sequentially in time Epicenters of main shocks are shown by filled squares In each successive frame the next cluster overlays the preceding one for comparison Only successive clusters are shown in each frame All the activity recorded for the periods chosen is plotted Ten days of aftershock activity are shown for the August 1979 and July 1981 earthquakes
(A) 1 September 1978 main shock with September-October 1978 cluster (open circles) and December 1978 cluster (open squares)
(B) 27 January 1979 mainshock (no aftershock activity) with clusters of March-April 1979 (filled circles)
(C) Foreshock sequence for 17 August 1979 (open circles) (D) 17 August 1979 mainshock and aftershok sequence (filled circles)(E) 26 August 1979 mainshock and afters]ock sequence (open circles)
back-arc activity in September 1979 (crosses) (F) Cluster in December 1979 (filled circles) (G) Clusters in March 1980 (open circles) June 1980 (open squares) and
February 1980 on Efate island (plus signs) (H) Cluster in February 1981 (filled circles) (I) 15 July 1981 foreshocks (open circles) and June 1981 back-arc cluster
(plus signs) (J) 15 July 1981 aftershock sequence (filled circles) and back-arc activity
during July 1981 (plus signs) (K) Clusters in September-October 1981 (open circles) and activity on Efate
island in December 1981 (plus signs) (L) 12 March 1983 earthquake and aftershock sequence (filled circles) (M) Cluster in June 1983 (open circles) (N) 3 August and 5 August 1983 events and aftershock sequence (filled
circles) (0) Clusters in April 1984 (open circles) and in the back-arc near Epi
Island in March 1984 (plus signL) (P) Cluster in October 1984 (filled circles) (Q) Clusters in February 1984 (open circles) and April 1984 (open squares) (R) 3 July 1985 aftershock sequence (filled circles)
17
deg A B c
o 0W
0
03
0
00
(0C
0
00
00
0cn9
0
13g
0
o
000
o
0 000
0 0
0
0o 0
0 o 0S
(So
0
0
17
17 sclo
deg D c
p 0 0-
F
O 0 0 1800
O00 0
000
0 0 00 0
0 +
167 E 168 1690 167 E0 0
168 169 167 E 00
168 169
0 0
17
S
18
a I
0deg0Ck G
06+04
13 degp
~ - Ho
-to+00 0 o0o0o
0+1
I
0 0 +
18-
0
0O
A- V
J
+
- 00 B +o
K0 00 o0
L 0
0
0~
+
17 0
0
0j AbullB
0
0 0 0
0
0e
0 06
0 000
0
g oo
000
0+ 0olo
9
00
f 000
00 eFo 0 Q000
01
0 0
0 o00 1 0
o 0
1 7 E1 8116767E 168 169 167 E 168 169
I-0
16
7
0 o k3 ~
00
00
0 0
o 00
_o-I -
00 0 0
0 00
0
00
17s IP
0
00 00
13
01
0
0
00
000 0shy18
1868
CP 0 0t
00
169 167o
8
0
00
00
3
17E168 169 167 E 168 0 0 169 167 E 168 169
43
is part of the overlapping aftershock zones of the August 1979 events and
is also at the southern limit of the 15 July 1981 aftershock zone
The clusters thus have a very close spatial relationship to the
aftershock zones of the main shocks They occurred near the boundaries of
the aftershock zones and appear to be related to features delimiting or
defining the spatial development of the aftershock zones (see also
Chatelain et al 1986)
From February 1981 until August 1982 except for the aftershock
sequence of the July 1981 earthquake not a single fore arc cluster was
detected in the Efate Malekula region- Starting in September 1982
clusters began to occur around the former July 1981 immediate aftershock
zone In September and October 1982 four clusters occurred south of and
beneath Malekula Island (Figure 18K) Besides the aftershocks of the 15
July 1981 earthquake the September - October 1982 clusters were the most
prominent activity in the Malekula region during the entire 1978-1984
period These clusters did not occur at random places The first one was
located beneath Malekula Island at the site of the previous cluster in
1980 The second cluster is lcated southwest of Epi Island in an area
which experienced significanc activity during the aftershock sequence of
the 15 July 1981 earthquake (compare Figure 17C and 18L) The third
cluster shows a very linear pattern trending southwest - northeast right
along the extension of the northern edge of the 15 July aftershock zone
The fourth cluster then occurred beneath southern Malekula Island
In March and June 1983 two clusters occurred in the southern part of
the Efate zone The March 1983 cluster (Figure 18L and 18M) occurred near
the January 1979 epicenter and comprised a relatively small aftershock
44
sequence of a magnitude (Ms) 58 earthquake The June 1983 cluster
occurred just south of the July 1981 aftershock zone (Figure 18M and 18N)
This cluster affected the same zone which had already been affected by both
foreshocks and aftershocks of the 17 August 1979 mainshock Most of the
cluster occurred after a magnitude (mb) 54 shock which was the largest
event in the cluster The cluster thus has the charactistics of an
aftershock sequence but one with an abnormally large area for the main
shock magnitude The main shock was also preceded by a small foreshock
sequence that started a day before and stopped six hours before the main
shock
In August 1983 a dense cluster following a Ms - 56 and a Ms - 57
event occurred northwest of Efate Island (Figure 18N and 180) The latest
cluster recorded in the region occurred in April 1984 again activating the
same zone (Figure 180)
(2) Clusters in the back-arc region Although the back-arc region is
usually relatively aseismic there were clusters of earthquakes located
east of Efate Island and beneath Efate Island itself The clusters were
shallow and located in the island arc crust The areas affected were much
smaller than those in the forearc clusters Three of the clusters occurred
just before or after the August 1979 and July 1981 main shocks (Figures
18E 18F 181 and 18J) The August 1979 event was followed in September
1979 by a cluster east of Efate and in February 1980 beneath Efate The
July 1981 main shock was preceded in June - July 1981 by a swarm occurring
just south of the cluster following the August 1979 events Another
cluster occurred shortly after the July 1981 event at the same place The
July 1981 main shock was also followed by a swarm on Efate Island at about
45
the same place as the one following the August 1979 earthquakes No
clusters have been located in the Efate back-arc region from December 1981
when the last swarm occurred on Efate Island up to the most recent data
available October 1984 thus giving support to the close temporal
relationship between these clusters and the 1978 - 1983 sequence (see also
Chatelain et al 1986) In December 1980 a larger cluster occurred
farther east near the Coriolis trough (not shown on figures) The only
other back-arc activity occurred in March 1984 farther north just south of
Epi Island (Figure 180)
(3) Summary of Results from the Cornell-ORSTOM Network Investigation
of the patterns of seismicity associated with the earthquakes which have
occurred within the Cornell-ORSTOM network has shown that (1) not all
medium to large size events are associated with foreshock activity (2)
long term precursory activity sometimes occurs but not with enough
consistency to use in forecasting an impending event and (3) some zones
are activated before and after the main shocks without defining any clear
cycle (Chatelain et al in press) These earthquakes and their associated
seismicity suggest that specific features along the interplate zone
produced by the interaction of structures in the overriding and subducted
plates appear to control the seismicity in the Efate region (Chatelain et
al in press Isacks et al 1981)
Seismic Potential Studies Along the New Hebrides Arc
The earthquake hazard from the interplate zone is generally high
because of the rate of relative motion of the two plates (approximately 11
cmyr) and the stick-slip nature of the boundary However in addition to
large to great earthquakes along the plate interface moderate to large
46
magnitude events can occur within either plate and cause considerable
damage locally
One approach to determining the seismic potential of a region is to
identify a seismic gap or portion of an arc that has not produced a large
earthquake for some period of time The identification of a seismic gap
does not mean that a large earthquake will necessarily occur in a given
region because not all gaps will produce large earthquakes The gap may
indicate that (1) the section of the plate boundary is locked stress is
accumulating along the interface and will be the site of a future
earthquake or (2) the relative plate motion is being accommodated by
continuous slippage (aseismic creep andor by slip during small and
moderate events) such that sufficient stress to generate large earthquakes
along that section of the plate boundary does not accummulate Historical
information regarding the occurrence of earthquakes in a particular region
and regional tectonic constraints are necessary to clarify which of these
two possibilities is valid for the region in question In many cases
however the historical record may be incomplete or too short to accurately
determine which option is correct
Evaluation of the recurrence history of a particular region can be
investigated using (1) Teleseismically recorded earthquakes (2)
recurrence relations of smaller earthquakes recorded by seismograph
networks (3) pre-instrumental historical records of large earthquakes and
(4) evidence of prehistoric and historic large earthquakes observable in
the geological record Recurrence relations may help determine return
periods for certain sizes of earthquakes Recurrence intervals are
dependent upon the observations of seismograph networks and-are incomplete
47
since the period of record keeping is short compared to the time necessary
to develop these relationships Indirect evidence of large earthquakes can
sometimes be found in the geologic record in the form of uplift rates and
used to address the problem of recurrence intervals However information
obtained from the geologic record is necessarily limited in accurracy
McCann (1980) has divided the New Hebrides arc into different zones
and assigned values of seismic potential to these zones (Figure 19) based
on his study of historical and instrumental seismicity He has assigned 6
different divisions based on his study of the historical record (1) site
of a great (Ms 7 34) earthquake more than 100 years ago (2) site of a
great earthquake within the past 100 years but more than 30 years (before
1978) (3) incomplete historical record but indication that the region may
have the potential for a large earthquake (4) plate motion is subparallel
to the arc (5) no historical record of a great earthquake and the region
may not have the potential for one and (6) site of a large earthquake
within the past 30 years and presumably the lowest seismic potential
Marthelot (1983) used PDE data to determine some general segmentations
in the seismicity of the New Hebrides arc and the patterns of seismic
activity that characterize these segments (Figure 20) Marthelot (1983)
found that coupled interplate large (Ms lt 79) thrust earthquakes which
are preceded by intense activity dominate the northern end of the New
Hebrides arc near the Santa Cruz islands (between IIdegS and 13degS) Moderate
(Ms lt 72) thrust events concentrate between 13degS and 14degS Coupled
moderate (Ms lt 75) interplate thrust earthquakes occur near Santo and
northern Malekula islands (14degS to 165degS) The southern end of Malekula
and slightly south (165 0S to 1750S) exhibit coupled interplate thrust
48
14 S
2
19
24 I 165 E 170
Figure 19 McCanns seismic potential for New Hebrides island arc (McCann1980 See text for discussion of numbers
____
49
1650 1650 2 6 63 - 41 100
0 COUPLED INTER-INTRAPLATE THRUST
7467 e34 34
w
= EVENTS PRECEDED
BY INTENSE 24
AACTIVITY U I 44 CONCENTRATION
OF THRUST EVENTS
64-72 21O210
3
COUPLED 2061 73 0 _00
s INTERPLATE - 0 0C w THRUST EVENTS 78
PRECEDED BY 45t58C-150
DONUT PATTERNS 16 46 I S
81 03Q STEADY HIGH RATE L2 062 501 4 4
02ONLY ONE THRUST EVENT 61 025 INTRAPLATE200 ACTIVITY A 43
81 _0 2 O V CLUSTERS OF 72 73
RECURRING 76 150Q20 THRUST EVENTS 200
SLOW EXPANSION 4 OI01
OF ACTIVITY 8I 80 26 43 IN 198081- 13Do NO PRECURSORY
PATTERN 0 66 26
170 0 E 1720 170 0E 1720
Figure 20 Summary of the characteristics of the distribution of shallow earthquakes along the New Hebrides island arc The dashed line representsthe axis of the trench The trench disappears in the central part of the arc Horizontal lin separate regions characterized by distinct seismicity patterns Middle figure shows years of occurrence of large(Ms gt 70) and moderate-sized events (ms gt 60) 1961-1981 Right figureshows the large earthquakes that occurred from 1900 through 1960 (Marthelot and Isacks 1984)
50 earthquakes that are not quite as large (Ms lt 72) The zone west of Efate
(175degS to 18degS) exhibits a steady high rate of seismicity with magnitudes
(Ms ) less than or equal to 72 Between 18degS and 20degS intraplate activity
(Ms lt 72) dominates South of Anatom (eg south of 20degS) the seismicity
is characterized by clusters of recurring thrust events that do not exhibit
any precursory activity
In another study utilizing the PDE data set Wyss et al (1983) and
Habermann (1984) have used the shallow New Hebrides seismicity in order to
(1) identify areas of higher and lower strength within the plate interface
which might control the rupture length of future earthquakes and (2) test
for changes in the rate of seismicity prior to large earthquakes using a
statistical procedure The trend toward low stress drops in the central
portion of the arc near the intersection of the dEntrecasteaux Fracture
Zone with the New Hebride Trench is consistent with other studies which
indicate that this region is anomalous However a region of high or low
strength does not indicate anything about the nature of the region and
these regions do not help pinpoint when a large destructive earthquake
will occur within or near them
ASSESSMENT OF EARTHQUAKE HAZARD
Seismotectonic Provinces
We propose the following seismotectonic provinces and the maximum
probable (but not absolute) sizes of earthquakes be considered for the
subregions within Vanuatu when considering a design earthquake for these
regions (Figure 21) These provinces are based on the instrumental history
of earthquakes near Vanuatu The northern end of the New Hebrides Trench
is a complex zone of deformation where the interplate motion is changing
51
M612
13
S 0 0
18
231 165 E 170
Figure21 Earthquake potential for Vanuatu
--
--
52 from thrusting in the southern portion to mostly strike-slip motion in the
northern portion and has the potential for great (Ms 8) earthquakes The
central portion of the New Hebrides Trench here called the Santo
Malekula segment exhibits characteristics different from the rest of the
arc as the result of the dEntrecasteaux ridge interaction and has the
potential for Ms 7 34 earthquakes The southern end of the New Hebrides
Trench here called the Efate Tanna segment may have the potential for
Ms 8 earthquakes The extreme southern end of the New Hebrides Trench is
another complex zone where the interplate motion is changing from thrusting
in the north to strike-slip motion in the south and may be limited to
infrequent moderate (M 7 12) earthquakes Other sources of seismicity
include back-arc spreading east of the New Hebrides Trench (Ms 7 12) and
diffuse shallow activity along the Hazel-Holme Ridge (Ms 7) in the North
Fiji Basin (Ms 6 12)
One method for estimating the maximum possible magnitude earthquake in
a region is to look at the amount of deformation that has accumulated from
past earthquakes The deformation is assumed to be proportional to the
square root of the energy released by a powerful earthquake The energy
(E in joules) of each earthquake can be calculated from its magnitude (Ms)
using a formula developed for the region Pr~vot and Chatelain (1983) have
used the formula
Log E - 48 + (15 x Ms)
to calculate the amount of energy which has been released since 1965 in the
central portion of the arc (Figure 22) The calculated values tend to fall
within a range of values which can be bounded by two parallel lines since
deformation occurs more or less uniformly in time The maximum possible
E1 2 106 600 (joules )
500
400
300
200
136 shy
100
65 70 75 80 82 ANNEES - YEARS
Figure 22 Seismic energy release along the New Hebrides Arc since 1965 (Chatelain and Pr~vot 1983)
54
magnitude earthquake calculated by this method is Ms - 76 Prdvot and
Chatelain (1984) computed a similar result using all of the earthquakes
which have occurred since 1900
Ground Motion
Once the location and magnitude of potential earthquakes have been
determined for a region the next step is to determine the characteristics
of the ground shaking at a particular site This accomplished by the
condsideration of such quantities as earthquake source mechanism
epicentral distance and geometry and physical properties of the geologic
structures located between the source and the site
Strong-motion records provide one measure of site response To date
a relatively large number of strong-motion records have been generated in
the far-field of large earthquakes especially in California and Japan In
contrast relatively few near-field records of moderate and large shocks
have been recorded in island arcs These few have shown large scatter with
unpredictable results The 3 March 1985 Chilean and 19 September 1985
Mexican earthquakes constitute the most important exceptions and are
invaluable additions to the library of strong motion data for subduction
zones Nor-theless these two events do not constitute a databank of
information especially for intraoceanic tectonic settings such as Vanuatu
A major difficulty arises in trying to translate past earthquake size
(intensity values) which are based on cultural effects or magnitudes
derived from widely varying instrumental parameters into values of ground
motion The development of earthquake resistant design is usually based on
intensity of ground motion at a particular site The most widely applied
standard of comparison for strong motion data is the peak ground
55
accelereation (PGA) Figure 23 shows a general relationship between peak
acceleration and distance from hypocenter which has been derived from
worldwide earthquake data Some earthquakes generate relatively high
single peaks of ground accleration which represent little ground energy
Therefore on an absolute basis the use of PGA can be misleading for
smaller events
Peak ground accelerations are easily obtained from accelerogram
records however most historical information consists of earthquake
intensities Numerous relationships between ground acceleration and
Modified Mercalli intensities have been developed (Table 3) Two of these
proposed relationships are shown in Figure 24 For worldwide data Murphy
and OBrien (1977) have computed statistical correlations between Modified
Mercalli intensity values and ground accelerations (horizontal and
vertical) Theresultant relationships and the geometrical standard
deviation (s) are
log Av - 028 Imm - 040 s - 253
log Ah - 024 Imm- 026 s - 219
where -Av peak vertical ground acceleration
Ah - peak horizontal ground acceleration
Imm - Modified Mercalli intensity
Using the relationship of earthquake intensity to distance and size of
Fiji earthquakes Everingham (1984) has produced a plot for the Fiji region
(Figure 25) Although these results are for a nearby region they give a
general indication of what might be expected for Vanuatu Figure 26
(Prdvot and Chatelain 1983) shows the recurrence of Modified Mercalli
intensities per number of earthquakes
56
1000 1 I l I I eO58 M(R 5 -X A= 1320 e R+25)152
5
MEAN + a =2N01 - STANDARD 2-
oe DEVIATIONbullbull- ~0 MEAN + 2
tbull 0o - STANDARD - oo o DEVIATIONS Jf E N o 0
LU0
U 01 0_ o o 0-oo n 00 bull
L) em a00
- MEAN - shy - 4ra 00 L 0 W STANDARD 0-~DEVIATIONWL 000 to
0 ME N -2 1 STANDARDUx 0
DEVIATIONS
101- 10 - 000
D N O oENTE K - 1 so-
10 100 1000
DISTANCE FFROM HYPOCENTEFR IN KILOMETEFRS
Figure 23 Acceleration-attenuation relations derived from worldwide earthquakes (Hays 1980)
57
Table 3 Characteristics of the data samples used in selected studies of the correlation of ModifiedMercalli intensity and peak ground acceleration (modified fom OBrien et al 1977)
Number and Range of location Number Modified Mercalli Distance Acceleration
Study of earthquakes of recordings intensity
Gutenberg and 61 Western 167 n-VIII Richter 1942 United States 1956
Neumann 1954 10 do
Hershberger 1956 60 do Coulter Waldron dodo
and Devine (Not based 1973 entirely on
observed data)
Trifunac and 57 do Brady 1975c
10 V-VIII
108 J-Vil IV-X
187 IV-X
range (kin) range (cms2)
3-450 1-300
Averages of 40-300 25 and 160 (distance dependent) - 1-300 Short distance 6-3000
(Dependent on site geology and local amplification)
Figure 24 Proposed relationships between earth quake intensities and peack accelerations
59
DEPTH 20KM
7shy
6- 6 0
075 502
61 h0
DISTANCE KM
Figure 25 Modified Mercalli earthquake intensities observed in Fiji as a function of magnitude and epicentral distance (Everingham 1984)
60
10
0
5CI I-C)
0i
0
o
01 a)o
PORTVILA = SANTO
00
E
0212
000
E
z
Degres Mercali _ Mercalli degrees
Fiue-2 Frequency of Modified Mercalli earthquake intensities felt in Port Vila and Santo (Chatelain and Prfivot 1983)
61
Tectonic Uplift
Studies of longer term island uplift on Santo and Malekula as
evidenced by the uplift of coral reefs have related segmentation of these
islands to features of the subducting topography of the dEntrecasteaux
fracture zone (Taylor et al 1980) The proximity of these two islands to
the main interplate thrust zone and the growth of the coral reef terraces
around the islands has resulted in preservation of long-term deformation
Taylor et al (1980) have studied late Quaternary coral reefs that have
been uplifted on Santo and Malekula islands They identified four main
blocks based on long-term tilt differences (Figure 27) The rupture zones
of the 1965 and 1973-1974 earthquake sequences correlate to the tectonic
discontinuities in the Santo -- Malekula region Taylor et al (1980)
studied the uplift of coral terraces on Malekula over a period of three
years (976 1177 and 779) and found that just over 1 meter of uplift
had occurred in the northern part of the island as a resalt of the 1965
earthquake (Figure 28 Table 4)
Tsunamis in Vanuatu
Tsunamis (seismic sea waves) are caused by displacements in submarine
topography that are induced by earthquakes andor volcanic activity
occurring below or near the floor of the ocean Low-lying areas near the
shore are particularly vulnerable to damage by these waves The shallow
seismic zones of the Southwest Pacific have a history of earthquakeshy
generated tsunamis (Figure 29) A few tsunamis have originated in the
Vanuatu region A tsunami was produced by the first earthquake of the
March 1875 sequence (Iida et al 1967) The earliest known significant
one was the 10 January 1878 earthquake which produced a large tsunami
62
1167030E
AK-A 150 30 S
Tasmaloum Arkialo
NORTH MALEKULA
X Direction of tilt inferred from reef terraces 16000S
Tilt discontinuity
Pliocene and Quaternary shy sedimentary rocks mostly
coral limestone
r Pre-Pliocene sedimentaryand igneous rocks SOUTH
MALEKULA
160305
Figure 27 Tectonic uplift associated with the 1965 Santo earthquakes (Taylor et al 1980)
63
Contour Interval =02 m 02--- 04 - hp
0-6- shy08 xx16 000Sshy
08 9
06
02 i
00
160 30S a
167 0 00E 167 030E
Figure 28 Measurements (meters) of 1965 uplift made in September 1976November 1977 and July 1979 The letters on the figure represent the places and amounts of uplift given in Table 2 The contours of uplift(contour interval - 02 ) represent one of the simplest interpretations of the uplift pattern consistent with the measurements (Taylor et al 1980)
64
TABLE 4 Uplift Measured Along the Coast of Northern Malekula
Year Number ofStation Place Name Measured Measurements a Southwest Bay 1977 observationb Bamboo Bay 1977 observation c Dixon Reef 1977 Id Lambubu Bay 1976 15 e West Bay 1976 5f Horrok 1976 Ig Brenwe 1976 4h Liwout Point 1976 1979 50i East Leviamp 1976 4j West Leviamp 1976 6k Elephant Point 1976 17I Win 1979 24 m Wihet Bay 1979 23 n Rambak 1979 30 o Npennanavet 1976 10P Matanvat 1976 4 q Potovrou 1977 1 r Atchin Island 1977 observations Wala Island 1977 observation t Norsup 1977 I u Lamp 1977 observation
Insufficient measurements for a standard deviation to be useful
Figure 29 Tsunami history of the Southwest Pacific Filled circles indicate locations of tsunaznigenic events dashed circles indicate inferred locations of tsunamigenic events
66
(12-17 m lida et al 1967) and 6 meters of uplift of the harbor at Port
Resolution (Warden and Mitchell 1974) Other earthquake generated
tsunamis have occurred in 1961 1965 and 2 in 1967 (lida et al 1967)
While major Pacific-wide tsunamis such as those generated along the South
American or Alaskan plate margins apparently do not affect Vanuatu
significant local tsunamis may be generated by large shallow earthquakes
occurring within the region
Volcanic Eruptions in Vanuatu
Volcanic activity is concentrated in the central belt of the Vanuatu
island arc Much of the present activity is confined to solfataric
eruptions however explosive eruptions are known (eg the 1878 Yasowa
eruptions)
In general the potential effects of a volcanic eruption on the
inhabitants of the islands of Vanuatu are small except for those people
who are living in the immediate vicinity of an active volcano However
evacuation of inhabited volcanic islands may be necessary in larger
eruptions Even distant volcanic eruptions such as those at Home Reef in
the Kingdom of Tonga during March 1984 produced large quantities of pumice
some of which rafted across large portions of the Southwest Pacific The
floating pumice interfered with shipping throughout the Southwest Pacific
region (SEAN Bull 1984)
IMPLICATIONS FOR MITIGATION OF EARTHQUAKE RISK
Several significant steps may be taken that will significantly
mitigate the loss of life and property from future earthquakes in Vanuatu
The following five steps provide suggestions for mitigation of the
earthquake risk
67
Earthquake Education
First an earthquake education program such as that adopted in Fiji
or Papua New Guinea is strongly recommended At minimal cost to the
Government such a program may be mounted through the schools Red Cross
programs and through the news media In other countries earthquake
education programs have taught simple methods of strengthening house
construction and minimizing hazardous conditions within the home they
have warned of tsunami hazards to coastal dwellers they have instructed on
proper behavior during an earthquake they have helped to encourage storage
of emergency food water and equipment in many households and
importantly they have helped avoid panic during an earthquake and
stimulated cooperation with government officials following such a disaster
Earthquake education programs are effectively combined with other disaster
preparedness programs (eg cyclones floods and so on) An example of
educational materials prepared by the Fiji Mineral Resou-ces Department is
included in Appendix IV
A few simple measures can be taken to reduce the likelihood of damage
to personal property A system of baffles in water reservoirs can reduce
the chances of seiches being set up in the tanks and the ultimate collapse
of the towex if the motion is large enough Large heavy objects should
not be put in high places where they can be easily dislodged unless they
are anchored in place This would apply to things like stereo speakers and
other objects that might be on shelves Products on shelves in stores and
books in offices can be restrained with wire retainers along fronts of
shelves Heavy objects that could tip over (such as hot water heaters and
gas tanks) can be fastened with anchoring bands This is especially a
68
concern with gas tanks which could fall over rupture lines and result in
fire
Building Codes
Second adoption of building codes for Vanuatu is imperative There
is a real danger of a large earthquake occurring very close to Port Vila or
Luganville In general the adequacy of construction is a major factor
controlling the damage and loss of life brought on by such an earthquake
Building codes designed for areas of similar earthquake hazard such as New
Zealand Code A California Building Codes or Papua New Guinea Codes 1 or
2 would be appropriate for Vanuatu Observation of such codes is most
crucial for public multistory buildings in the major towns of Port Vila
Efate and Luganville Santo As important as the design of such buildings
are the construction methods and guality of construction material used to
implement building design Careful monitoring of construction by competent
engineers is important for critical facilities The traditional houses
have kept down past losses of life and property but increasing population
and rapid urbanization can result in higher potential damage if
earthquake-resistant designs are not implemented One of the primary
reasons for property damage resulting from the Mere Lava earthquakes was
related to the siting of newer homes Houses located on steep slopes
suffered damage when they were not situated on competent substrate (Figure
30) The shaking of the fill and loose soils by the earthquakes caused
unconsolidated materials to shift under the foundations
Emergency Civil Defense Procedures
Third development of specific Civil Defense plans for emergency
procedures following an earthquake or tsunami should be initiated Of
69 a ) Poorly - situated house
and terrace e
house built too far over slope Rear
0 R
near cutting vertical and too backwall of house
bull e
b ) Earthquake- induced slope movements
-7 Rear cutting collapses pushingForward terrace edge - house orward
subsidesunder mining huefrad house foundation shy
Landslippage here
c) Well- situated house and terrace Good distancebetween house and
Good between
distance house
cutting
ond sopr I Rear cutting slope back and planted with natural vegetation
Figure 30 Sche7atic representation of causes of damage to poorly sited houses and suggestions for future house contruction in areas of loosely consolidated soil
70 course earthquake preparedness plans have much in common with hurricane or
other natural disaster planning but specific effects of earthquake
occurrence must be considered structural damage to multistory buildings
interruption of water supply disruption of electrical and gas lines
secondary geological effects such as ground liquefaction or landslides in
the near-source region complicating effects of aftershocks in the days and
weeks following a major earthquake The primary structure for such civil
defence plans already is in place in Tonga Programs specific to the
earthquake hazard may be added following similar programs in Fiji Papua
New Guinea and New Zealand
Long-term Seismicity Observations
Fourth long-term seismicity and strong motion observations should be
continued In the long-term such information will help to refine
estimates of seismic potential along the New Hebrides plate boundary they
will help to more directly and accurately assess the ground motion
parameters of direct concern to engineers for building design in
Vanuatu--ground acceleration frequency spectra horizontal and vertical
components of ground motion local amplification effects and so on
Furthermore seismicity patterns may provide a key to long-term forecasting
and short-term prediction of the location and size of future earthquakes
that may affect Vanuatus population
Internationa Cooperation
Fifth international cooperation among the island countries of the
Southwest Pacific and foreign agencies (eg US Geological Survey
ORSTOM etc) may significantly help in Vanuatus earthquake preparedness
program All of the countries affected by earthquakes (Vanuatu Western
71
Samoa Fiji Tonga Solomon Islands Papua New Guinea and New Zealand)
have to varying degrees developed earthquake preparedness programs
Vanuatu may take advantage of the previous current and any future efforts
of the other countries in the region
72-76
References
Atkin R J (1968) On volcanoes in the New Hebrides and Banks Islands Quarterly J of the Geologvical Society of London 24 305-307
Calder N 1972 The Rescless Earth A Report on the New Geology The Viking Press New York N Y
Carney J N and A Macfarlane (1979) Geology of Tanna AneityumFutuna and Aniwa New Hebrides Geological Survey Regional Report 71 pp Carney J N and R Campillo (1980) An investigation into damage causedby seismic activity on Mere Lava during May 1980 Geological Survey DeptOf Vanuatu Report
Chase C G (1971) Tectonic history of the Fiji Plateau Geol Doc Amer Bull 82 3087-3110
Chase T E B A Seekins J Daniel and J Y Collot (1983)Topography of the Vanuatu region map US Geological Survey Alexandria VA
Chatelain J L R K Cardwell and B L Isacks (1983) Expansion ofthe aftershock zone following the Vanuatu (New Hebrides) earthquake on 15July 1981 Geophys Res Lett 10 385-388
Chatelain J L B L Isacks R K Cardwell R Pr6vot and M Bevis (inpress) Patterns of seismicity associated with asperities in the centralNew Hebrides Island Arc J Geophys ResChinn D S (1982) Accurate source deths and focal mechanisms ofshallow earthquakes in western South America and in the New Hebrides island arc PhD Thesis Cornell University Ithaca NY
Chinn D S and B L Isacks (1983) Accurate source depths and focalmechanisms of shallow earthquakes in western South America and in the NewHebrides island arc Tectonics 2 529-563
Chiu J-M (1982) Structural features of subduction zone determined bydetailed analysis of short period seismic waves from earthquakes recordedin the New Hebrides island arc PhD Thesis Cornell University
Collot J Y J Daniel and R V Burne (1985) Recent tectonicsassociated with the subductioncollisioi of the DEntrecasteaux zone in thecentral New Hebrides Tectonophys 112 325-356
Coudert E B L Isacks M Barazangi R Louat R Cardwell A Chen JDubois G Latham and B Pontoise (1981) Spatial distribution andmechanisms of earthquakes in the southern New Hebrides arc from atemporary land and ocean bottom seismic network and from worldwide observations J Geophys Res 86 5905-5925
77
Dubois J J Lauray J Recy and J Marshall (1977) New Hebrides trench Subduction rate from associated lithospheric bulge Canadian J Earth Sci 14 250-255
Ebel J E (1980) Source processes of the 1965 New Hebrides Islands earthquakes inferred from teleseismic waveforms Geophys J Royal Astron Soc 63 381-403
Everingham I B (1984) Provisional list of felt earthquakes reports in Fiji 1941-1981 Min Resources Dept Fiji Note BP 338 17 pp
Falvey D A (1978) Analysis of paleomagnetic data from New Hebrides Bull Austr Explor Geophys 9 117-123
Geological Map of the New Hebrides Condominium scale 11000000 (1975)Ministry of Overseas Development (Directorate of Overseas Surveys) DOS 1196 British Residency Port Vila New Hebrides
Gilpin L M A L Bloom B L Isacks and M Bevis F W Taylor and C Jouannic (1982) Late Pleistocene coral reef terraces as tiltmeters on Santo Island Vanuatu (New Hebrides) EOS Trans Amer Geophys Union 63 430
Gutenberg B and C F Richter (1954) Seismicity of the Earth 2nd ed Princeton NJ Princeton University Press
Habermann R E (1984) Spatial seismicity variations and asperities in the New Hebrides seismic zone J Geophys Res 89 5891-590
Hamburger M W (1986) Seismicity of the Fiji Islands and Tectonics of the Southwest Pacific PhD thesis 312 pp Cornell University Ithaca NY
Hays W W (1980) Procedures for estimating earthquake ground motions U S Geological Surv Prof Paper 1114 77 pp
Ibrahim A K B Pontoise G Latham M Larue T Chen B Isacks J Recy and R Louat (1980) Structure of the New Hebrides arc-trench system J Geophys Res 85 253-266
lida K D Cox and G Pararas-Carayannis (1967) Preliminary Catalog of Tsunamis Occurring in the Pacific Ocean HIG University of Hawaii
International Seismological Centre (ISC) 1978-1979 Bulletin of the International Seismological Centre Newberry Berkshire United Kingdom
International Seismolog4 cal Centre (ISS) 1918-1963 International Seismoshylogical Summary Newbury Berkshire UK
78
Isacks B L and M Barazangi (1977) Geometry of Benioff zones Lateralsegmentation and downwards bending of the subducted lithosphere in IslandArcs Deep Sea Trenches and Back-Arc Basins Talwani M and W C Pitmaned Maurice Ewing Series 1 Amer Geophys Union Washington D C 99shy114
Isacks B L G Hade R Campillo M Bevis D Chinn J Dubois JRecy and J L Saos (1978) Measurements of tilt in the New Hebrides island arc in Proceedings of Conference VII Stress and StrainMeasurements Related to -Prthquake Prediction US Geological SurveyOpen-rile Report 79-370 176-221
Isacks B L R Cardwell J-L Chatelain M Barazangi J-M MarthelotD Chinn and R Louat (1981) Seismicity and tectonics of the central NewHebrides Island Arc in Earthquake Prediction An International ReviewMaurice Ewing Ser 4 edited by D W Simpson and P G Richards AGUWashington DC 93-116
Johnson T and P Molnar (1972) Focal mechanisms and plate tectonics ofthe southwest Pacific J Geophys Res 77 5000-5032
Karig D E (1971) Origin and development of marginal basins in the western Pacific J Geophys Res 76 2542-2561
Karig D E and J Mammerickx (1972) Tectonic framework of the New Hebrides island arc Marine Geology 12 187-205
Kelleher J J Savino H Rowlett and W McCann (1974) Why and where great thrust earthquakes occur along island arc J Geophys Res 794889-4898
Kroenke L (1984) Cenozoic Tectonic Development of the SouthwestPacific United Nations Econ and Social Commission for Asia and the Pacific Technical Bull 6
Lay T and H Kanamori (1981) An asperity model of large earthquakesequences in Earthquake Prediction An International Review Maurice EwingSer 4 edited by D W Simpson and P G Richards AGU Washington DC 579-592
Luyendyk B P W B Bryan and P A Jezek (1974) Shallow structure ofthe New Hebrides Island Arc Geol Soc Amer 85 1287-1300
Louat R J Daniel and B Isacks (1982) Seismicitd de larc desNouvelles Hebrides in Equipe de GOologie-GOophysique du Centre ORSTOM deNoumda Contribution Aletude godvnamique du Sud-Ouest Pacifique Travau et Documents de lORSTOM 1147 179-186
Mammerickx J T E Chase S M Smith and I L Taylor (1971)Bathymetry of the South Pacific map Scripps Inst of Oceanogr La Jolla Calif
79 Marthelot J-M (1983) Patterns of seismicity in the Vanuatu (NewHebrides) arc Regional variations and systematic evolution PhD Thesis Cornell University
Marthelot J-M J-L Chatelain B L Isacks R K Cardwell and ECoudert (1985) Seismicity and attenuation in the central Vanuatu (NewHebrides) islands A new interpretation of the effect of subduction of theDEntrecasteaux Fracture Zone J Geophys Res 90
McCann W R (1980) Large and moderate size earthquakes Theirrelationship to the tectonics of subduction Ph D thesis Lamont-DohertyGeol Observ of Columbia Univ Palisades NY
McCann W R S P Nishenko L R Sykes and J Krause (1979) Seismicgaps and plate tectonics Seismic potential for major boundaries Pure Appl Geonhys II_7 1082-1147
McGuire R K (1977) Effects of uncertainty in seismicity on estimateof seismic hazard for the East Coast of the United States Bull Seis Soc Amer 67 827-848
Mitchell A H G and A J Warden (1971) Geological evolution of the NewHebrides island arc J Geol Soc London 127 501-529
Mogi K (1963) Some discussions on aftershocks foreshocks andearthquake swarms--The fracture of a semi-infinite body caused by an innerstress origin and its relation to the earthquake phenomena (third paper)Bull Eartho Res Tnst Tokyo Univ 41 615-658
Monzier M J Y Collot and J Daniel (1984) Carte bathymetrique desparties centrale et meridionale de larc insulaire des Nouvelles-Hebridesmap Office de la Recherche Scientifique et Technique Outre-Mer (ORSTOM) Paris
Murphy J R and L J OBrien (1977) Analysis of a worldwide strongmotion data sample to develop an improved correlation between peakacceleration seismic intensity and other physical parameters ComputerSciences Corporation Rept NUREG-0402 to US Nuclear RegulatoryCommission 68 pp
Pascal G B L Isacks M Barazangi and J Dubois (1978) Preciserelocations of earthquakes and seismotectonics of the New Hebrides island arc JGeophys Res 83 4957-4973
Preliminary Determination of Epicenters (PDE) 1961-1981 MonthlyBulletin National Earthquake Information Service US Geological SurveyAlexandria Va
Pr~vot R and J L Chatelain (1982) Seismicity and seismic risk inVanuatu Report No 5-83 Centre ORSTOM Nouma New Caledonia
Richter C F (1958) Elementary Seismology W H Freeman and CompanyInc San Francisco
80
Rothe J (1965) The Seismicity of the Earth 1953-1965 Paris UNESCO 336 ppSanto T (1970) Regional study of the characteristic seismicity of theworld Part III New Hebrides island region Bull Earthquake Res Inst Tokyo Univ 48 1-18
SEAN (Scientific Event Alert Network) Bulletin 9
Taylor F W B L Isacks C Jouannic A L Bloom and J Dubois(1980) Coseismic and Quaternary vertical tectonic movements Santo andMalekula islands New Hebrides-island arc J Geophys Res 85 5367-5381
Taylor F W C Jouannic and A L Bloom (1985) Quaternary uplift ofthe Torres Islands northern New Hebrides frontal arc Comparison withSanto and Malakula Islands central New Hebrides frontal arc J of Geol 93 419-438
Trifunac M D (1976) Preliminary analysis of the peaks of strongearthquake ground motion--dependence of peaks on earthquake magnitudeepicentral distance and recording site condition Bull Seism Soc Amer 66 189-220
Trifunac M D and A G Brady (1975a) Correlations of peakacceleration velocity and displacement with earthquake magnitude andsite condition Intl J Earthquake Engr Struc Dynamics 4 455-471
Trifunac M D and A G Brady (1975b) On the correlation of seismicintensity scales with the peaks of recorded ground motion Bull Seism Soc Amer 65 139-162
Turcotte D L and G Schubert (1982) Geodynamics John Wiley amp Sons New York
US Geological Survey 1961-1985 Preliminiry Determination of Epicenters Denver Colo
Vidale J and H Kanamori (1983) The October 1980 earthquake sequencenear New Hebrides Geophys Res Lett 10 1137-1140
Wellington Seismological Observatory Geophysics Division 1953-1960 NZDept Scientific and Industrial Research Catalog of Earthuakes 1953-1960
Wray S T R K Cardwell B L Isacks E Cudert and J-L Chatelain(1983) Detailed seismicity observations in the forearc region of aconvergent plate boundary Malekula Island Vanuatu (abstract) EOS Trans Am Geophys Union 62 945
Wyss M R E Habermann and C Heiniger (1983) Seismic quiescencestress drops and asperities in the New Hebrides arc Bull Seismol Soc Am 23 219-236
81
APPENDIX I DEFINITIONS
Two measures of the size of an earthquake are magnitude and intensity
Magnitude is a measure of the energy from an earthquake source to indicate the
strength of an earthquake In comparison intensity is a measure of the amount
of ground shaking caused by the earthquake at a particular site Thus an
earthquake of a given magnitude will produce a wide range of intensities
depending largely on distance from the source
In general a small earthquake with a magnitude less than 5 may be felt
only in the area near the source and a moderate earthquake with a magnitude
between 5 and 7 will be felt over a wider area and may produce significant
damage in the area very close to the source A large earthquake refers to an
earthquake with a magnitude greater than 7 Such events are often very desshy
tructive if they are located near population centers A major earthquake
refers to magnitudes between 7 and 7 34 and a great earthquake refers to
magnitudes greater than 7 34 These great earthquakes cause widespread desshy
truction and possible regional tsunamis Generally the potential damage from
earthquakes is multiplied by the secondary effects of earthquake occurrence
such as ground faulting generation of tsunamis landslides slumping or
liquifaction
The depth of earthquakes range from the surface to approximately 700 km
depth Shallow earthquakes refer to those with depths between the surface and
70 km Intermediate earthquakes refer to those with depths between 70 km and
250 km depth Deep earthquakes refer to those with depths greater than 250 km
(but less than 700 km) Intermediate depth earthquakes occasionally produce
damage at the earths surface only if the earthquake is very large Deep
events are generally not felt
82
The seismic (earthquake) potential of a particular region is defined as
the likelihood of that region to experience a (destructive) earthquake within
particular magnitude range within a particular time period The seismic
(earthquake) hazard of a particular location refers to the amount of ground
motion that might be expected from an earthquake within or near that region
Adequate data on seismotectonic features instrumental (strong-motion) and
macroseismic (intensity) records of near-field effects of large earthquakes
source parameters of large earthquakes earthquake spectra and ground attenuashy
tion or amplification are necessary in order to reasonably evaluate earthquake
hazard for any region The seismic potential is the integration of all of
these bits of information The average length of time between earthquakes of a
particular size (recurrence interval) and the amount of time elapsed since the
last earthquake of that size help to define the probability of future earthshy
quake occurrence along a particular seismogenic zone hence the seismic
potential of that zone
Seismic risk of a particular region refers to the expected degree of
losses of people and their property which result from the seismic hazard and
the vulnerability in the region One method that has been widely used for this
risk determination (and is used here) involves the determination of a maximum
probable earthquake (design earthuake) that is likely to occur in the imshy
mediate region Calculations of seismic hazard which are based on design
earthquakes generally yield conservative estimates of risk
The most important conclusion of historical studies of seismicity is to
define the seismogenic zones of a region and extrapolate what the future earthshy
quake potential is for those zones Seismically quiescent regions refer to
regions with a lower level of seismic activity which are surrounded by more
83
active regions Portions of major plate boundaries that have not experienced a
major or great earthquake during a particular time interval are seismic Raps
This time interval is taken to be a significant portion of the earthquake
recurrence interval for a large earthquake An estimate to within several
decades of the location and size (magnitude) of a large earthquake constitutes
a forecast If a precise calculation of the time and probability of occurrence
can be added to the location and size information then the estimation is a
prediction
84
APPENDIX II MODIFIED MERCALLI INTENSITY SCALE (1956 VERSION)
Masonry A B C D To avoid ambiguity of language the quality of masonry brick or otherwise is specified by the following lettering whichhas no connection with the conventional Class A B C construction)
Masonry A Good workmanship mortar and design reinforced especiallylaterally and bound together by using steel concrete etc designed to resist lateral forces
Masonry B Good workmanship and mortar reinforced but not designed in detail to resist lateral forces
Masonry C Ordinary workmanship and mortar no extreme weaknessez likefailing to tie in at corners but neither reinforced nor designed againsthorizontal forces
Masonry D Weak materials such as adobe poor mortar low standards ofworkmanship weak horizontally
DESCRIPTION (INTENSITY VALUES RANGE FROM I TO XII)
I Not felt Marginal and long-period effects of large earthquakes
II Felt by persons at rest on upper floors or favorably placed
III atlt indoors Hanging objects swing Vibration like passing oflight trucks Duration estimated May not be recognized as an earthquake
IV Hanging objects swing Vibration like passing of heavy trucks orsensation of a jolt like a heavy ball striking the wallsStanding motor cars rock Windows dishes doors rattle Glassesclink Crockery clashes In the upper range of IV wooden walls and frames creak
V Felt outdoors direction estimated Sleepers wakened Liquidsdisturbed some spilled Small unstable objects displaced or upset Doors swing close open Shutters pictures move Pendulum clocks stop start change rate
iOriginal 1931 version in Wood H 0 and F Newmann 1931 Modified
Mercalli Intensity Scale of 1931 Bull Seis Soc Amer 53 979-9871956 version prepared by Charles F Richter in Elementary Seismology(1958) 137-138 W H Freeman and Company
VI Felt by all Many frightened and run outdoors Persons walk unsteadily Windows dishes glassware broken Knickknacks booksetc off shelves Pictures off walls Furniture moved or overshyturned Weak plaster and masonry D cracked Small bells ring(church school) Trees bushes shaken (visibly or heard to rustle--CFR)
VII Difficult to stand Noticed by drivers of motor cars Hangingobjects quiver Furniture broken Damage to masonry D includingcracks Weak chimneys broken at roof line Fall of plasterloose bricks stones tiles cornices (also unbraced parapets andarchitectural ornaments--CFR) Some cracks in masonry C Waves on ponds water turbid with mud Small slides and caving in alongsand or gravel banks Large bells ring Concrete irrigationditches damaged
VIII Steering of motor cars affected Damage to masonry C partialcollapse Some damage to masonry B none to A Fall of stucco and some masonry walls Twisting fall of chimneys factory stacks monuments towers elevated tanks Frame houses moved onfoundations if not bolted down loose panel walls thrown outDecayed piling broken off Branches broken from trees Changes inflow or temperature of springs and wells Cracks in wet ground and steep slopes
IX General panic Masonry D destroyed masonry C heavily damagedsome times with complete collapse masonry B seriously damaged(General damage to foundaticns--CFR) Frame structures if notbolted shifted off foundations Framed cracked Serious damageto reservoirs Underground pipes broken Conspicuous cracks inground In alluviated areas sand and mud ejected earthquakefountains sand craters
X Most masonry and frame structures and bridges destroyed Seriousdamage to dams dikes embankments Large landslides Water thrown on banks of canals rivers lakes etc Sand and mudshifted horizontally on beaches and flat land Rails bent slightly
XI Damage nearly total Large rock masses displaced Lines of sightand level distorted Objects thrown into the air
86 APPENDIX III EARTHQUAKE EDUCATION PAMPHLET PUBLISHED IN FIJI
EARTHQUAKE What to do how to help
-
bull - -C II
deg
Damage at Suva wharf caused by the 1953 -earthquakelw hich was followed by a tidal wave within 30 seconds
1 411_0- shy
87 from theA message Minister for Lands
Recent earthquakes in Waya tsunamis might be the most Island and the even more recent one effective means of mitigating which rocked the city of Suva short- the worst effects of a sudden ly after 9am on Decanber 171975 calamity in these two potentshyand the ensuing panic reaction of ially dangerous forms is to the people are sharp reminders to us know more about them that although Fiji is situated in an
Indeed the suddennessearthquake zone there is little in-the severity of a wideshyformation available to the public on and
spread disaster could disruptearthquakes and tsunamis (tidal which are often associated all communications and paralysewaves)
with the type of earthquakes we have even the most efficient and experienced in Fiji well-drilled emergency organishy
sation it is hopeZ that the infor-
Survival in those cirshymation pamphlet prepared by myministry on earthqkes and tsunamis Ceatnces would depend on
will allay some of the natural alarm each individuals own knowshy
which people exp -ence during even
the minor tremor- Because we are in an
It has been brought to my earthquake belt it would be
notice that at least one expert has prudent for people living in Fiji to make themselvespredicted the chance of a serious
earthquake in Fiji as 140 years thoroughly familiar with the
one earthquake every 40 years information contained in this pamphlet
However with the exception of the earthquake and tidal waves in I wish to take This 1953 we are fortunate not to have opportunity to appeal for your suffered a more serious earthquake full co-operation in answeringthe questionnaire on earth-
They are probably the most quakes and tsunamis which terrifying and devastating phenomena appears on page nine of known to man this pamphlet as accurately
Unlike other natural disas- as possible
ters such as hurricanes and flood- The aim of the ing the tragedy of earthquakes is questionnaire is to locate that there is no forewarning of their and map the fault-line zones coming from which it is suspected
The very recent earthquake that most of our earthquakes in Hawaii is an obvious in- originatedisaster
dicator that the science of predicting The success and the earthquakes is still in the early efficiency of any kind of stages of development emergency relief system may
Although the recent occurrence depend on your co-operation in Hawaii might not rank among the in providing the informationworlds most serious earthquakes we sought- SNWqanivavalagi
orldssrios msteathqakes weMinister for Lands and Mineralknow from the experiences of other Resources countries that earthquakes can be totally devastating
However remote the possibishyity of a serious earthquake and
2
88
7 -
Part of the damage to the Suva Harbour reef caused by the 1953 earthquake
70 per cent from FIJI area About 70 per cent of the masonry landslides or drowning
worlds deep earthquakes are recorded in the tsunami from the Fiji area Most of them are Another earthquake with not felt because they occur at great an intensity of four to five was depths of about 400 to 600 kilometres ecperienced in Suva in 1961but (24845 to 37267 miles) beneath thecasdolmirdmget
surfac of te ebuildings
These types of earthquakes are not dangerous or damaging because of the depths at which they occur ButOtra they ore scientifically interesting
because they help geologists to deduce
the structure of the crust
The types of earthquakes which can be very damaging are those of large magnitude which occur in thebecase tey Todedueelp eolgist top 50 kilemetres (3106 miles) of the earths crust
The 1953 earthquake which hcd on epicentre (origin) 15 miles west of Suva was of this type That earth-quake had an intensity of seven out of a Mercalli scale of 12 and result-ed in a tsunami (tidal wave) which occurred 30 seconds after the quake and affectedoiSuva and davu About seven people were killed by falling
Several smaller shocks have been reported since then
w here re oftenearthquake fe arrtua aaso avun
fhlare laldes odrwi savu Taveuni and recentlythe WayA - Nadi - Lautoka area
Reports received after the 1953 earthquakes also show f l itle dmage incstes t that several very strong earthshyquakes have been felt in the
Fiji area since the early 1800s A o the
caused lthu d thse in tha the increasing density of popushyltion and buildings would make the area more prone to damage unless buildings are properly reinforced to withstand strong lateral motions from earthrukes
89 Quakes come In two main types
Volcanic earthquakes are asso-ciated with the movement of molten rocks underground usually at depths of less than 30 kilometre5 near active or inactive (at surface) volcanoes
These volcanic earthquakes are
often called tremors because they tend to occur frequently and almost continuously and are often associat-ed with possible forthcoming erupt-ions of volcanoes
Fortunately it has been over a million years since volcanoes erupted in most parts of Fiji al-though the most recent volcano was probably active less than 2000 years ago in the Taveuni area
Because of the long period of
time since previous eruptions vol-
canoes in most parts of Fiji can be or least inshyconsidered extinct at
active
The possibility of another
eruption occurring at some future time cannot be totally discounted
But it should be reassuring to note that with modern advances in instru-mentation it is becoming increasing-ly possible to predict the likeli-hood of impending volcanic activity
Tectonic earthquakes the other
major (and more common) type are due
to the movements of relatively solid parts of the earths crust against each other
Such motions c 3n be in the form of the swallowing of a large portion (or plate) of the crust into a trench area
For example the Eastern Pacific plate is postulated to be drifting westward at the rate of about 10 centimetres (roughly 394
inches) a year and is being swallowed or subducted under the Western Pacific plate in the Tonga trench area
The subduction of one plate under another causes friction between the plates and causes numerous earthquakes fortunately at great depthsshyabout 500 to 600 kilometres (31056 to 37267 miles)
Tectonic earthquakes occur also along fault lines which are zones of weakness in the earths crust usually at fairly shallow crustal depth
Geologists have mapped a number of fault areas in Fiji where it is apparent that one rock mass has been moved (or displaced) relative to an
adjacent rock mass through the release of stresses and strainsbrought about during the geoshylogca dvlp n the islands
Fortunately again most
of the faults which have been mapped are thought to be inshyactive
But there are some fault zones which could be active and it is quite likely that the strong 1953 earthquake was caused by fault movement offshyshore from the Kalokolevu shyso ara
The recent earthquakes felt in the Waya - Nadi -Lautoka area could be due to fault movements several miles offshore south-west of Waya
In 1976 the Mineral Reshysources Division intends to do
detailed mapping of these possibly active fault-zone areas near Suva and in the west of Waya
Other plans are for the division to make greater use of instruments and become inshyvalved in the recording of earthquakes
9
THE MAIN DANGERS Collapse of buildings due to
lack of reinforcement poor building materials (eg adobe type) or un-satisfactory foundations
Broken overJ ead power lines can
occur quite easily and are partishy
cularly dcnprous because many people have the inclination to run outdoors when they feel a strong earthquake
Landslides are possible alongLandlidsposibe aongofae fault zones or very wet areas pbrti-cularly where hillsides are steep
One person was killed in the Namosi area by landslides during the 1953 earthquake
Earth movements and chasms People naturally tend to have a very strong fear that the earth will open up and swallow them during an earth-quake However there is only one pro-perly documented case in recorded history of a person being crushed in a fissure Basically the danger of falling into chasms is minimal and the natural terroz of people from this is apparently the result of ex-
Fire can be one of the most dangerous effects of earthquake as evidenced by the disasters in Son Francisco in 1906 and Tokyo in 1923 Perhaps the worst problem from fires caused by earthquakes is that water pipes are often broken and firemen are forced to use less accessible alternative sources such as a river or the sea
Tsunamis are a particular kind
of sea wave which can build up follow-ing an earthquake In the past they have devastated cities and small settlements along the coasts of Chile Peru Alaska Hawaii Japan and other countries These waves travel across the Pacific Ocean at jet speed (more than 600 miles an hour)
In shallow wters t5unamis become a threat to life and property because they can reach up to miore than 100ft high at wave crest levels and strike with devastating force
5
We have no official record of any extensive tsunamis in Fiji except for the one caused by the 1953 earthquake which claimed some lives in Suva andKadavu
Other tsunamis are likely to have occurred in earlier times but were not identified especially as tsunamis becauseour lack of experience with them
The barrier reef round much of the islands helps to dissipate some of the wave
energy and therefore some ofthe dangers
But we should realise that we can still bevulnerable to waves especially from a southerly direction where our reef systems are less extensive
If a very strong earthshyquake is felt in Fiji you should prudently assume that it has originated within the Fiji group and is likely to have generated a tsunami
In the 1953 case the tsunami was about csft high when it hit the reef outside Suva within 10 seconds after the earthquake
A 6ft wave then travelled across the harbour and hit the waterfront about three to four minutes later causing only
slight damage and leaving many
But the tide was low at that time If it had been high tide the waves could have been about 9ft high and the effects could have been disastrous
Waves 5ft to 6ft high
also hit Lami Deubq Be--Island and Koro Island and a 15ft-high wave claimed two lives at Nakasaleka Kadavu Smaller waves were felt at Ovalauthe southern coast of Vanua Levu and in the western Lou Group
Precautons to take Because earthquakes occur
suddenly and without warning there ore only a few precouton5 people can take such as ensuring that houses are on firm foundations and are suitably reinforced to withstand earthquakes
The following modified version of on earthquake notice is reproduc-ed from a California Geology article published in October 1975
When an earthquake occurs For a minute or two the earth may pitch and roll like the deck of a ship The motion is frighteningbut unless it shakes something down on you it is probably harmless in itself Keep calm and ride 4t out Your chances of survival are good if you know how to act
During the shaking If indoors stay indoors Got under sturdy fur-niture such as a table Stay near the centre of a building and stay away from glass Do not use condles matches or other open flames
Do not run through or near buildings particularly concrete ones where there is danger of fall-ing debris If outside stay in the open away from buildings and power lines
If in a moving ccr stop but stay inside
After the r akinq Check your water and electricity
If water pipes are damaged or electric wires are shorting turn off at primary control point If in a low-lying coastal area which can be affected by tsunamis leave house and make for higher ground (see tsunami safety rules below) Turn on radio for emergency bulletins Stay out ofaamaged buildings- aftershocks can shake them down
In a 1961 study of earthquake risks in Fiji RHoutz estimated that the chance of a strong quake occurring here -was about 140 ie
6
once every 40 years This figure should be reassuring But one must remember that it is only an estimate -and that once in 40 years could be toshymorrow
Tsunami Safety Rules Tsunamis follow no disshy
cernible pattern of occurrence When you receive a tsunami warning you must assume that a dangerous wave is on its way
History shows that when the great waves finally strike they claim those who have ihed the wnin ve
ignored the warning The following tsunami
rules were extracted from a pamphlet prepared by the US Environmental Science Services Administration and they should be noted 1 An earthquake in your
area is a natural tsunami warnshying Do not stay in 1-yving coastal areas after a strong local earthquake
2 A tsunami is not a single wave but a series of waves Stay out of danger areas until on all-clear is issued by a competent authority
3 Approaching tsunamis are sometimes heralded by a noticeshyable rise or full of coastal water This is nature s tsunami
warning and should be heeded 4 A small tsunamiat one
beach can be a giant one a few bea a Do nt le the milesaway Do not let the modestse ofowve ma you lose reect for whut may follow
5 All tsunamis - like hurricanes -are potentially dangerous even though they may not damage every coastline they strike
6 Never go down to the beach to watch for a tsunami
92
yocn thetoo L see wave you are After 5Oft
too close to escape it
7 Sooner or later tsunamishit visit every coastline in the Pacific Warnings apply to yollif you live in Suva reef any Pacific coastal Olrea
8 During a tsunami emergency A section of the Suva Harbour reef your local emergency organisations forced upwards by the 1953 earthshywill try to save your life Give quake A tsunami -(tidalwave) 50ft them your fullest co-operation high hit the reef within 10 seconds
Unless otherwise determined by after the quake and sent a 6ft wavecompetent scientists potential to the shoreThis struckdanger areas are hose less than watershyfront about three to four Ainutes 50f above sea level and within one later and caused minor Cdamage but
mile of the coast for tsunamis of only because it was at low tide any origin
7
Measuring their size Earthquake magnitudes are
measured on very sensitive seismolo-
gical instruments Theseare often referred to as the Richter scale and the largest shock known to date had a magnitude of 89 on Richter scale (compared to 675 for the 1953 Suva earthquake on the same scale)
hat is in commonAnother scale use and depends on physical effects and observations is the modified Mercalli scale which is reproduced here It measures the intensity of earthquake and is graduated from one to 12 for measuring
Modifiedl Mercalli scale1956 versiont
Earthquake intensity
1 Not felt except by a very few under especially favourable (for
the arthuak)crcustanesamountsthe earthquakes) circumstances
2 Felt only by a few persons at rest especially on upper floors of buildings Delicately suspended objects may swing
3 Felt quite noticeably indoors especially on upper floors of build-ings but many people do not recog-nise it as c earthquake Standing motor cars muy rock slightly Vib-ration like passing truck Duration can be estimated
4 During the day felt indoors by many outdoors by few At night some awakened Dishes windowsdoors disturbed walls make creaking sound Sensation like heavy truck striking building Standing motor cars rocked noticeably
5 Felt by nearly everyone many
awakened Some dishes windowsetc broken a fewinstances of cracked plaster unstable objects overturned Disturbances of trees poles and other tall objects sometimes noticed Pendulum clocks may stop
6 Felt by all many frightened
and run outdoors Some heavy furni-
ture moved a few instances of fallen plaster or damaged chimneys Damage slight
8
7 Everybody runs outdoors Damage negligible in buildings of good design and construction slight to moderate in wellshybuilt ordinary structures considerable in poorly built or badly designed structures some chimneys broken Noticed
by persons driving motor cars
8 Damage slight in specialshyly designed structures conshysiderable in ordinary substantshyial buildings with partial collapse great in poorly built structures Panel walls thrown out of frame strucTures Fall
f fameystrctresasof chimneyq factory stcks
columns monuments walls Eeavy furniture overturned Savy fniur e -turned
Sand and mud ejected in small Changes in well water
Disturbs persons driving motor
cars 9 Damage considerable in
specially designed structures well-designed frame structures
thrown out of plumb great in substantial buildings with partial collapse Buildings shifted off foundations Ground cracked conspicuously Undershyground pipes broken
10 Some well-builtwooden
structures destroyed most masonry and frame structures destroyed with foundations ground badly cracked Rails bent Landslides considerable from river banks and steep slopes Shifted sand and mud Water splashed over banks
11 Few if any (masonry) Ltructures remain standing Bridges destroyed Broad fissures in ground Underground pipelines completely out of service Earth slumps and land
slips in soft ground Rails bent greatly
12 Damage total Waves seen on ground surfaces Lines of sight and level distorted Objects thrown upward into the air
FILL THIS IN TO HELP THE EARTHQUAKE STUDY
To enable an improved study of shallow local earthquakes the coshyoperation of the public is required in filling out the following questionshynaire whenever an earthquake is felt Many earthquakes are very small and sometimes are not recorded on seismological instruments This questionnaire system will enable the Mineral Resources Division to better determine the location of earthquake zones which can then be mapped in detail
EARTHQUAKE QUESTIONNAIRE
1 An earthquake was felt on at am or pm
Place
2 What direction did the shock come from
o ooo mge oe e o o o o
3 How many seconds did the quake last
4 Was the shaking rapid or slow
5 Where were you when the earthquake occurred
6 Were you awake asleep or awakened
7 Were you walking working standing sitting or lying down
8 Did the people around you feel the earthquake too
9 Did people run outside
10 Did cracks occur in the buildings you were in
11 Was the building damaged in any otherway
o
12 What is the building made of
13 Did the windows doors dishes rattle
14 Did hanging objects doors etc swing 0000000000600
Turn to next page 9
95 15 Did vases small objects furniture overturn
e
16 Did things fall off shelves
17 Did you notice any unusual waves in the sea after the quake 00 0a -0 0 000aV0a0a0 000000a000 00
18 1f so h6w soonafterwards 0 BO
e a 0000000amp000000000amp0000 a a
What were the waves like 00000619
20 Did anything else unusual happen
0 o a o e e o o 0o e o e e eo o eo 6 o e e e oIe e e o o o adegdeg e odegI e o o oo oo oe 1 8 aampv a
21o Any other remarks e
N me a
Complete formtear out this whole page and mail to
The Director of Mineral Development Mineral Resources Division Private Bag GPO SUVA
This special booklet is published by the Ministry of Information at Government Buildings in Suva for the Ministry of Lands and Mineral Resources
(JANUARY 1976)
10
96
In the wake of the 1953 quake
1M
Crack in the coral
A -rac) in the main Suva reef after the earthquake and tidal wave in 1953
12
T SANERIVE Government Printer Suva Fiji
98
APPENDIX IV SEISMOLOGICAL FACILITIES AND EARTHQUAKE HAZARD PROGRAMS IN THE SOUTHWEST PACIFIC
As part of our program of field investigations in Fiji Tonga andVanuatu our researcher was able to visit the neighboring island countries of the Southwest Pacific region During these visits he was able to meetwith scientists and public officials involved with the earthquake hazard problem facing each country In every case the governments are aware ofand have taken some action to mitigate the potential losses due to destrucshytive earthquakes but these governmental responses have varied widely fromcountry to country This report focusses on the seismological institutionsand facilities in each of the countries and their capablities in assessingand planning for carthquake hazards In the following sections we conshysider each of the island countries of this area which face a severe earthshyquake risk Fiji Tonga Vanuatu Western Samoa Solomon Islands PapuaNew Guinea and New Zealand
FIJI
Seismological Facilities
Seismological observations in Fiji are conducted by the Mineral Resources Department a subdivision of the Ministry of Energy and MineralResourcs The government has made a major commitment to seismologicalwork since the establishment of the AID-supported seismic network in 1979In fact seismological observations in Fiji have been carried out since theearly part of this century supported at first by the New Zealand scienshytific organizations and subsequently strengthened by Lamont GeologicalObservatorys Upper Mantle Project in the 1950s and 1960s In late 1979the 8 -station US AID network was established to complement three permanent stations in Viti Levu The network was significantly expanded byinstallation of a five-station telemetered network in 1981 supported byJapanese aid (Figure Al) Additional stations were installed in 1983 and 1984 the network has now expanded to an eighteen-station national networkwith excellent coverage of the Fiji region In addition MRD now has available five MEQ-800 portable seismographs for occupation of temporaryfield sites telemetered station testing and special refraction experiments While the Fiji network has experienced considerable technical difficulties it has recorded over 2000 earthquakes since its installationand provides an invaluable basis for seismological study of the Fiji region
Strong Motion Accelerographs
The Mineral Resources Department also operates a network of strongmotion accelerographs now numbering ten Kinemetrics SMA-ls (Figure A2)The initial six instruments of this network were granted to Fiji by AIDthe remainder were purchased by the Fiji government Since establishment of the SMA network three accelerogram records have been obtained from moderate-sized earthquakes in Viti Levu Records obtained from thisnetwork are expected in the long run to provide the basis for predicting
tTT Illt EAST OF +NWICH IS0 WEST OF GREENWICH III
Y 7sdeg NATIONAL NETWORK OF SEISMOGRAPHIC STATIONS 1982
AC7
DEELLAAIKOORROOMTRE
23O~~~~ ROTUMU
YASAWAIRAR C1
00
A0 KORO
-W
0
I VUNH SOUTHRIOGE A
~)AVALAU 0
NADI A A ONASAVULAU
MAGOORO A VUNIOAWALAU
VIT LE U _LAKEPe NAMOSI AUNIAA -GAJ
ALOAA0A NAMORO SUVA
VITICLEVU
13 BEOA
LEGEND A E-isting Station
I RAKRAKI A Proposed Station Toloyo
Motulu Fuloo amp
EAST OF GREENWoICH ISO WEST Of GREENWICH ITS
Figure Al Network of seismic stations in Fiji established through the assistance of US AID and Japanese aid programs
_ _ _1_ Q__
NATIOqAL NETWORK OF EAST
STRONG OF OEEwICH
MOTION IO WEST 0 OREV-1CM
ACCELEROGRAPHS 79
LEGEND
A Accelerograph
0 30 60 KLOLETRES
LBS
YASAWA
lt ---shyVANUA LEVU U
T EUW r
S|bullKORO 0
T
V2anua bala~u
N
0
LA IV)DI A MON~ASAVU V
9LAU
VITI LEVU OKA1)
(4)
GAU
LAKE1A
0 11-
Kld
A S T O r
Maluku
GREN Wa
Toloyc
I 0 W E S T O f C REEM CN I
Figure 2A Location of strong-motion accelerographs in Fiji
100
ground accelerations and thus for development of building codes specific to Fijis tectonic setting
Related Scientific Programs
The Mineral Resources Department includes an Offshore Geology sectionwhich has an active program of marine geological and geophysicalinvestigations in and around Fiji waters MRD also employs an engineeringgeologist whose work includes microzonation of the Suva area mapping ofactive faults in southeastern Viti Levu and investigation of soils subjectto earthquake-induced liquefaction An active program of geologicalmapping and structural studies is also carried out by MRD They aresupported by personncl assistance from Australia and Great Britain
Suva is also the home of the United Nations Committee for Coordinationof Offshore Prospecting in South Pacific Offshore Areas (CCOPSOPAC) Thisorganization coordinates much of the international marine research carried on in the region and has been particularly helpful with Fijisinvestigation of its offshore waters
Critical Facilities
The major development in Fiji has been in and around the capital cityof Suva The population of the metropolitan area now exceeds 130000 and most of the government commercial and industrial operations are concentrated there The city has become a major commercialtransportation and regional political center and has developed rapidly inthe past ten years Development in this period has included constructionof multistory buildings a major electric power plant expansion of theSuva harbor and most recently completion of the thirteen-story CentralMonetary Authority building in downtown Suva Much of this development hastaken place on an area of filled land close to sea level particularlyvulnerable to earthquake and tsunami damage This area was extensivelydamaged by the 1953 Suva earthquake and tsunami and is thus at significantrisk from a repeat occurrence of an event of comparable size
Other population centers with significant development include thetowns of Lautoka (pop 29000) Nadi (13000) and Ba (9000) on the islandof Viti Levu and Labasa (13000) on Vanua Levu The tourist industrywhich is a major part of Fijis economy is concentrated on the southernand western coasts of Viti Levu and is also vulnerable to earthquake andtsunami damage The major development project in Fiji is the 87-meter highMonasavu Dam in the interior of Viti Levu The earthfill dam was completedin 1983 and is planned to provide most of the countrys electric powerneeds through the end of the century
Earthquake Preparedness Programs
In awareness of the serious earthquake risk to development in Fijithe government has adopted New Zealand earthquake design codes for most ofthe urban areas of the country Seismic zone B codes applicable to areas of moderate seismic activity in New Zealand have been chosen asappropriate and are applied (in theory at least) to all domestic andcommercial construction in urban areas Considerable difficulty remains in
101
enforcement of these regulations particularly in construction of privatedwellings Major multistory building design is generally handled by overseas (Australia or New Zealand) engineers and dynamic modelling tests are generally applied for earthquake loadings at least as large as those required by the New Zealand codes The Monasavu Dam underwent dyiamictesting by Australian consulting engineers
Disaster preparedness is the responsibility of the Emergency Services Committee (EMSEC) and the Prime Ministers Relief and Rehabilitation Committee (PMRRC) EMSEC is responsible for coordination of disaster plans maintenance of essential services advice to the Cabinet on emergency measures and direction of relief work It is comprised of representativer of the related ministries and public agencies PMRRC is chaired by the Prime Minister of Fiji and has responsibility for long-termrelief policy and rehabilitation programs Fijis experience with recurrent weather-related disasters has spurred efforts for emergencycommunication systems supply distribution temporary shelters and so on Much of this hurricane disaster planning is applicable as well to earthquake and tsunami damage Fiji is also a participant in the International Tsunami Warning System
Educational programs have been handled through the Fiji BroadcastingSystem the Red Cross and the school sysem To a limited dgree the Public Works Department and the Mineral Resources Department have producededucational materials related to earthquake hazards in Fiji
TONGA
Seismological Facilities
Seismological observations in Tonga are the responsibility of the Ministry of Lands Surveys and Natural Resources Due to fiscal constraiits however these efforts have in the past been entirelydependent on foreign assistance Seismological experiments began in Tongain the mid-1960s with Lamont-Dohertys Upper Mantle Project Seismic stations were operated by Lamont-Doherty and subsequently by Cornell scientists through the early 1970s when operations were suspended In late 1983 as part of the present AID-supported seismic hazard programCornell reinstalled a three-component short-period seismograph in the capital Nukualofa The seismograph was installed upon the request of the government geologist to be operated by the Tongan government with technical assistance from Cornell Unfortunately after operation of the seismograph for eight months Tongas Cabinet decided that the drain on its resources and personnel was excessive and the instruments were disconnected in May 1984 with the components transferred to Fiji and Vanuatu where they can be utilized There are presently no plans to reinstall permanent seismographs in Tonga
Strong Motion Acceierographs
Two strong-motion accelerographs provided by the AID seismic hazard program are presently operating in Tonga one in Nukualofa and one in the northern Vavau Islands They have been in operation for one year and
102
have not to date recorded any large earthquakes They require a minimum of maintenance and their operation will continue to be supervised by the government geologists with assistance from Cornell A third accelerograph may be made available to tonga by the British Geological Survey and could bB installed on Eua Island in a zone of high activity close to the Tonga Trench Related Research Programs
The Ministry of Lands Surveys and Natural Resources employs a singlegovernment geologist whose responsibilities include coordination of oil prospecting geolcgical mapping of the islands and assessment of earthquakeand tsunami hazards There has been considerable scientific study of the Tonga Trench subduction zone by research groups from the United StatesJapan New Zealand Australia Germany and the Soviet Union More detailed marine geophysical data have been collected near Tongatapu Island byAmerican petroleum exploration groups
Critical Facilities
The capital city of Nukualofa has a population of only 20000 butdoes include several three- and four-story buildings The larger buildingshave in general been designed by foreign engineers and have included earthquake- resistant design specifications Other significantdevelopment projects include the expansion of the government wharf in Nukualofa and development of tourist resorts on Tongatapu and several of the outer islands
Earthquake Preparedness Programs
There are no building codes presently enforced in Tonga Howeverconstruction of public buildings must be approvei by the Ministries of Works and Health The largest office buildings and hotels are designed byoverseas engineering firms and generally include some earthquake loadingcriteria The Land and Environment Act currently under consideration bythe Tongan government would require review of all development projects bythe government planner application of building codes largely adapted from New Zealand codes is expected to follow
Disaster preparedness programs are the responsibility of the Cabinets National Disaster Committee including representatives from the related government ministries and departments Subcommittees focus on disaster preparedness action planning and long-term relief and rehabilitation There is no earthquake education program in Tonga
WESTERN SAMOA
Seismological Facilities
One of the earliest seismic stations in the Pacific was established atthe Apia Observatory in 1902 during the German colonial period through the University of Gbttingen In 1921 control of the observatory was transferred to the New Zealand Government Weichert seismographs were
103
operated continuously at Apia through 1957 when they were replaced by Benioff instruments at Afiamalu and by short-period Wood-Anderson instruments at Apia Since Samoan independence in 1963 the Observatory has been operated jointly by the Samoan Government and the Department of Scientific and Industrial Research (DSIR) New Zealand In 1963 a Worldwide Standard Seismograph Station was established at Afiamalu Operation of this six-component station is supported by the US Geological Survey In 1980 the station was upgraded to allow digital reccrding equipment was added to upgrade the station to the status of a Global Digital Seismic Network station Seismic records are sent to DSIR in Wellington for permanent storage
Strong Motion AccelerograDhs
A simple strong motion instrument has been operating in Apia since 1979 It is an event-triggered low-gain seismograph recording on an ink-stylus recorder At the time of our visit to Western Samoa the instrument had been out of service for several months Only one event has to date triggered the instrument
Related Scientific Programs
The Apia Observatory has also made continuous magnetic field measurements since 1905 Measurements are currently made using a Schultze earth inductor an Askania declinometer and a proton magnetometer The observatory maintains two tide guages as part of the Pacific Tsunami Warning System Offshore resource studies have been carried out through CCOPSOPAC and by various international research groups Much of the reconnaissance geological work in Western Samoa has been carried out by DSIR in New Zealand
Critical Facilities
Like many of the other island countries of the Pacific Western Samoas development has been concentrated around the capital Apia (pop 34000) A major deep-water harbor and the countrys tourist industry are based in Apia Several multistory buildings have been erected in Apia in the past several years A hydroelectric dam on Upolu Island was completed in 1978
Earthquake Preparedness Programs
There is presently no disaster plan in effect in Western Samoa The various agencies involved with emergency action are coordinated through the Police Commissioner New Zealand seismic zone B codes are applied to construction in Western Samoa Enforcement is handled by the Public Works Department Modest educational materials have been prepared by the Apia Observatory staff in English and Samoan for distribution through schools and public agencies
104
SOLOMON ISLANDS
Seismological Facilities
Seismological Observatories in the Solomon Islands are conducted bythe Ministry of Lands Energy and Natural Resources They have operated aWorldwide Standard Seismic Station in Honiara since 1962 operation of the station is supported by funds from the US Geological Survey The station was augmented by two short-period telemetered seismic stations in 1982 This three-station necwork was provided through the British GeologicalSurvey with the aim o identifying volcanic earthquakes associated with theactive volcano Savo located close to the capital
In awareness of the high volcanic risk to population centers in theSolomon Islands the Ministry has drawn up plans for two three-station telemetered arrays to be deployed around the active volcanoes on Simbo Island (New Georgia Group) and on Tinakula Island (Santa Cruz Group) Theyare presently seekirg foreign aid in the form of seismic instrumentation and technical asistance to establish the network
The Ministry also has responsibility for field surveys following majorearthquakes in the Solomon islands Studies of ground deformation and cultural effects of the large 1977 and 1984 earthquakes were made by seismology officers
Strong Motion Accelerographs
Two strong motion accelerogaphs were installed on Guadalcanal by theMinistry in late 1984 They will be responsible for maintaining the instruments but have requested Cornells assistance in analyzingaccelerograms obtained during their operation The high level of shallow activity near Guadalcanal suggests that a significant number of strong-motion records will be obtained during the lifetime of the instruments
Related Scientific Programs
The Ministry also carries out related research programs in regionalgeology minerals assessment groundwater studies and so on Extensive marine surveys have been caried out in the Solomon Islands by the USGeological Surveys Resource Assessment Program Local offshore surveyshave been carried out through CCOPSOPAC A tide gauge is maintained bythe Solomon Islands Hydrographic Unit Six proton-precession magnetometers are operated in the Solomon Islands by the Queensland University (Australia)
Critical Facilities
Over 90 of the Solomon Islands population remains in rural areas The major development is in Honiara the administrative and commercial center of the country Honiara (pop 15000) is the major shipping center of the country and now includes several multistory buildings
105
Earthquake Preparedness Programs
The Solomon Islands implemented a National Disaster Plan in 1980 subsequently revised in 1982 The Plan gives the Ministry for Home Affairs and National Development overall responsibility for coord~lation of efforts in earthquake volcanic and tsunami disasters Operational relief effort are carried out through the Disaster Operations Coordinator and the Provincial governments
The government has adopted the most stringent earthquake building code (Zone A) from New Zealand for multistory building construction in Honiara Implementation of these guidelines continues to be a problem One multistory building in Honiara (Australian High Commission Building) was severely damaged during the 1984 earthquake Some efforts have been made to develop small-scale earthquake-resistant building techniques appropriatefor rural areas The Pacific Islands Development Program organized a model house construction and workshop during early 1984 A modest outreach program has developed through the school system adult education programs and the government broadcasting company
PAPUA NEW GUINEA Seismological Facilities
The government of Papua New Guinea has made an extensive commitment to earthquake and volcanic hazard mitigation through construction of a national network of seismographs and accelerographs (Figure A3) A ten-station national network of seismographs is monitored by the Port Moresby Geophysical Observatory (Department of Minerals and Energy) Three of the remote stations are telemetered to Port Moresby via microwave links four stations operate as permanent field stations and two are operated at temporary sites on outlying islands Port Moresby is presently the site of a Worldwide Standard Seismic Station that has operated since 1958 The national network reports arrival times to the US Geological SurveysPreliminary Determination of Epicenters and the International Seismological Centre but does not routinely locate events independently
In addition to the national seismic network the Rabaul VolcanologicalObservatory operates seven seismic stations near active volcanoes around the country and a nine-station telemetry network around the Rabaul Caldera Bougainville Copper Limited opeates a 5-station network on Bougainville Island (North Solomons Province)
Strong Motion Accelerographs
The Port Moresby Geophysical Observatory maintains a national network of thirteen strong motion accelerographs distributed in the highly seismic areas of the country (Figure A3) This includes a closely spacedfour-station network around the Rabaul Caldera A single strong motion accelerograph is situated on Bougainville Island and is maintained byBougainville Copper Limited The network uses Kinemetrics SMA-I and New Zealand DSIR MO-2 instruments and has recorded tens of accelerograms since its establishment in 1967 The Observatory ispresently trying to to establish an engineering seismologist position to analyze the accumulating data and to further upgrade the accelerograph network
I I I I I I I I I I
Re--o -joso shy
Mooo u J4D (Ro-js
bull~~vASeA saxA+ Samp-cUong sloon
(twu lueoaott koRowq (KvG) jjj ccurodAj a~OlF
Accv~tj (8~Cli
Raboul (PART 2bLo(MOG) C GoTo and -4-A Duke of Tok
vie W~~IiTUI = a
Rogno SGA Kowumbukae0
lebub-gn ITPAc l-O MARCH agno BGAI
Tank ( F -goono PAAl
Coo Glooclslb Island I OSOGRAP SEISM A-D ACCELEOGR -
_____ L I IS IIsI I I
IPUGI
PAPUA NeW GUI NEeAr rp n w k
hTTWORKS MARCH 1384
IG -nol 1v
Figure A3 Papua New Guinea seismograph and accelerograph networks a
107-108
Related Scientific Activities
In addition to the Geophysical Observatory the Department of Mineralsand Energy includes the Geological Survey of Papua New Guinea The Surveyundertakes a wide range of geological investigations including regionalgeological mapping petroleum and mineral exploration engineering andenvironmental geology and energy resource development Offshore surveyshave been carried out through CCOPSOPAC as well as American and Austrrlianresearch vessels Continuous monitoring of the magnetic field is carriedout by the University of Queensland (Australia) Ten tiltmeters have beendeployed by the Volcanological Observatory to monitor ground deformation near Papua New Guineas active volcanoes Four of these instruments are deployed around Rabaul Caldera
Critical Facilities
Papua New Guinea is the most developed of the island countries of theSouthwest Pacific with a population of over 3000000 and extensive urbandevelopment The capital city of Port Moresby has a population of over 130000 with major multistory construction in the downtown area a majordeep water harbor and significant commercial and industrial activity in thePort Moresby area There is significant development as well in the smaller towns of Rabaul Lae Madang Wewak Goroka Mount Hagen Wau BuloloDaru and Kerema Major hydroelectric schemes have been established on theRamu and Rouna rivers with additional hydroelectric plans at various stages of evaluation and development Extensive mineral development hastaken place in the North Solomons Morobe and Western provinces of PapuaNew Guinea Extensive natural gas and limited oil deposits have beenlocated these may become commercially exploited in the near future
Earthquake Preparedness Programs
Papua New Guinea has a long history of earthquake and volcano-relateddisasters A national disaster program was established in 1981 and provides for a National Disaster Emergency Committee which formulates emergency government policy and a Disaster Civil Defence Committee which is responsible for implementation of short-term relief efforts Theprovincial governments are given major responsibility for initial coordination and assessment of disasters assistance is subsequentlyrequested from the federal government for major disasters Many of theprovincial governments have not revised preparedness plans since thecolonial period However particularly intense effort has been directed inEast New Britain province because of the imminence of a potentiallydestructive volcanic eruption in Rabaul Caldera
The town of Rabaul (pop 15000) is a major commercial center forPapua New Guinea and is situated directly within the caldera of an activevolcano A relatively small eruption took place at a secondary eruptivecenter near Rabaul in 1937 killing over five hundred nearby residents andforcing the evacuation of the town In order to avoid a repeat of such adisaster the government established the Volcanological Observatory withfour full-time volcanologists and real-time earthquake location andanalysis of tilt data A drastic increase in volcanic seismicity in mid-1983 led to a volcanic hazard alert and intensification ofseismological and ground deformation studies around Rabaul In addition
109
the alert allowed the provincial and national Disaster Emergency Committees to make extensive evacuation and relief plans for a possible eruption at Rabaul including preparation of a new airstrip improvement of roads and emergency water supplies communications systems detailed evacuation plans education programs and so on To date there has been remarkable cooperation of efforts by provincial national and overseas officials to mitigate the potentially devastating effects of a volcanic eruption at Rabaul
Papua New Guinea is the only country of the developing nations of the Southwest Pacific to have devised its own seismic zoning system (Figure A4)
The Nationwide Housing Code for Papua New Guinea sets up a four-level system of seismic loading oriented toward moderate-sized (to 8 stories)buildings Major buildings require independent dynamic analysis usuallycarried out by overseas engineering firms Seismic Zone 1 of the HousingCode is among the most stringent earthquake loading codes in the world and includes the town of Rabaul and much of the East New Britain and North Solomons provinces Seismic zone 2 includes the towns of Lae Wewak and Madang and is approximately equivalent to New Zealand Zone A or California loading designs The capital Port Moresby is in the lowest seismic zone (4) but buildings constructed there still require designsallowing for significant lateral loadings
Earthquake education is handled through the National Radio Government Printing Office the Civil Defence Department and the school system with information supplied by the Geophysical and Volcanological Observatories A particularly intense education effort has been mounted in Rabaul where educational materials have been produced and distributed in three languages and public involvement in preparedness plans has been emphasized
NEW ZEALAND
While New Zealand cannot be considered one of the developing countries of the Southwest Pacific its seismology programs have been responsible for much of the observational data available for the entire region Because of its importance to the other national seismology programs we briefly review here the New Zealands observational facilities Its extensive programs in engineering seismology its critical facilities and its earthquake preparedness programs will not be covered here
National Seismic Network
Seismological facilities in New Zealand are maintained by the Geophysics Division of the Department of Scientific and Industrial Research (DSIR) in Wellington The natioal standard seismograph network presentlyconsisting of thirty short-period stations is shown in Figure A5 The network routinely locates all earthquakes of ML gt 38 within New Zealandand earthquakes with Ms gt 50 for the region within 100 of New Zealand Arrival time data are routinely transmitted to the US Geological Surveyand the International Seismological Centre The events located by the network are reported in the annual New Zealand Seismological ReportSeveral hundred earthquakes are located by the DSIR national network each year
0 - - - --- - - - -
FIG 13
1SEISMIC ZONES FOR BUILDING CONSTRUCTION
- -- IN PAPUA NEW GUINEA
i 1d - - - - - _
(I -lt 53-0Fef cs r i eat a 1 982))j --_ _ -- r L - - --- a a V bull
N i - O(r-tIbd t
__ __ Po --shy
-- -- -
[i ~5- E I
Is-O I ___ oh - - --- - --shy-- shy
4 __J ft - - I- S 4 E jshy
_ _ _-i - _ j -z -
_____ _U 511
ZONE CLASSIFICATION OF CITIES I lZONE 30 1 I 3 1 153--ZONE3 4u shyW-t -~- 6--v 4- bull -
I == 1 --by- Ll _
Figure A4 Seismic zones for building construction in Papua New Guinea (jury et al 1982)
CAPE REINGA
ONERAHI
GREAT BARRIER AUCKLAND - C
5OCT 1914 WHITE ISLAND
KARAPIO EAST CAPE 0r WHAKATANE 15 WAIRKEIp I TUI 28 JUN 1921 t SEP19_-
CHATEAU TARADALE N U 2 FEB 19317 1897 1a Ju DEC 84
MANGAHAO 5 MAR 934 8 AUG 1904 - CASTLEPOINT ( A 1942
COs ELLINGTON IS5CT 18408 2C18BJN562 JAN 1855 23 MAY 1989
Figure A5 Seismograph stations of the national network (left) and the distribution of large shallow earthquakes (right) in New Zealand From Seismological Observatory Wellington (1980)
112
The network is augmented by long-period instruments operating atKaropiro Roxburgh and Wellington DSIR also operates a three-componentborehole seismometer in Wellington as part of the Seismic Research Obseervatory network supported by the US Geological Survey
Stations in Outlying Territories
New Zealand has also taken an important lead in operating seismographstations in outlying areas of the Southwest Pacific These stations havebeen extremely important in hypocentral control for the Tonga - Kermadec seismic zone and for nuclear event detection in the Pacific DSIR operates three 6 -component Worldwide Standard Seismograph stations at Afiamalu (Western Samoa) Raratonga (Cook Islands) and Scott Base (Antarctica) Short-period stations operate at Apia (Western Samoa)Campbell Island (New Zealand) Chatham Islands (New Zealand) Nadi (Fiji)Nime and Raoul Island (Kermadec Island New Zealand) Readings from these stations are routinely reported to PDE and ISC for global earthquake location
Wellington Network
A small-aperture high-gain seismic network is operated around Wellington an area of greatest seismic risk in New Zealand The stations are telemetered by radio or telephone link to the central recording site The network now consists of eleven stations Earthquakes are presentlydetected by a microprocessor-based Automatic Seismic Monitor and automated location processing is expected to follow The network routinely locates events with ML gt 15
Pukaki Network
A second microearthquake network has operated around Lake Pukaki ahydroelectric project in the South Island New Zealand The network wasestablished in 1975 to monitor reservoir-induced seismicity associated with impoundment of the reservoir The network consisted of nine stationsand was intended to operate on a temporary basis It has been closed since early 1984 with several of the stations continuing to support the national network and to monitor any future reservoir-related activity
Related Seismology Research
In addition to its regular observatory seismology the GeophysicsDivision has an active seismology research program Their studies have focussed on theoretical seismology earthquake prediction crustal structure of New Zealand historical earthquake studies nuclear eventdetection seismic risk in New Zealand strong motion studies and volcanic seismology The monitoring of active volcanoes is closely coordinated withcrustal deformation monitoring conducted by the Earth Deformation Section of the New Zealand Geological Survey
The New Zealand strong motion accelerograph network now consists of225 instruments operated by the Physics and Engineering Laboratory of DSIR Most of these instruments are of a New Zealand design (Mechanicaland Optical Accelerographs) and analog records are made on photographicfilm Three digitally recording accelexographs are now in operation in New
113
Zealand and the MO records are digitized for computational analysisAnalysis of this empirical data is being used for a revision of New Zealands building codes
114
REFERENCES
Berryman K 1979 Seismotectonic zoning study of the Fiji IslandsEarth Deformation Section Report 70 Wellington NZ Dept Sci and Indust Research 40 pp
Franco AB MP Hamnett and J Makasiale 1982 Disaster Preparednessand Disaster Experience in the South Pacific Pacific Islands Developshymental Program Honolulu 380 pp
Geological Survey of Papua New Guinea 1979 Information Booklet Port Moresby Dept Minerals and Energy 12 pp
Government of Western Samoa 1977 Apia Observatory 1902-1977 ApiaApia Observatory 8 pp
Jury RD JP Hollings and IAN Fraser 1982 The development ofseismic zones and the evaluation of lateral loadings for earthquakeresistant design of buildings in Papua New Guinea Bull NZ Nat Soc for Earthq Engr 5 123-140
Lowenstein PL 1982 Problems of volcanic hazards in Papua New GuineaGeol Surv Papua New Guinea Rept 827 Port Moresby Papua New Guinea 62 pp
McCue KF and ID Ripper 1980 The Papua New Guinea Strong MotionAccelerograph Network Geol Surv Papua New Guinea Rept 807 Port Moresby Papua New Guinea 13 pp
Mineral Resources Department Seismology Section 1983 National activityreport Fiji Submitted to Session IX Intl Coord Group for TsunamiWarning System in the Pacific Min Resources Dept Fiji Note 333Suva Fiji 4 pp
Parliament of Fiji 1984 Mineral Resources Department Annual Report forthe Year 1982 Parliam Paper No 13 Suva Fiji 90 pp
Power CA 1978 Earthquake risk in Fiji and the problems of earthquakeengineering Presented to the Fiji Society 17 pp
Prevot R and JL Chatelaiu 1983 Seismicity and Seismic Hazard in Vanuatu ORSTOM Rept 5-F3 Noumda 51 pp
Ripper ID 1982 Accelerogram library Geol Surv Papua New Guinea Rept 198211 Port Moresby Papua New Guinea 44 pp
Seismological Observatory Wellington 1980 The earthquake problem in NewZealand Alpha DSIR Extension Information Wellington NZ 4 pp
Smith WD 1979 Seismology and related research in New Zealand1975-1978 NZ DSIR Information Series No 140 30 pp
115
Smith WD 1983 Seismology and related research in New Zealand 1979-1982 Seismol Observatory Wellington Bull 276 32 pp
Solomon Islands Government 1982 National Disaster Plan 1982 Honiara Solomon Is 14 pp
116
A Rahimin A Simpson R Holmes P Rodda R Singh I Everingham K Draunidalo G Shorten M Mehrotra J Booth J Campbell
R Carter R Byrne G Gauss D Rubin
S Tongilava
D Tappin S Lemoto T Tukia
C Clarke
R Campillo R Foy T Lee J Rdcy J Chatelain R Prdvot
L ioane S losa A Titimaea
S Danitofea
D Tuni R Walshaw J Vunagi D Gwyun
INFORMATION CONTACTS
FIJI
Director Mineral Resources Dept Asst Director (MRD) Princ Geol OffshoreSeismol (MRD) Princ Geol Inform Services (MRD) Principle Geophysicist Senior Seismologist (MRD) Seismologist (MRD) Senior Engineering Geoogist (MRD) Struc Engr Suva City Council Civil Engineer Suva Engineering Geologist A Gibb amp Partners (Monasavu) Marine Geologist (CCOPSOPAC) Marine Geologist (CCOPSOPAC) Marine Geologist (CCOPSOPAC) Marine Geologist (CCOPSOPAC)
TONGA
Superintendent of Lands Surveys and Natural Resources Government Geologist (LSNR) Land Assessor (LSNR) Government Planner (LSNR)
VANUATU
Director Dept Mines Geology and Rural Water Supplies Director ORSTOM Mission Engineer ORSTOM Civil Engineer Public Works Dept Director ORSTOM Dept Geol and Geophys (Noumda) Seismologist ORSTOM (Nouma) Seismologist ORSTOM Nouma)
WESTERN SAMOA
Director Apia Observatory Senior Seismologist (AO) Geologist (AO)
SOLOMON ISLANDS
Chief Geologist Ministry of Lands Energy and Natural Resources
Senior Seismologist (MLENR) Senior Geologist (MLENR) Ministry of Home Affairs and National Development Civil Engineer Public Works Department
117
PAPUA NEW GUINEA
K Doble Chief Geologist Geological Survey I Ripper Chief Seismologist Geophysical Observatory G Seidel Information Officer Volcanological Observatory G Anderson Engineering Geologist Geological Survey J Wilkins Civil Engineer Dept of Works and Supply
NEW ZEALAND
W Smith Director Seismological Observatory Wellington
UNITED STATES
M Hamnett Pacific Islands Development Program G Burton Director Pacific Tsunami Warning Center R Sillcox Seismologist (PTWC) G Pararis-Corayannis Director International Tsunami Information Center
118
APPENDIX V TSUNAMI SAFETY RULES
1 All earthquakes do not cause tsunamis but many do When you hearthat an earthquake has occurred stand by for a tsunami emergency
2 An earthquake in your area is a natural tsunami warning Do not stayin low-lying coastal areas after a local earthquake
3 A tsunami is not a single wave but a series of waves Stay out ofdanger areas until an all-clear is issued by competent authority
4 Approaching tsunamis are sometimes heralded by a noticeable rise orfall of coastal water This is natures tsunami warning and should be heeded
5 A small tsunami at one beach can be a giant a few miles away Dontlet the modest size of one make you lose respect for all
6 The Tsunami Warning System does not issue false alarms When anocean-wide warning is issued a tsunami exists When a regionalwarning is issued a tsunami probably exists The tsunami of May 1960killed 61 people in Hilo Hawaii who thought it was just another false alarm
7 All tsunamis--like hurricanes--are potentially dangerous even thoughthey may not damage every coastline they strike
8 Never go down to the beach to watch for a tsunami When you can seethe wave you are too close to escape it
9 Sooner or later tsunamis visit every coastline in the PacificWarnings apply to you if you live in any Pacific coastal area
10 During a tsunami emergency your local Civil Defense police andother emergency organizations will try to save your life Give them your fullest cooperation
Unless otherwise determined by competent scientists potential danger areasare those less than 50 feet above sea level and within 1 mile of the coastfor tsunamis of distant origin or less than 100 feet above sea level andwithin 1 mile of the coast for tsunamis of local origin