18
Global Agricultural Marketing Perspectives International Symposium on Synergistic Approaches to Food and Water Security George Mason University October 17, 2012

Global Agricultural Marketing Perspectives
International Symposium on Synergistic Approachesto Food and Water Security
George Mason UniversityOctober 17, 2012

May 10, 2012

U.S. Corn Production
September 4, 2012 12th South African Agricultural Outlook Conference 3

May 10, 2012
U.S. Corn Supply and Demand2011/12 estimate
2012/13 forecast
Change from 2011/12Percent
Planted area (million acres) 91.9 95.9 4.3Harvested area (million acres) 84.0 89.1 6.1Yield (bushels per acre) 147.2 166.0 12.8
Million bushelsBeginning stocks 1,128 851 -24.5Production 12,358 14,790 19.7Total supply 13,506 15,656 15.9
Feed and residual 4,550 5,450 19.8Food, seed, and industrial 6,405 6,425 0.3Ethanol 5,000 5,000 0.0Domestic use 10,955 11,875 8.4
Exports 1,700 1,900 11.8Total use 12,655 13,775 8.9
Ending stocks 851 1,881 121.0Percent
Stocks to use ratio 6.7 13.7Dollars per bushel
Average market price 5.95/6.25 4.20/5.00 -24.6

May 10, 2012
World Corn ProductionCountry or Region
2011/12 estimate
2012/13 forecast
Change from 2011/12
Million Tons PercentWorld 870.5 945.8 8.7United States 313.9 375.7 19.7
Foreign 556.5 570.1 2.4Argentina 21.5 25.0 16.3Brazil 67.0 67.0 0.0Mexico 19.0 21.0 10.5Canada 10.7 12.6 17.8European Union 64.6 63.1 -2.4FSU-12 33.7 35.2 4.4Ukraine 22.8 24.0 5.1
South Africa 11.5 13.0 13.0China 191.8 193.0 0.7

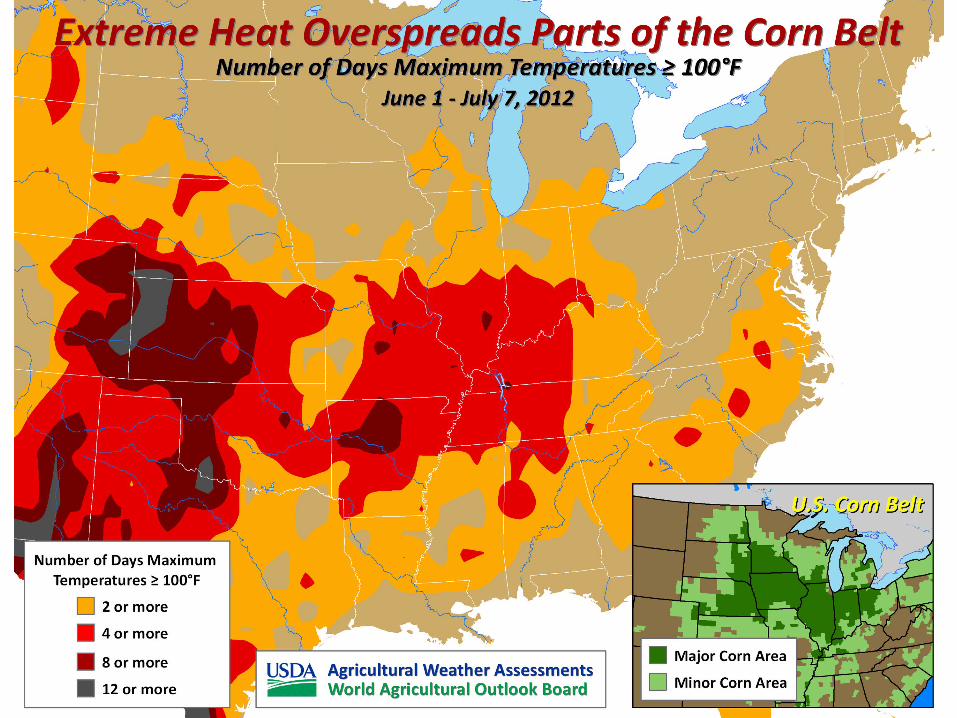
Developing Drought in June and July
September 4, 2012 12th South African Agricultural Outlook Conference 6
July 17, 2012
May 29, 2012 June 26, 2012
August 7, 2012

July 11, 2012
10th driest June;driest since 1988.
Driest Junes1. 19332. 19883. 19364. 19315. 19116. 19527. 19188. 19569. 196610. 201211. 198012. 1930

U.S. Corn Yield Projections and Forecasts
May Jun Jul Aug Sep Oct Nov Final140
145
150
155
160
165
170
20112012
Bushels per acre
NASS Forecasts and Final Esti-mate
WAOB Projections
July 11, 2012
July 11, 2012
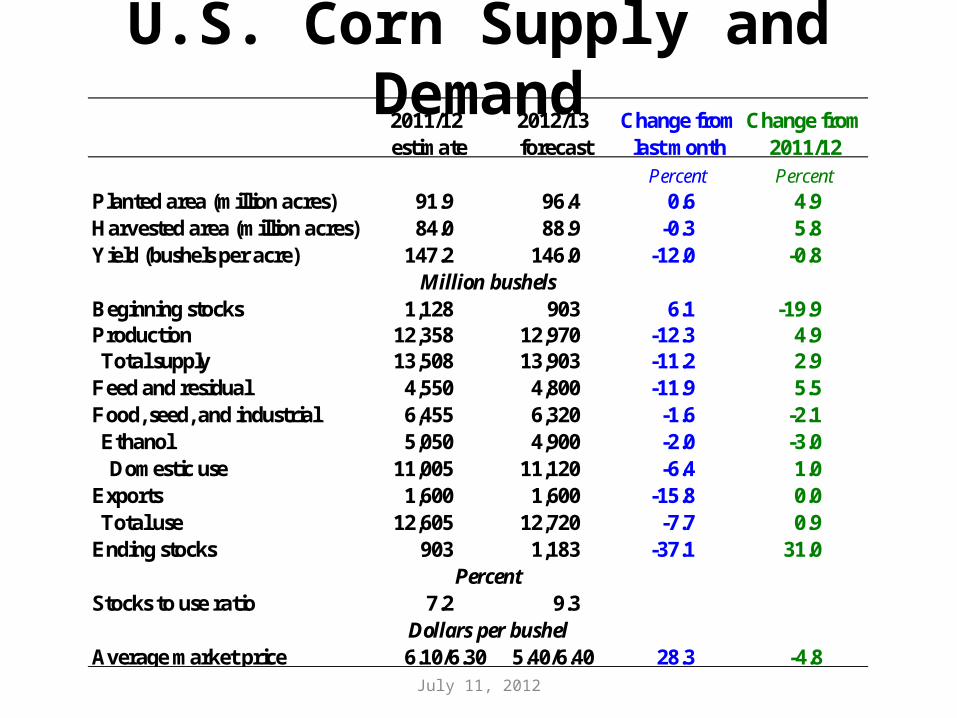
U.S. Corn Supply and Demand2011/12 estimate
2012/13 forecast
Change from last month
Change from 2011/12
Percent PercentPlanted area (million acres) 91.9 96.4 0.6 4.9Harvested area (million acres) 84.0 88.9 -0.3 5.8Yield (bushels per acre) 147.2 146.0 -12.0 -0.8
Million bushelsBeginning stocks 1,128 903 6.1 -19.9Production 12,358 12,970 -12.3 4.9Total supply 13,508 13,903 -11.2 2.9
Feed and residual 4,550 4,800 -11.9 5.5Food, seed, and industrial 6,455 6,320 -1.6 -2.1Ethanol 5,050 4,900 -2.0 -3.0Domestic use 11,005 11,120 -6.4 1.0
Exports 1,600 1,600 -15.8 0.0Total use 12,605 12,720 -7.7 0.9
Ending stocks 903 1,183 -37.1 31.0Percent
Stocks to use ratio 7.2 9.3Dollars per bushel
Average market price 6.10/6.30 5.40/6.40 28.3 -4.8

United States Corn Areas in Drought

October 11, 2012
U.S. Corn Supply and Demand2011/12 estimate
2012/13 forecast
Change from last month
Change from 2011/12
Percent PercentPlanted area (million acres) 91.9 96.9 0.6 5.5Harvested area (million acres) 84.0 87.7 0.4 4.5Yield (bushels per acre) 147.2 122.0 -0.7 -17.1
Million bushelsBeginning stocks 1,128 988 -16.3 -12.3Production 12,358 10,706 -0.2 -13.4Total supply 13,514 11,769 -1.8 -12.9
Feed and residual 4,562 4,150 0.0 -9.0Food, seed, and industrial 6,421 5,850 0.0 -8.9Ethanol 5,000 4,500 0.0 -10.0Domestic use 10,983 10,000 0.0 -8.9
Exports 1,543 1,150 -8.0 -25.5Total use 12,526 11,150 -0.9 -11.0
Ending stocks 988 619 -15.6 -37.4Percent
Stocks to use ratio 7.9 5.6Dollars per bushel
Average market price 6.22 7.10/8.50 -1.3 25.4

October 11, 2012
World Corn Production
Country or Region2011/12 estimate
2012/13 forecast
Change from previous month
Change from 2011/12
Million Tons Percent PercentWorld 877.8 839.0 -0.2 -4.4United States 313.9 271.9 -0.2 -13.4
Foreign 563.8 567.1 -0.3 0.6Argentina 21.0 28.0 0.0 33.3Brazil 72.7 70.0 0.0 -3.8Mexico 18.1 21.5 0.0 18.8Canada 10.7 11.6 -0.9 8.5European Union 65.3 55.6 -2.7 -14.8FSU-12 33.7 32.1 0.0 -4.8Ukraine 22.8 21.0 0.0 -8.0
South Africa 11.5 13.5 0.0 17.4China 192.8 200.0 0.0 3.7

August 10, 2012
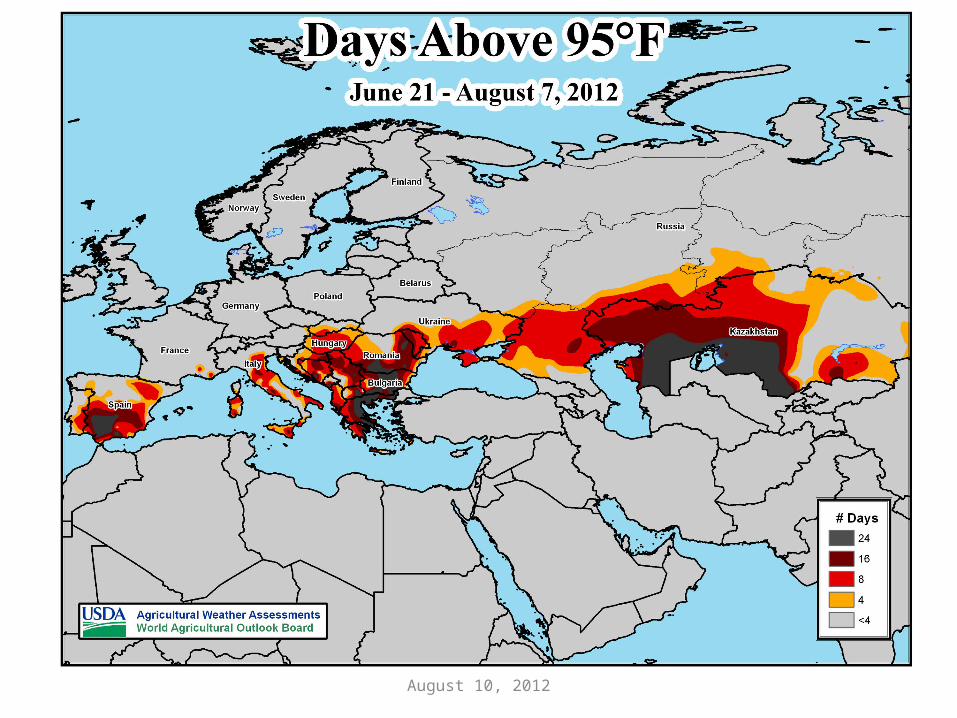
August 10, 2012

Large expanses of crop stress are noted in the late-August Vegetation Health
Index, due largely to drought and excessive heat.

World Wheat Production
October 11, 2012
Country or Region2011/12 estimate
2012/13 forecast
Change from previous month
Change from 2011/12
Million Tons Percent PercentWorld 695.7 653.0 -0.9 -6.1United States 54.4 61.8 0.0 13.5
Foreign 641.3 591.3 -1.0 -7.8Argentina 15.5 11.5 0.0 -25.8Canada 25.3 26.7 -1.1 5.7Australia 29.5 23.0 -11.5 -22.1European Union 137.4 131.6 -0.6 -4.2Russian Federation 56.2 38.0 -2.6 -32.4Ukraine 22.1 15.5 0.0 -29.9Kazakhstan 22.7 10.5 0.0 -53.8China 117.9 118.0 0.0 0.1India 86.9 93.9 0.0 8.1

END


