20
Tom Furlong, Managing Director Harvard Group International [email protected] 678.214.6065 Georgia Corporate Governance Diversity Report 2015
| Date post: | 17-Jul-2015 |
| Category: |
Business |
| Upload: | tom-furlong-cpc |
| View: | 184 times |
| Download: | 2 times |
Tom Furlong, Managing Director Harvard Group International
[email protected] 678.214.6065
Georgia Corporate Governance Diversity Report 2015
Contents Key Findings and Recommendations (summary) 2
Study Overview 3 Overall Board Demographics 5 Female Representation 5 Ethnic Representation 6 Board Member Status Metrics 8 Industry Insiders 8 Education Background 9 Age 10 Length of Board Service 11 Outside Public Board Activity 12 Board Diversity Data & Study Methodology 13 MCV* greater than $5 Billion 14 MCV between $2 Billion- $5 Billion 15 MCV between $500 Million - $2 Billion 16 MCV between $100 Million - $500 Million 17 Differences between 2014 and 2015 Studies 18
About HGI and the author 19 * Market Capitalization Value
Georgia Corporate Governance Diversity Report 2015 2 Harvard Group International
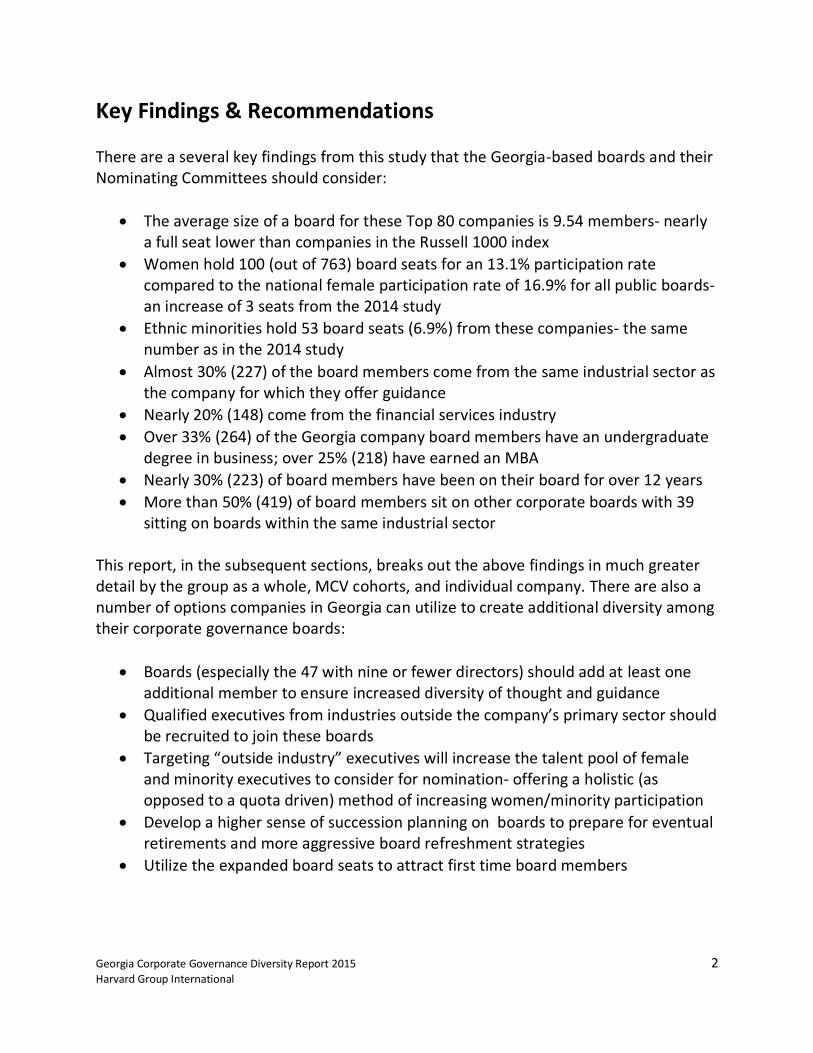
Key Findings & Recommendations There are a several key findings from this study that the Georgia-based boards and their Nominating Committees should consider:
The average size of a board for these Top 80 companies is 9.54 members- nearly a full seat lower than companies in the Russell 1000 index
Women hold 100 (out of 763) board seats for an 13.1% participation rate compared to the national female participation rate of 16.9% for all public boards- an increase of 3 seats from the 2014 study
Ethnic minorities hold 53 board seats (6.9%) from these companies- the same number as in the 2014 study
Almost 30% (227) of the board members come from the same industrial sector as the company for which they offer guidance
Nearly 20% (148) come from the financial services industry
Over 33% (264) of the Georgia company board members have an undergraduate degree in business; over 25% (218) have earned an MBA
Nearly 30% (223) of board members have been on their board for over 12 years
More than 50% (419) of board members sit on other corporate boards with 39 sitting on boards within the same industrial sector
This report, in the subsequent sections, breaks out the above findings in much greater detail by the group as a whole, MCV cohorts, and individual company. There are also a number of options companies in Georgia can utilize to create additional diversity among their corporate governance boards:
Boards (especially the 47 with nine or fewer directors) should add at least one additional member to ensure increased diversity of thought and guidance
Qualified executives from industries outside the company’s primary sector should be recruited to join these boards
Targeting “outside industry” executives will increase the talent pool of female and minority executives to consider for nomination- offering a holistic (as opposed to a quota driven) method of increasing women/minority participation
Develop a higher sense of succession planning on boards to prepare for eventual retirements and more aggressive board refreshment strategies
Utilize the expanded board seats to attract first time board members

Georgia Corporate Governance Diversity Report 2015 3 Harvard Group International
Georgia Corporate Governance Diversity Report 2015
Marietta-based Harvard Group International has long been involved with executive and board level search projects both in Georgia and throughout North America. This report is a diversity analysis of the boards of the top 80 Market Capitalization Value (MCV) Georgia-based publicly-traded companies and is intended to provide corporate boards a peer-based comparison of their composition. Georgia is home to a diverse group of public corporations from a wide variety of industrial sectors- many of them are sector leaders in terms of sales, employees, market cap, and reputation. As more small companies grow and more companies look to relocate their headquarters to our state, more opportunities for corporate governance service become available along with more opportunities for these companies to take advantage of Georgia’s deep and diverse leadership talent pool. What comprises diversity? For Georgia, it is the wide variety of industrial sectors these companies represent. The Top 80 Georgia companies fall into 11 broad industrial categories and 48 subgroups; this diversity is reflective of the U.S. industrial sector. For corporate governance, gender and ethnicity are the most common definitions considered when discussing diversity and are important measures when developing a corporate board that resembles the general population. Other factors must also be considered when determining the level of board diversity and their ability to provide quality guidance to the management teams of publicly-traded companies. The more diverse the background of a board, the more reflective it becomes. It is important for a corporate board be able to recognize changes to the economy and industry at large, the company, or its customer base. A homogeneous board can stymie innovation and make it difficult for both company and management teams to break out of comfort zones. It is important for boards to not fall prey to collective “group think” and lose the ability to objectively address complex issues facing the company they represent.
Georgia Market Cap Top 80
Aaron's Acuity Brands
AFLAC AGCO
Agilysys AGL Resources
Alimera Sciences American Software
Ameris Bancorp Arris Group
Asbury Automotive Axiall
Beazer Homes BlueLinx
Carmike Cinemas Carter's
Catchmark Timber Trust Citi Trends
Coca-Cola Company Coca-Cola Enterprises
Cousins Properties Crawford & Company
Cryolife Cumulus Media Delta Air Lines
Earthlink Ebix
Equifax Examworks Group Fidelity Southern
FleetCor Technologies Flowers Foods
Gentiva Health Services Genuine Parts Company
Global Payments Graphic Packaging
Gray Television Haverty Furniture
HD Supply Heritage Financial

Georgia Corporate Governance Diversity Report 2015 4 Harvard Group International
This report looks at a range of criteria when evaluating Board diversity as well as trends that might affect Board composition including the size of company and industrial sector in which the company operates. The six diversity criteria reviewed are:
Gender and Ethnicity
Focus- Inside/Outside the company’s industrial sector
Education Background
Age
Length of Board Service
Other Corporate Board Experience The 80 largest publicly-traded companies based in Georgia were analyzed to gain a thorough understanding of the corporate governance landscape within the state. Since a primary concern for the Board of Directors is to look out for the concerns of the shareholder, we feel that MCV is a true indicator for determining the companies included on this report. The focus of this report is on the director composition of Georgia based firms; privately held companies and divisions of out-of-state/foreign based conglomerates were not included in our research. This survey looks at the Top 80 companies both collectively as a group as well as by Market Capitalization Value: MCV greater than $5 billion (22 companies), $2 billion to $5 billion (17 companies), $500 million to $2 billion (22 companies), and $100 million to $500 million (19 companies). Generally, the smaller the company, the smaller and less diverse the Corporate Board becomes though several firms go against this trend. There are opportunities for companies falling in the small and mid-size cohorts to become more diverse with their corporate governance teams and, through this effort, increase their sales, profitability, and MCV as well as offering enhanced returns for their shareholder’s investments.
Georgia Market Cap Top 80
Home Depot ICE Group Interface InterNAP Invesco
Manhattan Associates Marine Products
MedAssets MiMedx Group
Mohawk Industries NCR
Neenah Paper Newell Rubbermaid
Numerex Ocwen Financial Oxford Industries Piedmont Office
Popeyes Post Properties
Preferred Apartment Premiere Global Services
PRGX Global Primerica
PulteGroup Rock-Tenn
Rollins RPC Saia
Schweitzer-Mauduit Southeastern Bank Southern Company
State Bank Financial SunTrust Banks
Synovus Thomasville Bancshares
Total System Services United Community Banks
United Parcel Service Veritiv
Zep

Georgia Corporate Governance Diversity Report 2015 5 Harvard Group International
Overall Board Demographics The Top 80 Market Capitalization Value(MCV) Georgia public companies have a combined 763 directors who are responsible for the guidance and oversight of over $800 billion in market cap value, $400 billion in annual sales, and a worldwide workforce of 1.5 million employees. Board size ranges from 16 (Delta Air Lines) to 5 directors (Citi Trends). The average size of a board is a fraction over 9.5 directors: 20 boards have more than 10, 26 boards have less than 9, while 34 meet the average size of 9 or 10 directors.
Board Size for Company Size All Boards > $5B $5B-$2B $2B-$500M $500M-$100M
14+ Directors 8 7 1 0 0
11 to 13 12 8 1 2 1
9 or 10 34 7 11 9 7
5 to 8 26 0 4 11 11
Total 80 22 17 22 19
Corporate boards generally decrease in size as the MCV group gets smaller: the range is an average of 12 board members in the largest MCV group down to 7.9 for the smallest MCV group.
Average Board Sizes by MCV All Boards > $5B $5B-$2B $2B-$500M $500M-$100M
# Directors 763 264 161 188 150
# Companies 80 22 17 22 19
Ave Dir/Board 9.5 12 9.4 8.5 7.9
Female Representation Several studies (most recently by Credit Suisse in September 2014) show that companies with at least one woman on their board outperform companies with an all-male board in a number of metrics. These metrics include stock price appreciation, return on equity, and higher dividend payouts- and that boards with multiple women have even higher performance results. Currently 100 women sit on the 80 corporate boards in Georgia (13.1% of all board members). Catalyst (an organization that tracks female CEO’s and Board members) reported that women held 16.9% of all public board seats in the U.S.A in 2013. The largest Georgia MCV company cohort have 42 women sitting on 264 seats for a 15.9% ratio- slightly off the 16.1% representation rate nationally among Fortune 500 companies for 2013.
Board Composition by Women All Boards > $5B $5B-$2B $2B-$500M $500M-$100M
Women Serving 100 42 23 23 12
Total Board Seats 763 264 161 188 150
% Women Board Members 13.1% 15.9% 14.3% 12.2% 8.0%

Georgia Corporate Governance Diversity Report 2015 6 Harvard Group International
Female board participation is highest with two companies (Coca-Cola and Coca-Cola Enterprises) each having four women serving on their boards. There are 21 companies in the Georgia Top 80 that have no female board representation.
Board Female Representation # Women on Board All Boards > $5B $5B-$2B $2B-$500M $500M-$100M
Four 2 2 0 0 0
Three 6 3 1 1 1
Two 23 9 7 5 2
One 28 7 6 10 5
Zero 21 1 3 6 11
Total 80 22 17 22 19
% Boards w/ Women 74% 95.5% 82.4% 72.7% 42.1%
Ethnic Representation At this time, 53 people of color sit on the top 80 Georgia boards (6.95% of all board members): 33 members are African-American (4.3%), 12 are of Hispanic heritage (1.6%), and 8 (1.0%) are of Asian descent. Minority board participation, like that of women, decreases as companies become smaller.
Board Members by Ethnicity Group All Boards > $5B $5B-$2B $2B-$500M $500M-$100M
White 710 236 149 176 149
African-American 33 20 7 6 0
Hispanic 12 6 2 4 0
Asian 8 2 3 2 1
All Board Members 763 264 161 188 150
% of Color 6.95% 10.61% 7.45% 6.38% 0.67%
Popeyes Louisiana Kitchen leads all companies with 37.5% of their board seats held by ethnic inclusion group members, followed by Ebix (33%) and Primerica (30%). Twelve companies have Board member representation from two minority groups; two companies (Home Depot and Popeyes Louisiana Kitchen) have representation from all three ethnic groups on their boards.
Board Representation (# Companies) Group All Boards > $5B $5B-$2B $2B-$500M $500M-$100M
African American 24 14 5 5 0
Hispanic 11 6 2 3 0
Asian 8 2 3 2 1
Multiple Group 12 7 2 3 0
None 37 8 9 16 18
Georgia Corporate Governance Diversity Report 2015 7 Harvard Group International
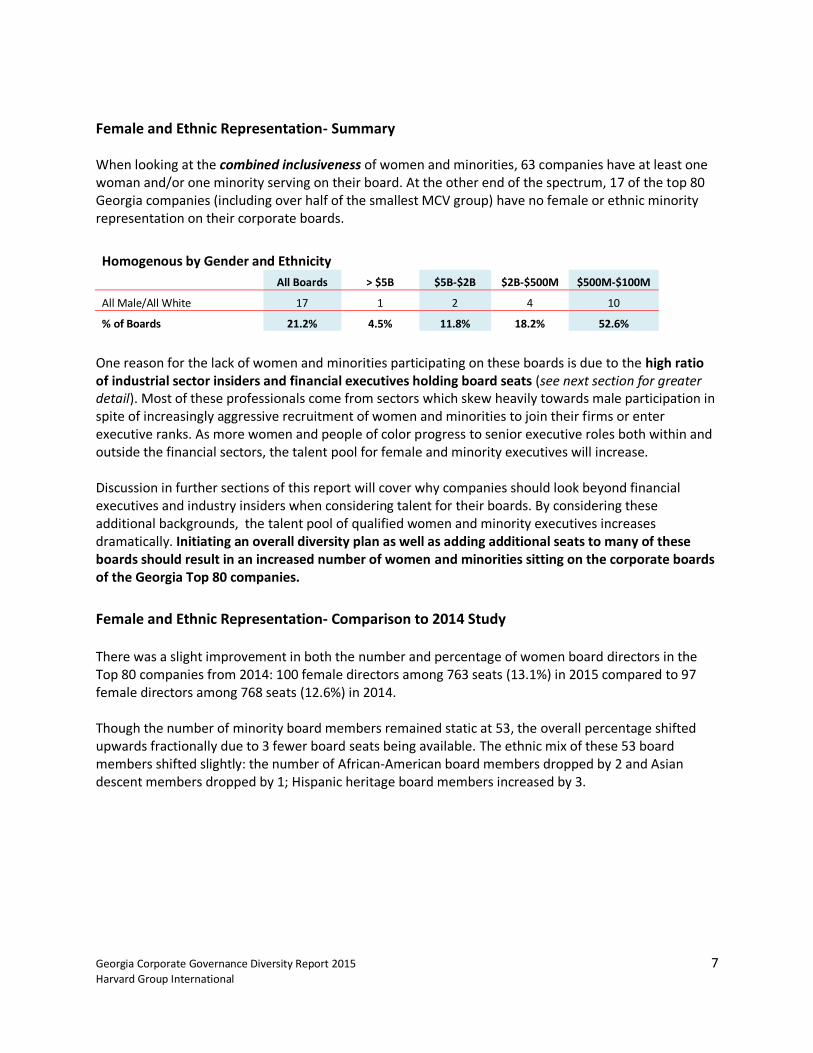
Female and Ethnic Representation- Summary When looking at the combined inclusiveness of women and minorities, 63 companies have at least one woman and/or one minority serving on their board. At the other end of the spectrum, 17 of the top 80 Georgia companies (including over half of the smallest MCV group) have no female or ethnic minority representation on their corporate boards.
Homogenous by Gender and Ethnicity
All Boards > $5B $5B-$2B $2B-$500M $500M-$100M
All Male/All White 17 1 2 4 10
% of Boards 21.2% 4.5% 11.8% 18.2% 52.6%
One reason for the lack of women and minorities participating on these boards is due to the high ratio of industrial sector insiders and financial executives holding board seats (see next section for greater detail). Most of these professionals come from sectors which skew heavily towards male participation in spite of increasingly aggressive recruitment of women and minorities to join their firms or enter executive ranks. As more women and people of color progress to senior executive roles both within and outside the financial sectors, the talent pool for female and minority executives will increase. Discussion in further sections of this report will cover why companies should look beyond financial executives and industry insiders when considering talent for their boards. By considering these additional backgrounds, the talent pool of qualified women and minority executives increases dramatically. Initiating an overall diversity plan as well as adding additional seats to many of these boards should result in an increased number of women and minorities sitting on the corporate boards of the Georgia Top 80 companies. Female and Ethnic Representation- Comparison to 2014 Study There was a slight improvement in both the number and percentage of women board directors in the Top 80 companies from 2014: 100 female directors among 763 seats (13.1%) in 2015 compared to 97 female directors among 768 seats (12.6%) in 2014. Though the number of minority board members remained static at 53, the overall percentage shifted upwards fractionally due to 3 fewer board seats being available. The ethnic mix of these 53 board members shifted slightly: the number of African-American board members dropped by 2 and Asian descent members dropped by 1; Hispanic heritage board members increased by 3.

Georgia Corporate Governance Diversity Report 2015 8 Harvard Group International
Board Member Status Metrics Diversity among business experience is a major contribution a Corporate Board can offer to their company’s management team. Indeed, one of the intentions of the Sarbanes-Oxley Act of 2002 was to increase the background diversity of corporate boards. This diversity of knowledge among board members helps insure that a company can remain abreast of changes in the overall economy and adapt the company’s direction to take best advantage as opportunities present themselves. The ability to bring successful business learnings from a variety of backgrounds is necessary to insure that management’s business plan is both well founded and executed.
1) Industry Insiders One avenue to help avoid collective “group think” is to ensure the industrial diversity on a corporate board. A board that has too many (or too few) industry insiders can become blind to outside influences that, on a macroeconomic scale, can have a severe impact on a company’s operations. The experiences an executive has gained in one industry can offer quality guidance and potentially competitive advantage to the company they help govern. Of the 763 board members in the Top 80 companies, 227 (29.8%) come from the same industry as the company where they offer governance. The largest companies, as a group, have more industry outsiders as a percentage of the entire board than the other MCV groups; the other three groups have slightly more than a third of their board members come from inside their industrial sector. The Financial Services sector is also heavily represented on these boards: 148 members (19.4%) have a financial industry background.*
Director Industry Focus Status All Boards > $5B $5B-$2B $2B-$500M $500M-$100M
# Inside Industry 227 59 53 60 55
# Financial Industry 148 55 37 35 21
# Other Industries 388 150 71 93 74
Total 763 264 161 188 150
% Industry Insiders 29.8% 22.3% 32.9% 31.9% 36.7%
* In this study, executives from the Private Equity, Institutional Investment, Public Accounting, and Banking fields are considered to come from the “Financial Industry”; CFO & CAO executives from other sectors are not considered to have a “Financial Industry” background. Of the Top 80 companies in Georgia, the percentage of industry insiders increases as the MCV group size decreases. The smaller MCV companies also have the smaller boards, decreasing the diversity of outside thought and guidance with these teams.

Georgia Corporate Governance Diversity Report 2015 9 Harvard Group International
Board Composition of Industry Insiders Status All Boards > $5B $5B-$2B $2B-$500M $500M-$100M
Industry Insiders ≤ 20% 24 10 4 6 4
Industry Insiders 21%-39% 35 11 8 10 6
Industry Insiders ≥ 40% 21 1 5 6 9
Total 80 22 17 22 19
Financial executives hold nearly 20% of all board seats with the Top 80 companies, with the boards from the top two largest MCV groups exceeding this average. Private Equity and Institutional Investment Capital make up a larger proportion of the total shareholder value in many of these companies which offers an explanation for this higher industrial background ratio. Board Composition of Financial Executives
Status All Boards > $5B $5B-$2B $2B-$500M $500M-$100M
Financial Executives ≤ 15% 34 6 7 10 11
Financial Executives 16-24% 21 8 4 5 4
Financial Executives ≥ 25% 25 8 6 7 4
Total 80 22 17 22 19
2) Education Background The development of critical thinking ability is honed during a person’s collegiate experience. The diversity of undergraduate education background among a corporate board helps to insure that multiple avenues of thought process are utilized when solving a problem: a person with a degree in physics may approach a problem differently than one with a degree in literature; that person’s approach may be different one than an accounting major. Just over a third of Georgia board members have an undergraduate degree in a business curriculum (accounting, finance, marketing, or business): the top MCV companies are slightly below this mark while the other three cohorts trend slightly above. This ratio is similar to boards from leading energy companies- an industrial sector noted for high MCV and capital expenditures. Keeping a business degree ratio of under 40% demonstrates there is significant business curriculum background in decision making process without falling into a “group think” scenario based on educational experiences.
College Degree of Board Members Discipline All Boards > $5B $5B-$2B $2B-$500M $500M-$100M
Business 264 83 58 66 57
Other 499 181 103 122 93
Total 763 264 161 188 150
% Business Degree 34.6% 31.4% 36.0% 35.1% 38.0%

Georgia Corporate Governance Diversity Report 2015 10 Harvard Group International
Nearly 30% of the board members (218 out of 763) from these companies have earned a M.B.A. degree. Anecdotally, many non-business undergraduate degree holders also have a M.B.A. while a number of business undergraduates did not continue on to business school. The percentage of M.B.A. holders from the top three MCV groups is similar; only in the lowest MCV category does the percentage (and number) of MBA holders fall below the state average by a considerable margin.
Board Members with MBA All Boards > $5B $5B-$2B $2B-$500M $500M-$100M
MBA holders 218 84 48 57 29
% MBA Degree 28.6% 31.8% 29.8% 30.3% 19.3%
3) Age While the age of a Board Director at first glance might not indicate a measure of diversity, having a broad range of age experience levels can offer differing perspectives that might impact the guidance given to their company’s management teams. There is value in the saying that “Old School is still the Best School” because of the mentoring capabilities that Baby Boomer board members can offer to younger management teams. At the same time, having board members in the same age cohort as the management teams they advise offers shared life experiences from the rising tide of Generation X/Y executive leaders. Currently over half of board members in the U.S. Fortune 1000 companies are over 65 years of age; nearly 2/3 of this group plan to step down from their roles within the next four years. Companies in the Georgia Top 80 need to prepare for a similar board turnover; boards that are skewed with too many members over age 70 also risk having a rapid drain of experience on their boards due to retirements. The percentage of “younger” (age < 60 years) board members increases as the MCV decreases; the smallest MCV group has a plurality of board members in the younger age cohort. In general, these smaller companies are more aggressive in targeting younger/first time board members. This lower MCV board member youth profile may be due in part to the industrial sectors and age of the companies: 6 of the 19 companies in this group are in the technology sector and 10 were incorporated within the past 15 years.
Age of Directors Status All Boards > $5B $5B-$2B $2B-$500M $500M-$100M
< 60 Years 277 89 51 74 63
60-69 Years 332 127 71 81 53
> 70 Years 154 48 39 33 34
Total 763 264 161 188 150
Georgia Corporate Governance Diversity Report 2015 11 Harvard Group International
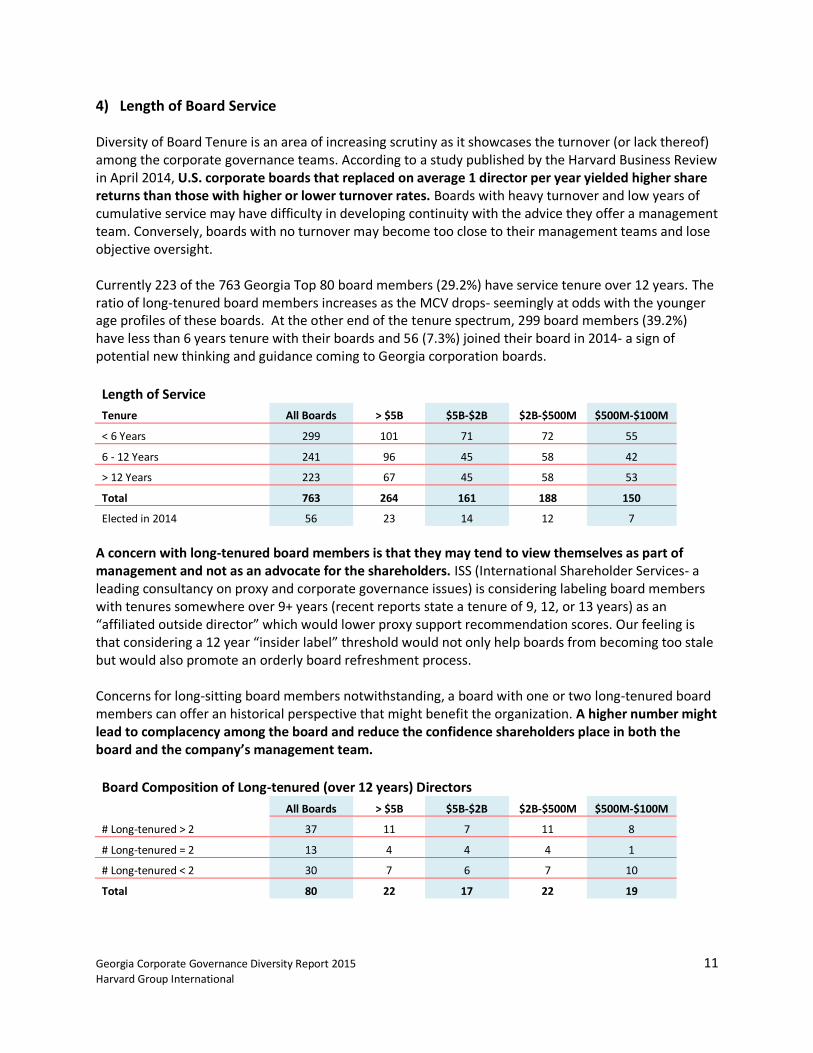
4) Length of Board Service
Diversity of Board Tenure is an area of increasing scrutiny as it showcases the turnover (or lack thereof) among the corporate governance teams. According to a study published by the Harvard Business Review in April 2014, U.S. corporate boards that replaced on average 1 director per year yielded higher share returns than those with higher or lower turnover rates. Boards with heavy turnover and low years of cumulative service may have difficulty in developing continuity with the advice they offer a management team. Conversely, boards with no turnover may become too close to their management teams and lose objective oversight. Currently 223 of the 763 Georgia Top 80 board members (29.2%) have service tenure over 12 years. The ratio of long-tenured board members increases as the MCV drops- seemingly at odds with the younger age profiles of these boards. At the other end of the tenure spectrum, 299 board members (39.2%) have less than 6 years tenure with their boards and 56 (7.3%) joined their board in 2014- a sign of potential new thinking and guidance coming to Georgia corporation boards.
Length of Service Tenure All Boards > $5B $5B-$2B $2B-$500M $500M-$100M
< 6 Years 299 101 71 72 55
6 - 12 Years 241 96 45 58 42
> 12 Years 223 67 45 58 53
Total 763 264 161 188 150
Elected in 2014 56 23 14 12 7
A concern with long-tenured board members is that they may tend to view themselves as part of management and not as an advocate for the shareholders. ISS (International Shareholder Services- a leading consultancy on proxy and corporate governance issues) is considering labeling board members with tenures somewhere over 9+ years (recent reports state a tenure of 9, 12, or 13 years) as an “affiliated outside director” which would lower proxy support recommendation scores. Our feeling is that considering a 12 year “insider label” threshold would not only help boards from becoming too stale but would also promote an orderly board refreshment process. Concerns for long-sitting board members notwithstanding, a board with one or two long-tenured board members can offer an historical perspective that might benefit the organization. A higher number might lead to complacency among the board and reduce the confidence shareholders place in both the board and the company’s management team.
Board Composition of Long-tenured (over 12 years) Directors
All Boards > $5B $5B-$2B $2B-$500M $500M-$100M
# Long-tenured > 2 37 11 7 11 8
# Long-tenured = 2 13 4 4 4 1
# Long-tenured < 2 30 7 6 7 10
Total 80 22 17 22 19
Georgia Corporate Governance Diversity Report 2015 12 Harvard Group International
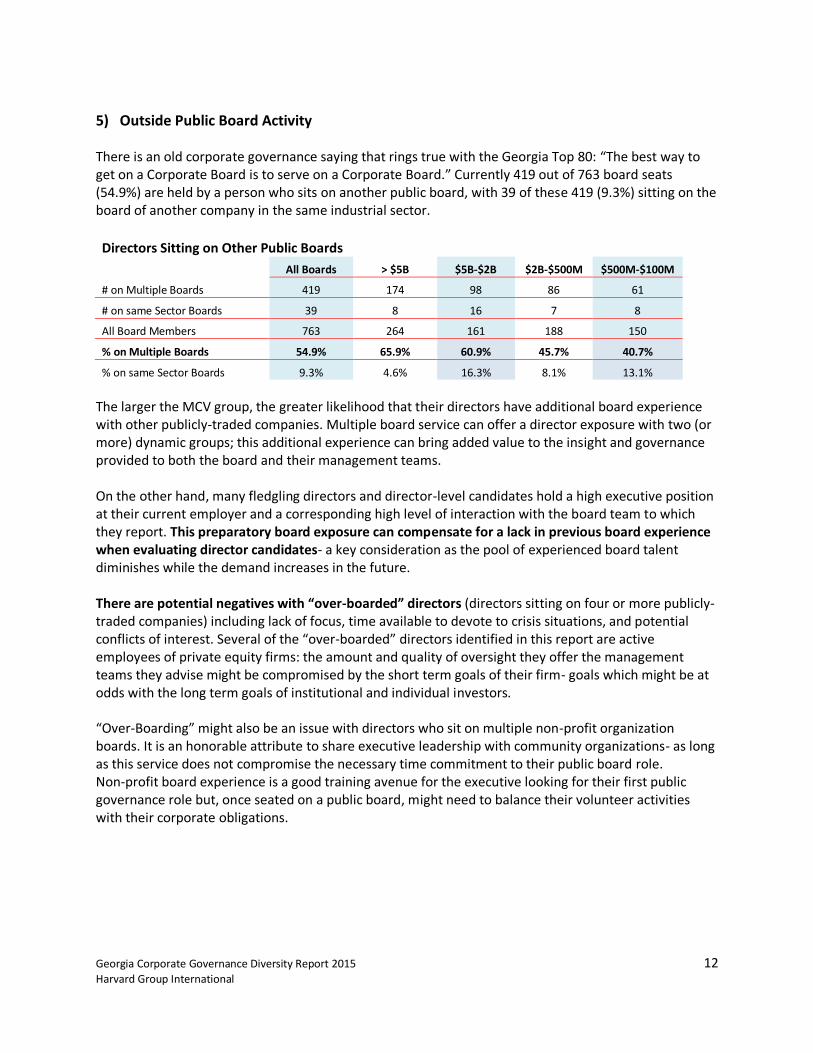
5) Outside Public Board Activity There is an old corporate governance saying that rings true with the Georgia Top 80: “The best way to get on a Corporate Board is to serve on a Corporate Board.” Currently 419 out of 763 board seats (54.9%) are held by a person who sits on another public board, with 39 of these 419 (9.3%) sitting on the board of another company in the same industrial sector.
Directors Sitting on Other Public Boards
All Boards > $5B $5B-$2B $2B-$500M $500M-$100M
# on Multiple Boards 419 174 98 86 61
# on same Sector Boards 39 8 16 7 8
All Board Members 763 264 161 188 150
% on Multiple Boards 54.9% 65.9% 60.9% 45.7% 40.7%
% on same Sector Boards 9.3% 4.6% 16.3% 8.1% 13.1%
The larger the MCV group, the greater likelihood that their directors have additional board experience with other publicly-traded companies. Multiple board service can offer a director exposure with two (or more) dynamic groups; this additional experience can bring added value to the insight and governance provided to both the board and their management teams. On the other hand, many fledgling directors and director-level candidates hold a high executive position at their current employer and a corresponding high level of interaction with the board team to which they report. This preparatory board exposure can compensate for a lack in previous board experience when evaluating director candidates- a key consideration as the pool of experienced board talent diminishes while the demand increases in the future. There are potential negatives with “over-boarded” directors (directors sitting on four or more publicly-traded companies) including lack of focus, time available to devote to crisis situations, and potential conflicts of interest. Several of the “over-boarded” directors identified in this report are active employees of private equity firms: the amount and quality of oversight they offer the management teams they advise might be compromised by the short term goals of their firm- goals which might be at odds with the long term goals of institutional and individual investors. “Over-Boarding” might also be an issue with directors who sit on multiple non-profit organization boards. It is an honorable attribute to share executive leadership with community organizations- as long as this service does not compromise the necessary time commitment to their public board role. Non-profit board experience is a good training avenue for the executive looking for their first public governance role but, once seated on a public board, might need to balance their volunteer activities with their corporate obligations.
Georgia Corporate Governance Diversity Report 2015 13 Harvard Group International
Board Diversity Data and Study Methodology
The following pages break down the Top 80 Georgia based public companies by MCV into the four broad groups outlined in this report: MCV greater than $5 billion, $2 billion to $5 billion, $500 million to $2 billion, and $100 million to $500 million. The various charts show the total number of directors and the break-out by gender. Industry and educational background, age and board tenure (including members elected in 2014), and other public board experience is also included in the charts. A few notes about the methodology used for this report:
MCV’s listed were of January 2, 2015. The values were obtained from OneSource Information Services which calculates MCV by multiplying the closing stock price on Friday (or the last trading session of the week) by the number of outstanding shares of common stock.
The directors serving on a company’s board were taken from the website of each listed company on December 31, 2014.
The demographic and other status criteria of the directors were gained through research including reviewing the company’s websites and most recent proxy statements, LexisNexis and search engine review of the directors, LinkedIn profile reviews, and personal contact.
Changes that may have occurred between the compilation of data and the publication date of this report are not reflected in either the commentary in the preceding pages or the following graph data.
Great effort has been made to verify the accuracy of the data in this report. Any errors or omissions are purely unintentional. Please contact the author of this report should any perceived discrepancies exist so the data can be amended for future reports.

Georgia Corporate Governance Diversity Report 2015 14 Harvard Group International
Market Cap Value over $5 Billion
Gender Background Degree Age Service Length Boards
Marke
t Cap
Valu
e
(millio
ns)
# Dire
ctors
Male
Fem
ale
Secto
r
Finan
cial
Oth
er
Bu
sine
ss
Oth
er o
r N/A
MB
A
<60
60
- 69
70
+
< 6 ye
ars
6 - 1
2 Y
ears
> 12
Ye
ars
20
14
Oth
er
Secto
r
Acuity Brands 6,067 11 10 1 1 3 7 5 6 5 2 4 5 5 3 3 2 8 0
AFLAC 27,522 12 10 2 3 3 6 1 11 3 2 9 1 3 3 6 0 4 0
AGL Resources 6,532 15 12 3 3 3 9 3 12 4 2 9 4 0 10 5 0 14 0
Coca-Cola Company 184,578 15 11 4 1 3 11 3 12 2 6 3 6 6 3 6 0 12 0
Coca-Cola Enterprises 10,607 12 8 4 3 4 5 3 9 5 5 7 0 5 6 1 0 10 0
Delta Air Lines 41,161 16 14 2 5 1 10 7 9 6 7 6 3 7 8 1 2 10 0
Equifax 9,806 10 9 1 2 3 5 2 8 1 4 6 0 1 8 1 0 7 0
FleetCor Technologies 12,597 9 9 0 2 4 3 6 3 6 5 3 1 4 2 3 1 5 0
Genuine Parts Company 16,282 14 12 2 4 3 7 2 12 3 3 8 3 5 4 5 2 7 0
Global Payments 5,455 9 8 1 5 2 2 6 3 2 3 3 3 3 3 3 1 8 0
HD Supply 5,768 11 9 2 1 3 7 4 7 3 5 5 1 8 3 0 4 7 2
Home Depot 136,303 12 10 2 4 2 6 4 8 6 7 4 1 5 7 0 2 8 1
ICE Group 24,530 13 12 1 3 3 7 3 10 5 3 6 4 4 4 5 0 8 0
Invesco 16,863 9 8 1 1 2 6 4 5 3 1 5 3 4 3 2 0 6 1
Mohawk Industries 11,268 9 8 1 3 1 5 1 8 4 3 3 3 3 2 4 1 6 0
Newell Rubbermaid 10,264 13 11 2 2 1 10 6 7 5 6 6 1 4 5 4 1 9 1
PulteGroup 7,883 9 7 2 2 0 7 4 5 4 6 3 0 4 4 1 0 5 0
Rock-Tenn 8,553 10 8 2 2 1 7 4 6 4 6 4 0 5 3 2 0 6 0
Southern 44,424 14 11 3 3 4 7 1 13 0 2 12 0 8 5 1 2 9 1
SunTrust Banks 21,760 12 10 2 2 3 7 3 9 6 3 7 2 8 2 2 1 7 0
Total System Services (TSYS) 6,352 14 13 1 4 5 5 6 8 2 2 7 5 2 2 10 2 7 2
United Parcel Service 99,919 15 12 3 3 1 11 5 10 5 6 7 2 7 6 2 2 11 0
Total 714,492 264 222 42 59 55 150 83 181 84 89 127 48 101 96 67 23 174 8
Georgia Corporate Governance Diversity Report 2015 15 Harvard Group International
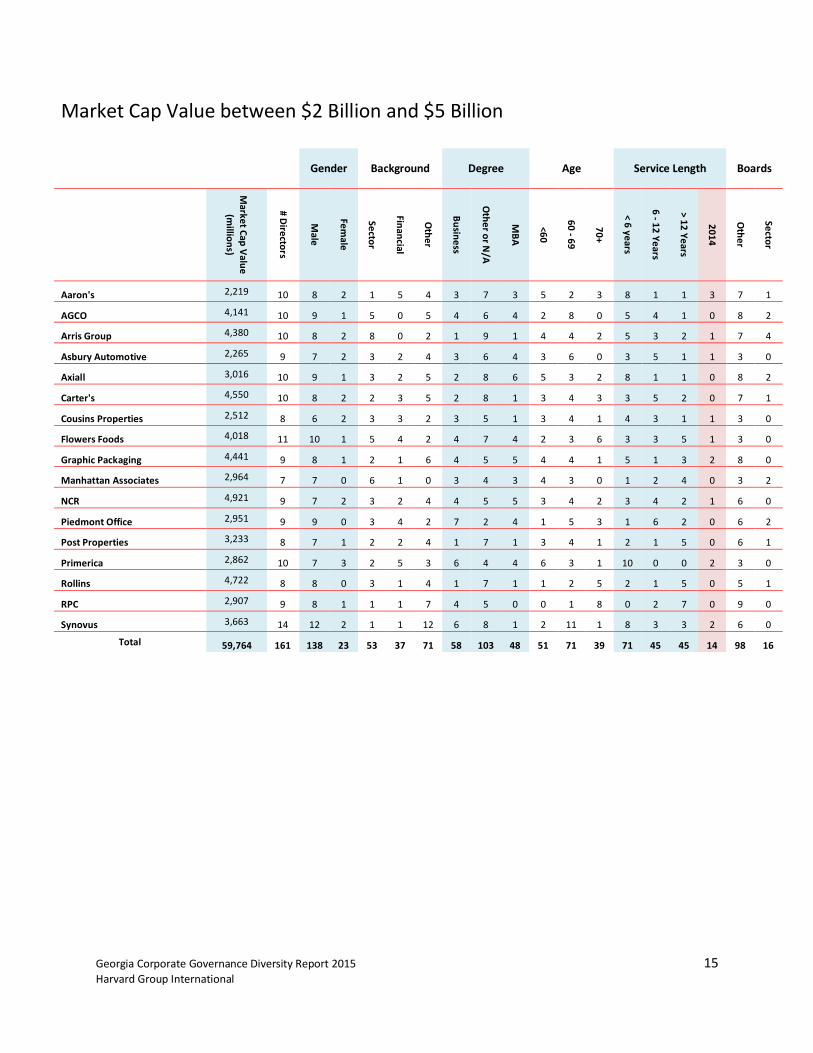
Market Cap Value between $2 Billion and $5 Billion
Gender Background Degree Age Service Length Boards
Marke
t Cap
Valu
e
(millio
ns)
# Dire
ctors
Male
Fem
ale
Secto
r
Finan
cial
Oth
er
Bu
sine
ss
Oth
er o
r N/A
MB
A
<60
60
- 69
70
+
< 6 ye
ars
6 - 1
2 Y
ears
> 12
Ye
ars
20
14
Oth
er
Secto
r
Aaron's 2,219 10 8 2 1 5 4 3 7 3 5 2 3 8 1 1 3 7 1
AGCO 4,141 10 9 1 5 0 5 4 6 4 2 8 0 5 4 1 0 8 2
Arris Group 4,380 10 8 2 8 0 2 1 9 1 4 4 2 5 3 2 1 7 4
Asbury Automotive 2,265 9 7 2 3 2 4 3 6 4 3 6 0 3 5 1 1 3 0
Axiall 3,016 10 9 1 3 2 5 2 8 6 5 3 2 8 1 1 0 8 2
Carter's 4,550 10 8 2 2 3 5 2 8 1 3 4 3 3 5 2 0 7 1
Cousins Properties 2,512 8 6 2 3 3 2 3 5 1 3 4 1 4 3 1 1 3 0
Flowers Foods 4,018 11 10 1 5 4 2 4 7 4 2 3 6 3 3 5 1 3 0
Graphic Packaging 4,441 9 8 1 2 1 6 4 5 5 4 4 1 5 1 3 2 8 0
Manhattan Associates 2,964 7 7 0 6 1 0 3 4 3 4 3 0 1 2 4 0 3 2
NCR 4,921 9 7 2 3 2 4 4 5 5 3 4 2 3 4 2 1 6 0
Piedmont Office 2,951 9 9 0 3 4 2 7 2 4 1 5 3 1 6 2 0 6 2
Post Properties 3,233 8 7 1 2 2 4 1 7 1 3 4 1 2 1 5 0 6 1
Primerica 2,862 10 7 3 2 5 3 6 4 4 6 3 1 10 0 0 2 3 0
Rollins 4,722 8 8 0 3 1 4 1 7 1 1 2 5 2 1 5 0 5 1
RPC 2,907 9 8 1 1 1 7 4 5 0 0 1 8 0 2 7 0 9 0
Synovus 3,663 14 12 2 1 1 12 6 8 1 2 11 1 8 3 3 2 6 0
Total 59,764 161 138 23 53 37 71 58 103 48 51 71 39 71 45 45 14 98 16
Georgia Corporate Governance Diversity Report 2015 16 Harvard Group International
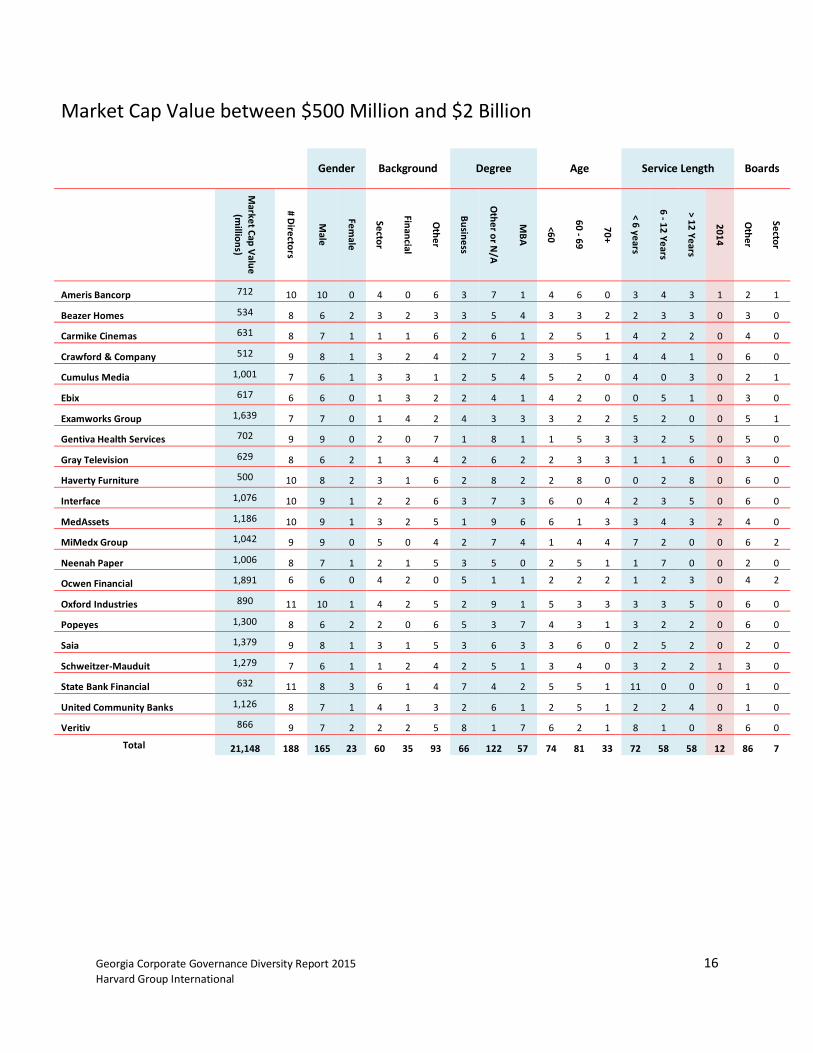
Market Cap Value between $500 Million and $2 Billion
Gender Background Degree Age Service Length Boards
Marke
t Cap
Valu
e
(millio
ns)
# Dire
ctors
Male
Fem
ale
Secto
r
Finan
cial
Oth
er
Bu
sine
ss
Oth
er o
r N/A
MB
A
<60
60
- 69
70
+
< 6 ye
ars
6 - 1
2 Y
ears
> 12
Ye
ars
20
14
Oth
er
Secto
r
Ameris Bancorp 712 10 10 0 4 0 6 3 7 1 4 6 0 3 4 3 1 2 1
Beazer Homes 534 8 6 2 3 2 3 3 5 4 3 3 2 2 3 3 0 3 0
Carmike Cinemas 631 8 7 1 1 1 6 2 6 1 2 5 1 4 2 2 0 4 0
Crawford & Company 512 9 8 1 3 2 4 2 7 2 3 5 1 4 4 1 0 6 0
Cumulus Media 1,001 7 6 1 3 3 1 2 5 4 5 2 0 4 0 3 0 2 1
Ebix 617 6 6 0 1 3 2 2 4 1 4 2 0 0 5 1 0 3 0
Examworks Group 1,639 7 7 0 1 4 2 4 3 3 3 2 2 5 2 0 0 5 1
Gentiva Health Services 702 9 9 0 2 0 7 1 8 1 1 5 3 3 2 5 0 5 0
Gray Television 629 8 6 2 1 3 4 2 6 2 2 3 3 1 1 6 0 3 0
Haverty Furniture 500 10 8 2 3 1 6 2 8 2 2 8 0 0 2 8 0 6 0
Interface 1,076 10 9 1 2 2 6 3 7 3 6 0 4 2 3 5 0 6 0
MedAssets 1,186 10 9 1 3 2 5 1 9 6 6 1 3 3 4 3 2 4 0
MiMedx Group 1,042 9 9 0 5 0 4 2 7 4 1 4 4 7 2 0 0 6 2
Neenah Paper 1,006 8 7 1 2 1 5 3 5 0 2 5 1 1 7 0 0 2 0
Ocwen Financial 1,891 6 6 0 4 2 0 5 1 1 2 2 2 1 2 3 0 4 2
Oxford Industries 890 11 10 1 4 2 5 2 9 1 5 3 3 3 3 5 0 6 0
Popeyes 1,300 8 6 2 2 0 6 5 3 7 4 3 1 3 2 2 0 6 0
Saia 1,379 9 8 1 3 1 5 3 6 3 3 6 0 2 5 2 0 2 0
Schweitzer-Mauduit 1,279 7 6 1 1 2 4 2 5 1 3 4 0 3 2 2 1 3 0
State Bank Financial 632 11 8 3 6 1 4 7 4 2 5 5 1 11 0 0 0 1 0
United Community Banks 1,126 8 7 1 4 1 3 2 6 1 2 5 1 2 2 4 0 1 0
Veritiv 866 9 7 2 2 2 5 8 1 7 6 2 1 8 1 0 8 6 0
Total 21,148 188 165 23 60 35 93 66 122 57 74 81 33 72 58 58 12 86 7

Georgia Corporate Governance Diversity Report 2015 17 Harvard Group International
Market Cap Value between $100 Million and $500 Million
Gender Background Degree Age Service Length Boards
Marke
t Cap
Valu
e
(millio
ns)
# Dire
ctors
Male
Fem
ale
Secto
r
Finan
cial
Oth
er
Bu
sine
ss
Oth
er o
r N/A
MB
A
<60
60
- 69
70
+
< 6 ye
ars
6 - 1
2 Y
ears
> 12
Ye
ars
20
14
Oth
er
Secto
r
Agilysys 283 7 7 0 3 2 2 4 3 4 6 1 0 6 0 1 1 3 1
Alimera Sciences 257 9 9 0 6 3 0 2 7 4 5 2 2 4 5 0 0 4 3
American Software 254 6 6 0 4 0 2 0 6 0 2 1 3 0 0 6 0 1 0
BlueLinx 101 9 9 0 1 2 6 4 5 1 4 5 0 5 4 0 2 7 0
Catchmark Timber Trust 457 7 7 0 3 2 2 3 4 2 3 2 2 5 2 0 0 1 0
Citi Trends 377 5 5 0 2 1 2 2 3 1 3 2 0 1 3 1 0 2 1
Cryolife 314 9 9 0 5 2 2 3 6 4 4 0 5 2 4 3 1 3 0
Earthlink 452 8 6 3 3 1 4 3 5 1 3 5 0 5 3 0 1 7 3
Fidelity Southern 339 9 9 0 2 1 6 3 6 0 2 5 2 2 3 4 0 2 0
Heritage Financial 235 8 7 1 3 0 5 1 7 0 1 5 2 0 1 7 0 1 0
InterNAP 436 7 5 2 3 0 4 2 5 4 3 4 0 3 4 0 0 6 0
Marine Products 307 9 8 1 2 1 6 3 6 0 0 2 7 1 1 7 0 8 0
Numerex 207 6 5 1 3 1 2 3 3 0 4 2 0 3 1 2 0 1 0
Preferred Apartment 183 9 9 0 6 0 3 6 3 1 4 2 3 9 0 0 2 4 0
Premiere Global Services 493 6 6 0 1 3 2 4 2 3 3 2 1 1 2 3 0 2 0
PRGX Global 149 7 5 2 2 1 4 4 3 2 3 2 2 4 3 0 0 4 0
Southeastern Bank 174 10 10 0 2 0 8 5 5 0 0 7 3 0 1 9 0 0 0
Thomasville Bancshares 175 11 10 1 3 0 8 2 9 1 9 1 1 0 1 10 0 0 0
Zep 357 8 7 1 1 1 6 3 5 1 4 3 1 4 4 0 0 5 0
Total 5,549 150 139 12 55 21 74 57 93 29 63 53 34 55 42 53 7 61 8

Georgia Corporate Governance Diversity Report 2015 18 Harvard Group International
Differences between 2014 and 2015 Board Studies There are several differences between last year’s inaugural Corporate Governance Diversity study and the 2015 edition:
Number of companies surveyed: The number of companies reviewed decreased from 100 to 80 between the two editions with the lowest 20 MCV companies from 2014 being dropped from the survey. These 20 companies combined comprised just over 0.1% of the total MCV of the top 100 Georgia based companies; 9 of the 20 are community banks whose directors are primary investors in the corporation. The weight given to these companies unfairly skews the demographics of the much larger Top 80 companies and were left out of this year’s study.
Three companies from last year’s group of Top 80 are not on this year’s list due to corporate acquisition or company relocation: cBeyond, Dixie Group, and Mueller Water. Streamline Health dropped out of the Top 80 MCV companies; that company was replaced by Global Payments (2014 MCV rank: 85). Three companies new to Georgia during 2014 were large enough to join the 2015 Top 80 list: Catchmark Timber Trust, Pulte Group, and Veritiv.
New Diversity Categories surveyed: There was considerable feedback on the 2014 study that indicated that several of the categories reviewed (Director Location, Insider Relationship, and Employment Status) did not offer as much value as Age, Length of Service, and Educational Background when evaluating board diversity and effectiveness. This new category set-up, which has been utilized in subsequent Harvard Group International corporate governance studies, allows for a consistent comparison of board diversity from different geographic areas or industrial sectors.
The two diversity categories that remained constant between the two studies (Gender and
Ethnicity) have their changes highlighted on page 7 of this report.
Georgia Corporate Governance Diversity Report 2015 19 Harvard Group International
About Harvard Group International Harvard Group International (HGI) is an executive search firm based in the Cumberland/Galleria area of Cobb County in Atlanta. The firm was founded in 1996 with the premise of offering the highest standards of executive search while possessing the nimbleness of a specialized consultancy. HGI leads the industry with a search project completion rate of over 99% and exceptional speed of service with over 90% of all candidates placed being presented to the client within the first 30 business days of the search project. Client satisfaction remains high with previous clients accounting for over two-thirds of all search projects. Part of that satisfaction rests in exclusivity: HGI represents only 10% of the companies within an industrial sector, allowing for larger pools from which to attract talent. HGI has successfully completed search projects in multiple industries throughout North America. The broad range of practice sectors served includes academia, aerospace, automotive, corporate governance, energy, engineering, financial services, food processing, food service/hospitality, information technology, life sciences, manufacturing, metallurgy and metal fabrication, non-profit, oil & gas, retail, and sports management. HGI directs its team of 40 search professionals (with over 350 years of search industry experience) to attract best-in-class talent for board director appointments, C-Suite, and senior/junior executive positions as well as key individual contributor roles. Clients of all sizes, from multinational conglomerates to start ups with fewer than 20 employees, have benefitted from the expertise provided by the Harvard Group International team.
About the Author Tom Furlong is the Managing Director of the firm’s Energy and Oil & Gas practice and also works with the Corporate Governance and Food Service/Hospitality teams. He has over 16 years of search industry experience and has successfully led executive search projects throughout North America and Asia. Tom brings a unique style of combining individual respect with expertise to his work, helping to differentiate both himself and Harvard Group International from other executive search professionals. He has shared his expertise through presentations to energy industry and executive groups on a variety of leadership and career guidance topics. Tom also draws upon his corporate experience of working for 13 years with Novartis to understand the inner workings of both global operations and the individual teams that give strength to multi-national corporations.
Contact Information: Harvard Group International 1640 Powers Ferry Road Building 25 Marietta, Georgia 30067-1444 p: (404) 459-9045 w: www.harvardsearch.com t: @harvardsearch
Tom Furlong Managing Director p: (678) 214-6065 e: [email protected] t: @TerrellMillTom


