GEORGIA DEPARTMENT OF REVENUE LOCAL GOVERNMENT SERVICES DIVISION Course V Cost Approach to Value Revised June 2018 For Educational Purposes Only: The material within is intended to give the course participant a solid understanding of general principles in the subject area. As such, the material may not necessarily reflect the official procedures and policies of the Georgia Department of Revenue or the Department’s official interpretation of the laws of the State of Georgia. The application of applicability to specific situations of the theories, techniques, and approaches discussed herein must be determined on a case‐by‐case basis. The statutory materials reprinted or quoted verbatim on the following pages are taken from the Official Code of Georgia Annotated, Copyright 2016 by the State of Georgia, and are reprinted with the permission of the State of Georgia. All rights reserved.
Transcript
GEORGIA DEPARTMENT OF REVENUE
LOCAL GOVERNMENT SERVICES DIVISION
Course V Cost Approach to Value
Revised June 2018
For Educational Purposes Only: The material within is intended to give the course participant a solid understanding of general principles in the subject area. As such, the material may not necessarily reflect the official procedures and policies of the Georgia Department of Revenue or the Department’s official interpretation of the laws of the State of Georgia. The application of applicability to specific situations of the theories, techniques, and approaches discussed herein must be determined on a case‐by‐case basis.
The statutory materials reprinted or quoted verbatim on the following pages are taken from the Official Code of Georgia Annotated, Copyright 2016 by the State of Georgia, and are reprinted with the permission of the State of Georgia. All rights reserved.
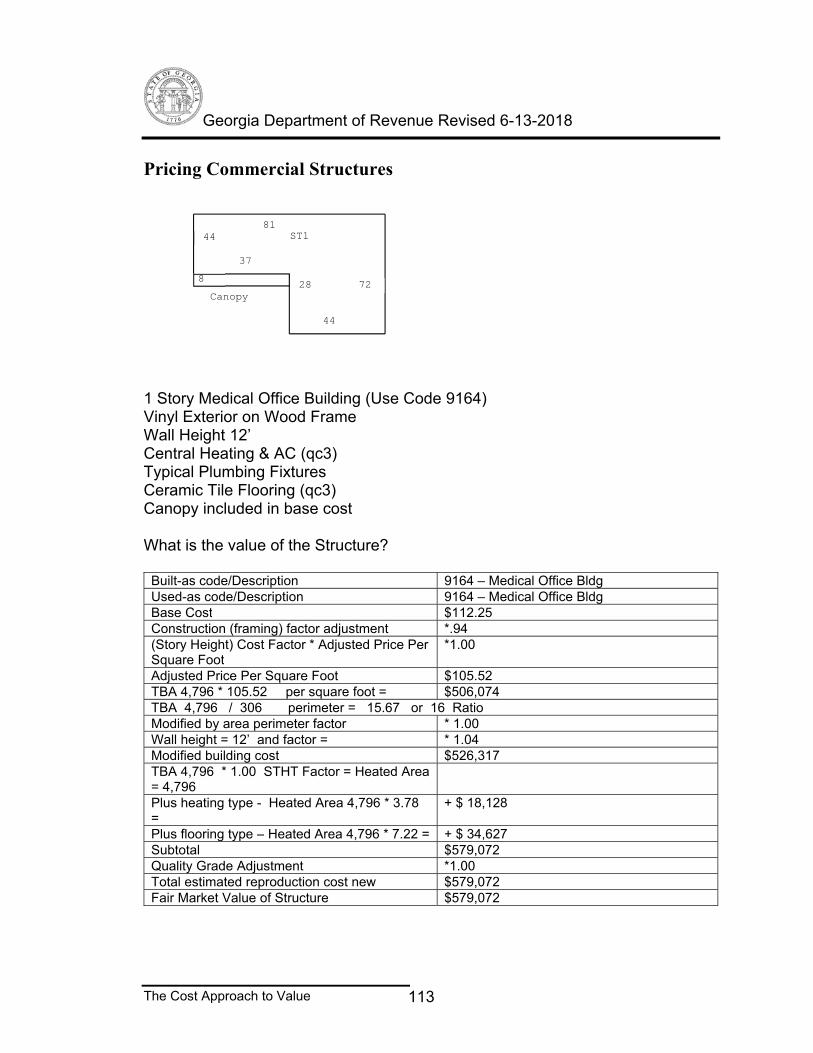
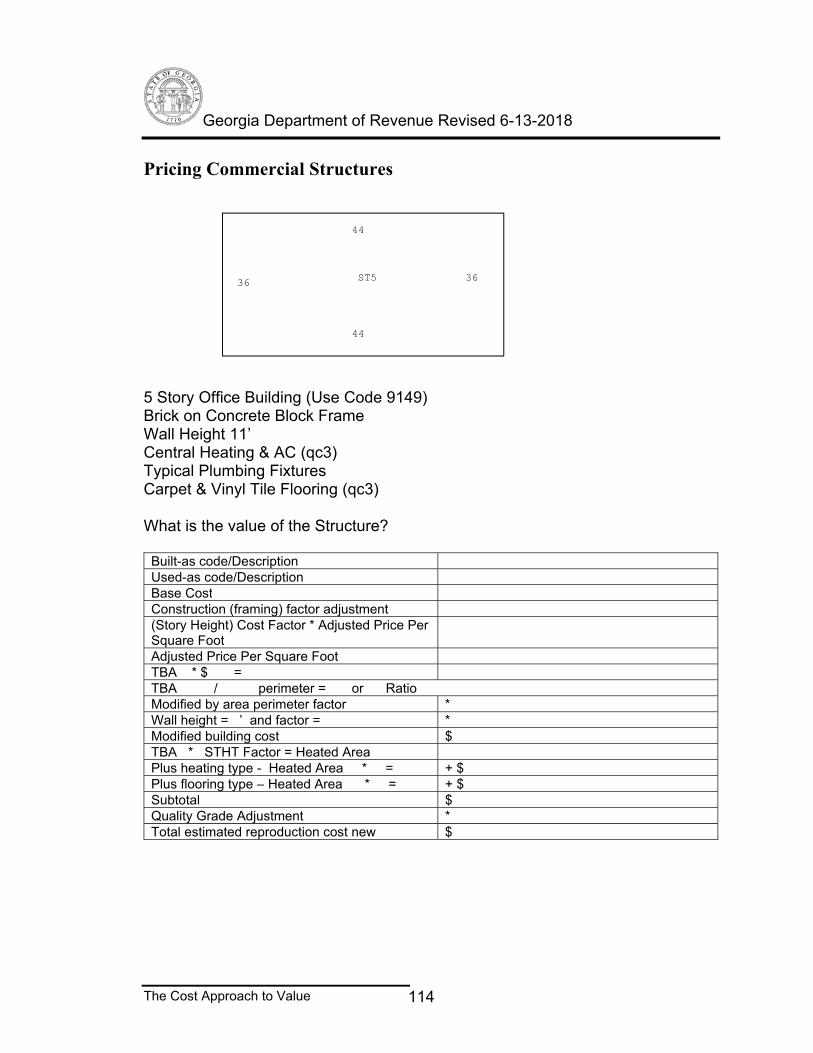
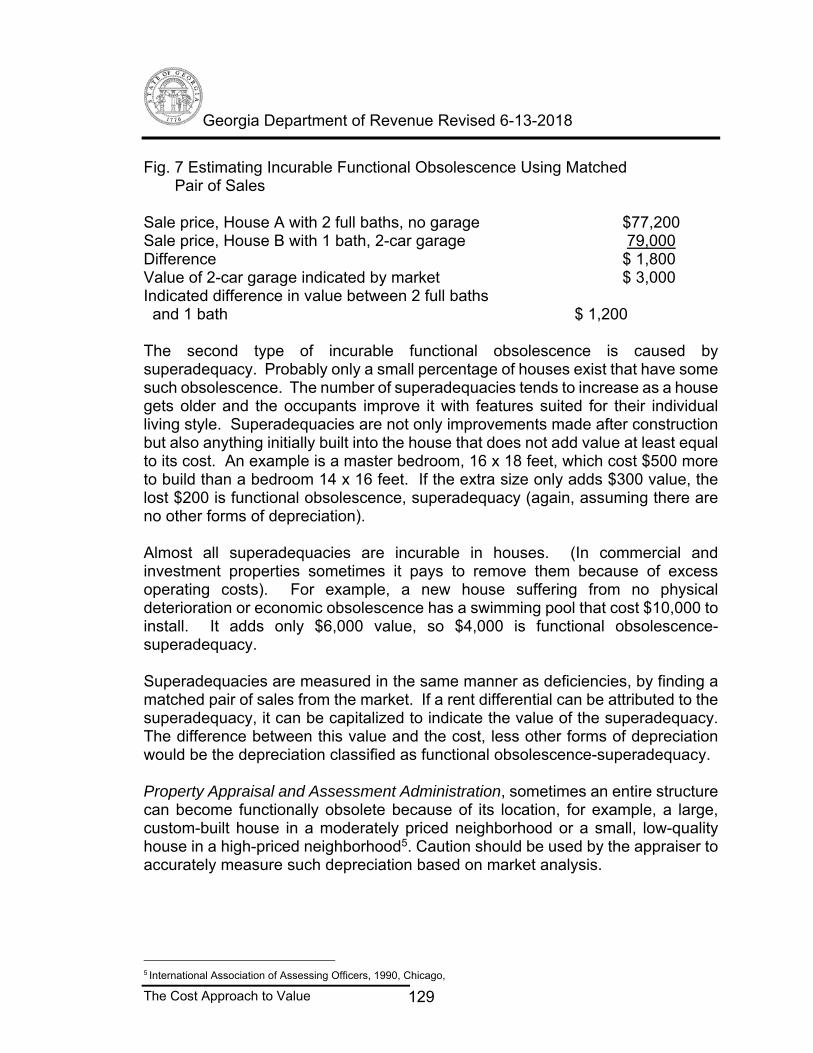
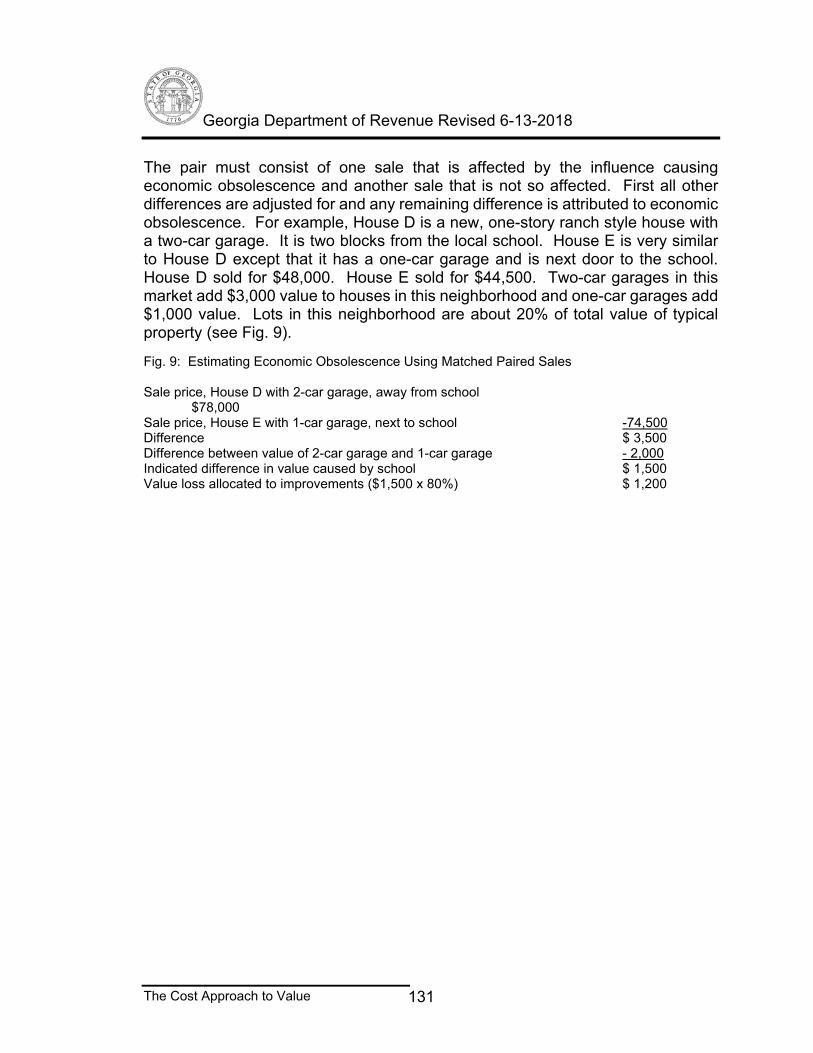
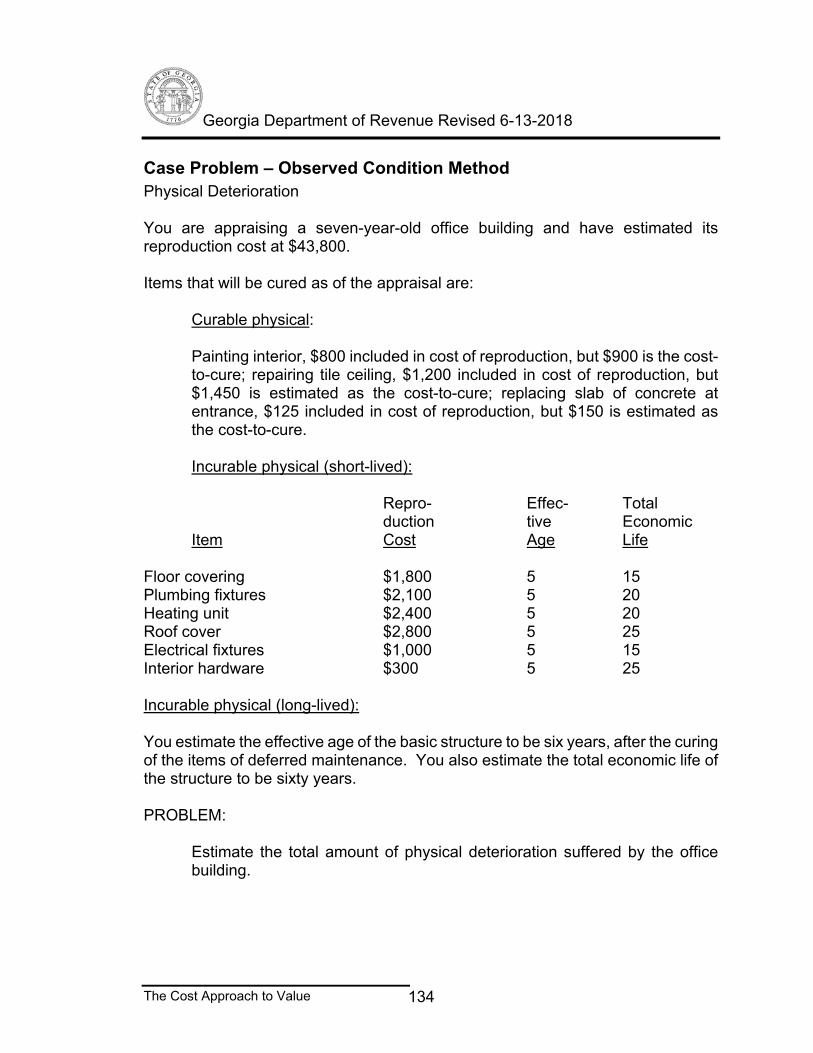
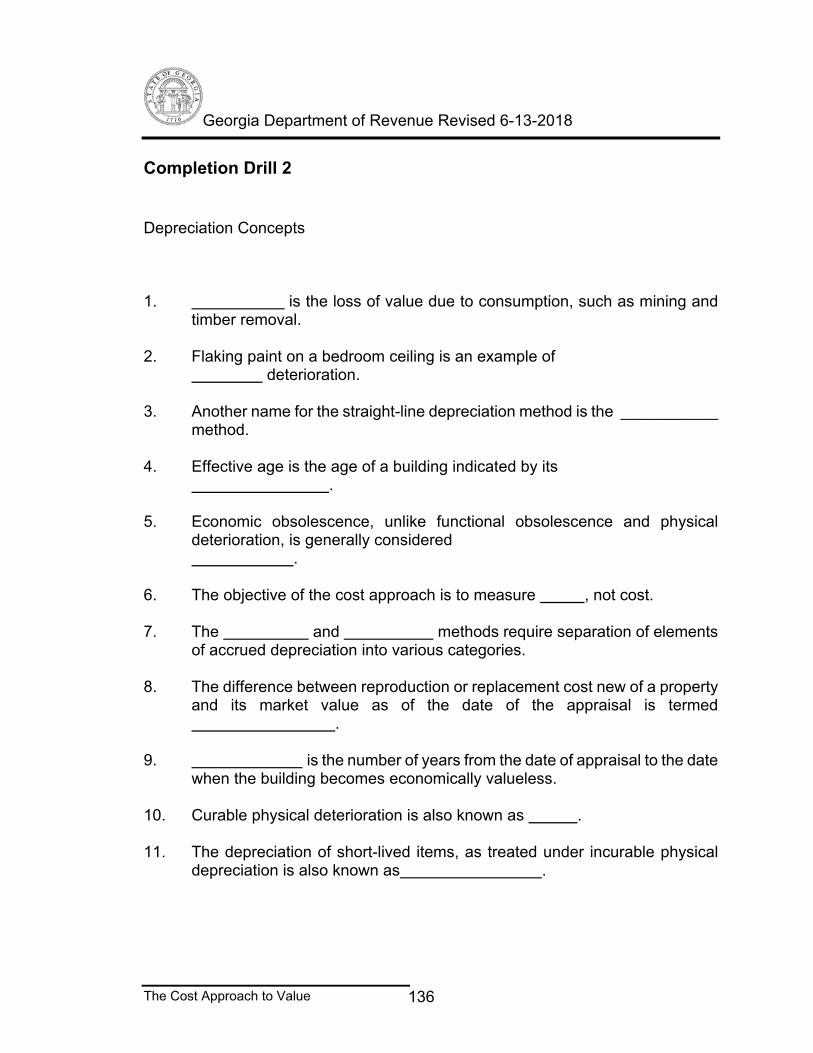
Georgia Department of Revenue Revised 6-13-2018
The Cost Approach to Value 1
Chapter 1................................................. 5 The Mass Appraisal Process................................ 5 The Mass Appraisal Process .............................. 6 Legislative intent O.C.G.A 48-5-1 ....................... 6 Review of County Tax Digest by the State Revenue Commissioner 560-11-2-.56 ............................... 6 Definitions 48-5-2. ..................................... 7 Approaches to Value ..................................... 9 12 Economic Principles ................................. 10 Market or Direct Sales Comparison Approach ............. 11 The Cost Approach ...................................... 12 Income Approach ........................................ 14 IRV .................................................. 14 Gross Rent Multiplier and Gross Income Multiplier .... 15
Type of Appraisals ..................................... 17 Mass Appraisal Process Components ...................... 18 Mass Appraisal Flow Charts ............................. 22 Completion Drill 1 ..................................... 34
Chapter 2................................................ 36 Estimating Reproduction or Replacement Cost New.......... 36 Estimating Reproduction or Replacement Cost New.......... 37 Reproduction cost ...................................... 37 Replacement cost ....................................... 37 Methods of Cost Estimating ............................. 38 Quantity Survey Method ............................... 39 Unit in Place Method ................................. 43 Square Foot/Cubic Foot/Point Cost Method ............. 47 Factored Historical Cost (Trended Original Cost) ..... 48
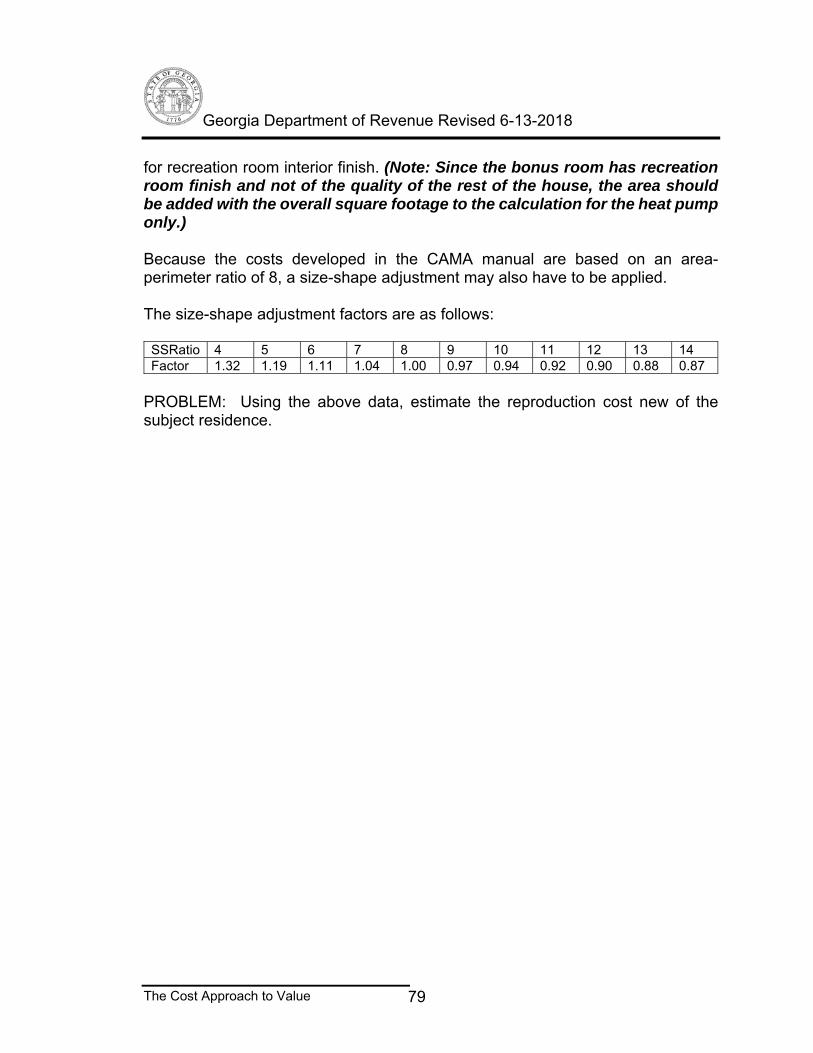
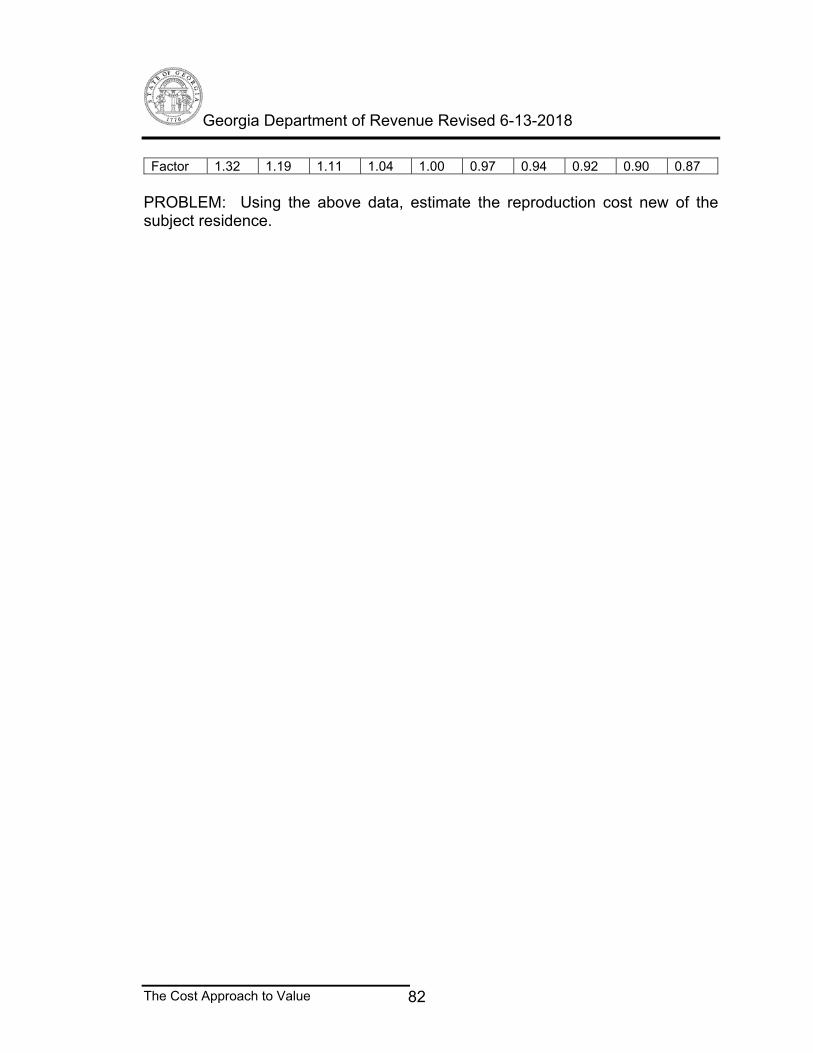
Sources of Cost Figures ................................ 48 Cost Data File ....................................... 49 Cost Services ........................................ 49 Building Costs Estimates ............................. 49 Elements of a House .................................. 52 General Building Specifications ...................... 53 Residential Field Data Collection Sheet .............. 56 Quality Grade Definitions Example .................... 58 Quality Grade Factor Chart ........................... 58 Percentage Completion Guideline Example .............. 60 Construction in progress ............................. 62 Size-Shape Adjustment (Factor) ....................... 65 Base Cost Factor Adjustments and Heated Area Calculation ..................................................... 68 Estimating Replacement Cost by Square Foot Method from Cost Manual or CAMA System ........................... 70 Commercial Structure Valuation ....................... 87
Georgia Department of Revenue Revised 6-13-2018
The Cost Approach to Value 2
Chapter 3............................................... 117 Estimating Accrued Deprecation.......................... 117 Estimating Accrued Depreciation......................... 118 Definition of Terms ................................... 119 Total Economic life ................................. 119 Actual Age .......................................... 119 Effective age ....................................... 119 Remaining economic life (R.E.L.) .................... 119
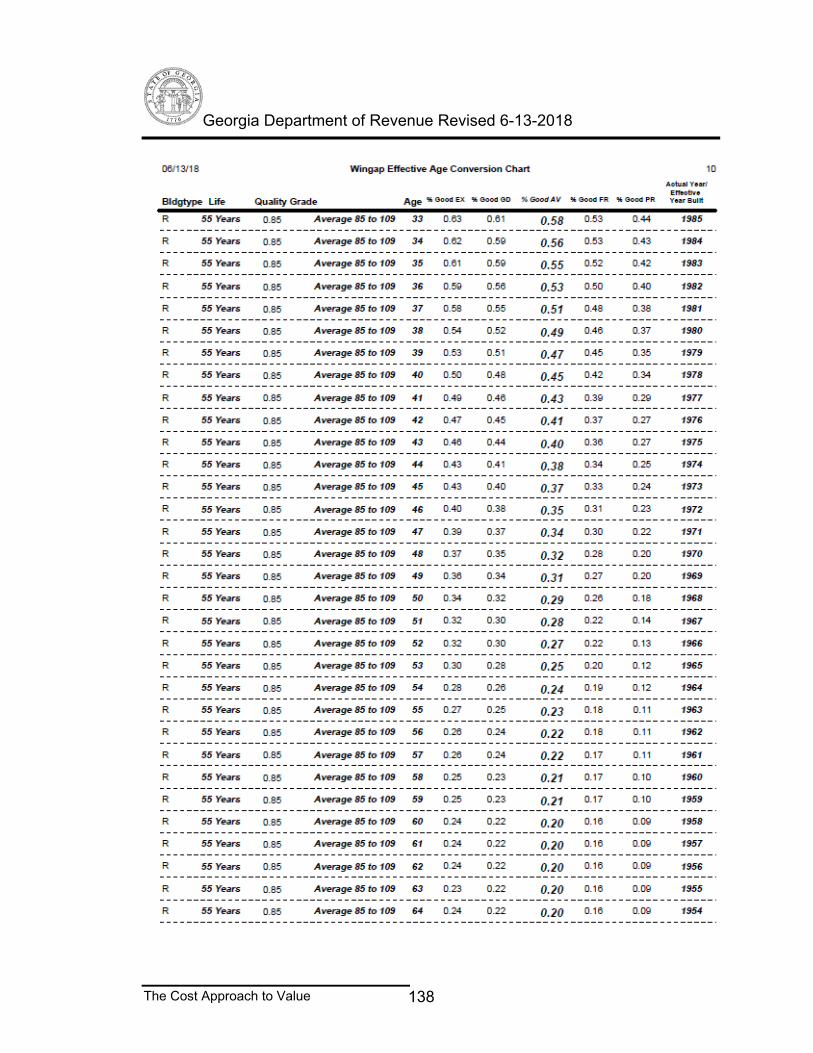
Techniques of Estimating Depreciation ................. 122 Age-Life Method ..................................... 122 The Observed Condition Method ....................... 124 Sales Comparison Method ............................. 132 Case Problem: Depreciation Calculated from Age Life Method .............................................. 132 Case Problem: Depreciation Calculated from the Market 133 Case Problem – Observed Condition Method ............ 134 Case Problem 2 – Observed Condition Method .......... 135 Completion Drill 2 .................................. 136 Depreciation Tables in CAMA System (Residential) .... 137 Commercial Life Expectancies ........................ 146
Chapter 4............................................... 148 Site Valuation, Analysis and Adjustments................ 148 Site Valuation ........................................ 149 Elements of Comparison (Qualitative) ................ 149
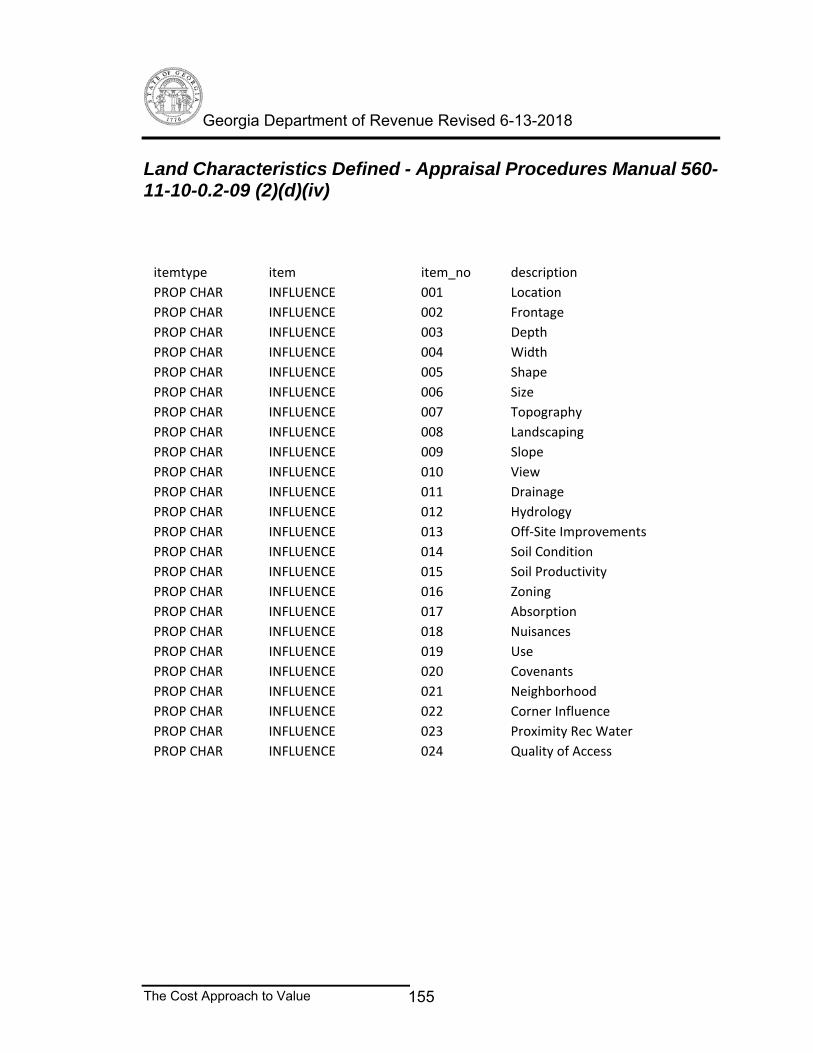
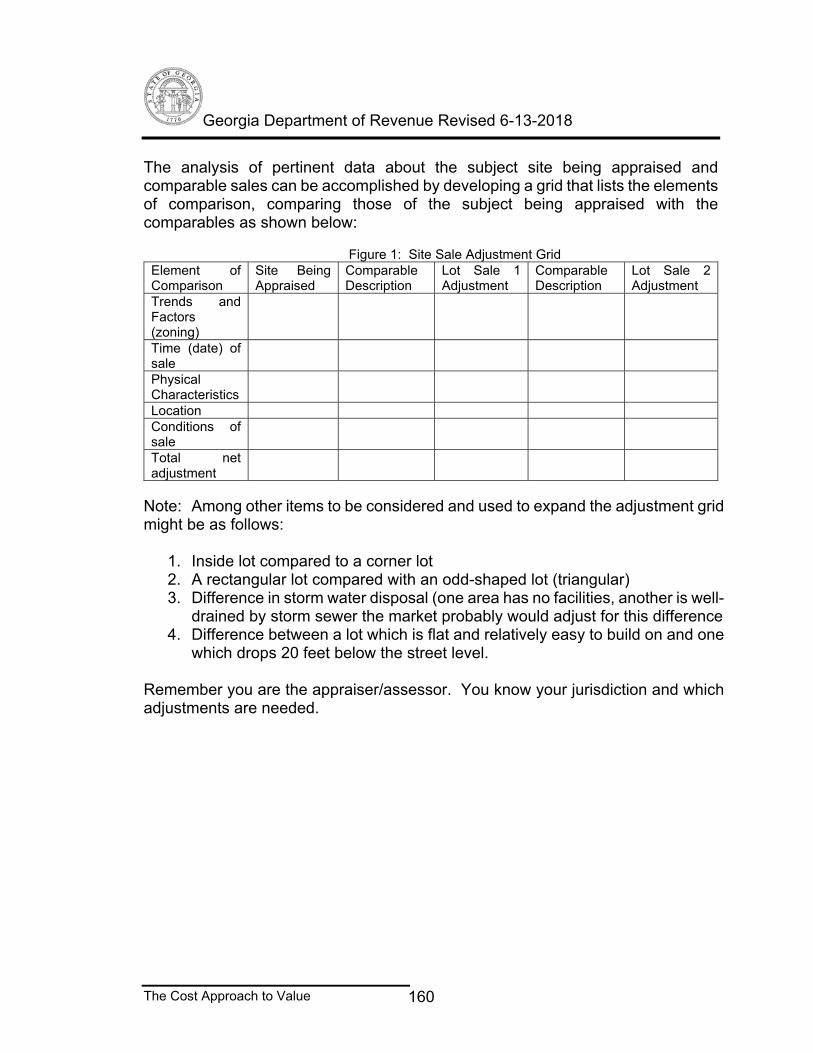
Land Characteristics Defined - Appraisal Procedures Manual 560-11-10-0.2-09 (2)(d)(iv) ........................... 155 Units of Comparison (Quantitative) .................. 156 Making Adjustments Using Units of Comparison ........ 159 Techniques of Making Adjustments .................... 164 Completion Drill 3 .................................. 166
Chapter 5............................................... 169 Methods of Land Valuation............................... 169 Land Valuation ........................................ 170 Market or Direct (Comparable) Sales Approach – Most Reliable .............................................. 171 Market Data Summary and Correlation ................. 173
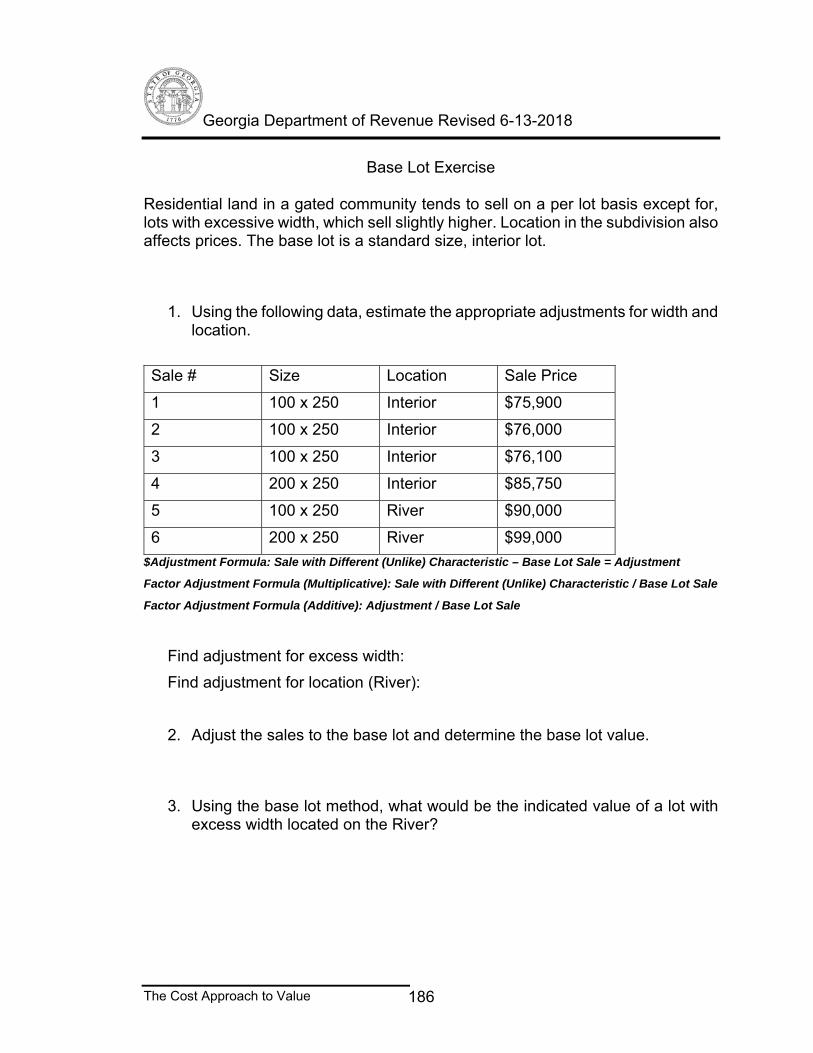
Case Problems – Sales Comparison ...................... 178 Land Adjustments - Percentages ...................... 178 Land Adjustments – Lump Sum ......................... 179 Land Adjustments - Percentages ...................... 180 Base Lot Method ..................................... 182 Illustration 0f Base Lot Method ..................... 183
Cost of Development - (Anticipated Use) ............... 189 Appraisal Procedures Manual ........................... 189 Absorption Rates .................................... 189
Georgia Department of Revenue Revised 6-13-2018
The Cost Approach to Value 3
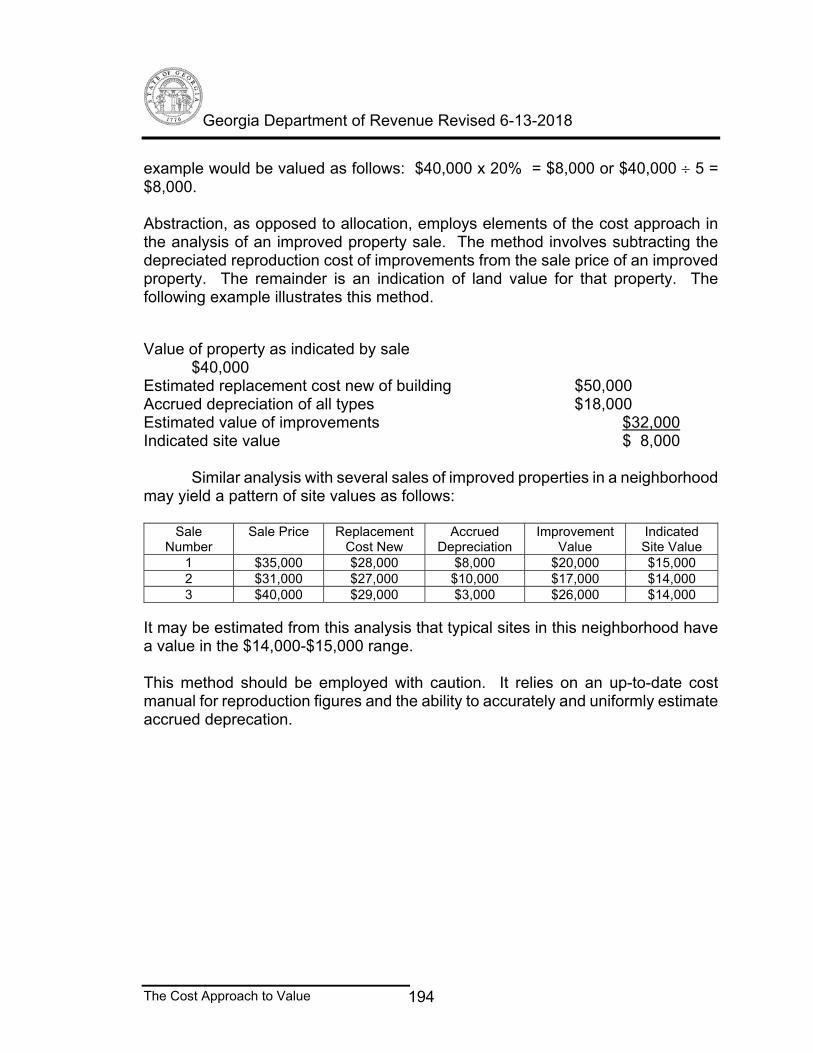
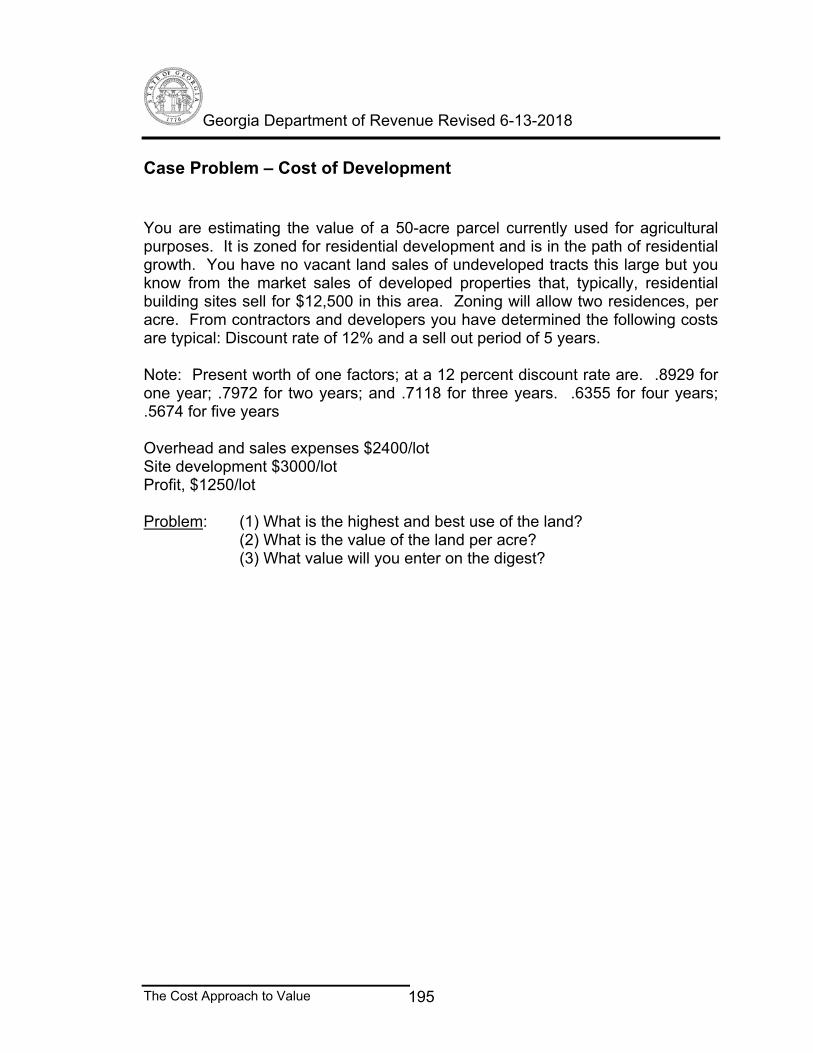
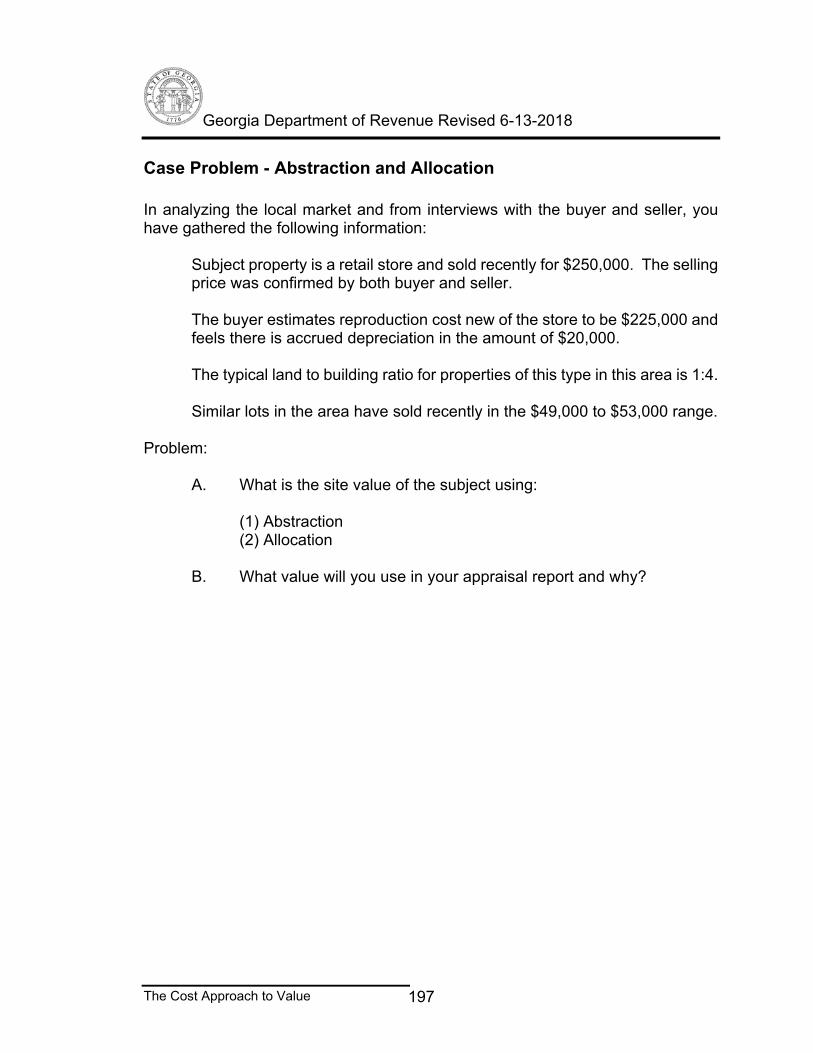
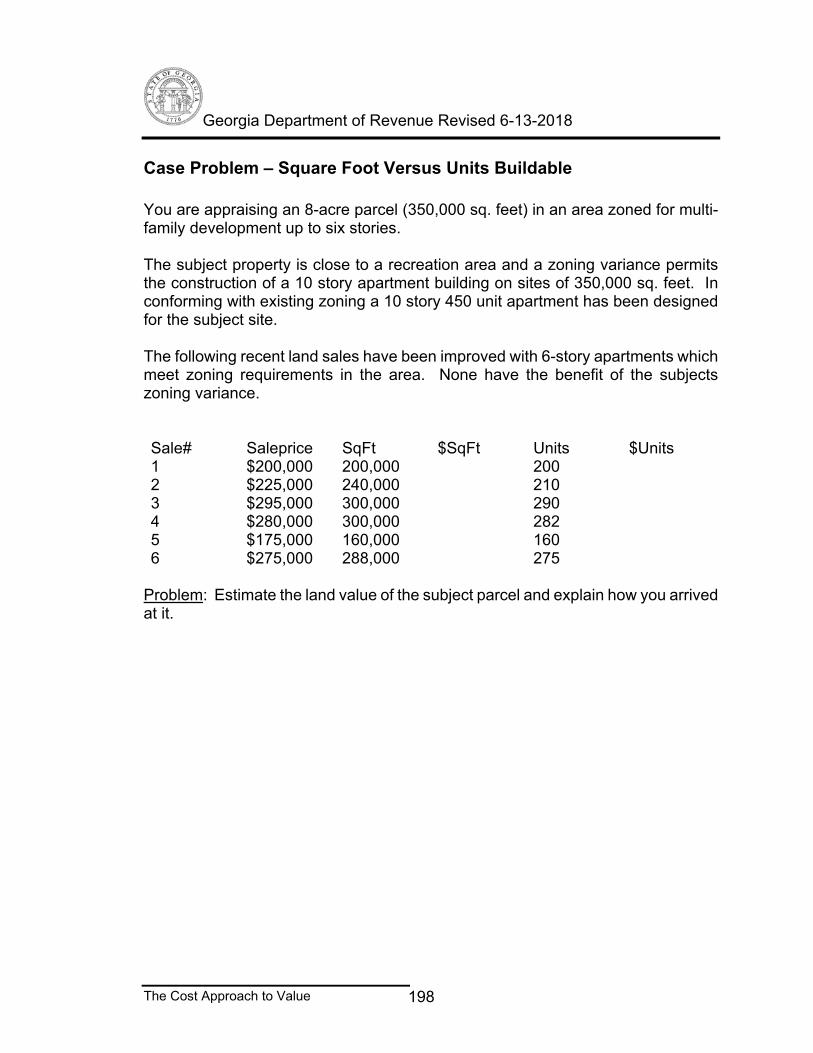
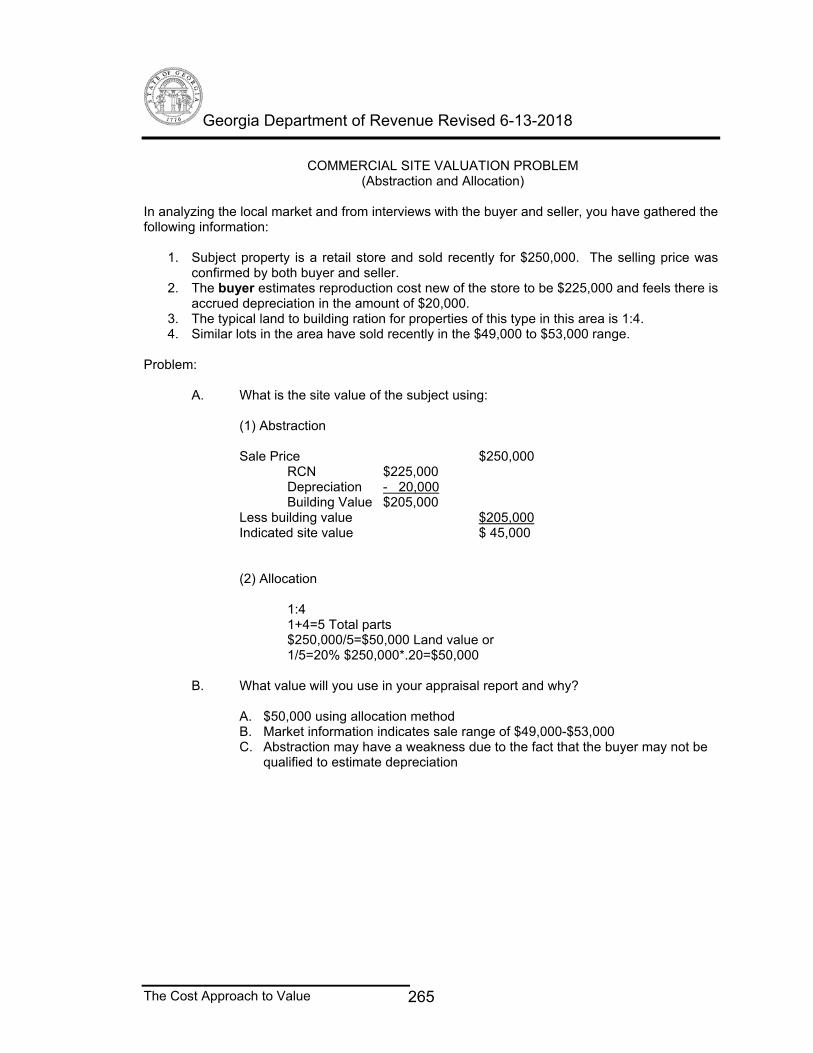
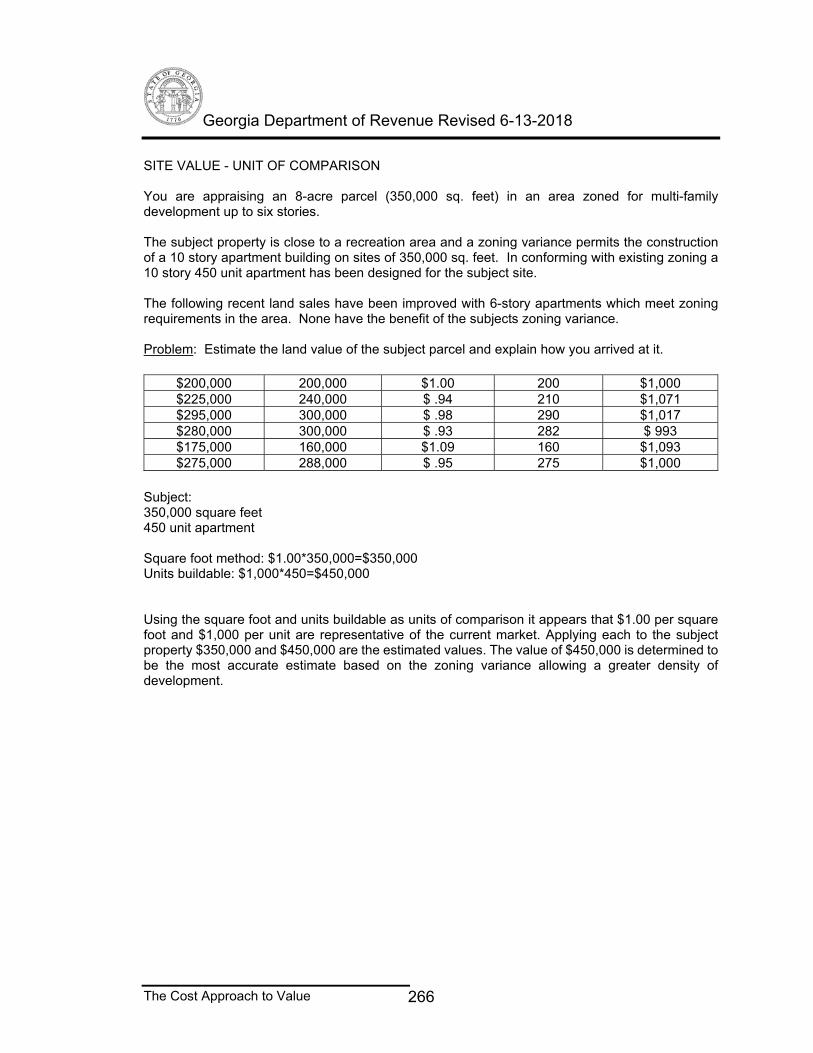
Allocation and Abstraction Methods .................... 192 The Allocation Method ............................... 192 The Abstraction Method .............................. 193 Case Problem – Cost of Development .................. 195 Case Problem – Allocation Method .................... 196 Case Problem - Abstraction and Allocation ........... 197 Case Problem – Square Foot Versus Units Buildable ... 198
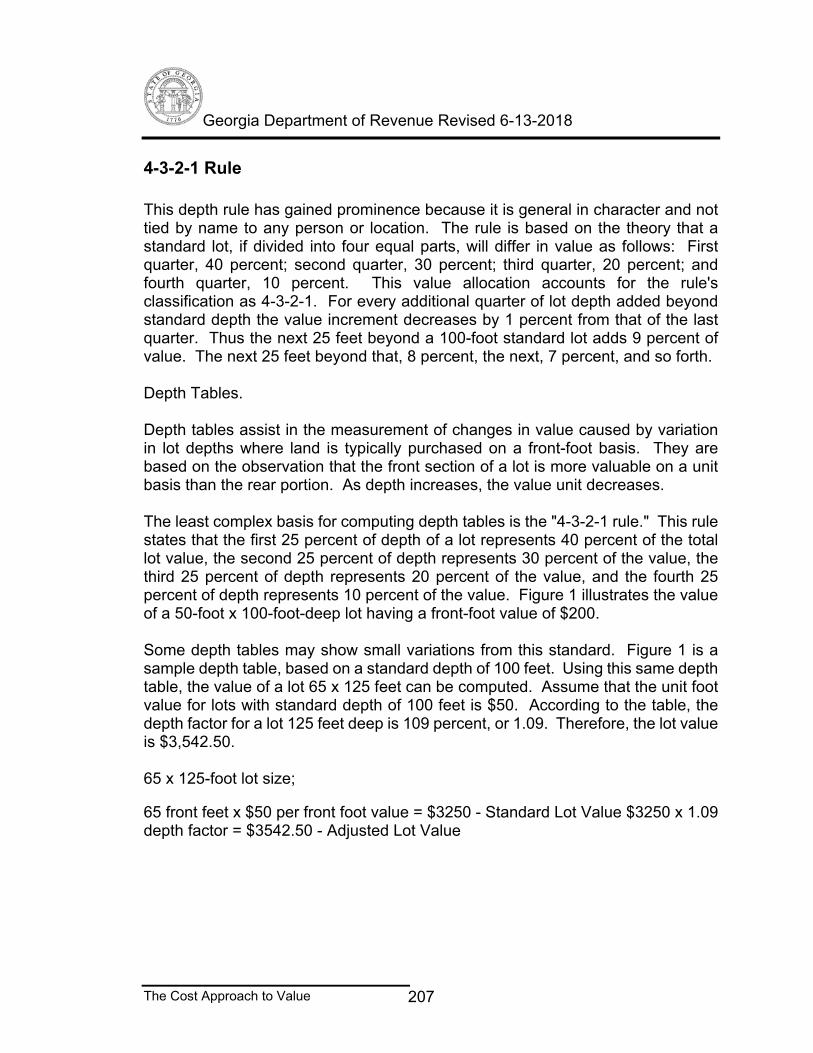
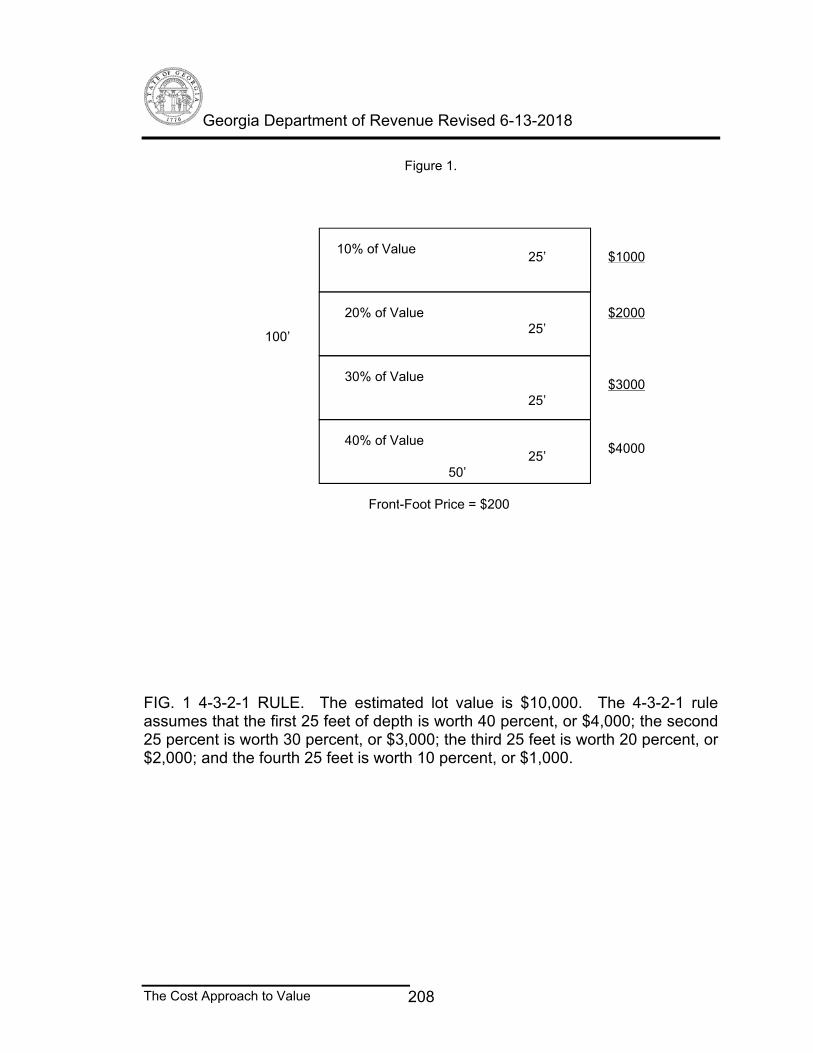
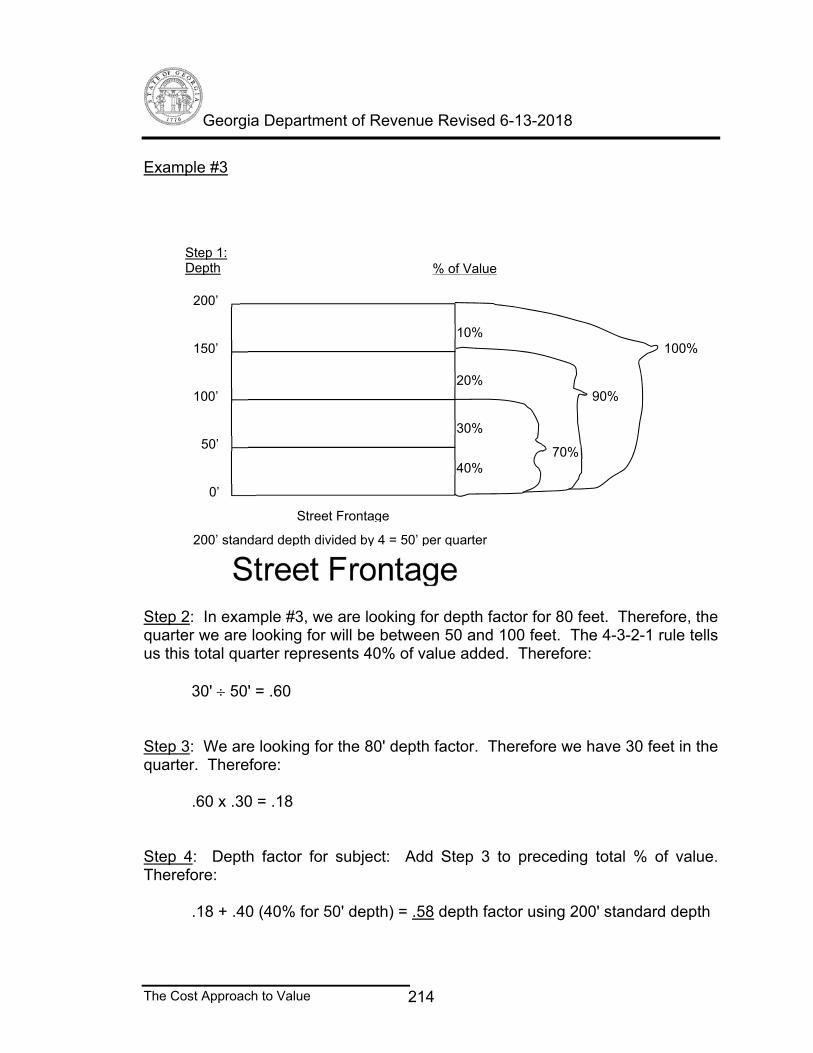
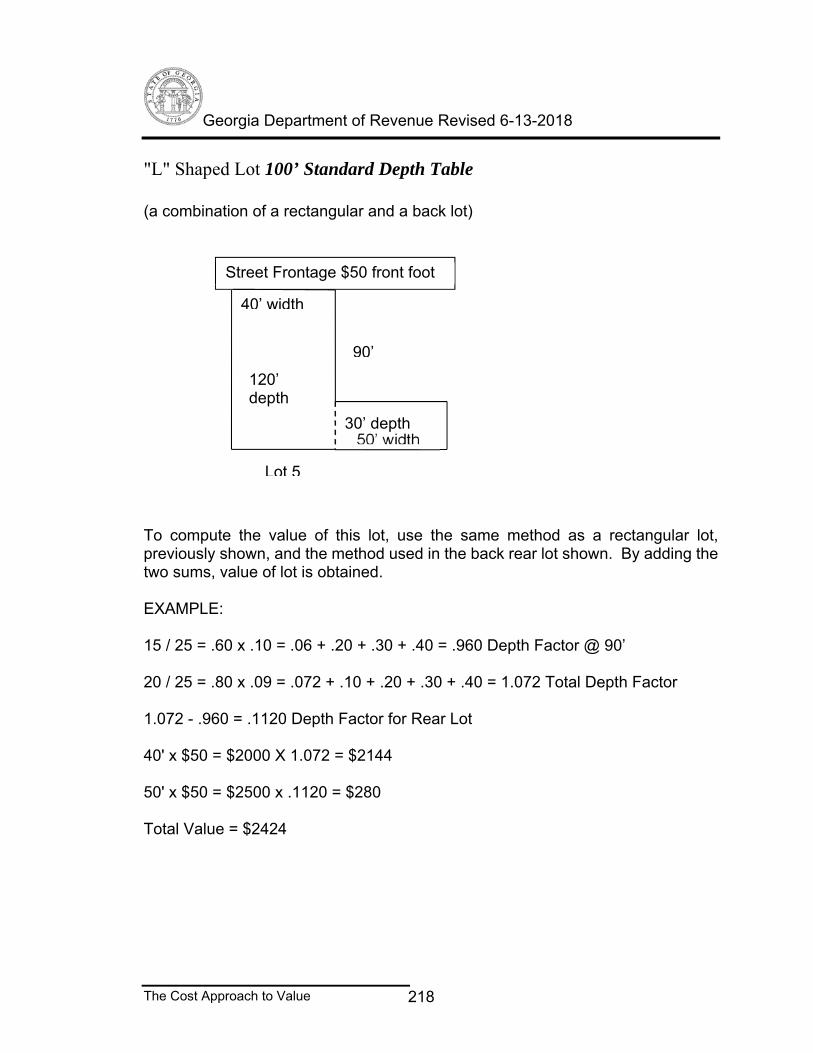
Chapter 6............................................... 200 Formulas, Tables, Rules and Valuing Odd Shaped Lots..... 200 Formulas, Tables, Rules, and Valuing Odd Shaped Lots .. 202 Odd Shaped Lot Valuation 65/35 Rule ................. 202 4-3-2-1 Rule ........................................ 207 Interpolation for Depth Factors ..................... 210 Case Problem – Calculating Depth Factors ............ 215 Corner Lot Valuation ................................ 222 Assemblage and Plottage ............................. 222 Case Problem – Corner Influence Calculation ......... 225 Useful Formulas And Methods Used In Calculating Odd Areas ............................................... 229 Case Problem: 4-3-2-1, 65/35 Rule, Corner Influence . 232
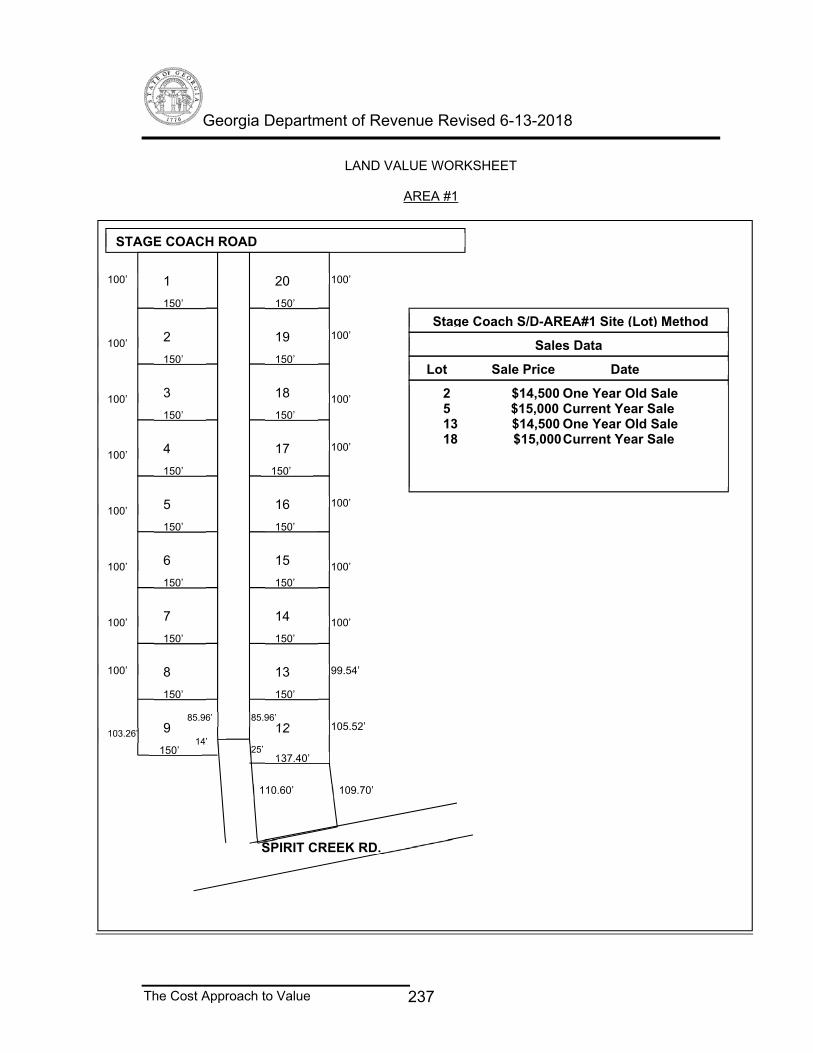
Chapter 7............................................... 234 The Cost Approach....................................... 234 Case Study Application.................................. 234 Appendix................................................ 240
Case Problem: Depreciation Calculated from Age Life Method .............................................. 254
Georgia Department of Revenue Revised 6-13-2018
The Cost Approach to Value 4
Georgia Department of Revenue Revised 6-13-2018
The Cost Approach to Value 5
Chapter 1
The Mass Appraisal Process
Georgia Department of Revenue Revised 6-13-2018
The Cost Approach to Value 6
The Mass Appraisal Process "Mass Appraising" connotes accurately the appraisal of a large number of properties. However, before extensively viewing the process involved in mass appraising, we should perhaps first establish what an "appraisal" consists of and how this relates to the mass appraiser. Real Estate Appraisal Terminology by the American Institute of Real Estate Appraisers and The Society of Real Estate Appraisers, defines an appraisal as:
An estimate or opinion of value. The act or process of estimating value. The resulting opinion of value derived from the appraisal may be informal, transmitted orally; or it may be formal, presented in written form. Usually it is a written statement setting forth an opinion of the value of an adequately described property as of a specified date, supported by the presentation and analysis of relevant data.
This appraisal or estimate of value is, in the property tax world, referred to as "Fair Market Value”. There are prescribed procedures, to be described in this book, for arriving at uniform and equitable assessments.
Legislative intent O.C.G.A 48-5-1
The intent and purpose of the tax laws of this state are to have all property and subjects of taxation returned at the value which would be realized from the cash sale, but not the forced sale, of the property and subjects as such property and subjects are usually sold except as otherwise provided in this chapter.
Review of County Tax Digest by the State Revenue Commissioner 560-11-2-.56
(1) General.
(a) County boards of assessors are required by the State Constitution and state law to continuously maintain assessments of property that are reasonably uniform and that are based on fair market value as defined in O.C.G.A. 48-5-2 (except as otherwise stated in O.C.G.A. 48-5-6 and O.C.G.A. 48-5-7 (c.3)). The Department is required by law to periodically review the county digests to determine if the digests are in compliance with such laws.
Georgia Department of Revenue Revised 6-13-2018
The Cost Approach to Value 7
(b) This Regulation imposes no additional requirements on the county boards of tax assessors. It merely sets forth the statistical and other methods that are used by the department in making its determination. The Department does not determine when to revalue property. Each county board of tax assessors determines for itself when it believes a revaluation of property is necessary for legal compliance. Failure to revalue property shall not in and of itself be a basis for assessment of penalty.
(c) Any digest submitted shall be reviewed utilizing information established by the State Auditor to determine whether or not the county tax digest is in accordance with the uniformity requirements of § 48-5-343.
Definitions 48-5-2. As used in this chapter, the term: (.1) "Arm's length, bona fide sale" means a transaction which has occurred in good faith without fraud or deceit carried out by unrelated or unaffiliated parties, as by a willing buyer and a willing seller, each acting in his or her own self-interest, including but not limited to a distress sale, short sale, bank sale, or sale at public auction. (1) "Current use value" of bona fide conservation use property means the amount a knowledgeable buyer would pay for the property with the intention of continuing the property in its existing use and in an arm's length, bona fide sale and shall be determined in accordance with the specifications and criteria provided for in subsection (b) of Code Section 48-5-269. (2) "Current use value" of bona fide residential transitional property means the amount a knowledgeable buyer would pay for the property with the intention of continuing the property in its existing use and in an arm's length, bona fide sale. The tax assessor shall consider the following criteria, as applicable, in determining the current use value of bona fide residential transitional property: (A) The current use of such property; (B) Annual productivity; and (C) Sales data of comparable real property with and for the same existing use. (3) 'Fair market value of property' means the amount a knowledgeable buyer would pay for the property and a willing seller would accept for the property at an arm's length, bona fide sale. The income approach, if data is available, shall be
Georgia Department of Revenue Revised 6-13-2018
The Cost Approach to Value 8
utilized in determining the fair market value of income-producing property, and, if actual income and expense data are voluntarily supplied by the property owner, such data shall be considered in such determination. Notwithstanding any other provision of this chapter to the contrary, the transaction amount of the most recent arm's length, bona fide sale in any year shall be the maximum allowable fair market value for the next taxable year. With respect to the valuation of equipment, machinery, and fixtures when no ready market exists for the sale of the equipment, machinery, and fixtures, fair market value may be determined by resorting to any reasonable, relevant, and useful information available, including, but not limited to, the original cost of the property, any depreciation or obsolescence, and any increase in value by reason of inflation. Each tax assessor shall have access to any public records of the taxpayer for the purpose of discovering such information. (A) In determining the fair market value of a going business where its continued operation is reasonably anticipated, the tax assessor may value the equipment, machinery, and fixtures which are the property of the business as a whole where appropriate to reflect the accurate fair market value. (B) The tax assessor shall apply the following criteria in determining the fair market value of real property: (i) Existing zoning of property; (ii) Existing use of property, including any restrictions or limitations on the use of property resulting from state or federal law or rules or regulations adopted pursuant to the authority of state or federal law; (iii) Existing covenants or restrictions in deed dedicating the property to a particular use; (iv) Bank sales, other financial institution owned sales, or distressed sales, or any combination thereof, of comparable real property; (v) Decreased value of the property based on limitations and restrictions resulting from the property being in a conservation easement; (vi) Rent limitations, operational requirements, and any other restrictions imposed upon the property in connection with the property being eligible for any income tax credits described in subparagraph (B.1) of this paragraph or receiving any other state or federal subsidies provided with respect to the use of the property as residential rental property; provided, however, that such properties described in subparagraph (B.1) of this paragraph shall not be considered comparable real property for assessment or appeal of assessment of other
Georgia Department of Revenue Revised 6-13-2018
The Cost Approach to Value 9
properties; and (vii) Any other existing factors provided by law or by rule and regulation of the commissioner deemed pertinent in arriving at fair market value. (B.1) The tax assessor shall not consider any income tax credits with respect to real property which are claimed and granted pursuant to either Section 42 of the Internal Revenue Code of 1986, as amended, or Chapter 7 of this title in determining the fair market value of real property. (B.2) In determining the fair market value of real property, the tax assessor shall not include the value of any intangible assets used by a business, wherever located, including patents, trademarks, trade names, customer agreements, and merchandising agreements.
Approaches to Value
In addition to estimating the value of property, the assessor and appraiser must constantly seek to maintain equity between properties similarly situated in terms of size, location, desirability and physical characteristics as explained in Course IA. The courts throughout the United States have consistently upheld three basic approaches to estimating value. There are variations, in terms of application, within each of the three approaches but only three. These are:
1. The Market Data or Comparable Sales Approach to Value: The value indicated by recent sales of comparable properties. These sales are "adjusted" for time, location and physical characteristics so as to make them as similar as possible.
2. The Cost Approach to Value: The value indicated by the current cost of
replacing a property less any accrued depreciation from physical deterioration, or functional and economic obsolescence. To this depreciated replacement cost is added the value of the land, estimated through analysis of comparable sales. The steps, then, in order to arrive at a value via the cost approach would be: Replacement Cost New less Accrued Depreciation plus Land Value = Value (cost approach).
3. The Income Approach to Value: The value which can be supported by the
net earning power of a property. This is accomplished by capitalization of the net income into a value estimate.
Georgia Department of Revenue Revised 6-13-2018
The Cost Approach to Value 10
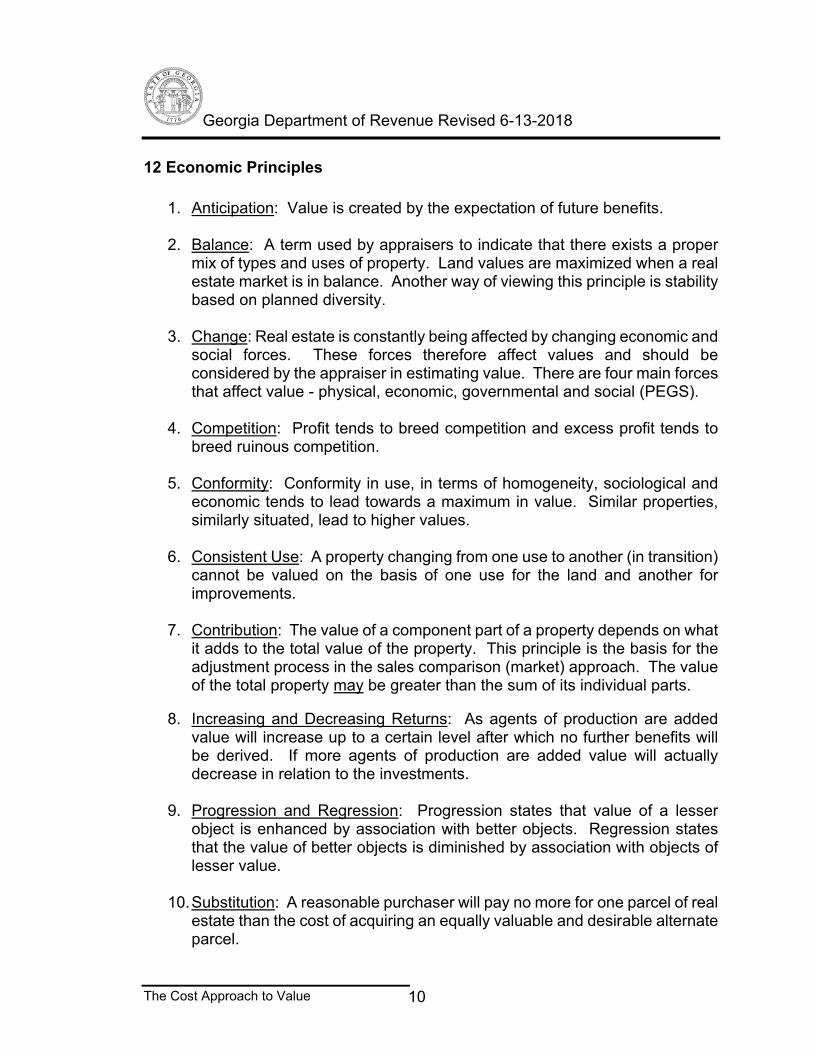
12 Economic Principles
1. Anticipation: Value is created by the expectation of future benefits.
2. Balance: A term used by appraisers to indicate that there exists a proper
mix of types and uses of property. Land values are maximized when a real estate market is in balance. Another way of viewing this principle is stability based on planned diversity.
3. Change: Real estate is constantly being affected by changing economic and
social forces. These forces therefore affect values and should be considered by the appraiser in estimating value. There are four main forces that affect value - physical, economic, governmental and social (PEGS).
4. Competition: Profit tends to breed competition and excess profit tends to
breed ruinous competition.
5. Conformity: Conformity in use, in terms of homogeneity, sociological and economic tends to lead towards a maximum in value. Similar properties, similarly situated, lead to higher values.
6. Consistent Use: A property changing from one use to another (in transition)
cannot be valued on the basis of one use for the land and another for improvements.
7. Contribution: The value of a component part of a property depends on what
it adds to the total value of the property. This principle is the basis for the adjustment process in the sales comparison (market) approach. The value of the total property may be greater than the sum of its individual parts.
8. Increasing and Decreasing Returns: As agents of production are added value will increase up to a certain level after which no further benefits will be derived. If more agents of production are added value will actually decrease in relation to the investments.
9. Progression and Regression: Progression states that value of a lesser
object is enhanced by association with better objects. Regression states that the value of better objects is diminished by association with objects of lesser value.
10. Substitution: A reasonable purchaser will pay no more for one parcel of real
estate than the cost of acquiring an equally valuable and desirable alternate parcel.
Georgia Department of Revenue Revised 6-13-2018
The Cost Approach to Value 11
11. Supply and Demand: Market value is greatly influenced by the existing supply of real estate and the existing demand for that type of real estate in the market place.
12. Surplus Productivity: The net income remaining after the cost of the agents
of production--labor, management, capital and land--has been paid. Surplus productivity is income earned by the land.
Given a description of the three approaches to value and some of the concepts which go hand-in-hand in the formation of values, a still brief but more in-depth view of the approaches is appropriate.
Market or Direct Sales Comparison Approach
The basic idea behind the market data approach to value is: "A person will not buy or rent one property for more than it would cost to buy or rent a comparable or similar property with the same utility." This is the Principle of Substitution, probably the most important of all valuation principles and is the basis for all three approaches to value.
Local market information is utilized in both the cost and income approaches because we are attempting to find value and regardless of the type of property, we must at some time or another go to the market place for information.
The Market Data or Comparable Sales Approach should be used with any property where a bank of sales of comparable properties exists. The Market Data Approach, however, will normally be used with residential and with some light commercial properties.
The basic steps involved in the market approach are:
1. Gathering of data concerning recent sales. 2. Checking the comparability of these sales to the subject property. 3. Verifying the sales selected as comparables. 4. Adjusting these comparables to reflect the subject property. 5. Estimating the value of the subject property.
Georgia Department of Revenue Revised 6-13-2018
The Cost Approach to Value 12
The Cost Approach
The cost approach historically has been known as the summation approach. That is, the sum of site (land) value plus improvement value equals property value; but that term is rarely used anymore. The concept of the cost approach is based on the principle of substitution. It states that no rational person will pay more for an existing house than the amount for which he or she can obtain, by purchase of a site and construction, without undue delay, of a house of equal desirability and utility. The philosophy in the cost approach to market value is unique compared to the other two approaches. The approach used the sales of comparable sites to develop a market value estimate of the site as if unimproved, to which is added a market value estimate of the improvements based on "cost new" less any and all depreciation (loss in value). The procedure for the development of market value of the improvements is the conversion of "cost to construct" figures to market value figures. Cost is not necessarily or automatically the equivalent of market value. The process of making such a conversion requires care, caution, and great skill. A separate valuation of the improvements is needed for a variety of reasons, and the cost approach is one of the ways to obtain such valuation estimates. These reasons include tax purposes (where ad valorem tax laws dictate this separation in value), accounting (where it is desired to reflect the depreciation of building) and to obtain the value of the land by the land residual method. The cost approach is especially useful to estimate the value of special purpose properties where there is not market value. Steps of the Cost Approach There are five basic steps to the cost approach. Essentially they provide for an estimate of the site (land) value, to which is added the depreciated reproduction cost or replacement cost (new) of the improvements as of the date of the appraisal. The appraiser:
1. Estimates the value of the site (land) in its highest and best use as if vacant.
2. Estimates the reproduction cost or replacement cost new of all
improvements (excluding any that were included as part of the site value).
3. Estimates accrued depreciation from all causes.
Georgia Department of Revenue Revised 6-13-2018
The Cost Approach to Value 13
4. Deducts the total of accrued depreciation (Step 3) from the cost new of the improvements (Step 2) to arrive at a depreciated value of the improvements recognized as the market value. Steps 2, 3, and 4 are the process of converting cost to value.
5. Adds the site (land) value (Step 1) to the depreciated value of the
improvements (Step 4) to arrive at a market value of the property indicated by the cost approach.
This approach is based on the assumption that the replacement cost new normally sets the upper limit of value, provided that the improvement is new and represents the highest and best use to the land. It is also assumed that a newly constructed building has advantages over existing buildings. The assessor must also evaluate any disadvantages or deficiencies of existing buildings as compared with the new buildings. The measure of this deficiency is called depreciation. Depreciation decreases the value of property. There are three possible causes of depreciation. These are:
These causes of depreciation may be further defined as follows:
1. Physical deterioration can be due to: a. Wear and tear b. Inadequate repair or maintenance
2. Functional Obsolescence can be due to: (inadequacy or
superadequacy) a. A design deficiency b. Too many or not enough of certain features (i.e.,
bathrooms, bedrooms, garage)
3. Economic Obsolescence occurs due to forces external to the actual structure such as encroaching commercial properties, or environmental pollution.
The steps followed with the cost approach add the land value (derived by the market approach) to the depreciated Replacement Cost New (RCN) as follows: RCN - Accrued Depreciation + Land Value = Value (cost approach)
Georgia Department of Revenue Revised 6-13-2018
The Cost Approach to Value 14
Income Approach
The Income approach is most applicable to properties which can produce an income such as apartment buildings, shopping centers, and office buildings. In applying the income approach, the appraiser is concerned with the present worth of the future benefits of the property. This is generally measured by the net income which a fully informed buyer may assume the property will produce during its remaining useful life. After comparison with investments of similar types and classes, this net income is capitalized to form an estimate of value.
IRV The formula for obtaining value using the income approach is
R
IV
(a) Rate
IncomeValue
R
IV
(b) ValueRateIncome *
VRI *
(c) Value
IncomeRate
V
IR
VR
I
*
Georgia Department of Revenue Revised 6-13-2018
The Cost Approach to Value 15
The steps in arriving at net operating income are:
Potential Gross Income - Vacancy and Collection Loss + Miscellaneous Income = Effective Gross Income - Allowable expenses (a) operating (b) reserves for replacement = Net Operating Income
tionRateCapitaliza
ngIncomeNetOperati=Value
Gross Rent Multiplier and Gross Income Multiplier
Another method used to obtain value using the income approach is through the establishment of a Gross Rent Multiplier or a Gross Income Multiplier. In using a gross rent multiplier or gross income multiplier, one must have sales information on similar types of properties. These properties should be comparable as to type, not necessarily as to size (i.e., garden-type apartments or high-rise apartments).
lyIncomeGrossMonth
Saleprice=Gross Rent Multiplier (GRM if period is a month)
Monthly rent is routinely used for single family residential properties.
455
500,117=258.24
475
500,122=257.89
465
000,120=258.06
Estimated GRM = 258 for that type of property.
Georgia Department of Revenue Revised 6-13-2018
The Cost Approach to Value 16
lIncomeGrossAnnua
Saleprice=Gross Income Multiplier (GIM if period is a year)
Annual income is used for all other types of income producing properties.
500,12
500,77=6.20
300,13
300,82=6.19
900,12
000,80=6.20
Estimated GIM = 6.20 for that type of property. This method has been upheld in court. However, one must have a number of sales in order to calculate a meaningful GRM and GIM.
Georgia Department of Revenue Revised 6-13-2018
The Cost Approach to Value 17
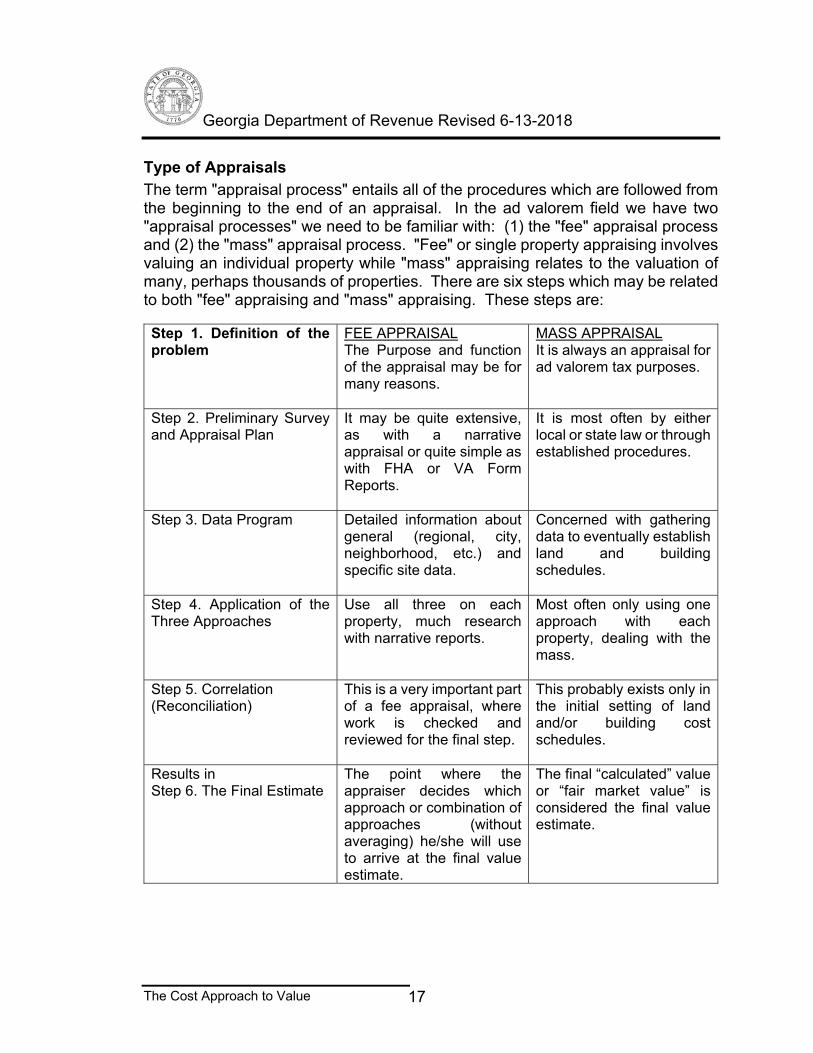
Type of Appraisals
The term "appraisal process" entails all of the procedures which are followed from the beginning to the end of an appraisal. In the ad valorem field we have two "appraisal processes" we need to be familiar with: (1) the "fee" appraisal process and (2) the "mass" appraisal process. "Fee" or single property appraising involves valuing an individual property while "mass" appraising relates to the valuation of many, perhaps thousands of properties. There are six steps which may be related to both "fee" appraising and "mass" appraising. These steps are:
Step 1. Definition of the problem
FEE APPRAISAL The Purpose and function of the appraisal may be for many reasons.
MASS APPRAISAL It is always an appraisal for ad valorem tax purposes.
Step 2. Preliminary Survey and Appraisal Plan
It may be quite extensive, as with a narrative appraisal or quite simple as with FHA or VA Form Reports.
It is most often by either local or state law or through established procedures.
Step 3. Data Program Detailed information about general (regional, city, neighborhood, etc.) and specific site data.
Concerned with gathering data to eventually establish land and building schedules.
Step 4. Application of the Three Approaches
Use all three on each property, much research with narrative reports.
Most often only using one approach with each property, dealing with the mass.
Step 5. Correlation (Reconciliation)
This is a very important part of a fee appraisal, where work is checked and reviewed for the final step.
This probably exists only in the initial setting of land and/or building cost schedules.
Results in Step 6. The Final Estimate
The point where the appraiser decides which approach or combination of approaches (without averaging) he/she will use to arrive at the final value estimate.
The final “calculated” value or “fair market value” is considered the final value estimate.
Georgia Department of Revenue Revised 6-13-2018
The Cost Approach to Value 18
Mass Appraisal Process Components
The "Mass Appraisal Process" is shown in chart form at the end of this chapter. Each of the five various components are discussed below. 1. Property Identification:
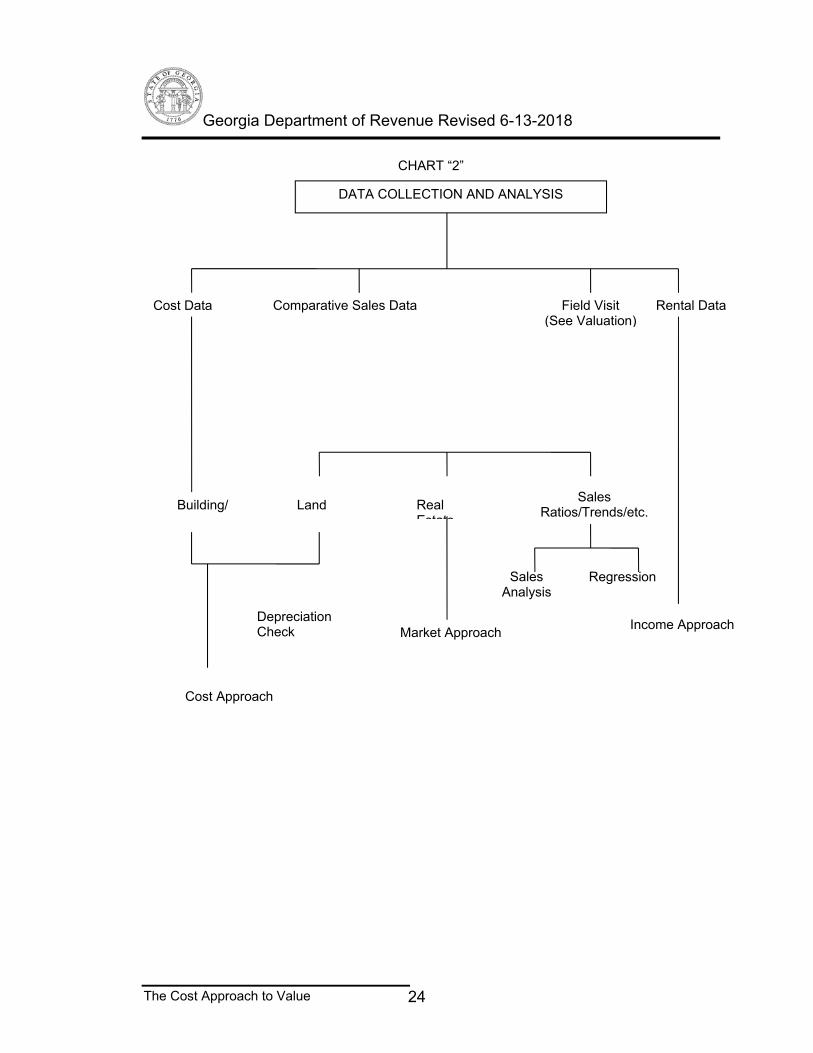
The mass appraisal process begins with the identification of property. The initial step is mapping because properties cannot be properly identified without a mapping system. Mapping systems and procedures are covered in the property tax mapping course. 2. Data Collection and Analysis The next step in the mass appraisal process is data collection and analysis. As seen in the appraisal flow chart, we have collection and analysis for cost information. The data collection concerning "costs" is to assist in the establishment of cost manuals or for the updating of an existing manual. These manuals are ultimately used in estimating the replacement/reproduction cost of the building involved in the appraisal. These data would also be useful in setting up depreciation schedules. "Comparative sales data" is used in almost every aspect of the mass appraisal process. In the context of this section it is used in estimating the value of raw land. It is also used in estimating the value of the real estate through the use of comparable sales. Comparative sales data is the basis for the establishment of sales ratios or trends which we use in ad valorem appraisal as a tool for evaluating our appraisal performance. This information is also useful where computerized assessments are being used. In mass appraisal it is during and within this "collection and analysis" step that the actual land and building schedules are established. It is here that depreciation schedules are established and checked. An example would be to subtract an estimated land price from the sale price of a recently sold property to determine if the remaining value checks with the depreciated cost calculated with our cost manual. 3. Valuation: The third step of the appraisal process is the actual valuation of property. This involves the valuation, on an annual basis, of all property throughout the county. The initial step begins with providing reasonable notice to the owner/occupant prior to visiting the property. Secondly, the use of a "field card" or what is more commonly referred to as a "Property Record Card should be tailored to match the computer assisted mass appraisal system for ease of data entry." The field appraiser takes the property record card to the property and actually measures the property, identifies the various property components on the field card, checking the applicable check points, grades the improvement based on the
Georgia Department of Revenue Revised 6-13-2018
The Cost Approach to Value 19
quality of construction, and places the measurements in the appropriate space on the card. The property record card is also used for updating or making additions or deletions to an existing property. There is no need to revisit, re-measure and recheck every property every year. Schedules should be updated from year to year; properties should be revisited periodically. Once the property record card has been properly filled out and the improvement properly graded, with emphasis on the quality of construction, the property record card is brought back to the county assessor's office. Here the actual card, cost manual and land schedules are merged into a final value estimate. In many instances, the same individual who measured the house and listed it in the field is not the individual who actually calculates the value of the property. This is a perfectly legitimate procedure and in most cases the only manner in which "mass appraising" can be accomplished. Mass appraisal, by its very nature, dictates some degree of "production-line appraising." The use of uniform schedules and manuals should provide everyone with the uniformity and consistency which is necessary in maintaining an equitable assessment system. The end result, therefore, of the "Valuation" portion of the assessment flowchart would be a uniform value estimate, which we in Georgia refer to as "Fair Market Value." This value is the 100% appraisal to which the 40% assessment ratio is applied.
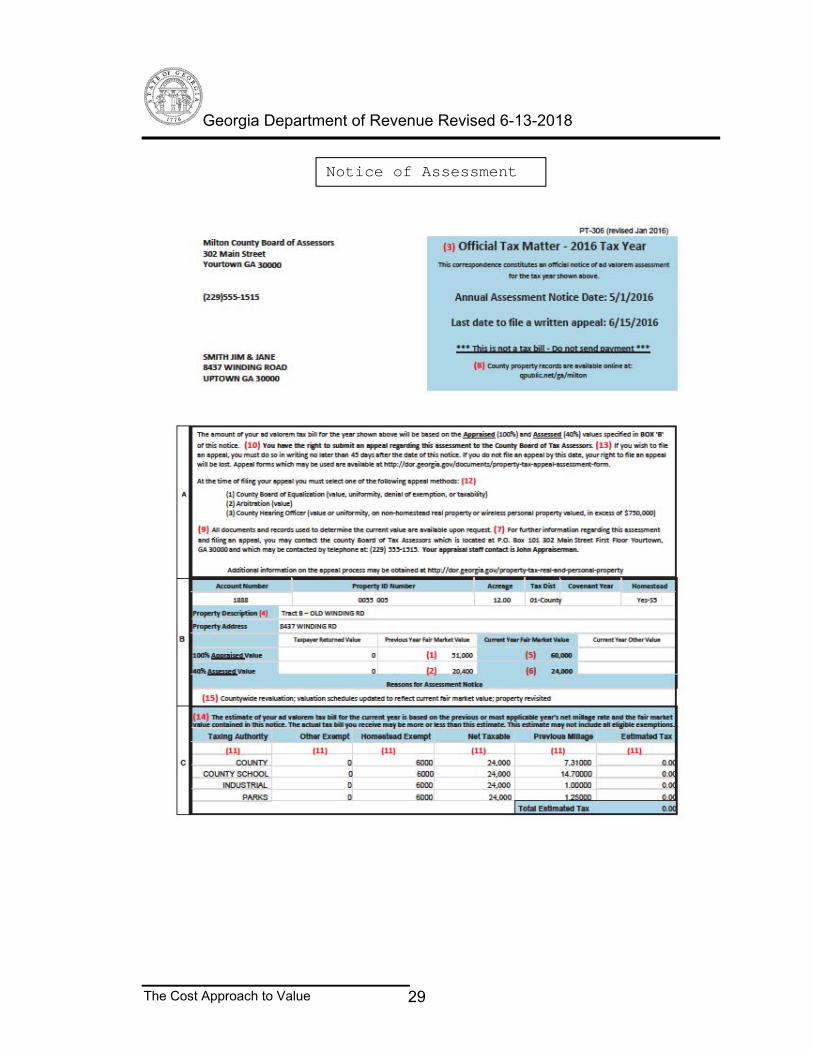
4. Notification of Assessment Notification of annual assessments is the fourth step in the appraisal process. In Georgia, the Board shall give annual notice to the taxpayer the current assessment of taxable real property. When any corrections or changes, including valuation increases or decreases, or equalizations have been made by the board to the personal property tax returns, the board shall give written notice to the taxpayer of such changes made in such taxpayer’s returns. As mentioned previously, there are statutes which dictate the contents of the notice and the time period from which residents and non-residents may file appeals (45 days). Notices to taxpayers shall be mailed no later than the July 1; provided, however, that the annual notice required under this Code section may be sent later than July 1 for the purpose of notifying property owners of corrections and mapping changes. 5. Appeal Procedures 48-5-306 and 311
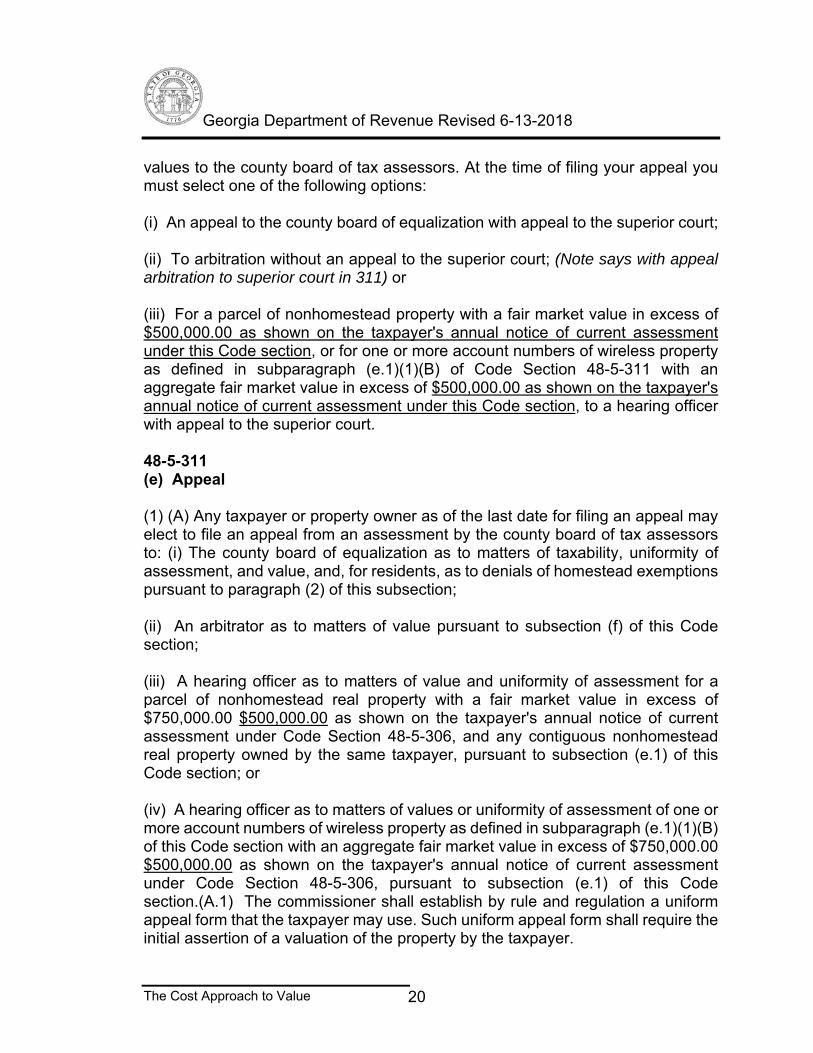
(2) (A) In addition to the items required under paragraph (1) of this subsection, the notice shall contain a statement of the taxpayer's right to an appeal and an estimate of the current year's taxes for all levying authorities which shall be in substantially the following form: "The amount of your ad valorem tax bill for this year will be based on the appraised and assessed values specified in this notice. You have the right to appeal these
Georgia Department of Revenue Revised 6-13-2018
The Cost Approach to Value 20
values to the county board of tax assessors. At the time of filing your appeal you must select one of the following options: (i) An appeal to the county board of equalization with appeal to the superior court; (ii) To arbitration without an appeal to the superior court; (Note says with appeal arbitration to superior court in 311) or (iii) For a parcel of nonhomestead property with a fair market value in excess of $500,000.00 as shown on the taxpayer's annual notice of current assessment under this Code section, or for one or more account numbers of wireless property as defined in subparagraph (e.1)(1)(B) of Code Section 48-5-311 with an aggregate fair market value in excess of $500,000.00 as shown on the taxpayer's annual notice of current assessment under this Code section, to a hearing officer with appeal to the superior court. 48-5-311 (e) Appeal (1) (A) Any taxpayer or property owner as of the last date for filing an appeal may elect to file an appeal from an assessment by the county board of tax assessors to: (i) The county board of equalization as to matters of taxability, uniformity of assessment, and value, and, for residents, as to denials of homestead exemptions pursuant to paragraph (2) of this subsection; (ii) An arbitrator as to matters of value pursuant to subsection (f) of this Code section; (iii) A hearing officer as to matters of value and uniformity of assessment for a parcel of nonhomestead real property with a fair market value in excess of $750,000.00 $500,000.00 as shown on the taxpayer's annual notice of current assessment under Code Section 48-5-306, and any contiguous nonhomestead real property owned by the same taxpayer, pursuant to subsection (e.1) of this Code section; or (iv) A hearing officer as to matters of values or uniformity of assessment of one or more account numbers of wireless property as defined in subparagraph (e.1)(1)(B) of this Code section with an aggregate fair market value in excess of $750,000.00 $500,000.00 as shown on the taxpayer's annual notice of current assessment under Code Section 48-5-306, pursuant to subsection (e.1) of this Code section.(A.1) The commissioner shall establish by rule and regulation a uniform appeal form that the taxpayer may use. Such uniform appeal form shall require the initial assertion of a valuation of the property by the taxpayer.
Georgia Department of Revenue Revised 6-13-2018
The Cost Approach to Value 21
(g) Appeals to the superior court. (1) The taxpayer or the county board of tax assessors may appeal decisions of the county board of equalization, hearing officer, or arbitrator, as applicable, to the superior court of the county in which the property lies.
SUMMARY
Mass appraising, as contrasted with fee (single property) appraising, is a much more comprehensive process. In viewing the mass appraisal flow chart, the work of a fee appraiser, who values only a single property, begins and ends in the "data collection and analysis" and "valuation" portion of the chart. The assessor, however, must initially identify each and every parcel of land within the county; map and identify property splits or transfers; collect information concerning costs, market sales and rental data; physically measure and value each parcel of property; notify the taxpayers with an annual notice of assessment; be prepared to support the value estimates from initial hearings through boards of equalization and into the judicial system. Mass appraising is extremely comprehensive. The assessor must value every possible type of property and deal with virtually every type valuation problem which might be encountered in the appraisal of real estate.
Georgia Department of Revenue Revised 6-13-2018
The Cost Approach to Value 22
Mass Appraisal Flow Charts
1. DEFINITION OF THE PROBLEM A. PROPERTY IDENTIFICATION
(See Chart “1”) B. DATA COLLECTION AND ANALYSIS
(See Chart “2”) C. VALUATION
(See Chart “3”) D. NOTIFICATION OF ASSESSMENTS
O.C.G.A. 48-5-306 (See Chart “4”)
E. APPEAL PROCEDURES O.C.G.A. 48-5-311
(See Chart “5”) F. TAX BILL *
Not the Assessor’s Responsibility (See Chart “6”)
Georgia Department of Revenue Revised 6-13-2018
The Cost Approach to Value 23
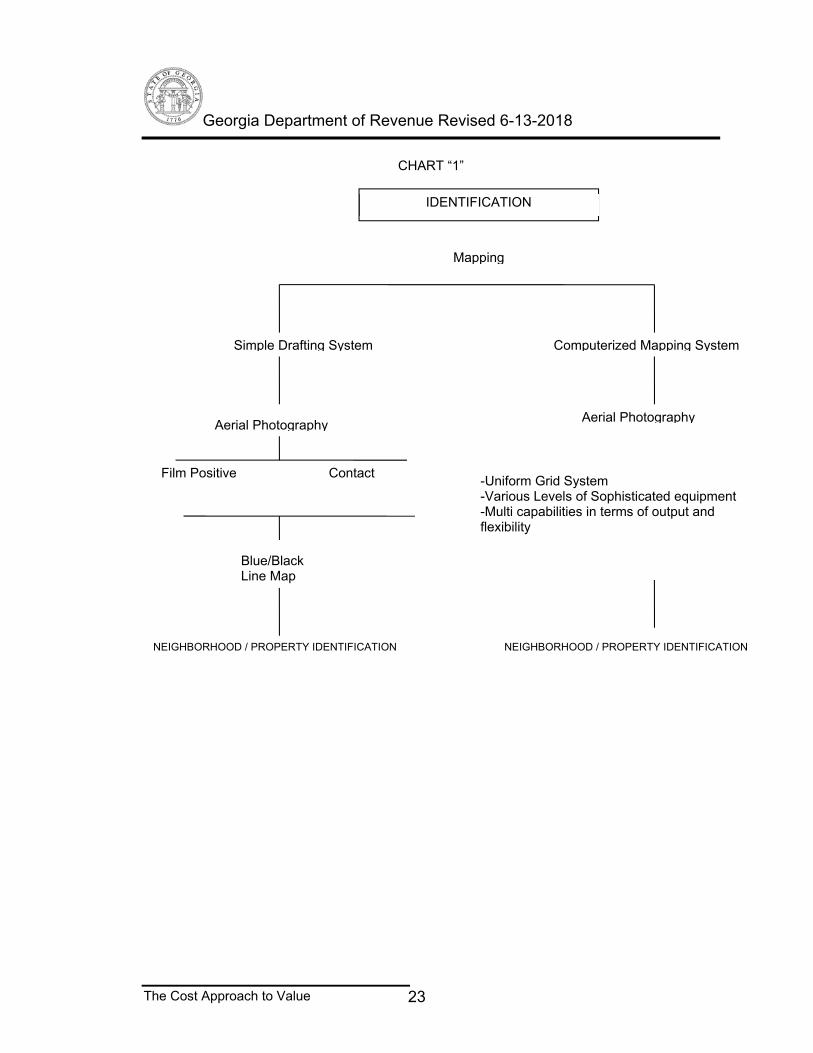
CHART “1”
IDENTIFICATION
Mapping
Simple Drafting System Computerized Mapping System
Aerial Photography
Film Positive Contact
Aerial Photography
-Uniform Grid System -Various Levels of Sophisticated equipment -Multi capabilities in terms of output and flexibility
(b) Contents of notice. (1) The annual notice of current assessment required to be given by the county board of tax assessors under subsection (a) of this Code section shall be dated and shall contain the name and last known address of the taxpayer. The annual notice shall conform with the state-wide uniform assessment notice which shall be established by the commissioner by rule and regulation and shall contain: (A) The amount of the previous assessment; (B) The amount of the current assessment; (C) The year for which the new assessment is applicable; (D) A brief description of the assessed property broken down into real and personal property classifications; (E) The fair market value of property of the taxpayer subject to taxation and the assessed value of the taxpayer's property subject to taxation after being reduced; (F) The name, phone number, and contact information of the person in the assessors' office who is administratively responsible for the handling of the appeal and who the taxpayer may contact if the taxpayer has questions about the reasons for the assessment change or the appeals process; (G) If available, the website address of the office of the county board of tax assessors; and (H) A statement that all documents and records used to determine the current value are available upon request. (2)(A) In addition to the items required under paragraph (1) of this subsection, the notice shall contain a statement of the taxpayer's right to an appeal and an estimate of the current year's taxes for all levying authorities which shall be in substantially the following form: 'The amount of your ad valorem tax bill for this year will be based on the appraised and assessed values specified in this notice. You have the right to appeal these values to the county board of tax assessors. At the time of filing your appeal you must select one of the following options: (i) An appeal to the county board of equalization with appeal to the superior court; (ii) To arbitration without an appeal to the superior court; or (iii) For a parcel of nonhomestead property with a fair market value in excess of $750,000.00, or for one or more account numbers of wireless property as defined in subparagraph (e.1)(1)(B) of Code Section 48-5-311 with an aggregate fair market value in excess of $750,000.00, to a hearing officer with appeal to the superior court.
Georgia Department of Revenue Revised 6-13-2018
The Cost Approach to Value 27
If you wish to file an appeal, you must do so in writing no later than 45 days after the date of this notice. If you do not file an appeal by this date, your right to file an appeal will be lost. For further information on the proper method for filing an appeal, you may contact the county board of tax assessors which is located at: (insert address) and which may be contacted by telephone at: (insert telephone number).' (C) The notice shall also contain the following statements in bold print: 'The estimate of your ad valorem tax bill for the current year is based on the previous or most applicable year's millage rate and the fair market value contained in this notice. The actual tax bill you receive may be more or less than this estimate. This estimate may not include all eligible exemptions.' (3) The annual notice required under this Code section shall be mailed no later than July 1; provided, however, that the annual notice required under this Code section may be sent later than July 1 for the purpose of notifying property owners of corrections and mapping changes. (c) Posting notice on certain conditions. In all cases where a notice is required to be given to a taxpayer under subsection (a) of this Code section, if the notice is not given to the taxpayer personally or if the notice is mailed but returned undelivered to the county board of tax assessors, then a notice shall be posted in front of the courthouse door or shall be posted on the website of the office of the county board of tax assessors for a period of 30 days. Each posted notice shall contain the name of the owner liable to taxation, if known, or, if the owner is unknown, a brief description of the property together with a statement that the assessment has 126 been made or the return changed or altered, as the case may be, and the notice need not contain any other information. The judge of the probate court of the county shall make a certificate as to the posting of the notice. Each certificate shall be signed by the judge and shall be recorded by the county board of tax assessors in a book kept for that purpose. A certified copy of the certificate of the judge duly authenticated by the secretary of the board shall constitute prima-facie evidence of the posting of the notice as required by law. "(d) Records and information availability. Notwithstanding the provisions of Code Section 50-18-71, in the case of all public records and information of the county board of tax assessors pertaining to the appraisal and assessment of real property: (1) The taxpayer may request, and the county board of tax assessors shall provide within ten business days, copies of such public records and information, including, but not limited to, a description of the methodology used by the board of tax assessors in setting the property's fair market value, all documents reviewed in making the assessment, the address and parcel identification number of all real property utilized as qualified comparable properties, and all factors considered in establishing the new assessment, at a uniform copying fee not to exceed 25¢ per page; (2) No additional charges or fees may be collected from the taxpayer for reasonable search, retrieval, or other administrative costs associated with providing such public records and information; and (3)(A) The superior courts of this state shall have jurisdiction in law and in equity to entertain actions against the board of tax assessors to enforce compliance with the provisions of this subsection. (B) In any action brought to enforce the provisions of this subsection in which the court determines that either party acted without substantial justification either in not complying with this
Georgia Department of Revenue Revised 6-13-2018
The Cost Approach to Value 28
subsection or in instituting the litigation, the court shall, unless it finds that special circumstances exist, assess in favor of the complaining party reasonable attorney's fees and other litigation costs reasonably incurred. Whether the position of the complaining party was substantially justified shall be determined on the basis of the record as a whole which is made in the proceeding for which fees and other expenses are sought." (e) Description of current assessment. The notice required by this Code section shall be accompanied by a simple, nontechnical description of the basis for the current assessment. (f) The commissioner shall promulgate such rules and regulations as may be necessary for the administration of this Code section."
Georgia Department of Revenue Revised 6-13-2018
The Cost Approach to Value 29
Notice of Assessment
Georgia Department of Revenue Revised 6-13-2018
The Cost Approach to Value 30
CHART “5’ *Standard Appeal Form
Georgia Department of Revenue Revised 6-13-2018
The Cost Approach to Value 31
Georgia Department of Revenue Revised 6-13-2018
The Cost Approach to Value 32
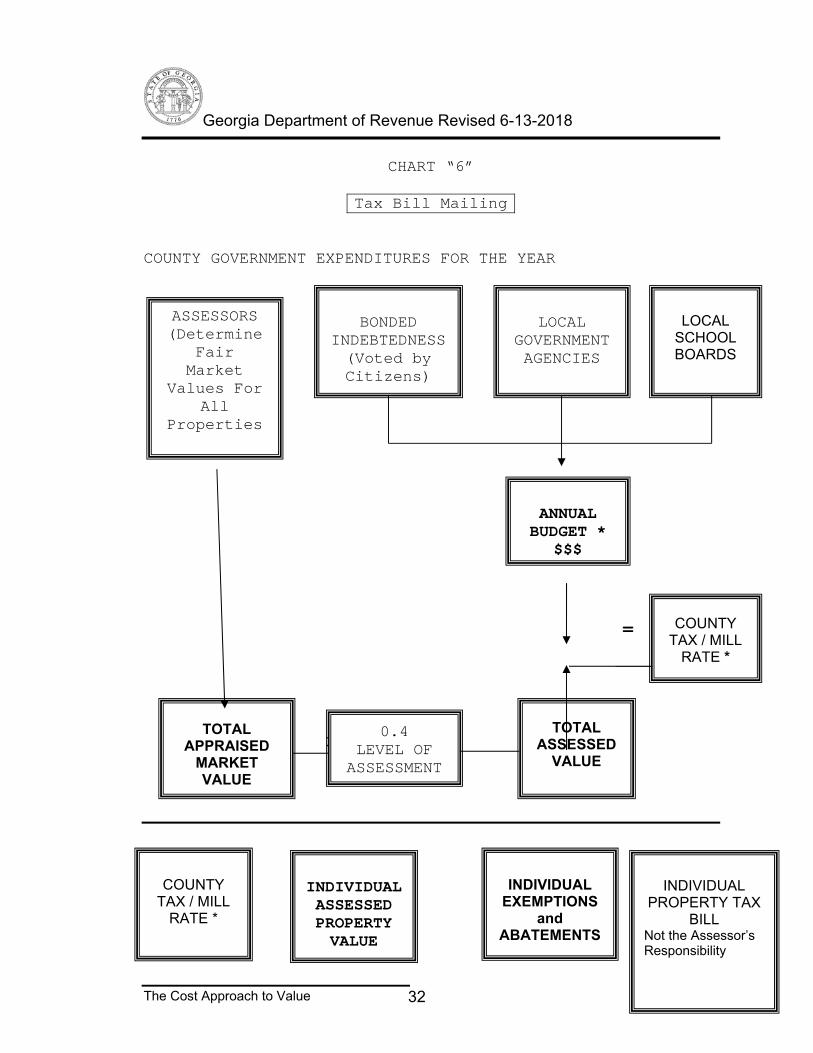
CHART “6”
Tax Bill Mailing
COUNTY GOVERNMENT EXPENDITURES FOR THE YEAR
= X = COUNTY TAX X LESS = = 1
ASSESSORS (Determine
Fair Market
Values For All
Properties
BONDED
INDEBTEDNESS (Voted by Citizens)
LOCAL
GOVERNMENT AGENCIES
LOCAL
SCHOOL BOARDS
ANNUAL
BUDGET * $$$
COUNTY TAX / MILL
RATE *
TOTAL APPRAISED
MARKET VALUE
0.4 LEVEL OF
ASSESSMENT
TOTAL ASSESSED
VALUE
COUNTY
TAX / MILL RATE *
INDIVIDUAL ASSESSED PROPERTY VALUE
INDIVIDUAL
EXEMPTIONS and
ABATEMENTS
INDIVIDUAL
PROPERTY TAX BILL
Not the Assessor’s Responsibility
Georgia Department of Revenue Revised 6-13-2018
The Cost Approach to Value 33
Georgia Department of Revenue Revised 6-13-2018
The Cost Approach to Value 34
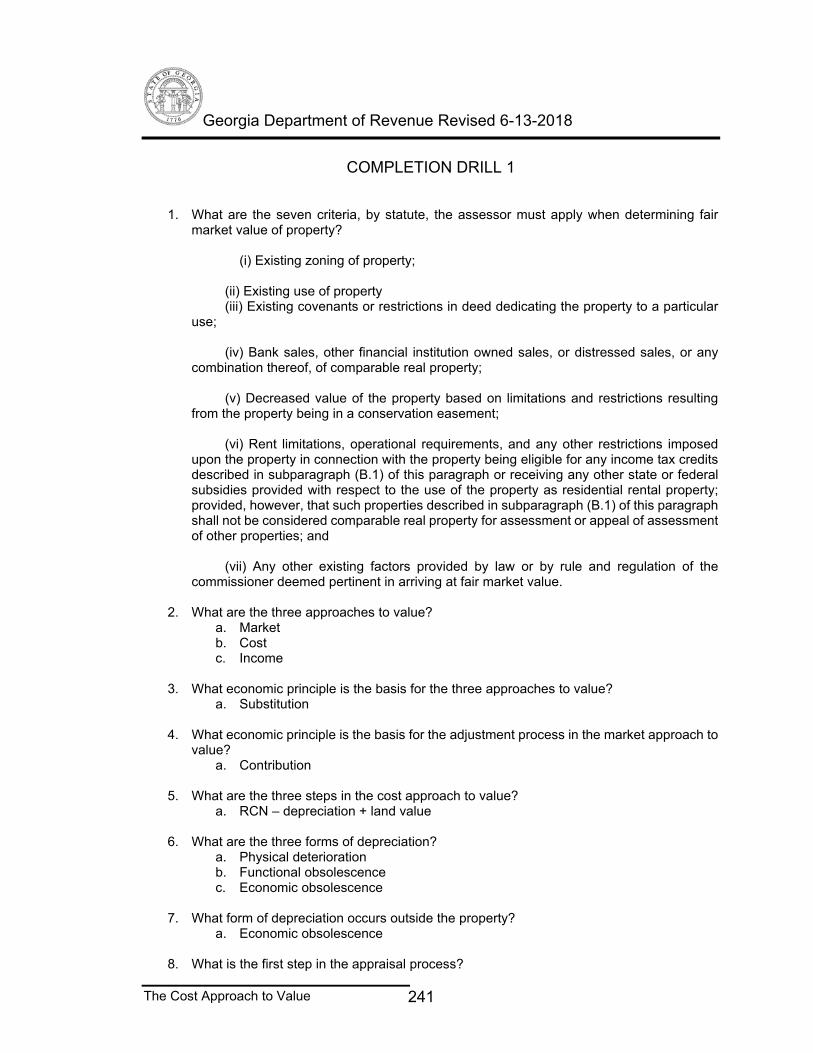
Completion Drill 1 1. What are the six criteria, by statute, the assessor must apply when
determining fair market value of real property? 2. What are the three approaches to value? 3. What economic principle is the basis for the three approaches to value? 4. What economic principle is the basis for the adjustment process in the
market approach to value? 5. What are the three steps in the cost approach to value? 6. What are the three forms of depreciation? 7. What form of depreciation occurs outside the property? 8. What is the first step in the appraisal process?
Georgia Department of Revenue Revised 6-13-2018
The Cost Approach to Value 35
9. At what point is it appropriate to average to arrive at the final value estimate? 10. When is the cost approach the most appropriate approach to value? 11. How many days does a taxpayer have to file a written appeal with the
assessor? 12. What are the three major components of a county budget? 13. How is a mill (tax) rate calculated? 14. How is a gross rent multiplier calculated? 15. What is the assessor's responsibility relating to the property tax?
Georgia Department of Revenue Revised 6-13-2018
The Cost Approach to Value 36
Chapter 2 Estimating Reproduction or Replacement Cost New
Georgia Department of Revenue Revised 6-13-2018
The Cost Approach to Value 37
Estimating Reproduction or Replacement Cost New Either reproduction cost or replacement cost may be used. The estimate is as of the date of the appraisal, not when the improvements were constructed. There is an important distinction between reproduction cost and replacement cost: Reproduction cost is the cost of creating an exact replica of the improvements based on current prices for labor and materials. The materials should be as similar as possible to those originally used; however, they do not have to be exactly the same. It may be used to measure functional obsolescence. Replacement cost is the cost of creating an improvement having the same or equivalent utility as another, using modern standards of material and design and workmanship, based on current prices for labor and materials. In theory replacement cost cures functional obsolescence. Theoretically, reproduction cost is easier to use but as a matter of practicality, it becomes quite difficult to estimate for older improvements, because identical materials are not always available and construction methods and design are constantly changing. The use of replacement cost provides a practical alternative. It represents the funds required to build an equally desirable substitute improvement, not necessarily with similar materials or to the same specifications. For example, reproduction cost for an older house erected with solid brick walls should be computed on the basis of identical design erected today. On the other hand, an estimate of replacement cost would not necessarily imply a structure with solid brick walls. Quite possibly current design and construction standards in the neighborhood for a house of this type, style and value would be frame construction with brick veneer walls. Accordingly, by using replacement cost instead of reproduction cost, some of the obsolescence or "inutility" present in the house with solid masonry walls should be eliminated from the estimate before deductions for accrued depreciation are made. Care must be exercised not to take double depreciation. In the above example the solid masonry walls have already been treated by using replacement cost of a frame house with brick veneer walls. A penalty should not again be deducted for functional obsolescence.
Georgia Department of Revenue Revised 6-13-2018
The Cost Approach to Value 38
Methods of Cost Estimating
There are a variety of acceptable ways for the appraiser to estimate the reproduction or replacement cost new of an improvement. They range from the comprehensive quantity survey method, used by contractors, to the simpler unit-in-place method and the most popular method called the square foot/cubic foot method. A fourth method is factored historical cost, which applies an index or trend factor to a previous value. This implies that the cost of all materials and labor is increasing at exactly the same rate. For this reason it is the least accurate and desirable method.
For analysis, the costs of an improvement can be divided into direct and indirect costs:
1. Direct costs (on site) a. Materials b. Equipment c. Labor
2. Indirect costs (off site) a. Professional services
b. Developer's overhead c. Building permits and licenses d. Insurance premiums e. Interest f. Taxes g. Selling expenses (commissions, advertising,
promotion) h. Carrying cost from time of completion to sale or
occupancy i. Contractor's or subcontractor's overhead and profit
(sometimes classified a direct cost)
Georgia Department of Revenue Revised 6-13-2018
The Cost Approach to Value 39
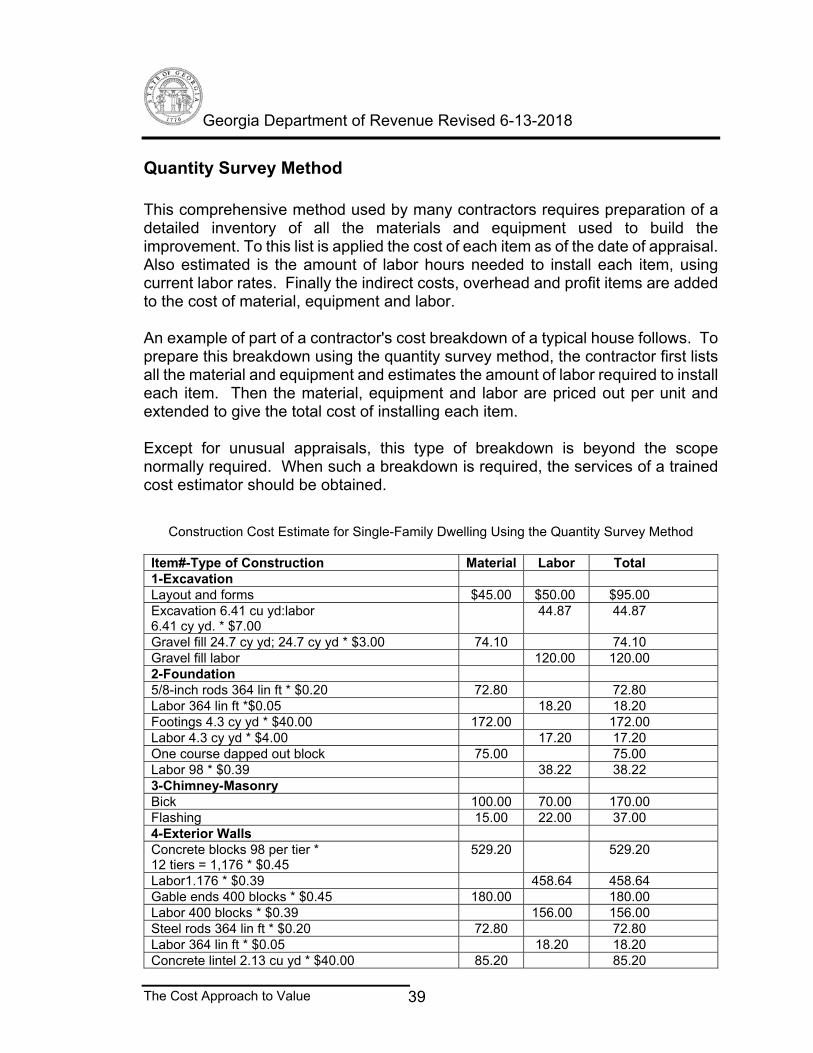
Quantity Survey Method This comprehensive method used by many contractors requires preparation of a detailed inventory of all the materials and equipment used to build the improvement. To this list is applied the cost of each item as of the date of appraisal. Also estimated is the amount of labor hours needed to install each item, using current labor rates. Finally the indirect costs, overhead and profit items are added to the cost of material, equipment and labor. An example of part of a contractor's cost breakdown of a typical house follows. To prepare this breakdown using the quantity survey method, the contractor first lists all the material and equipment and estimates the amount of labor required to install each item. Then the material, equipment and labor are priced out per unit and extended to give the total cost of installing each item. Except for unusual appraisals, this type of breakdown is beyond the scope normally required. When such a breakdown is required, the services of a trained cost estimator should be obtained.
Construction Cost Estimate for Single-Family Dwelling Using the Quantity Survey Method
Item#-Type of Construction Material Labor Total 1-Excavation Layout and forms $45.00 $50.00 $95.00 Excavation 6.41 cu yd:labor 6.41 cy yd. * $7.00
44.87 44.87
Gravel fill 24.7 cy yd; 24.7 cy yd * $3.00 74.10 74.10 Gravel fill labor 120.00 120.00 2-Foundation 5/8-inch rods 364 lin ft * $0.20 72.80 72.80 Labor 364 lin ft *$0.05 18.20 18.20 Footings 4.3 cy yd * $40.00 172.00 172.00 Labor 4.3 cy yd * $4.00 17.20 17.20 One course dapped out block 75.00 75.00 Labor 98 * $0.39 38.22 38.22 3-Chimney-Masonry Bick 100.00 70.00 170.00 Flashing 15.00 22.00 37.00 4-Exterior Walls Concrete blocks 98 per tier * 12 tiers = 1,176 * $0.45
529.20 529.20
Labor1.176 * $0.39 458.64 458.64 Gable ends 400 blocks * $0.45 180.00 180.00 Labor 400 blocks * $0.39 156.00 156.00 Steel rods 364 lin ft * $0.20 72.80 72.80 Labor 364 lin ft * $0.05 18.20 18.20 Concrete lintel 2.13 cu yd * $40.00 85.20 85.20
Georgia Department of Revenue Revised 6-13-2018
The Cost Approach to Value 40
Item#-Type of Construction Material Labor Total Labor 10.00 10.00 Mortar 1,576 blocks * $0.10 157.60 157.60 Labor forms, removal 50.00 50.00 5-Floor Construction Membrane (felt, hot mopped) 1,000 sq ft * $0.10
100.00 100.00
Labor 1,000 sq ft * $0.05 50.00 50.00 Wire mesh 1,100 sq ft *$0.07 77.00 77.00 Labor 1,100 sq ft * $0.01 11.00 11.00 Exposed joint 156 lin ft * $0.20 31.20 31.20 Labor 156 lin ft *$0.025 3.90 3.90 Concrete slab 12.4 cu yd *$40.00 496.00 496.00 Labor 12.4 cu yd * $3.50 43.40 43.40 Bolts 31 * $0.30 9.30 9.30 Labor 31 * $0.11 3.41 3.41 Finishing 6.00 100.00 106.00 6-Partitions Sole plated (2 * 4) 126 lin ft * $0.38 47.88 47.88 Labor 126 lin ft * $0.20 25.20 25.20 Studs (2 * 4) 423 bd ft * $0.25 105.75 105.75 Labor 423 bd ft * $0.18 76.14 76.14 7-Ceiling framing Top plate (2 * 6) 130 lin ft * $0.40 52.00 52.00 Labor 22.00 22.00 Joists 870 sq ft * $0.28 243.60 243.60 Labor 870 sq ft * $0.20 174.00 174.00 Bridging (1 * 3) 177 lin ft * $0.08 14.16 14.16 Labor 177 lin ft * $0.12 21.24 21.24 Rough and finish not included 224.00 224.00 8-Roof framing Bolts 32 * $0.29 9.28 9.28 Labor 32 * $0.14 4.48 4.48 Top plate (2 * 4) 126 bd ft * $0.25 31.50 31.50 Labor 126 bd ft * $0.19 23.94 23.94 Fascia )1 * 6) 80 lin ft * $0.39 31.20 31.20 Labor 80 lin ft * $0.29 23.20 23.20 Boxed cornice 126 bd ft * $0.30 37.80 37.80 Labor 126 bd ft * $0.21 26.46 26.46 9-Roofing Rafter(2 * 6) 1,040 bd ft * $0.25 260.00 260.00 Labor 1,040 bd ft * $0.19 197.60 197.60 Purlins (2 * 4) 47 bd ft * $0.28 13.16 13.16 Labor 47 bd ft * $0.24 11.28 11.28 Bracing (2 * 4) 103 bd ft * $0.28 28.84 28.84 Labor 103 bd ft * $0.24 24.72 24.72 Roof decking 1,628 bd ft * $0.24 390.72 390.72 Labor 1,628 bd ft * $0.18 293.04 293.04 Roofing (felt 2 layers) 1,628 bd ft * $0.04 65.12 65.12 Labor 1,628 bd ft * $0.03 48.84 48.84 Roofing 13.33 sq ft * $19.00 253.27 253.27
Georgia Department of Revenue Revised 6-13-2018
The Cost Approach to Value 41
Item#-Type of Construction Material Labor Total Labor 13.33 sq ft * $10.00 133.30 133.30 Eave drip 80 lin ft * $0.14 11.20 11.20 Labor 80 lin ft * $0.07 5.60 5.60 10-Gutters and downspouts Material 85.00 85.00 Labor 85.00 85.00 11-Windows Windows 11 * $63.00 693.00 693.00 Labor 11 * $13.00 143.00 143.00 12-Entrance and exterior detail Outside doors 2 * $90.00 180.00 180.00 Labor 2 * $25.00 50.00 50.00 Screen doors 2 * $26.00 52.00 52.00 Labor 2 * $12.00 24.00 24.00 Louvers 2 * $20.00 40.00 40.00 Labor 2 * $6.00 12.00 12.00 13-Insulation rock wool 115.00 80.00 195.00 14-Interior wallboard Gypsum board 386 sq yd * $2.10 810.60 810.60 Labor 386 sq yd * $1.90 733.40 733.40 15-Carpeting Material 97 sq yd * $7.00 679.00 679.00 Labor 97 sq yd * $2.00 194.00 194.00 16-Tile flooring Kitchen-vinyl-asbestos;material 11 sq yd*$10.00
Labor 4.5 sq yd *$10.00 45.00 45.00 17 Interior door and trim Exterior walls base board 130 lin ft * $0.24 31.20 31.20 Labor 130 lin ft * $0.15 19.50 19.50 Exterior walls molding 130 lin ft * $0.10 13.00 13.00 Labor 130 lin ft * $0.06 7.80 7.80 Interior partitions baseboard 202 lin ft * $0.24
48.48 48.48
Labor 202 lin ft * $0.10 20.20 20.20 Shoe mold 202 lin ft * $0.10 20.20 20.20 Labor 202 lin ft * $0.05 10.10 10.10 Interior doors 10 * $47.00 470.00 470.00 Labor 10 * $25.00 250.00 250.00 18-Cabinet work Base 8 ft and Fomica top and splash 8 lin ft * $34.00
272.00 272.00
Labor 8 lin ft * $34.00 88.00 88.00 Wall cabinets 12 lin ft labor & materials @ $20.00
240.00
Medicine cabinet 40.00 10.00 50.00 Shelves and rods 30.00 20.00 50.00
Georgia Department of Revenue Revised 6-13-2018
The Cost Approach to Value 42
Item#-Type of Construction Material Labor Total 19-Painting and decorating Undercoat and finish material 3,556 sq ft *.$0.09
320.04 320.04
Labor 3,556 sq ft * $0.12 426.72 426.72 11 windows @ $18.00 198.00 198.00 Exterior walls and gable 220.00 220.00 20-Plumbing Plumbing (total contract with guarantee) 900.00 900.00 Labor 1050.00 1050.00 21-Heating Electric heat 45 lin ft *$7.20 324.00 324.00 Labor 45 lin ft * $4.80 216.00 216.00 22-Electric 37 outlets (materials and labor) 150.00 150.00 Service 105.00 105.00 Labor 125.00 125.00 Range and heater wiring 45.00 80.00 125.00 Fixtures 140.00 23-Miscellaneous Water supply under construction 75.00 Building permit 60.00 Electrical service under construction 50.00 Site Clearance 70.00 Architect’s fee 125.00 Total material and labor cost $17,291.00 Add: field overhead @ 4% 691.64 Subtotal $17,982.64 Contractor’s profit and overhead @ 22% 3,956.18 Total Construction Cost $21,938.82
Appraisers often use a summary of the contractor's cost breakdown. The specifications and general description of the house used for this example are as follows:
General Description One-family, one-story, ranch-style, seven rooms (living room, family room, dining room, kitchen, three bedrooms, two full baths), full unfinished basement. No porches. Gross living area: 1,422 square feet. Two-car, attached garage.
General Construction Concrete footings and foundation walls. Exterior walls: cedar shingles. Roof covering: cedar shingles. Wood, double-hung windows, combination aluminum storm windows and screens. Aluminum gutters and downspouts. Batt type insulation. Wood platform framing, plywood subfloors, oak floors, except kitchen (vinyl asbestos) and bathrooms (ceramic tile wainscot).
Mechanical Systems Plumbing: copper water and waste pipes connected to municipal services in
Georgia Department of Revenue Revised 6-13-2018
The Cost Approach to Value 43
street. Electric, 60-gal domestic water heater. One double, stainless steel kitchen sink. Each bathroom has standard water closet, lavatory and tub with shower. Laundry tub in basement and washer/dryer hook-up. Heating: Oil-fired, hot water furnace; two circulators; baseboard radiators. Electrical: 100-ampere service; 16 circuits protected with circuit breakers; BX cable; adequate outlets and features. Built-in Appliances: gas oven and range, hood with exhaust fan in kitchen.
General Quality
House is average quality throughout and meets FHA minimum standards. Based on this summary an appraiser might estimate the replacement cost new at $40,000. Note that this example is not in itself a complete quantity survey breakdown but represents a summary of the cost estimator's quantity survey analysis.
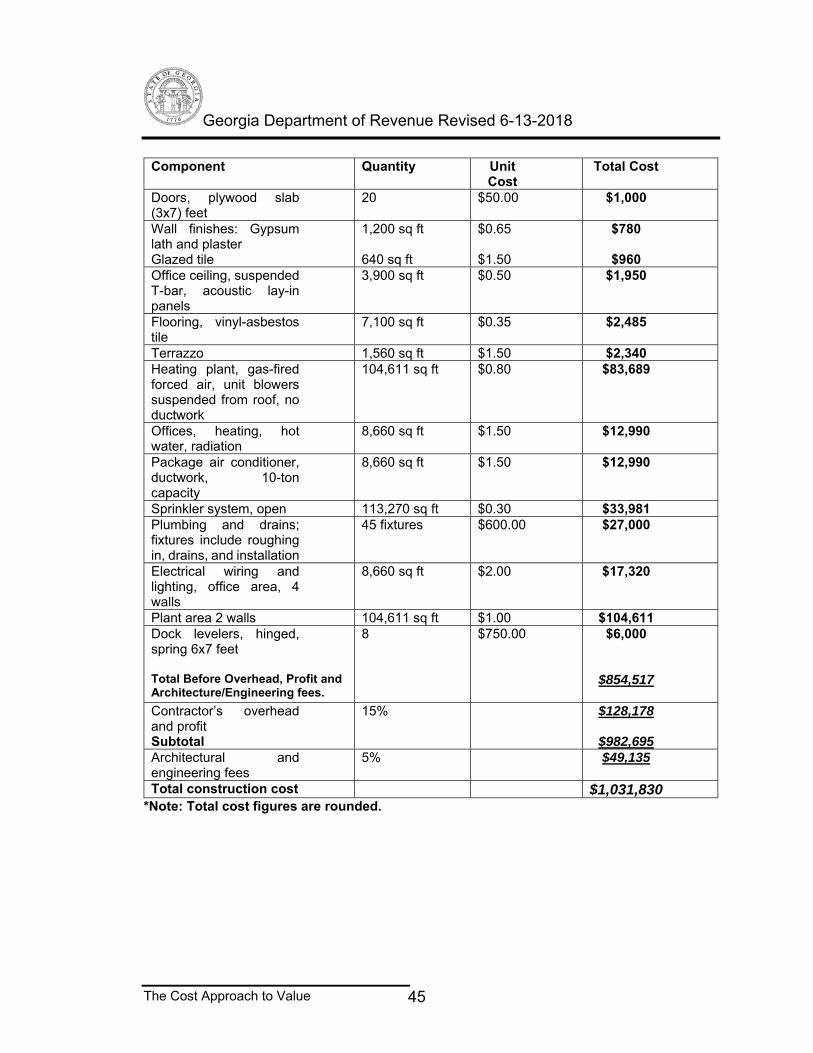
Unit in Place Method Many house contractors use numerous subcontractors, who have special expertise in certain areas and often can do the work better and cheaper than a general contractor. Typically, general contractors who use a substantial number of subcontractors figure the cost of a house by breaking it down into components corresponding to the work done by the various subcontractors. Popular cost services (which will be described later in this chapter) also use this technique, calling it the segregated cost method. It is based on the use of unit prices for the various building components, using workable units such as the square foot, linear foot or other appropriate basic unit. Following is a typical list of improvement construction components is given. The cost estimates for these components are made in terms of standardized unit costs for installation. Providing that the units accurately reflect costs, this estimate is a short cut to an actual quantity survey. The resulting figure should correspond in accuracy with that derived from a quantity survey
Illustration of the Unit-in-Place Method
(Construction Cost Estimate of an Industrial Building)
Component Quantity Unit Cost
Total Cost
Excavation, for foundation walls and column footings, yards of material
933 yd $1.75 $1,633
Column footings, 86 yd $42.50 $3,655
Georgia Department of Revenue Revised 6-13-2018
The Cost Approach to Value 44
Component Quantity Unit Cost
Total Cost
concrete, including reinforcing and form work Wall footings, 20x8 inches, including light reinforcing
1,367 lin ft $0.93 $1,271
Foundation walls, 12-inch reinforced concrete; includes form work, concrete, and reinforcing
5,468 sq ft $2.40 $13,123
Column piers, reinforced concrete
22 yd $113.00 $2,486
Structural steel, 88 columns, plus girders
4,191 cwt $22.00 $92,202
Cost of steel, erected in place; 280 long-span teel joists regulated at 40 feet
280 ft $200.00 $56,000
Flooring, 60-inch concrete on sand fill, wire-mesh reinforcing, cured finish
113,270 sq ft $0.95 $107,607
Insulation 113,270 sq ft $0.75 $84,953 Roofing, tar and gravel plus flashing
Terrazzo 1,560 sq ft $1.50 $2,340 Heating plant, gas-fired forced air, unit blowers suspended from roof, no ductwork
104,611 sq ft $0.80 $83,689
Offices, heating, hot water, radiation
8,660 sq ft $1.50 $12,990
Package air conditioner, ductwork, 10-ton capacity
8,660 sq ft $1.50 $12,990
Sprinkler system, open 113,270 sq ft $0.30 $33,981 Plumbing and drains; fixtures include roughing in, drains, and installation
45 fixtures $600.00 $27,000
Electrical wiring and lighting, office area, 4 walls
8,660 sq ft $2.00 $17,320
Plant area 2 walls 104,611 sq ft $1.00 $104,611 Dock levelers, hinged, spring 6x7 feet Total Before Overhead, Profit and Architecture/Engineering fees.
8 $750.00 $6,000
$854,517
Contractor’s overhead and profit Subtotal
15% $128,178
$982,695 Architectural and engineering fees
5% $49,135
Total construction cost $1,031,830 *Note: Total cost figures are rounded.
Georgia Department of Revenue Revised 6-13-2018
The Cost Approach to Value 46
From the following information determine the value of the speculative building occupied by an industry with modifications to the original building setup using unit in place: Problem: Total Construction Costs of Speculative Building 4,000 square feet before overhead/profit and architectural/engineering fees
1,030,500
Contractor’s overhead and profit 18% Subtotal Architectural and engineering fees 3% Total original construction cost Additional items added after original construction
7 Overhead Doors $2,000 each
10 Additional Plumbing Fixtures $500 each
Electrical Wiring $7.50 sqft
Total Value of Building
Georgia Department of Revenue Revised 6-13-2018
The Cost Approach to Value 47
Solution: Total Construction Costs of Speculative Building 4,000 square feet before overhead/profit and architectural/engineering fees
1,030,500
Contractor’s overhead and profit 18% $185,490
Subtotal $1,215,990 Architectural and engineering fees 3% $36,480 Total original construction cost $1,252,470 Additional items added after original construction
7 Overhead Doors $2,000 each
$14,000
10 Additional Plumbing Fixtures $500 each
$5,000
Electrical Wiring $7.50 sqft
$30,000
Total Cost of Construction with Additional Items
$1,301,470
Square Foot/Cubic Foot/Point Cost Method
Historically, there have been many different ways to measure a house. Although various systems are used by cost services and according to local definition, the acceptance of the URAR form and guidelines suggest following their method. They call for the calculation of total gross living area, which is a measurement taken around the outside of the house and includes finished and habitable above-grade living area only. Finished basements or attic areas are calculated and shown separately for use in the cost estimate but are not included in the total gross living area. It reflects the fact that plumbing, heating system, doors, windows, and similar items do not necessarily cost proportionately more in a large house than in a small one. If a similar cost is spread over a larger area, the unit cost is obviously less. The apparent simplicity of the square foot comparison method can be misleading. Dependable square foot cost figures require the exercise of care and judgment in the process of comparison with similar or standard houses for which actual costs are known. Inaccuracies may result from selection of a square foot cost that is not properly related to the house under appraisal. However, correct application of this procedure will provided estimates of reproduction or replacement cost that are reasonably accurate and entirely acceptable in appraisal practice.
Georgia Department of Revenue Revised 6-13-2018
The Cost Approach to Value 48
Factored Historical Cost (Trended Original Cost) Property Appraisal and Assessment Administration3, the trended original cost method obtains an estimate of the reproduction cost of a structure by trending its original, or historical, cost with a factor from an appropriate construction cost index. The method is used to appraise structures for which comparable cost data are not available, as well as large industrial properties that would take too long to describe accurately enough for the unit-in-place or quantity survey methods. Trended original costs can also be used to validate cost estimates produced by other cost methods and are especially useful for recently constructed properties. For example, a 200-bed general hospital was built nine years ago for $7,853,000. An appropriate cost index shows that hospital construction costs have since increased 68.3 percent. The trended original cost is
$7,853,000 x 1.683 = $13,216,600. Accuracy depends on knowledge of the date(s) and original cost of construction. Costs attributable to land, personal property, and site improvements should be subtracted from total costs. Further, reported costs should be adjusted to exclude extraneous or atypical costs and include unreported costs. Such determinations should be made by an appraiser skilled in auditing construction cost records. Cost Index Trending Example Current period index number 125 Construction period index number 115 Historical cost $120,000 Cost new of buildings = current index / construction index * historical cost 125 / 115 = 1.087 * $120,000 = $130,440
Sources of Cost Figures Reliable sources for obtaining cost data exist. However, it is best to use local contractors and local construction material suppliers to obtain costs.
3 International Association of Assessing Officers, 1990, Chicago,
Georgia Department of Revenue Revised 6-13-2018
The Cost Approach to Value 49
Cost Data File. The use of square foot cost estimates involves assembling, analyzing, and cataloging data on actual house costs. An appraiser should have available comprehensive current cost information for the types of houses and other improvements, including data on current material and labor costs. A system of grading quality of construction should also be used to refine the data further. This data can often be obtained from local builders, lenders, material suppliers, and trade associations. A file of this kind provides a check against cost of reproducing or replacing an existing residence, as well as against known or projected costs for existing or proposed house of varying grades of construction. It also provides a check against the probable cost of different components of a house and of the various trades or work involved. Cost Services. Recognized cost reporting services are also available to the appraiser. Some include illustrations of typical structures and provide adjustments to tailor the standard example to differently shaped or equipped residences. Some provide adjustment for individual cities of area. Some show cubic foot costs, some square foot, and some are designed for unit-in-place information.
Building Costs Estimates Building cost estimates should include all materials, equipment and labor. The contractor's overhead and profit, architect's fees and other outside professional services, taxes, insurance, administrative and interest on borrowed funds during the period of construction may or may not be included. Some appraisers elect to allocate these costs proportionately across the direct costs; others estimate and report them separately. The difficulty inherent in this procedure is that the reported original cost may not represent a typical cost. It may also be difficult to ascertain which components are included and which are omitted in the reported original figure. Updating a historical cost provides a method of confirming a cost estimate, but it is not a substitute for other methods such as current cost manuals. Capital expenditures for improvements, subsequent to original construction, must also be taken into consideration insofar as they represent additional construction. They also may affect the separate estimate of accrued depreciation. Demonstration of Replacement Cost New (RCN) The following examples used were selected simply to illustrate from a basic standpoint some of the material contained in most cost manuals or Computer Assisted Mass Appraisal (CAMA) Systems and how most manuals or CAMA
Georgia Department of Revenue Revised 6-13-2018
The Cost Approach to Value 50
systems are used in estimating the replacement cost new of residential structures. If the assessor/appraiser understands the basic fundamentals involved in using any cost manual for CAMA system, they should have no trouble in applying this knowledge to the use of another manual or CAMA system.
All cost manuals or CAMA systems have different schedules of costs for different "quality classes" of residences. All homes are not of the same quality, therefore, the same costs per square foot would not apply to all houses; thus, the need for different quality classes. Most cost manuals or CAMA systems have six quality classes: "low quality," "fair quality," "average quality," "good quality," "very good quality" and "excellent quality." Many other cost manuals or CAMA systems may have quality classes in terms of class "A", "B", "C", "D", or "A + 10", "B + 10", and so on. Cost data is usually shown for five types of residences, 1-story, 2-story bi-level, 2-story, 1 1/2 story (with finished 2nd floor), 1 1/2 story (with unfinished 2nd floor) and split level. Also shown is a depreciation schedule which might be established as discussed earlier from sales information. Other sample pages are shown for informational purposes only. The following examples are designed not to make appraisers totally proficient in the use of cost manuals or CAMA systems but to assist them in an understanding of the basic usage of appraisal manuals or CAMA systems. There are five steps involved in arriving at the replacement cost new of a residential structure. These are as follows: 1. Estimate the basic residence cost per square foot of living area by selecting
the appropriate square foot cost. 2. Make additions or deletions from this basic cost per square foot if the type
of "roofing", "floors", "heating", or "insulation" is different from those included in the basic cost per square foot.
3. Multiply this "composite" or total cost per square foot by the number of square feet of "living area" for the subject property to obtain the "Base Cost of the Residence."
4. Add any "Lump Sum Adjustments" which are not included in the base cost
for: (a) Plumbing (c)
Fireplaces (b) Built-in appliances (d)
Miscellaneous
Georgia Department of Revenue Revised 6-13-2018
The Cost Approach to Value 51
5. Add to the above total the cost of any additional features the house may have such as:
(a) Unfinished or finished basements (using cost per square foot of
unfinished or finished basement area). (b) Porches (figures on the cost per sq. foot of porch area). (c) Garages (figures on the cost per sq. ft of garage area). (d) Other variation for attached, detached, or basement garages, and
open carports, etc. (e) Yard improvements (f) Landscaping
Georgia Department of Revenue Revised 6-13-2018
The Cost Approach to Value 52
Elements of a House
1. Footing 2. Reinforcing rod 3. Key way 4. Drain tile 5. Foundation wall 6. Waterproofing 7. Gravel fill 8. Grade line 9. Metal column 10. Areaway wall 11. Basement window 12. Splash block 13. Stoop 14. Sill plate 15. Corner brace 16. Knee brace 17. Bridging 18. Floor joist 19. Beam; girder 20. Sheathing
21. Building paper 22. Trim pilaster 23. Double-hung window 24. Window sill 25. Downspout; leader 26. Bevel siding 27. Fiberboard sheathing 28. Window trim 29. Mullion 30. Rake mold 31. Dormer 32. Valley 33. Gutter 34. Pediment door trim 35. Shutter 36. Finish flooring 37. Stud 38. Roof decking 39. Double top plate 40. Flooring paper
(a) Sheathing size and type of material used (b) Type of siding:
clap board drop siding bevel siding shiplap siding board and batten siding tongued and grooved siding brick veneer stone concrete block other
(c) Windows-quality and type of glass (d) Doors-quality (e) Trim (f) Paint (g) Gutters-copper, aluminum, galvanized (h) Overall materials and workmanship
7. INTERIOR (a) Walls: -plaster on wood or metal lath
drywall (sheetrock) wallpaper way walls are reinforced
(b) Trim-quality of materials and workmanship (c) Stairways-width and clearance
Georgia Department of Revenue Revised 6-13-2018
The Cost Approach to Value 55
balusters and stair rail (d) Built-in features (i.e., kitchen materials, cabinets, counters,
closets, etc.)
8. HEATING (a) steam (b) forced hot air (c) forced hot air with connected air-conditioning (d) heat pump (e) gravity heat (f) floor furnace (g) unit wall heater (h) other
9. PLUMBING
(a) number of fixtures per bath (b) number of baths (c) number of fixtures in kitchen (d) number of fixtures in laundry room (e) adequacy of water heater (f) quality of fixtures mentioned above
10. ELECTRICAL AND LIGHTING
(a) Romex wiring or other (b) Metal conduits (c) Quality of lighting and electrical fixtures (d) Number of outlets per room (e) Adequacy of circuits
Georgia Department of Revenue Revised 6-13-2018
The Cost Approach to Value 56
Residential Field Data Collection Sheet
Georgia Department of Revenue Revised 6-13-2018
The Cost Approach to Value 57
Roof Types Resource
Gable Roof
Cross Gabled Roof
Simple Hip Roof
Pyramid Hip Roof
Cross Hipped Roof
Mansard Roof
Saltbox Roof
Gambrel Roof
Flat Roof
Shed Roof
Georgia Department of Revenue Revised 6-13-2018
The Cost Approach to Value 58
Quality Grade Definitions Example
1 DEFINITIONS OF QUALITY GRADES
EXCELLENT - “A” - 160% Dwellings that generally have an outstanding architectural style and design and thatare constructed with the finest quality materials and workmanship throughout. Superior quality interior finishwith extensive built-in features. Deluxe heating system and high-grade lighting and plumbing fixtures.
Dwellings designed by architects generally fall within this grade classification. Mansion type Dwellings fallwithin the upper limits of the grade ranging from AA to AAA.
GOOD - “B” - 120% Architecturally attractive dwellings constructed with good quality materials andworkmanship throughout. High quality interior finish with abundant built-in features. Custom heating systemand very good lighting and plumbing fixtures.
AVERAGE - “C” - 100% Moderately attractive dwellings constructed with average quality materials andworkmanship throughout and conforming with the base specifications used to develop the pricing schedule.Minimal to moderate architectural treatment. Average quality interior finish with adequate built-in features.
Typical modern day subdivision dwellings that offer a limited number of pre-designed models and featureoptions offered by the developer, as well as multi-family residential complexes, generally fall within this grade classification.
Fair - “D”- 80% Dwellings constructed with economy quality materials and fair workmanship throughout. Void ofArchitectural treatment. Cheap quality interior finish with minimal built-in features. Standard grade mechanical features and fixtures.
Typical low-cost trat-type housing characterized by homogenous styling and design that meets minimalbuilding codes generally falls within this grade classification.
POOR - “E” - 40% Dwellings constructed with very cheap grade materials, (usually “culls” and “seconds”) andvery poor quality workmanship resulting from unskilled, inexperienced, “do-it-yourself” labor. Low-grade mechanical features and fixtures.
The prices that are reflected in the costing schedules should reflect the “C” or 100% Grade standards of qualityand design.
Georgia Department of Revenue Revised 6-13-2018
The Cost Approach to Value 59
Quality Grade Factor Chart
Alpha Numeric Descriptive A+10AAA 360 or 3.60 EXCELLENT(MANSIONS) High
Value Residences A+9(AA) 340 or 3.40 EXCELLENT(MANSIONS) High
Value Residences A+8 (AA) 320 or 3.20 EXCELLENT(MANSIONS) High
Value Residences A+7 (AA) 300 or 3.00 EXCELLENT(MANSIONS) High
Value Residences A+6 (AA) 280 or 2.80 EXCELLENT(MANSIONS) High
Value Residences A+5 (AA) 260 or 2.60 EXCELLENT(MANSIONS) High
Value Residences A+4 (AA) 240 or 2.40 EXCELLENT(MANSIONS) High
Value Residences A+3 220 or 2.20 EXCELLENT(MANSIONS) High
Value Residences A+2 200 or 2.00 EXCELLENT A+1 185 or 1.85 EXCELLENT
A 160 or 1.60 EXCELLENT A-1 145 or 1.45 VERY GOOD A-2 135 or 1.35 VERY GOOD B+2 130 or 1.30 GOOD B+1 125 or 1.25 GOOD
B 120 or 1.20 GOOD B-1 115 or 1.15 GOOD B-2 110 or 1.10 LOW GOOD C+2 110 or 1.10 HIGH AVERAGE C+1 105 or 1.05 AVERAGE
C 100 or 1.00 AVERAGE C-1 90 or .90 AVERAGE C-2 85 or .85 LOW AVERAGE D+2 85 or .85 HIGH FAIR D+1 80 or .80 FAIR
D 75 or .75 FAIR D-1 70 or .70 FAIR D-2 60 or .60 FAIR E+2 55 or .55 POOR E+1 50 or .50 POOR
E 40 or .40 POOR
Georgia Department of Revenue Revised 6-13-2018
The Cost Approach to Value 60
Percentage Completion Guideline Example
20% A residence is generally considered to be at this stage of completion
once the foundation is complete and the walls and roof structure has been framed.
40% A residence reaches this level of completion once the roof and building sheathing is completed and the sub-floor is in place. Also plumbing and electrical rough-in has begun.
60% A residence may be considered to be at this level of completion once the rough-in is complete and insulation is installed. Also windows and exterior doors have been installed. The building may be considered weather tight at this point.
80% A residence is well along at this point of the construction process. The drywall is hung and finished the walls and ceilings have been primed and painted. The plumbing and electrical fixtures may have been installed.
100% The construction is complete all interior finishes have been applied and the building is ready to be occupied.
Georgia Department of Revenue Revised 6-13-2018
The Cost Approach to Value 61
Property Appraisal and Assessment Administration4, for partially completed structures, an accurate estimate of the degree of completion is made and noted on the property record card.
Item Percent of total
Cumulative percent
Cumulative percent complete
Excavation 2 2 Forms set 2 4 Foundation and/or blocks 8 12 Basement floor 2.5 14.5 Joists set 2 16.5 Subfloor 2 18.5 Framed 7 25.5 Sheathed 5 30.5 Roof shingled 4 34.5 Windows set 4 38.5 Siding on 5 43.5 Heating installed 6 49.5 Plumbing roughed in 6 55.5 Wiring roughed in 3 58.5
Insulated 2.5 61 Walls roughed in 2 63 Walls finished 5 68 Interior trim & cabinets 6 74 Door hung 2 76 Wiring finished 3 79 Plumbing fixtures in 3 82 Floors finished 5 87 Finished hardware 1 88 Interior decorating 4 92 Outside painting 3 95 Water and sewer connected
2 97
Exterior concrete work 3 100 Total percent complete
4 International Association of Assessing Officers, 1990, Chicago,
Georgia Department of Revenue Revised 6-13-2018
The Cost Approach to Value 62
Construction in progress Construction in progress shall be appraised in the same manner as other similar real property taking into account that there may be little or no physical deterioration on such property and that the fair market value may be diminished due to the incomplete state of construction. The appraisal staff should attempt to value construction in progress by forecasting the future cash flow a project would generate and discounting at a rate that reflects the risk and uncertainty of that cash flow. If the construction in progress is being financed by a lending institution that has established an account from which funds may be drawn by the builder as construction progresses, the appraisal staff may consider the percentage of such funds expended as of January 1 as a possible indication of percentage completion of construction in progress. In the absence of sufficient information to perform such an analysis, the appraisal staff should estimate the percentage of completion of all construction in progress as of January 1 of the tax year using the best information available. The appraisal staff should then estimate the fair market value of the improvement upon completion. The appraisal staff should then estimate the fair market value as of January 1 as being the estimated fair market value upon completion multiplied by the percentage of completion on January 1. If comparable sales information of real property under construction is generally not available and there is no other specific evidence to measure the probable loss of value if the property is sold in an incomplete state of construction, the appraisal staff may multiply the identified total cost of construction by a uniform market risk factor of .75.
Georgia Department of Revenue Revised 6-13-2018
The Cost Approach to Value 63
The following is an example of how to apply a market risk factor for construction in progress and what assessed values will go on the digest. The appraiser has determined from the CAMA system that an improvement structure’s RCN is $100,000. The improvement structure is 88% complete using the percentage completion guide on Jan 1 of the year the digest is being compiled. The CAMA system has allowed 2% physical depreciation. The land value has been determined to be $35,000. According to the Appraiser procedures Manual and absent any other market data for construction in progress real property what assessed value should be placed on the digest? RCN $100,000 * .02 = $2000 $100,000 - $2000 = $98,000 $98,000 * .88 CIP% Jan 1 = $86,240 $86,240* .75 MKT Risk = $64,680 FMV Structure Land $35,000 Digest Values and Class $64,680 *.40 assessed value = $25,872 R1 $35,000 *.40 assessed value = $14,000 R3
Georgia Department of Revenue Revised 6-13-2018
The Cost Approach to Value 64
CIP Problem In September of the current year, construction of a new residence has begun in a residential subdivision. The appraiser has determined from the CAMA system that an improvement structure’s RCN is $225,000. The property was revisited in December of the current year. According to the reviewing appraiser, the improvement structure is 62% complete using the percentage completion guide on Jan 1 of the year the digest is being compiled. The CAMA system has allowed 1% physical depreciation. The land value has been determined to be $25,000. According to the Appraiser procedures Manual and absent any other market data for construction in progress real property what assessed values and digest class/strata for the land and building should be placed on the digest?
Georgia Department of Revenue Revised 6-13-2018
The Cost Approach to Value 65
Size-Shape Adjustment (Factor) The formula for determining a size-shape ratio is Total Base Area divided by the linear feet (perimeter) around the heated portion of the house. TBA / Perimeter = Size/Shape Ratio (Locate Ratio on Chart below for Size/Shape Factor
Before a size/shape adjustment (factor) can be calculated, the appraiser must know how to find Total Base Area, not the total heated area. TOTAL BASE AREA - The total base area is the ground floor area in the house. If a house has two stories, only the first story area is used. If a house is part one story and part two story, the sum of the ground floor areas from each part is used as TOTAL BASE AREA (TBA). Examples of calculating the TBA can be found below: The TBA in the one story example below on the left would be 20 * 30 or 600 TBA. The TBA in the two story sketch on the right would be calculated as follows:
By locating the ratio of 6 on the table above, a Size Shape Factor of 1.11 should be applied for size/shape adjustment for Fig. 2.
12’
18’ 1St
35’
18’
12’
2St
Two Story House with One Story Section
Fig. 2
35’
2’
22’
16’ 22’
GAR
Georgia Department of Revenue Revised 6-13-2018
The Cost Approach to Value 68
Base Cost Factor Adjustments and Heated Area Calculation Building costs usually differ with story height. Typically with residential construction, it costs less per square foot to build a two story home than a one story home with the equivalent heated (living) area. A cost adjustment factor is typically used to adjust the base cost for story height based on the sketch label. In addition, based on the sketch label, a story height factor is applied to calculate total heated (living) area.
Sketch Labels, Sketch Descriptions, Story Height Cost Adjustment, and Story Height Heated Area Calculation Factors
Label Description StHt Cost Factor StHt Heated Area Factor
1st 1 Story 1.00 1.00 1.50s 1.5 Story .95 1.50 1.75s 1.75 Story .92 1.75 2.0s 2.0 Story .90 2.00 2.50s 2.5 Story .88 2.50
(1 story – Cost 1.00, StHt 1.00); (1.5 story – Cost .95, StHt 1.50); (1.75 story – Cost .92, StHt 1.75); (2.0 story – Cost .90, StHt 2.00);( 2.5 story – Cost .88, StHt 2.5) TBA * Sketch Label’s Story Height Factor = Total Heated (Living) Square Feet 1 Story Sketch Label (1st) 1st 1,500 TBA * 1.0 StHt Factor = 1,500 Total Heated (Living) Area Base Cost $52.35 * Base Cost Factor 1.00 = Adjusted Base Cost for Story Height $52.35 1,500 * $52.35 = $78,525 Total Value before quality, size, and addon adjustments. 1.5 Story Sketch Label (1.5s) 1.5s 1,000 TBA * 1.5 StHt Factor = 1,500 Total Heated (Living) Area Base Cost $52.35 * Base Cost Factor .95 = Adjusted Base Cost for Story Height $49.73 1,500 * $49.73 = $74,595 Total Value before quality, size, and addon adjustments. 2 Story Sketch Label (2st) 2st 750 TBA * 2.0 StHt Factor = 1,500 Total Heated (Living) Area Base Cost $52.35 * Base Cost Factor .90 = Adjusted Base Cost for Story Height $47.12 1,500 * $47.12 = $70,680 Total Value before quality, size, and addon adjustments.
Georgia Department of Revenue Revised 6-13-2018
The Cost Approach to Value 69
Georgia Department of Revenue Revised 6-13-2018
The Cost Approach to Value 70
Estimating Replacement Cost by Square Foot Method from Cost Manual or CAMA System You are using a residential cost manual or CAMA system to estimate the reproduction cost new of a one story, average quality wood siding, ranch-type, single-family residence without a basement, as sketched below.
The cost manual or CAMA system has been tested in the subject market area and has been found to be out of date. The following story height factors apply for this manual or CAMA system. Improvement Labels for Polygons (1 story – Cost 1.00, AreaFactor 1.00); (1.5 story – Cost .95, AreaFactor 1.50); (1.75 story – Cost .92, AreaFactor 1.75); (2.0 story – Cost .90, AreaFactor 2.00);( 2.5 story – Cost .88, AreaFactor 2.5) The base cost stated in the cost manual or CAMA system for a base one story residence with a basement, size shape ratio of 8, and wood siding is $38.93 per square foot (includes 5 base plumbing fixtures). This base cost includes a basement in the amount of $6.28 per square foot. The cost shown for additional plumbing fixtures is $2,000, the cost for electrical wiring is $680, and the cost of a porch is $875. Inasmuch as the costs shown in the manual are base year costs (several years ago) it is necessary to apply a time adjustment factor to these costs to index them up to present day costs. The appropriate time-location factor is 1.41. Because the costs developed in the CAMA manual are based on an area-perimeter ratio of 8, a size-shape adjustment may also have to be applied. The size/shape adjustment factors are as follows:
PROBLEM: Using the above data, estimate the reproduction cost new of the subject residence.
20’
10’ 10’
18’ 20’
29’
29’ 4’ Porch
25’
29’
1 Story
Georgia Department of Revenue Revised 6-13-2018
The Cost Approach to Value 71
Solution: Estimating Reproduction Cost By Square Foot Method From Cost Manual TBA = HEATED AREA OF GROUND FLOOR ONLY 39’*58’ =2,262 Square feet Less 10*20’ = -200 Less 10*18 = -180 Less 29’* 4’ = -116 TBA 1,766 Square feet HEATED AREA OF RESIDENCE TBA * Sketch Label’s Area Factor = Total Heated (Living) Square Feet 39’*58’ =2,262 Square feet Less 10*20’ = -200 Less 10*18 = -180 Less 29’* 4’ = -116 Square feet Total Heated (Living) Area 1,766 Square feet * 1.00 Area Factor PERIMETER OF RESIDENCE 18’+10’+20’+10’+20’+29’+29’+4’+29’+25’=194 Linear feet SIZE-SHAPE RATIO 1,766 Square feet =9.1 rounded to 9 194 linear feet SIZE-SHAPE FACTOR for ratio of 9=0.97 COMPUTATION OF COST
1 Story Cost per square foot for residence with basement
$38.93
Less cost per square foot of basement - 6.28 Cost per square foot of residence without basement
$32.65
1,766 square feet * $32.65 per square foot = $57,660 TBA 1,766 / 194 perimeter = 9.1 or 9 Ratio Modified by size-shape factor: * 0.97 Modified residence cost $55,930 Plus plumbing + 2,000 Plus electric + 680 Plus porch + 875 Subtotal with Addons $59,485 Quality Grade Factor 1.00 Subtotal with grade applied $59,485 Modified by time-location factor * 1.41 Total estimated reproduction cost new $83,874
Georgia Department of Revenue Revised 6-13-2018
The Cost Approach to Value 72
CASE PROBLEMS ** WORKSHEET APPENDIX PAGE 270
Estimating Replacement Cost by Square Foot Method from Cost Manual or CAMA System You are using a residential cost manual to estimate the reproduction cost new of an average quality, brick veneer, ranch-type, single-family residence, as sketched below.
The cost manual or CAMA system has been tested in the subject market area and has been found to be accurate. The following story height factors apply for this manual or CAMA system. Improvement Labels for Polygons (1 story – Cost 1.00, AreaFactor 1.00); (1.5 story – Cost .95, AreaFactor 1.50); (1.75 story – Cost .92, AreaFactor 1.75); (2.0 story – Cost .90, AreaFactor 2.00);( 2.5 story – Cost .88, AreaFactor 2.5) The cost stated in the cost manual or CAMA system for a base one story residence with a size shape ratio of 8 and wood siding is $48.97 per square foot (includes 5 base plumbing fixtures). The cost for brick veneer is 8% higher. Other costs shown for a base house; the plumbing is $4,000, the cost for electrical wiring is $1,680, the cost a heat pump is $2.28 per square foot, the cost for a wood deck is $15 per square foot, the cost of a porch is $27.55 per square foot, the cost for a brick veneer utility is $45 per square foot, the cost for a brick veneer garage is $39.79 per square foot. Because the costs developed in the CAMA manual are based on an area-perimeter ratio of 8, a size-shape adjustment may also have to be applied. The size-shape adjustment factors are as follows:
PROBLEM: Using the above data and the following worksheet, estimate the
24’
10’ 10’
62’
32’
34’ Porch
22’ 1 Story
Deck
6’
Garage
Utility
20’
4’
28’
Georgia Department of Revenue Revised 6-13-2018
The Cost Approach to Value 73
reproduction cost new of the subject residence. Calculation Worksheet: TBA = HEATED AREA OF GROUND FLOOR ONLY HEATED AREA OF RESIDENCE TBA * Sketch Label’s Area Factor = Total Heated (Living) Square Feet PERIMETER OF RESIDENCE (Heated Area Only) SIZE-SHAPE RATIO SIZE-SHAPE FACTOR COMPUTATION OF COST
Base Cost per square foot for residence $ Exterior Wall Siding Factor Adjustment * Adjusted Price Per Square Foot $ (Story Height) Cost Factor * Adjusted Price Per Square Foot
*
Adjusted Price Per Square Foot $ heated square feet * $ per square foot =
$
TBA / perimeter = or Ratio Modified by size-shape factor * Modified residence cost $ Plus plumbing + Plus electric + Plus heat pump + Wood deck + Plus porch + Plus utility + Plus garage + Subtotal with Addons $ Quality Grade Adjustment * Total estimated reproduction cost new $
Georgia Department of Revenue Revised 6-13-2018
The Cost Approach to Value 74
CASE PROBLEMS ** WORKSHEET APPENDIX PAGE 272
Estimating Replacement Cost by Square Foot Method from Cost Manual or CAMA System You are using a residential cost manual to estimate the reproduction cost new of a 1.5 story brick veneer, ranch-type, single-family residence, as sketched below.
The cost manual or CAMA system has been tested in the subject market area and has been found to be accurate. Based on your opinion, use the numeric column on the quality grade chart on page 58 to adjust for quality of materials. The following story height factors apply for this manual or CAMA system. Improvement Labels for Polygons (1 story – Cost 1.00, AreaFactor 1.00); (1.5 story – Cost .95, AreaFactor 1.50); (1.75 story – Cost .92, AreaFactor 1.75); (2.0 story – Cost .90, AreaFactor 2.00);( 2.5 story – Cost .88, AreaFactor 2.5) The cost stated in the cost manual or CAMA system for a base one story residence with a size shape ratio of 8 and wood siding is $48.93 per square foot (includes 5 base plumbing fixtures). Other costs shown for a base house; the plumbing is $6,000, the cost for electrical wiring is $2,280, the cost for a heat pump is $3.25 per square foot, the cost for a Brick Veneer Garage is $40 per square foot, the cost for a Wood Deck is $15 per square foot, and the cost of a porch is $27.55 per square foot. In addition, the cost applied to the heated area is 8% higher for Brick Veneer. Inasmuch as the costs developed in the CAMA manual are base costs for typical neighborhoods, it is necessary to apply a location/neighborhood factor to the structure since it located in a gated community in Briarwood Subdivision. The appropriate location/neighborhood factor is 1.15.
50’
50’
15’
24’
44’
15’
44’ 1.5 Story
Garage 24’
6’ Porch
Deck 8’
12’
Georgia Department of Revenue Revised 6-13-2018
The Cost Approach to Value 75
Because the costs shown are based on an area-perimeter ratio of 8, a size-shape adjustment may also have to be applied. The size-shape adjustment factors are as follows:
PROBLEM: Using the above data, estimate the reproduction cost new of the subject residence.
Georgia Department of Revenue Revised 6-13-2018
The Cost Approach to Value 76
Georgia Department of Revenue Revised 6-13-2018
The Cost Approach to Value 77
Calculation Worksheet: TBA = HEATED AREA OF GROUND FLOOR ONLY HEATED AREA OF RESIDENCE TBA * Sketch Label’s Area Factor = Total Heated (Living) Square Feet PERIMETER OF RESIDENCE SIZE-SHAPE RATIO SIZE-SHAPE FACTOR COMPUTATION OF COST
Base Cost per square foot for residence $ Exterior Wall Siding Factor Adjustment * . Adjusted Price Per Square Foot $ (Story Height) Cost Factor * Adjusted Price Per Square Foot
*
Adjusted Price Per Square Foot $ heated square feet * $ per square foot =
$
TBA / perimeter = Ratio Modified by size-shape factor * . Modified residence cost $ Plus plumbing + $ Plus electric + $ Plus heat pump + $ Plus porch + $ Plus deck + $ Plus garage + $ Subtotal With Addons $ Quality Grade Adjustment . Total estimated reproduction cost new $ Neighborhood/Location Market Adjustment Market Value of Structure $
Georgia Department of Revenue Revised 6-13-2018
The Cost Approach to Value 78
Estimating Replacement Cost by Square Foot Method from Cost Manual or CAMA System ** WORKSHEET APPENDIX PAGE 274 You are using a residential cost manual to estimate the reproduction cost new of a 1.75 story plus bonus recreation room, vinyl siding, ranch-type, single-family residence, as sketched below.
The cost manual or CAMA system has been tested in the subject market area and has been found to be accurate. Based on your opinion, use the numeric column on the quality grade chart on page 58 to adjust for quality of materials. The following story height factors apply for this manual or CAMA system. Improvement Labels for Polygons (1 story – Cost 1.00, AreaFactor 1.00); (1.5 story – Cost .95, AreaFactor 1.50); (1.75 story – Cost .92, AreaFactor 1.75); (2.0 story – Cost .90, AreaFactor 2.00);( 2.5 story – Cost .88, AreaFactor 2.5) The cost stated in the cost manual or CAMA system for a base one story residence with a size shape ratio of 8 and wood siding is $53.45 per square foot (includes 5 base plumbing fixtures). Vinyl siding typically costs 1% more than standard wood siding. Other costs shown for a base house; the cost for additional plumbing fixtures is $1,350 per fixture. The subject house has six additional bath (plumbing) fixtures other than a base house, the cost for electrical wiring is $2,980, the cost for a heat pump is $3.10 per square foot, the cost for a Vinyl Garage is $31 per square foot, the cost for a Wood Deck is $12.95 per square foot, and the cost of a porch is $29.97 per square foot. Based on your opinion, use the numeric column on the quality grade chart on page 48 to adjust for quality of materials. In addition, the cost applied to a bonus room area is $6.39 unfinished plus $15 per square foot
60’
60’
26’ 26’ 48’
24’
48’
1.75 Story plus 8 x 60 bonus room with recreation room finish
Garage
24’
6’ Porch
Deck 14’ 42’
11’
11’
Georgia Department of Revenue Revised 6-13-2018
The Cost Approach to Value 79
for recreation room interior finish. (Note: Since the bonus room has recreation room finish and not of the quality of the rest of the house, the area should be added with the overall square footage to the calculation for the heat pump only.) Because the costs developed in the CAMA manual are based on an area-perimeter ratio of 8, a size-shape adjustment may also have to be applied. The size-shape adjustment factors are as follows:
PROBLEM: Using the above data, estimate the reproduction cost new of the subject residence.
Georgia Department of Revenue Revised 6-13-2018
The Cost Approach to Value 80
Calculation Worksheet: TBA = HEATED AREA OF GROUND FLOOR ONLY HEATED AREA OF RESIDENCE TBA * Sketch Label’s Area Factor = Total Heated (Living) Square Feet PERIMETER OF RESIDENCE SIZE-SHAPE RATIO SIZE-SHAPE FACTOR COMPUTATION OF COST
Base cost per square foot for residence $ Exterior Wall Siding Factor Adjustment * . Adjusted Price Per Square Foot $ (Story Height) Cost Factor * Adjusted Price Per Square Foot
*.
Adjusted Price Per Square Foot $ square feet * $ per square foot = (Bonus room area should be included for calculation of heat pump only)
$
TBA / perimeter = or Ratio Modified by size-shape factor * . Modified residence cost $ Bonus Room Cost $ Plus plumbing + $ Plus electric + $ Plus heat pump + $ Plus porch + $ Plus deck + $ Plus garage + $ Subtotal with addons $ Quality Grade Adjustment * . Total estimated reproduction cost new $
Georgia Department of Revenue Revised 6-13-2018
The Cost Approach to Value 81
Estimating Replacement Cost by Square Foot Method from Cost Manual or CAMA System ** WORKSHEET APPENDIX PAGE 276 You are using a residential cost manual to estimate the reproduction cost new of a 1.5 story wood siding, ranch-type, single-family residence, as sketched below.
The cost manual or CAMA system has been tested in the subject market area and has been found to be accurate. Based on your opinion, use the numeric column on the quality grade chart on page 58 to adjust for quality of materials. The following story height factors apply for this manual or CAMA system. Improvement Labels for Polygons (1 story – Cost 1.00, AreaFactor 1.00); (1.5 story – Cost .95, AreaFactor 1.50); (1.75 story – Cost .92, AreaFactor 1.75); (2.0 story – Cost .90, AreaFactor 2.00);( 2.5 story – Cost .88, AreaFactor 2.5) The cost stated in the cost manual or CAMA system for a base one story residence with a size shape ratio of 8 and wood siding is $48.93 per square foot (includes 5 base plumbing fixtures). Other costs shown for a base house; the cost for plumbing fixtures is $1,200 per fixture, the subject house has five additional bath fixtures, the cost for electrical wiring is $2,280, the cost for a heat pump is $3.25 per square foot, the cost for a garage is $28.51 per square foot, and the cost of a porch is $27.55 per square foot. Inasmuch as the costs shown in the manual are base costs for typical neighborhoods, it is necessary to apply a location/neighborhood factor to the structure since it located in a gated community in Briarwood Subdivision. The appropriate location/neighborhood factor is 1.15. Because the costs developed in the CAMA manual are based on an area-perimeter ratio of 8, a size-shape adjustment may also have to be applied. The size-shape adjustment factors are as follows:
PROBLEM: Using the above data, estimate the reproduction cost new of the subject residence.
Georgia Department of Revenue Revised 6-13-2018
The Cost Approach to Value 83
Calculation Worksheet: AREA OF RESIDENCE TBA * Sketch Label’s Area Factor = Total Heated Square Feet PERIMETER OF RESIDENCE SIZE-SHAPE RATIO SIZE-SHAPE FACTOR COMPUTATION OF COST
1 Story Sections Base cost per square foot for residence $ Exterior Wall Siding Factor Adjustment * Adjusted Price Per Square Foot $ square feet * $ per square foot =
$
1.5 Story Section Base cost per square foot for residence $ Exterior Wall Siding Factor Adjustment * Adjusted Price Per Square Foot $ (Story Height) Cost Factor * Adjusted Price Per Square Foot
*
Adjusted Price Per Square Foot $ square feet * $ per square foot =
$
1 Story Sections Value + 1.5 Story Section Value
$
Modified by size-shape factor * Modified residence cost $ Plus plumbing + Plus electric + Plus heat pump + Plus porch + Plus garage + Subtotal with addons $ Quality Grade Adjustment * Total estimated reproduction cost new $ Neighborhood/Location Market Adjustment . Market Value of Structure $
Georgia Department of Revenue Revised 6-13-2018
The Cost Approach to Value 84
Residential Calculation Case Study
34
52 18 6
27
34
Base Cost $68.09 (Includes 5 plumbing fixtures) 1 Additional Fixture @ $450 1 Rough in @ $230 Forced Hot and Cool Air @ $2 per sq ft Hard wood Floors @ $3 per Sq Ft Fireplace @ $2000 Open Porch @ $10 per sq ft SSRatio 4 5 6 7 8 9 10 11 12 13 14 Factor 1.32 1.19 1.11 1.04 1.00 0.97 0.94 0.92 0.90 0.89 0.87 Note: Each Form of Depreciation should be calculated from RCN Physical Depreciation @ 2% Functional Obsolescence @ 1% Location/Neighborhood Modifier for structure being on Lake of 20% Land Value 40,000 (lake front lot) What is FMV of PROPERTY?
OP
Georgia Department of Revenue Revised 6-13-2018
The Cost Approach to Value 85
UNIT IN PLACE REPLACEMENT COSTS These tennis courts and the surrounding area are concrete surfaced. The actual courts are painted. The complex is surrounded by a twelve-foot-high fence and contains as fixtures six net posts, four benches, and six light fixtures for night play.
Item Cost from manual Concrete $0.75 per square foot Painting $0.20 per square foot Fence $4.00 per linear foot Net Posts $80.00 each, installed Benches $200.00 each, installed Light Fixtures $500.00 each, installed
PROBLEM Using the above information: What is the replacement cost for these improvements?
200’
140’
31’
96’
Georgia Department of Revenue Revised 6-13-2018
The Cost Approach to Value 86
Paired Sales Analysis
Consider the following sales data: 1. All sales took place last month. 2. All properties are single-family three-bedroom houses. 3. Sales 1, 2, and 3 properties have the same significant attributes including
a single car garage except that sale 1 has a finished basement and the others do not.
4. Sales 4, 5, 6, and 7 have the same significant attributes including a double car garage except that sale 4 has a finished basement and the others do not.
What lump-sum dollar amount does a finished basement contribute to the value of a single-family house in the market represented by these properties?
Sale No. Sale Price 1 $72,800 2 $70,000 3 $70,100 4 $75,800 5 $73,000 6 $73,050 7 $73,100
Georgia Department of Revenue Revised 6-13-2018
The Cost Approach to Value 87
Commercial Structure Valuation Most counties in the state of Georgia lack the necessary sales activity to develop commercial/industrial schedules via market analysis. Thus, the emphasis is on the cost approach. However, if substantial market or income data is available, the values in the schedules should be confirmed and adjusted accordingly. Cost data, such as, base dollars per square foot, dollar per square foot adjustments for structural elements, extra feature values, etc. should be obtained from reliable sources. Sources considered as reliable would be contractors and/or nationally recognized and accepted cost manuals. Data found in manuals must be localized and adjusted for current time. Any and all schedule values are the responsibility of the county. The creation of the values and subsequent schedules should be supported with proper documentation. Note: Most CAMA Commercial Improvement schedules can be set up to use either the Segregated Cost Method or Calculator Cost Method of valuing Commercial Improvements, depending upon the preference of the appraiser. The Appraiser should develop an understanding of the CAMA system’s valuation process for commercial / industrial buildings and should facilitate the generation of the schedules for this property type.
Construction Types Commercial buildings are usually divided into five basic cost groups by type of framing (supporting columns and beams), walls, floors and roof structures, and fireproofing. 1-Heavy Structural Steel 2-Reinforced Concrete 3-Masonry or Load Bearing Walls 4-Wood/Steel Combustible 5-Prefab Structural Steel
Georgia Department of Revenue Revised 6-13-2018
The Cost Approach to Value 88
Construction Type 1 These building types have fireproofed steel frames that support all floor and roof loads. Walls, floors, and roofs are built of noncombustible materials.
Georgia Department of Revenue Revised 6-13-2018
The Cost Approach to Value 89
Construction Type 2 These building types have fireproofed, reinforced concrete frames that support all floor and roof loads or masonry floors and roofs. Walls, floors, and roofs are built of noncombustible materials.
Construction Type 3 These building types have exterior walls of noncombustible materials such as masonry or concrete that may be load bearing or non load bearing. Interior partitions and roof structures are built of combustible materials. Floors may be concrete or wood frame.
Georgia Department of Revenue Revised 6-13-2018
The Cost Approach to Value 90
Construction Type 4 These building types generally have wood exterior walls or wood and steel frame in bearing walls such as Masonry Veneer, etc.
Construction Type 5 These building types are specialized and do not fit in the other four categories. Such buildings may include pre-engineered metal buildings.
Georgia Department of Revenue Revised 6-13-2018
The Cost Approach to Value 91
Building Types Building Types categorize Commercial Improvements based on similarities in Construction Type and other components, such as Area / Perimeter and Wall Height. A Building Type is a homogeneous group of commercial buildings that will have the same pricing/adjustments for these additional items. The commercial buildings in these types do not have to be of the same use as long as the costs for the Commercial Structural Elements, such as heating and air conditioning, are similar. The cost for the Commercial Structural Elements may vary between different types of buildings. Consequently, each group of similar buildings must have a unique code for that type of building. These codes may be any 3 digit code that usually ties structural components back to the commercial base cost schedule. Below is a suggested Building Type categorization. Once the Building Types are defined the county can set up the Commercial Base Schedule, the Commercial Structural Components Schedule, and other Commercial Improvement Schedules to price Commercial Improvements correctly.
Building Type Category Examples 001 - Apartments, Hotels 002 - Multiple Family, Motels 003 - Stores and Standard Commercials 004 - Garages, Industrials, Warehouses 005 - Offices and Public Buildings 006 - Churches 008 - Schools
Structural Element Categories Structural Elements are types of Structural Components, such as "Ceiling Finish", “Heat / AC” or "Floor Construction". These may add a square foot cost to the building if using segregated costing method or they may just be used for descriptive purposes if using calculator costing method. Structural Elements are usually preset in most CAMA systems and cannot be changed by the appraiser. Most CAMA system will allow for each structural element to be adjusted for quality. Following is a list of the twelve Structural Elements:
Ceiling Interior Wall Wiring Lighting Exterior Wall Floor Finish Roof Cover Floor Construction Wall Frame Roof Frame Foundation Heat / AC
Georgia Department of Revenue Revised 6-13-2018
The Cost Approach to Value 92
Structural Element Components Each component may carry a zero value if using calculator costing method. However, if using segregated costing method, each would have a square foot price for each quality class.
Georgia Department of Revenue Revised 6-13-2018
The Cost Approach to Value 93
Use Types (BuiltAs / UsedAs Codes) Within each Building Type, subtypes should be defined based on the use for which the structure was designed. These Subtypes are usually referred to as BuiltAs or UsedAs codes and are identified by an alpha or numeric code. In addition, the BuiltAs code refers to the original use the structure and is used for determining an improvement’s life expectancy and in calculating the depreciation of the improvement. The UsedAs code would define the current use of the building. Generally, this is where the base cost for the structure is keyed in CAMA systems.
Georgia Department of Revenue Revised 6-13-2018
The Cost Approach to Value 94
Wall Height Tables The Wall Height Table contains cost factors, or multipliers, that allow for adjustments based on the height of the walls of a Commercial Improvement. These multipliers are distinguished by Building Type.
Georgia Department of Revenue Revised 6-13-2018
The Cost Approach to Value 95
Area Perimeter Tables The Area / Perimeter Tables contain cost factors, or multipliers, that adjust the cost of a Commercial Improvement for shape. These multipliers are distinguished by Building Type. A/P Ratio: The Area/Perimeter Ratio is the ratio of the area of the Commercial Improvement to the perimeter of the Commercial Improvement. For example, a Commercial Improvement has 10,000 square feet and a Perimeter of 400. The Area is divided by the Perimeter, in this example 10000 / 400, giving an Area / Perimeter Ratio (also called the Argument) of 25. Thus, 25 would be keyed in the Area / Perimeter field on the Area / Perimeter Table Form.
Georgia Department of Revenue Revised 6-13-2018
The Cost Approach to Value 96
Extra Features Tables Extra Features are items that are attached to or part of a Commercial Improvement but are not considered in the Base Cost. For example, a canopy, sprinkler system, overhead door, or loading dock would all be considered to be Extra Features. The lump sum or square foot method may be used for such items. However, if using the calculator costing method, some of these costs could already be included in the base cost..
Georgia Department of Revenue Revised 6-13-2018
The Cost Approach to Value 97
Commercial Extra Features Rank Table The Commercial Rank Table contains cost factors, or multipliers, that allow for adjustments to extra feature values based on the quality class of any commercial extra feature relative to the improvements grade.
Commercial Story Height Adjustments Multistory Buildings should be adjusted for each story, over three, above ground, to all base costs.
Georgia Department of Revenue Revised 6-13-2018
The Cost Approach to Value 98
Commercial Quality Grade Within each of the five basic cost groups by type of framing (supporting columns and beams), walls, floors and roof structures, and fireproofing, the appraiser should apply quality grade as compared to the standard for each group. Below is a grade range used by most CAMA systems.
Excellent 160± A Good 120± B
Average 100± C Low Cost 80± D
Cheap 60± E
Commercial Field Data Collection Sheet The appraiser should develop and use a field data collection sheet designed for the county’s specific CAMA system in order to consistently and uniformly gather data in the field. See example of a commercial/industrial field data sheet on the next page.
Georgia Department of Revenue Revised 6-13-2018
The Cost Approach to Value 99
Commercial Field Data Collection Sheet
Georgia Department of Revenue Revised 6-13-2018
The Cost Approach to Value 100
Georgia Department of Revenue Revised 6-13-2018
The Cost Approach to Value 101
Commercial Cost Built-As Used-As Tables The use of the cost figures present on these pages is for classroom purposes only. Any use outside of the classroom will result in erroneous values.
Georgia Department of Revenue Revised 6-13-2018
The Cost Approach to Value 102
The use of the cost figures present on these pages is for classroom purposes only. Any use outside of the classroom will result in erroneous values.
Georgia Department of Revenue Revised 6-13-2018
The Cost Approach to Value 103
The use of the cost figures present on these pages is for classroom purposes only. Any use outside of the classroom will result in erroneous values.
Georgia Department of Revenue Revised 6-13-2018
The Cost Approach to Value 104
The use of the cost figures present on these pages is for classroom purposes only. Any use outside of the classroom will result in erroneous values.
Georgia Department of Revenue Revised 6-13-2018
The Cost Approach to Value 105
The use of the cost figures present on these pages is for classroom purposes only. Any use outside of the classroom will result in erroneous values.
Georgia Department of Revenue Revised 6-13-2018
The Cost Approach to Value 106
Commercial Wall Height Tables
Georgia Department of Revenue Revised 6-13-2018
The Cost Approach to Value 107
Commercial Wall Height Tables
Georgia Department of Revenue Revised 6-13-2018
The Cost Approach to Value 108
Commercial Area/Perimeter Tables
Georgia Department of Revenue Revised 6-13-2018
The Cost Approach to Value 109
Commercial Area/Perimeter Tables
Georgia Department of Revenue Revised 6-13-2018
The Cost Approach to Value 110
Commercial $Adds
Georgia Department of Revenue Revised 6-13-2018
The Cost Approach to Value 111
Commercial $ADDS
Georgia Department of Revenue Revised 6-13-2018
The Cost Approach to Value 112
Commercial Drawing Labels
Georgia Department of Revenue Revised 6-13-2018
The Cost Approach to Value 113
Pricing Commercial Structures
1 Story Medical Office Building (Use Code 9164) Vinyl Exterior on Wood Frame Wall Height 12’ Central Heating & AC (qc3) Typical Plumbing Fixtures Ceramic Tile Flooring (qc3) Canopy included in base cost What is the value of the Structure?
Built-as code/Description 9164 – Medical Office Bldg Used-as code/Description 9164 – Medical Office Bldg Base Cost $112.25 Construction (framing) factor adjustment *.94 (Story Height) Cost Factor * Adjusted Price Per Square Foot
*1.00
Adjusted Price Per Square Foot $105.52 TBA 4,796 * 105.52 per square foot = $506,074 TBA 4,796 / 306 perimeter = 15.67 or 16 Ratio Modified by area perimeter factor * 1.00 Wall height = 12’ and factor = * 1.04 Modified building cost $526,317 TBA 4,796 * 1.00 STHT Factor = Heated Area = 4,796
Plus heating type - Heated Area 4,796 * 3.78 =
+ $ 18,128
Plus flooring type – Heated Area 4,796 * 7.22 = + $ 34,627 Subtotal $579,072 Quality Grade Adjustment *1.00 Total estimated reproduction cost new $579,072 Fair Market Value of Structure $579,072
44
72 28 8
37
44
Canopy
ST1 81
Georgia Department of Revenue Revised 6-13-2018
The Cost Approach to Value 114
Pricing Commercial Structures
5 Story Office Building (Use Code 9149) Brick on Concrete Block Frame Wall Height 11’ Central Heating & AC (qc3) Typical Plumbing Fixtures Carpet & Vinyl Tile Flooring (qc3) What is the value of the Structure?
Built-as code/Description Used-as code/Description Base Cost Construction (framing) factor adjustment (Story Height) Cost Factor * Adjusted Price Per Square Foot
Adjusted Price Per Square Foot TBA * $ = TBA / perimeter = or Ratio Modified by area perimeter factor * Wall height = ’ and factor = * Modified building cost $ TBA * STHT Factor = Heated Area Plus heating type - Heated Area * = + $ Plus flooring type – Heated Area * = + $ Subtotal $ Quality Grade Adjustment * Total estimated reproduction cost new $
44
36
44
ST5 36
Georgia Department of Revenue Revised 6-13-2018
The Cost Approach to Value 115
Pricing Commercial Structures
1 Story McDonalds Restaurant (Use Code 9040) Brick on Concrete Block Frame Wall Height 12’ Central Heating & AC (qc3) Good Plumbing Fixtures with tiled walls Ceramic Tile Flooring (qc3) What is the value of the Structure?
Built-as code/Description Used-as code/Description Base Cost Construction (framing) factor adjustment (Story Height) Cost Factor * Adjusted Price Per Square Foot
Adjusted Price Per Square Foot TBA * $ = TBA / perimeter = or Ratio Modified by area perimeter factor * Wall height = ’ and factor = * Modified building cost $ TBA * STHT Factor = Heated Area = Plus heating type - Heated Area * = + $ Plus flooring type – Heated Area * = + $ Subtotal $ Quality Grade Adjustment * Total estimated reproduction cost new $
45
109
45
ST1
109
Canopy
Georgia Department of Revenue Revised 6-13-2018
The Cost Approach to Value 116
Pricing Commercial Structures
1 Story Mini Warehouse (Use Code 9117) Galvanized Metal Exterior Wall with Steel Framing Wall Height 7’ Climate Controlled Central Heating & AC (qc3) Concrete Flooring (qc3) What is the value of the Structure?
Built-as code/Description Used-as code/Description Base Cost Construction (framing) factor adjustment (Story Height) Cost Factor * Adjusted Price Per Square Foot
Adjusted Price Per Square Foot TBA * $ = TBA / perimeter = or Ratio Modified by area perimeter factor * Wall height = ’ and factor = * Modified building cost $ TBA * STHT Factor = Heated Area Plus heating type - Heated Area * = + $ Plus flooring type – Heated Area * = + $ Subtotal $ Quality Grade Adjustment * Total estimated reproduction cost new $
50 50
200
ST1
200
Georgia Department of Revenue Revised 6-13-2018
The Cost Approach to Value 117
Chapter 3
Estimating Accrued Deprecation
Georgia Department of Revenue Revised 6-13-2018
The Cost Approach to Value 118
Estimating Accrued Depreciation Estimation of accrued depreciation is the third essential step of the cost approach and probably the most difficult. To estimate it properly, it is helpful to understand the nature, components and theory of depreciation.
Formally, it has been defined as:
A loss of utility and hence value from any cause. An effect caused by deterioration and/or obsolescence. Deterioration is evidenced by wear and tear, decay, dry rot, cracks, encrustation, or structural defects. Obsolescence is divisible into two parts, functional and economic. Functional obsolescence is due to a design deficiency, such as mechanical inadequacy or superadequacy, functional inadequacy or superadequacy due to size, style, or age. It is evidenced by conditions within the property. Economic obsolescence is caused by changes external to the property.
Only improvements are subject to accrued depreciation, which is derived from causes both within the property (physical deterioration and functional obsolescence) and without (economic or environmental obsolescence). By definition it is the measure of the difference between the cost to reproduce or replace all the improvements on the date of the appraisal and their value as of that date. Depreciation begins to accrue upon construction of the improvements; they immediately begin to age physically and to suffer from functional obsolescence caused by their design. Negative environmental forces cause immediate economic obsolescence. When the improvements are constructed, their economic life begins. During this period, they should contribute value to the property. If they are the "perfect improvement," the amount of value they contribute would be their total cost. Since few, if any, perfect improvements are constructed, a difference exists between their total cost and their value, which represents some form of depreciation. At the point when an improvement cannot be profitably utilized, or when it no longer contributes to the value of the property, it is at the end of its economic life and depreciation has reached 100%. Replacement cost may be used instead of reproduction cost in the cost approach but the distinction between these two terms must be clearly understood. The use of replacement cost in lieu of reproduction cost does not change the principle of estimating physical deterioration. However, some calculations may be eliminated in estimates of certain types of functional obsolescence often encountered in outdated structures. Consequently, accrued depreciation for an outdated building
Georgia Department of Revenue Revised 6-13-2018
The Cost Approach to Value 119
is frequently estimated in relation to the estimated replacement cost of a more modern structure rather than to the reproduction cost of a building identical in all respects to the original. In eminent domain appraising the use of reproduction cost is sometimes preferable, avoiding the necessity to explain the rationale of replacement cost.
Definition of Terms
Total Economic life is the period over which an improvement may be profitably utilized. It is the total period of time that the improvements contribute value to the property. As soon as the site alone is worth as much as the site and the improvements combined, the improvements have reached the end of their economic life. Actual Age is the chronological age of the improvements, ie: if an improvement were built in 1987 its actual age in 1992 would be five years. Actual age may differ from effective age due to inferior or superior care and maintenance. Effective age is how old the improvement appears to be, based on observation, considering its condition, design and the economic forces that affect its value. To paraphrase an old saying, "If it has the physical condition and design of a 13-year-old improvement and market conditions affect it as if it were a 13-year-old improvement, then for appraisal purposes it should be treated as a 13-year-old improvement (effective age: 13 years), even if it is 10 or 20 years old." The actual (chronological) age of the improvement should be noted in the appraisal. If is frequently used for mass appraisal purposes. Generally, if the improvement is of typical condition and design and conforms to the other improvements in an area that is not subject to unusual economic influences, its effective age and chronological age will be about the same. If the improvement has had better than average maintenance, rehabilitation or modernization, its effective age probably will be less than its actual (chronological) age. If it is in poorer condition than typical improvements of the same age or has not been modernized or rehabilitated as other similar improvements in the area, or if some offsite economic (environmental) factor is negatively affecting the value, the effective age will be greater than the (actual) chronological age. Remaining economic life (R.E.L.) is the period of time from the date of the appraisal to the end of the improvements economic life. It is that period of time the improvement will continue to contribute value to the property. This is the period the appraiser attempts to estimate. The assumption should not always be that the property will continue to deteriorate at its present rate. Often rehabilitation, modernization or remodeling will extend the life of the property; lack of normal
Georgia Department of Revenue Revised 6-13-2018
The Cost Approach to Value 120
maintenance will shorten the economic life. Changing economic conditions and public tastes will also affect the remaining economic life. The estimate must be based on the assumption there will be no significant changes in the improvement or area, and recognize that any changes may extend or shorten the remaining economic life. The relationships between effective age, remaining economic life and total economic life are shown in Fig. 1.
Georgia Department of Revenue Revised 6-13-2018
The Cost Approach to Value 121
Life Span of a House
Georgia Department of Revenue Revised 6-13-2018
The Cost Approach to Value 122
Techniques of Estimating Depreciation Accrued depreciation may be estimated directly through observation and analysis of the components of depreciation affecting the property or through use of a formula based on physical or economic age-life factors. It may also be estimated indirectly by use of the income or market data approaches.
There are five methods used by appraisers to measure depreciation: 1. Age/Life - may use straight line or depreciation tables 2. Modified age/life 3. Engineering breakdown 4. Observed condition - most detailed 5. Sales comparison approach - calculated from market Estimating depreciation by market comparison (paired sales) and capitalization of rent loss may also be employed by the appraiser.
Age-Life Method This method of estimating depreciation is based primarily upon observation. The basis is that the percentage effective age is of the typical economic life is the same percentage the accumulated depreciation is of total reproduction cost. Both of these are as of the date of the appraisal. This concept can be stated as a formula:
nomicLifeTypicalEco
geEffectiveA
An example of this formula is as follows:
nomicLifeTypicalEcoYears
geEffectiveAYears
50
10=20% Depreciation
The formula can also be expressed as follows:
nomicLifeTypicalEco
geEffectiveA= % Depreciation of Reproduction Cost
The age-life method can be used to estimate either depreciation from all causes or a single form of depreciation. Care must be taken to define clearly in the appraisal what is being estimated. The following examples show how the
Georgia Department of Revenue Revised 6-13-2018
The Cost Approach to Value 123
estimates are made. A house has an estimated typical economic life of 50 years. Its chronological age is 20 years. Its effective age, based on its condition, design, and environment, is 25 years because it is in poor condition and is located near a gasoline service station.
nomicLifeTypicalEcoYears
geEffectiveAYears
50
25= .50 or 50% depreciated
Another house in the same neighborhood also has an estimated typical economic life of 50 years. Its chronological age is also 20 years. Its effective age, based on its condition, design and environment, is 20 years because it is in average condition and there are no unusual adverse environmental influences.
nomicLifeTypicalEcoYears
geEffectiveAYears
50
20= .40 or 40% depreciated
Still another house in the same neighborhood has an estimated economic life of 60 years. This longer economic life is forecast because it is of superior design and construction. Its chronological age is 20 years. Its effective age, based on its superior construction, modernization and lack of negative environmental influences, is 12 years.
nomicLifeTypicalEcoYears
geEffectiveAYears
60
12= .20 or 20% depreciated
These examples show how three houses in the same neighborhood, all the same chronological age, can suffer from substantially different amounts of depreciation. All of these estimates considered the effect of all three forms of depreciation. When the estimate of effective age considers only one form of depreciation--say, physical deterioration--then the result is the amount of depreciation caused by physical deterioration. For example, a house has an estimated typical physical life of 75 years. The effective age, based only on the physical condition of the house, is 25 years.
nomicLifeTypicalEcoYears
geEffectiveAYears
75
25= .333 or 33.3% physically depreciated
The age-life method is an easy-to-understand, simple-to-use method based primarily upon the appraiser's observations, research and judgment. Therefore,
Georgia Department of Revenue Revised 6-13-2018
The Cost Approach to Value 124
its accuracy is dependent heavily upon the appraiser's knowledge and experience. It is an effective way to estimate the depreciation accumulated to the date of the appraisal but has proved to be a very poor way to estimate the rate of depreciation the property will suffer in the future.
For example, if by the age-life method it is estimated that a 25-year old residence has depreciated at the rate of 2% per year and is now 50% depreciated, it is incorrect to say that the remaining economic life is 25 years. This will only be true if:
1. The present rate of depreciation continues into the future on a straight line basis.
2. There are no changes in the forces that affect the value of the property.
3. There is no modernization, rehabilitation or remodeling. 4. The property is "normally" maintained through its remaining
economic life.
A forecast that is based on a series of a series of assumptions that most likely will not all be true serves a limited purpose. This kind of forecast has been misused by lenders to limit the term of mortgages. If an estimate of remaining economic life is required, it must be made considering all the above factors and qualified to recognize that any changes may extend or shorten the remaining economic life. Formulas for Calculating Depreciation Using Age-Life Method 1. effective age / total economic life = age-life ratio 2. cost new of the building x age-life ratio = accrued depreciation 3. cost new of the building - accrued depreciation = depreciated value of the
building
The Observed Condition Method The observed condition method is accomplished by dividing depreciation into its three separate components: physical deterioration, functional obsolescence and economic (environmental) obsolescence. Physical deterioration and functional obsolescence may be further broken down into curable and incurable types. A grasp of this procedure's underlying principles is essential to an overall understanding of depreciation. This is the most detailed method of estimating depreciation. Physical Deterioration - Curable. These are all the items of maintenance that a prudent owner would accomplish on the date of appraisal to maximize the
Georgia Department of Revenue Revised 6-13-2018
The Cost Approach to Value 125
profit (or minimize the loss) if the property were sold. Almost any item of physical deterioration can be corrected at a price. However, to be classified as curable, the cure normally must contribute more value than it costs. Items of normal maintenance usually fall into this category, including paint touch-ups and minor carpentry, plumbing and electric repairs (leaking faucets, squeaking or tight doors and windows.) The ultimate test is whether the market will recognize as additional value at least the cost of the repair. Realtors R have long recognized that minor repairs do add value equal to or in excess of their cost and they try to have an owner make these repairs before a house is offered for sale. The measure of physical deterioration-curable is the cost to cure. Many appraiser clients require that an itemized list of the curable items be part of the report together with an estimate of the cost to cure. Physical Deterioration - Incurable. As soon as a house is constructed, it begins to age and suffer from wear and tear. Physical deterioration-incurable is based on the physical life of the components of the house. The total physical life of the house would equal its total economic life if no other forms of depreciation were present. One of the practical problems in estimating the percentage of physical deterioration-incurable is estimating the physical life of the components. There is a tendency to assign too much depreciation to physical deterioration-incurable by using estimates of 50 to 100 years for items such as footings, foundation, framing, wall and ceiling covering. To measure physical deterioration-incurable, items are divided into two categories: long-lived and short-lived. Long-lived items, such as footings, foundations, frame, walls, floor structure, piping, heat ducts, insulation, electrical wiring, and roof structure can be depreciated as a group by making an estimate of their effective age and remaining physical life based on their condition. The observed condition method, in which items are separately listed and their reproduction cost estimated, can also be used (see Fig. 5). By observation a percentage of depreciation is estimated and extended into a dollar estimate for each component. Indirect costs must be either allocated proportionately to each component or listed separately, and depreciation for them also estimated.
Georgia Department of Revenue Revised 6-13-2018
The Cost Approach to Value 126
Fig. 5: Component Physical Life House Component
Reproduction Cost New
Estimated % Deterioration
Accrued Depreciation
Foundation 800 20% 160 Plumbing 1,000 30% 300 Electrical System
2,000 35% 700
Short-lived items are components whose remaining physical life is shorter than the total estimated remaining economic life of the house. Typically they include heating system, plumbing fixtures, roof cover, gutters and downspouts, kitchen cabinets and counters, painting and decorating. Sometimes these items are classified as physical deterioration incurable postponed. Again, the technique for estimating depreciation is to make a list of components, estimating the reproduction cost of each as well as a percentage of depreciation, based on the appraiser's observations. These estimates are extended into a dollar estimate for each component and totaled. The process may be shortened by estimating a total reproduction cost of all the short-lived items and using an average percentage of depreciation; this may decrease the accuracy of the estimate. Functional Obsolescence - Curable. Most functional obsolescence-curable in residential properties is caused by some kind of design deficiency. In other types of properties some super-adequacies would also be considered curable but they are rare in residential properties. Typical items that fall into this category are kitchens that need new counters, cabinets, fixtures and floor coverings; inadequate electrical service and hot water systems; and need of an additional bath or bedroom where adequate space exists. Again, the test is whether the value added by correcting the obsolescence is greater than the cost to cure as indicated in the market. The measure of functional obsolescence-curable is the difference between what it would cost on the date of appraisal to reproduce the house with the curable item included and to reproduce the house on the same date without it. Only the excess cost of adding the item to the existing structure over the cost incorporating the item as part of a total house construction process represents the measure of accrued depreciation. It is neither proper nor logical to deduct accrued depreciation from reproduction cost of an item that has not been included in the reproduction cost
Georgia Department of Revenue Revised 6-13-2018
The Cost Approach to Value 127
estimate for the existing house. For example, assume that in light of current market expectations, the house being appraised lacks a second bath where room exists to install one. The estimated cost to include this bath as part of the total house construction program as of the date of appraisal is $2,000. The estimated cost to do it as a separate job as of the same date would be more because it generally costs more to build parts of a house separately as compared to building the whole house at one time. If it would cost $2,500 to build the extra bath as a separate job, the measure of depreciation would be the $500 excess cost. To deduct the additional $2,000, it first would have to be added to the reproduction cost of the house. Functional Obsolescence - Incurable. These items can be divided into two categories: loss in value caused by a design deficiency or by an excess or superadequacy. Deficiencies are caused by exterior or interior design that does not meet current market expectations. This can be measured by the rent loss attributable to the deficiency multiplied by the gross monthly rent multiplier applicable to the property (see Fig. 6). Fig. 6: Estimating Incurable Functional Obsolescence
by Capitalizing Rent Loss Monthly rental, House A with 3 bedrooms $285 Monthly rental, House B with 2 bedrooms 265 Difference $ 20 GRM for neighborhood 130 Difference in value between A and B ($20 monthly rent loss x 130 GRM) $2,600 Consider a house with only one bath in a market that requires two baths. Comparable rentals in the market indicate that a house with two baths and rents for $10 per month more than similar houses with one bath. The GRM indicated for this neighborhood is 135. The loss of value caused by the lack of a second bath is $1,350 ($10 monthly rent loss x 135 GRM). The amount of functional obsolescence is the difference between the cost of a house with and without the missing item. This same depreciation might also be derived directly from the market. Sales of two separate houses might be found where a difference in sale price can be attributed to the variance in the number of bedrooms after other adjustments are made. For example, House A, a one-story contemporary style house with living room, dining room, kitchen, three bedrooms and two full baths, sold for $77,200. Similar House B sold for $79,000. The significant difference between the two houses is that B has a two-car garage and only a bath. In this market, houses with
Georgia Department of Revenue Revised 6-13-2018
The Cost Approach to Value 128
a two-car garage sell for $3,000 more than houses with no garage. The value of the difference between 2 full baths and one bath can be calculated as shown in Fig. 7. The measure of functional obsolescence in this example is the difference between the cost of the extra bath, less all other forms of depreciation, and the value difference indicated by the market.
Georgia Department of Revenue Revised 6-13-2018
The Cost Approach to Value 129
Fig. 7 Estimating Incurable Functional Obsolescence Using Matched Pair of Sales Sale price, House A with 2 full baths, no garage $77,200 Sale price, House B with 1 bath, 2-car garage 79,000 Difference $ 1,800 Value of 2-car garage indicated by market $ 3,000 Indicated difference in value between 2 full baths and 1 bath $ 1,200 The second type of incurable functional obsolescence is caused by superadequacy. Probably only a small percentage of houses exist that have some such obsolescence. The number of superadequacies tends to increase as a house gets older and the occupants improve it with features suited for their individual living style. Superadequacies are not only improvements made after construction but also anything initially built into the house that does not add value at least equal to its cost. An example is a master bedroom, 16 x 18 feet, which cost $500 more to build than a bedroom 14 x 16 feet. If the extra size only adds $300 value, the lost $200 is functional obsolescence, superadequacy (again, assuming there are no other forms of depreciation).
Almost all superadequacies are incurable in houses. (In commercial and investment properties sometimes it pays to remove them because of excess operating costs). For example, a new house suffering from no physical deterioration or economic obsolescence has a swimming pool that cost $10,000 to install. It adds only $6,000 value, so $4,000 is functional obsolescence-superadequacy. Superadequacies are measured in the same manner as deficiencies, by finding a matched pair of sales from the market. If a rent differential can be attributed to the superadequacy, it can be capitalized to indicate the value of the superadequacy. The difference between this value and the cost, less other forms of depreciation would be the depreciation classified as functional obsolescence-superadequacy. Property Appraisal and Assessment Administration, sometimes an entire structure can become functionally obsolete because of its location, for example, a large, custom-built house in a moderately priced neighborhood or a small, low-quality house in a high-priced neighborhood5. Caution should be used by the appraiser to accurately measure such depreciation based on market analysis.
5 International Association of Assessing Officers, 1990, Chicago,
Georgia Department of Revenue Revised 6-13-2018
The Cost Approach to Value 130
Economic Obsolescence. Also called locational or environmental obsolescence by some appraisers, it is the loss of value caused by factors outside the property boundaries. It is unique to real estate, caused by its fixed location. The value of a house is directly affected by the neighborhood, community and region in which it is located. In analyzing the location and environment of the property, the appraiser must consider governmental actions, economic forces, employment, transportation, recreation, educational services, taxes, and development trends. Consideration must also be given to factors in the immediate vicinity that detract from value. Unattractive natural features such as swamps, polluted waterways, and obstructed views are examples of items that will detract from value. Poorly maintained nonconforming houses, numerous houses for sale, increasing ratio of rented houses, and uncollected junk in yards are all indications of possible existence of economic obsolescence. Although facilities such as fire stations, schools, stores, restaurants, hospitals, and gas stations are advantageous nearby, if they are too close to the house, they may detract from its value. Nearby industry, highways and airports may be another type of nuisance, especially if they are unattractive, noisy or smoke and odor-emitting. Economic obsolescence can also be caused by factors that affect the supply or demand (such as an unusual number of houses for sale) of houses competitive with that being appraised. The list of factors causing economic obsolescence is almost endless and the appraiser should carefully search for and evaluate anything outside the property that detracts from the value of the house.
Economic obsolescence like functional obsolescence can also be measured by the rent loss attributable to the factor causing the obsolescence. However, a different method is used because part of the rent loss caused by economic obsolescence must be allocated to the land. For example, the market indicates that houses next to gasoline stations rent for $10 less than other houses. The GRM for the neighborhood is 130. The land-to-improvement ratio in this neighborhood typically is land, 15%, improvements, 85%. Some of the rent loss must be allocated to the land, which in this case is 15% (see Fig. 8). Fig. 8: Estimating Economic Obsolescence Total rent loss $1,300 Loss allocated to land (1300 x .15) 195 Loss allocated to improvement $1,105 Economic obsolescence $1,105 Economic obsolescence can also be calculated by finding matched pairs of sales.
Georgia Department of Revenue Revised 6-13-2018
The Cost Approach to Value 131
The pair must consist of one sale that is affected by the influence causing economic obsolescence and another sale that is not so affected. First all other differences are adjusted for and any remaining difference is attributed to economic obsolescence. For example, House D is a new, one-story ranch style house with a two-car garage. It is two blocks from the local school. House E is very similar to House D except that it has a one-car garage and is next door to the school. House D sold for $48,000. House E sold for $44,500. Two-car garages in this market add $3,000 value to houses in this neighborhood and one-car garages add $1,000 value. Lots in this neighborhood are about 20% of total value of typical property (see Fig. 9). Fig. 9: Estimating Economic Obsolescence Using Matched Paired Sales Sale price, House D with 2-car garage, away from school $78,000 Sale price, House E with 1-car garage, next to school -74,500 Difference $ 3,500 Difference between value of 2-car garage and 1-car garage - 2,000 Indicated difference in value caused by school $ 1,500 Value loss allocated to improvements ($1,500 x 80%) $ 1,200
Georgia Department of Revenue Revised 6-13-2018
The Cost Approach to Value 132
Sales Comparison Method
Formulas for Calculating Depreciation Using Sales Comparison Method For each comparable property: 1. sales price – site value = market value of the building 2. cost new of the building – market value of the building = $ amount of accrued
depreciation 3. ($ amount of accrued depreciation / cost new of the building) / effective age =
annual depreciation rate For the subject property, using the comparable(s) that are most similar:
4. comparable’s annual depreciation rate x subject property’s estimated cost new of buildings x subject property’s effective age = accrued depreciation for subject property
Case Problem: Depreciation Calculated from Age Life Method Effective Age of Structure = 8 years Total Economic Life = 60 years Reproduction or replacement cost new = $300,000 What is the age life ratio? What is the accrued depreciation amount? What is the depreciated value of the structure?
Georgia Department of Revenue Revised 6-13-2018
The Cost Approach to Value 133
Case Problem: Depreciation Calculated from the Market
You are developing the cost approach for the appraisal of a single family residence. You have calculated the replacement cost new and are now in the process of determining the amount of accrued depreciation. You find two properties that have sold which are similar to the subject and which have a replacement cost that is well documented. You have the following information for each sale: Sale 1 Sale 2 Sale Price $145,000 $153,000 Replacement Cost New $150,000 $160,000 Land Value $25,000 $25000
Your market analysis (in the first step of the cost approach) has established a land value of $25,000 per site of the subject and the comparable properties. Replacement Cost New for the subject property is $155,000. PROBLEM: Using the information above, determine the percent of depreciation applicable to the subject property and the value of the subject based on the Sales Comparison Data Method of determining depreciation.
Georgia Department of Revenue Revised 6-13-2018
The Cost Approach to Value 134
Case Problem – Observed Condition Method Physical Deterioration You are appraising a seven-year-old office building and have estimated its reproduction cost at $43,800. Items that will be cured as of the appraisal are:
Curable physical:
Painting interior, $800 included in cost of reproduction, but $900 is the cost-to-cure; repairing tile ceiling, $1,200 included in cost of reproduction, but $1,450 is estimated as the cost-to-cure; replacing slab of concrete at entrance, $125 included in cost of reproduction, but $150 is estimated as the cost-to-cure.
Incurable physical (short-lived):
Repro- Effec- Total duction tive Economic
Item Cost Age Life Floor covering $1,800 5 15 Plumbing fixtures $2,100 5 20 Heating unit $2,400 5 20 Roof cover $2,800 5 25 Electrical fixtures $1,000 5 15 Interior hardware $300 5 25 Incurable physical (long-lived): You estimate the effective age of the basic structure to be six years, after the curing of the items of deferred maintenance. You also estimate the total economic life of the structure to be sixty years. PROBLEM:
Estimate the total amount of physical deterioration suffered by the office building.
Georgia Department of Revenue Revised 6-13-2018
The Cost Approach to Value 135
Case Problem 2 – Observed Condition Method The cost of replacing a restaurant has been estimated at $61,000. Upon your inspection, you noticed the following necessary repairs.
Replace cracked glass $410 Replace roof covering (8,000 sq. ft. x $0.20/sq. ft) $1,600 Replace flooring (6,500 sq. ft x $.031/sq. ft.) $2,015 Replace wall covering $1,250
The building was built 12 years ago; its effective age is 15 years and its remaining economic life is 45 years. Forty percent of the building represents the basic structure and the land value is $13,000. What is the amount of physical deterioration to the basic structure of this building? What is the total value of the property?
Georgia Department of Revenue Revised 6-13-2018
The Cost Approach to Value 136
Completion Drill 2 Depreciation Concepts 1. is the loss of value due to consumption, such as mining and
timber removal. 2. Flaking paint on a bedroom ceiling is an example of
deterioration. 3. Another name for the straight-line depreciation method is the ___________
method. 4. Effective age is the age of a building indicated by its
. 5. Economic obsolescence, unlike functional obsolescence and physical
deterioration, is generally considered .
6. The objective of the cost approach is to measure , not cost. 7. The and methods require separation of elements
of accrued depreciation into various categories. 8. The difference between reproduction or replacement cost new of a property
and its market value as of the date of the appraisal is termed .
9. is the number of years from the date of appraisal to the date
when the building becomes economically valueless. 10. Curable physical deterioration is also known as . 11. The depreciation of short-lived items, as treated under incurable physical
depreciation is also known as .
Georgia Department of Revenue Revised 6-13-2018
The Cost Approach to Value 137
Depreciation Tables in CAMA System (Residential)
Georgia Department of Revenue Revised 6-13-2018
The Cost Approach to Value 138
Georgia Department of Revenue Revised 6-13-2018
The Cost Approach to Value 139
Georgia Department of Revenue Revised 6-13-2018
The Cost Approach to Value 140
Georgia Department of Revenue Revised 6-13-2018
The Cost Approach to Value 141
Georgia Department of Revenue Revised 6-13-2018
The Cost Approach to Value 142
Georgia Department of Revenue Revised 6-13-2018
The Cost Approach to Value 143
Georgia Department of Revenue Revised 6-13-2018
The Cost Approach to Value 144
Georgia Department of Revenue Revised 6-13-2018
The Cost Approach to Value 145
Depreciation Tables in CAMA System (Commercial)
Georgia Department of Revenue Revised 6-13-2018
The Cost Approach to Value 146
Commercial Life Expectancies
Georgia Department of Revenue Revised 6-13-2018
The Cost Approach to Value 147
Georgia Department of Revenue Revised 6-13-2018
The Cost Approach to Value 148
Chapter 4 Site Valuation, Analysis and Adjustments
Georgia Department of Revenue Revised 6-13-2018
The Cost Approach to Value 149
Site Valuation
The only source of values for sites is the local market, inasmuch as land cannot be produced or built like improvements. Sales and other market information about similar, comparable sites provide a basis for estimating the value of the site being appraised. Thus site values are primarily a reflection of market activity. The interaction of supply and demand produces prices that are the source of market value of sites. Classification and Analysis of Data All pertinent market data regarding comparables should be organized so that it can be retrieved quickly in a format that promotes easy and accurate comparison with the site being appraised. To qualify as an acceptable comparable sale, the details of each transaction must be verified. Hearsay evidence is not sufficient since the bona fide nature of each comparable used must be unquestioned. The use of key-sort record cards is a practical and efficient technique. A more expensive method is the computer which produces instant and comprehensive recall of all stored facts. Many professional appraisal organizations are moving toward the development and use of elaborate computer systems. The process of comparing the property being appraised with others in the market always involves two components--elements of comparison and units of comparison. To organize better the comparison process, a standard format is recommended. In this process, the appraiser is more exact and efficient by following guidelines that have been developed by practicing appraisers.
Elements of Comparison (Qualitative) Appraisers use elements of comparison when considering the comparability of like site; they are:
1. Location
2. Economic trends and factors (P.E.G.S.)
3. Date of sale
4. Physical characteristics
5. Conditions of sale
Georgia Department of Revenue Revised 6-13-2018
The Cost Approach to Value 150
1. Location The third element of comparison to be considered is that of location. Much emphasis has already been made of the importance of neighborhood influence on marketability of sites. If a comparable site is in the same neighborhood as the appraised site, then there is a likelihood that no locational adjustments would be made. In rare instances, if it were on the edge of a neighborhood and subject to either some beneficial or undesirable elements, neither of which affected the site being appraised, an adjustment must be made. If, however, the neighborhood has been properly identified, it is unlikely that differences in schools, parks, and other kinds of important neighborhood considerations will exist. In the event a site being considered as a comparable is located in a different neighborhood from the property being appraised, a more thorough analysis must be made of possible differences between the two neighborhoods. It should be recognized, however that two separate neighborhoods may be very similar in all respects and no adjustments need be made. On the other hand, if there are major differences between the two neighborhoods, appropriate adjustments must be calculated.
For example, the neighborhood of the appraised site may be served by excellent schools in close proximity to the site. In contrast, the comparable may be located in a neighborhood with less desirable schools much farther away. The market typically would recognize both factors and pay accordingly. To estimate the difference in price for these two variations, the matched pair system can be used again. That is, the comparable in a different neighborhood is compared with an identical site that has sold in the subject's neighborhood. If the former has a lower sale price, this is an indication of the difference the market recognizes in the two neighborhoods because of the school situation. Many other kinds of neighborhood differences, such as variations in deed restrictions, zoning and building codes, must be considered and if they are major, an adjustment must be made. 2. Economic Trends and Factors The classification of land is basic to the study and analysis of trends and factors. At least a tentative decision on classification and highest and best use should be made at this point. The land may be classified as residential, commercial, industrial, land in transition, undeveloped, farm or ranch, or special-purpose. The nature of physical, economic, governmental, and social factors (pegs) will assist in developing regional, city, neighborhood, and site data and in selecting the appropriate valuation method.
Georgia Department of Revenue Revised 6-13-2018
The Cost Approach to Value 151
One of the more important factors to be considered in appraising land, particularly urban land, is zoning data. Zoning ordinances often describe in detail exactly what uses are permitted for the property. Highest and best use may be predetermined with the assistance of zoning ordinances. Zoning ordinances may also specify how many units may be built upon a site, or they may limit the height of a building. 3. Date of Sale The process of comparing the date of the appraisal with the date of sale of the comparable recognizes that market conditions continually change. This process determines if the comparable sale took place under the same or similar market conditions prevailing on the date of the appraisal. Sometimes market conditions remain relatively stable for a year or more; at other times they may change within a three- to six-month period, or even less. The interaction of supply and demand affects prices; if one or the other or both change, prices adjust accordingly. In either a seller's market or a buyer's market, price changes occur. This is the type of phenomenon that the appraiser must investigate, identify and compensate for in this step of the comparative procedure. Judgments regarding the element of time of sale are made by a close study of market conditions prevailing at the time of the appraisal, compared and contrasted with those prevailing at the time of the sale of the comparable. If the comparable was sold in a market similar to that prevailing at the time of the appraisal, no adjustment need be made. If, however, the appraiser recognizes that market conditions varied considerably between the two dates, an adjustment must be made. Although probably not adequate in itself to justify a difference between two markets, the simplest example is the situation in which a residential site sold one year ago in an open market situation after a reasonable listing period. Then for justifiable reasons, it sold again just two months ago for $1,200 more than the earlier price. This illustrates a singular example of the change in the market between two time periods expressed by the difference in the two sales prices. It also illustrates the kind of process the appraiser must apply to identify dollar or percentage adjustments between markets. An intimate knowledge of the market is necessary to establish the amount of the adjustment and a continuous collection and storing of data is essential to reach a defensible conclusion. 4. Physical Characteristics In this comparison process only major physical similarities and differences are identified and considered. A physical inspection of each comparable is desirable. The appraiser must be reasonably well-informed about the basic soil conditions
Georgia Department of Revenue Revised 6-13-2018
The Cost Approach to Value 152
and physical characteristics of the comparable sites being used so that justifiable adjustments can be made between them and the property being appraised (Subject Property).
If a great number of physical differences exist between the properties, the sale probably should not be used as a comparable. If there are none or only a few such differences, it may be a justifiable and usable comparable. The same procedure for determining the amount of adjustment for differences in physical characteristics is followed as for the other elements of comparison. Professional appraisers rely heavily on the local, active market from which to extract dollar (or percentage) amounts. The "matched pair" technique may be used. When necessary, pairs of sales can be used to extract adjustments from the market even when there are two or more differences between the sales. One sale is selected as a base sale and all know differences between it and the other sale are adjusted for. The remaining difference is then attributed to any remaining unadjusted difference between the sales.
a. Location
b. Frontage: Frontage is the distance which a property abuts a street or other public way. It is normally expressed in front feet.
c. Width: Width is normally measured along the front of a parcel. With regular shaped lots, the width and frontage are almost the same; with irregular shaped lots, width will be an average measurement either larger or smaller than the frontage. When the parcel is irregular, the standard method is to add together the front and rear measurements and divide by 2 to determine the average width.
d. Depth: Depth is the distance from the front to the rear line of the
parcel. The correct adjustment can be determined using either “paired sales” or depth factors. An example of “paired sales” is shown below:
If there are two lots which are comparable in all respects except depth, one lot having 20 extra feet of depth, which sold for $250 more than the other lot, it is reasonable to conclude that the market paid $250 more for the extra depth of 20 feet. Such conclusions, however, should be supported by more than one pair of sales. The greater the number of sales to support dollar (or percentage) adjustment figures, the more convincing the appraiser’s conclusions.
Georgia Department of Revenue Revised 6-13-2018
The Cost Approach to Value 153
e. Shape: The shape of a site may be categorized as regular, slightly
irregular, or very irregular. The shape of a lot may have direct bearing on its value.
f. Size: Square footage or acreage or area. The area of a parcel is one
of the most important characteristics affecting value. It is important to consider the effective area, that is, the area within which a building may be built. Zoning and deed restrictions often require that buildings be set back from the front, rear, and side property lines. This may have a major effect upon a site because of the reduction of usable land for improvements.
g. Topography: Topography will often dictate the use to which a site
may be put. It may also determine the size of the foundation, the type of construction, and the location of the building on the site.
h. Landscaping:
i. Slope: It is necessary to determine whether the slope of the property
is uphill, downhill, or side-to-side. The slope will determine what site improvements may be needed in the way of retaining walls and fill.
j. View:
k. Drainage: The condition of the soil and subsoil will determine the
feasibility of construction. In order to build on sites with fluid subsoil, it may be necessary to have special footings. Percolation refers to the ability of the soil to accept moisture. Poor percolation may require special drainage features. The soil condition may also determine whether ordinary landscaping may be used or whether additional cost will be required to improve the condition.
l. Hydrology:
m. Off-Site Improvements: The value of a site is strongly influenced by
the value of the off-site improvements, such as streets, sidewalks, street lighting, and traffic patterns. Street width is of special importance to commercial and industrial property for transportation needs; traffic flow may affect residential property due to the effect of noise and traffic hazards. The utilities available to the property, including water, gas, electricity, telephone and sewer will also have an effect upon the value of the site.
Georgia Department of Revenue Revised 6-13-2018
The Cost Approach to Value 154
n. Soil Condition:
o. Soil Productivity:
p. Zoning:
q. Absorption:
r. Nuisances:
s. Use:
t. Covenants:
u. Neighborhood:
v. Corner Influence:
w. Proximity to Recreational Water:
x. Quality of Access:
Georgia Department of Revenue Revised 6-13-2018
The Cost Approach to Value 155
Land Characteristics Defined - Appraisal Procedures Manual 560-11-10-0.2-09 (2)(d)(iv)
itemtype item item_no description
PROP CHAR INFLUENCE 001 Location
PROP CHAR INFLUENCE 002 Frontage
PROP CHAR INFLUENCE 003 Depth
PROP CHAR INFLUENCE 004 Width
PROP CHAR INFLUENCE 005 Shape
PROP CHAR INFLUENCE 006 Size
PROP CHAR INFLUENCE 007 Topography
PROP CHAR INFLUENCE 008 Landscaping
PROP CHAR INFLUENCE 009 Slope
PROP CHAR INFLUENCE 010 View
PROP CHAR INFLUENCE 011 Drainage
PROP CHAR INFLUENCE 012 Hydrology
PROP CHAR INFLUENCE 013 Off‐Site Improvements
PROP CHAR INFLUENCE 014 Soil Condition
PROP CHAR INFLUENCE 015 Soil Productivity
PROP CHAR INFLUENCE 016 Zoning
PROP CHAR INFLUENCE 017 Absorption
PROP CHAR INFLUENCE 018 Nuisances
PROP CHAR INFLUENCE 019 Use
PROP CHAR INFLUENCE 020 Covenants
PROP CHAR INFLUENCE 021 Neighborhood
PROP CHAR INFLUENCE 022 Corner Influence
PROP CHAR INFLUENCE 023 Proximity Rec Water
PROP CHAR INFLUENCE 024 Quality of Access
Georgia Department of Revenue Revised 6-13-2018
The Cost Approach to Value 156
5. Conditions of Sale This element of comparison is probably the most difficult to extract from the market and for which to make adjustment. It refers to the circumstances under which both buyer and seller make their decisions to purchase and sell a specific site. By the definition, market value requires willing, informed and able purchaser and a willing and informed seller. Quite often, however, and probably more frequently than is generally realized, there are more than normal compulsions to buy or sell. An obvious situation of unusual pressure is a condition of bankruptcy.
Financing conditions are also considered in this element. If conventional financing is typical for the purchase of the type of site in question, comparables that have sold with 100% financing, on conditional sales contracts or with a type of financing other than conventional require special analysis and judgment. If such special conditions produce a price different from that which would have been paid with conventional financing, an adjustment must be made. The conditions of financing, which include the amount of interest charged, the length of the mortgage and the ratio of loan to value, may be analyzed for every sale. When there are substantial differences between the comparables and the property being appraised, either a percentage or dollar adjustment must be made. This again must be extracted from the market and requires thorough and complete analysis of the circumstances. The condition of sales element is often difficult to prove in the market. Even if certain conditions are recognized, it may be difficult to apply an appropriate or justifiable dollar or percentage adjustment for the differences between the property being appraised and the comparable in the market. Some professional appraisers feel strongly that if the conditions of the sale are different from those applying to the property being appraised, the sale should not be used as a comparable. Others feel that if reasonable adjustments can be made for conditions of the sale, it is permissible to use it in this procedure to reach an indication of the market value of the residential lot being appraised.
Units of Comparison (Quantitative) It is often necessary to analyze differences in size and shape of comparable sale properties in order to apply uniform methods of valuation and to compare directly sites of varying size and shape. Five basic units of comparison are used to value sites: (1) front foot, (2) square foot, (3) acre and section, (4) site (lot), and (5) units buildable. Care must be exercised in selecting the unit of comparison. The assessor must ascertain from the market the appropriate unit of comparison in terms of how sites are bought and sold. Front Foot. Use of the front foot as a unit of comparison is based upon the
Georgia Department of Revenue Revised 6-13-2018
The Cost Approach to Value 157
premise that frontage significantly contributes to value. A front foot is a strip of land 1 foot wide, fronting on a street, railroad siding, or body of water, and continuing to the rear of the parcel. This distance is frequently measured in terms of a standard depth.
The front-foot method is useful in the valuation of commercial property where the amount of frontage a property enjoys is important because of the exposure it gives for display area. It may also prove useful in the valuation of industrial property that fronts on a railroad siding in light of the requirements of the industrial firm. Likewise, the amount of frontage on a body of water may contribute to the value of a residential lot for swimming, boating, or the view. An example of the front-foot method is as follows: A downtown commercial lot has 60-foot frontage on Main Street and a depth of 100 feet. By analyzing comparable sales, it has been determined that similar lots with 100-foot depth are selling for $1,000 per front foot. Therefore, the lot would have a value of $60,000 (60 front feet X $1,000 per front foot). Square Foot. This unit of comparison is used for irregularly shaped parcels and where frontage is not a dominant factor in the valuation process. It is used for sites that sell for a standard price per square foot of land area. This method can be used to value residential, commercial, and small industrial sites. For example, a subject property consists of 20,000 square feet. Comparable properties of similar size are selling for 50 cents per square foot. The indicated value of the subject site is therefore $10,000 (20,000 square feet x $0.50 square foot = $10,000). In this example 50 cents is the standard selling price per square foot; however, in many cases the assessor may not be able to find comparable sales of similar size. In the adjustment process, consideration should be given to the minimum site necessary for the improvement (dwelling, retail store, etc.) and the amount of excess land, if any. Through the analysis of sales, the square-foot values should be developed for the minimum site as well as for any excess land. As an illustration, suppose that the minimum lot size required by zoning in the previous example is 15,000 square feet. After an analysis of various-sized properties with similar characteristics, an estimate of the minimum-lot value is 60 cents per square foot, and the excess-land value is 20 cents per square foot. The indicated value of the minimum site is $9,000 and that of the excess land $1,000. Minimum site (15,000 square feet x $0.60)……………………………………. $9,000 Excess land (5,000 square feet x $0.20)………………………… …………… 1,000
Total site (20,000 square feet x $0.50)………………………………… $10,000
Georgia Department of Revenue Revised 6-13-2018
The Cost Approach to Value 158
Acre and Section. An acre consists of 43,560 square feet and maybe used in the valuation of large industrial sites, shopping centers, and rural and farm properties. There may be a breakdown between acres that front on a public thoroughfare and rear acres: in many circumstances front acres are more valuable. A section consists of 640 acres and is a unit of comparison used to value ranch and farm properties, primarily in the western part of the United States and Canada. It is not used in first 13 colonies, Kentucky, Tennessee, Texas, West Virginia, and Hawaii, states that do not use the rectangular survey method of land identification. Site. The site, or lot, unit of comparison is used when the market does not indicate a significant difference in lot value even when there is a difference in lot size. This method is becoming more prevalent and is found in residential subdivisions such as cluster developments and planned unit developments. It may also be used in valuing industrial sites located in industrial parks. Units Buildable. The unit of comparison is used when the market indicates that a site is sold on a unit basis, such as an apartment property where the unit of comparison is selling price/buildable apartment or a parking-garage site where the unit of comparison is selling price/car. The units buildable may be either a theoretical or an actual number of units. The probable number of units to be built may be different from the theoretical number permitted by zoning ordinances. Consideration should be given to market demand, setback limitations, topography, height limitations, and other limiting factors. As illustration, a subject site consists of 25 acres, and zoning ordinances permit 10 units per acre. The site has no limitations. There is one comparable sale of property consisting of 30 acres with an allowable density of 10 units per acre. The property was purchased for $560,000 with the knowledge that because of a topographical problem only 280 units would be built. On the basis of this problem only 280 units would be built. On the basis of this information, the subject site value can be estimated at $500,000. Subject.....Units buildable: 25 acres x 10 units/acre = 250 units Comparable..Units buildable: 280 units (actually built) Value/unit..Comparable: $560,000/280 = $2,000/unit Subject.....250 units x $2,000/unit = $500,000 The unit price of $2,000 should be used because the developer purchased the property with the knowledge that only 280 units could be built. IE: As if it were only 28 acres.
Georgia Department of Revenue Revised 6-13-2018
The Cost Approach to Value 159
Making Adjustments Using Units of Comparison Adjustments for differences between the site being appraised and the comparables may be made in dollars or in percentages (See Figures 2 and 3). If dollar adjustments are used, they may be based on either total price of the whole property or other units of comparison, such as price per square foot, per front foot (designated F/F) or per acre. Depending on local custom and practice, units of comparison may be used rather than total price of the whole site. A reference to $100 per F/F for a site is more specific and understandable than $10,000 for the site. It is sometimes easier to make adjustments using units of comparison than the whole price of a lot. A front-foot unit of comparison can be used appropriately even if the front footage of the site being appraised and that of the comparable are not identical. This system automatically takes care of this difference as long as the two lots have basically the same utility. In such circumstances where major frontage differences exist, the square-foot unit of comparison may be preferable. Another unit of comparison for residential lots is an acreage unit for large estate-type sites. Percentage as well as dollar adjustments may be used. Like dollar adjustments, percentages may be used to recognize difference in market conditions from one time to another. If it is evident from empirical evidence that single family lot prices increased by 10%, adjustment is applicable to the lot being appraised in comparison with the sale of a year ago. Typically, adjustments are made on a plus or minus base. In Figure 3, the sale price of the comparable lot would be adjusted upwardly by 10%. Other adjustments might result in minus percentages.
Georgia Department of Revenue Revised 6-13-2018
The Cost Approach to Value 160
The analysis of pertinent data about the subject site being appraised and comparable sales can be accomplished by developing a grid that lists the elements of comparison, comparing those of the subject being appraised with the comparables as shown below: Figure 1: Site Sale Adjustment Grid
Element of Comparison
Site Being Appraised
Comparable Description
Lot Sale 1 Adjustment
Comparable Description
Lot Sale 2 Adjustment
Trends and Factors (zoning)
Time (date) of sale
Physical Characteristics
Location Conditions of sale
Total net adjustment
Note: Among other items to be considered and used to expand the adjustment grid might be as follows:
1. Inside lot compared to a corner lot 2. A rectangular lot compared with an odd-shaped lot (triangular) 3. Difference in storm water disposal (one area has no facilities, another is well-
drained by storm sewer the market probably would adjust for this difference 4. Difference between a lot which is flat and relatively easy to build on and one
which drops 20 feet below the street level.
Remember you are the appraiser/assessor. You know your jurisdiction and which adjustments are needed.
Georgia Department of Revenue Revised 6-13-2018
The Cost Approach to Value 161
Time Adjustments
Georgia Department of Revenue Revised 6-13-2018
The Cost Approach to Value 162
Figure 2: Portion of Site Sales Adjustment Grid Using
Dollar Adjustments Elements of Comparison Site Being
4. Conditions of Sale Open Market Open Market None Total (net) Adjustments -5%
+5% 0
Adjusted Sale Price $5,500
Reconciliation of Adjusted Site Sale Prices The next step is to reconcile all the adjusted comparable sale prices into an indicated value for the site being appraised. Use of a simple arithmetic average of the value indications is not acceptable appraisal practice. Averaging small groups of numbers produces a meaningless measure of central tendency, which may or may not reflect actual market value. The accepted procedure is to review each sale and judge its comparability to the property being appraised. The final value is based on all the information available to the appraiser. When a unit of comparison is used, two extra steps are needed. First, the adjusted unit sale prices are reconciled into a single or range or adjusted sales prices per unit. Then the number of units in the site being appraised are multiplied by the value or range of values per unit to give an indicated value or range of values of the site.
Georgia Department of Revenue Revised 6-13-2018
The Cost Approach to Value 164
For example, assume the indicated value of the site being appraised is $100 per F/F, based on the reconciled adjusted sale prices of comparable sites. If the site being appraised has 75 front feet, its total value is $7,500 (75 F/F x $100 per F/F). If the indicated value of the site appraised was $.10 per square foot and the site was 80,000 square feet, its indicated value is $8,000 (80,000 sq. ft. x $.10 per sq. ft.). For both dollar and percentage adjustments, the amount of adjustment should be extracted from the market in a valid manner. In some instances, adjustment amounts may not be available from the market. If so, either a logical judgment must be made regarding the amount of the adjustment or the sale must not be used as a comparable in developing the market value for the site being appraised.
Techniques of Making Adjustments There are two basic techniques in making adjustments for differences between the comparable site and the site being appraised. No unanimous agreement exists as to whether one is better than the other. Practicing appraisers use both techniques, and as long as they are used properly, they produce the same results. The first is considered by some to more logical and understandable than the second. It follows this rule: if the property being appraised is better than the comparable, a plus adjustment is made to the comparable; if poorer than the comparable, a minus adjustment to the comparable is made. For example, a lot being appraised is considered to be $500 better than Comparable A because of physical terrain. If Comparable A sold for $6,000, the adjustment would be made as follows: The lot being appraised is $500 better than (+) the comparable. Indicated market value of the appraised property is $500 + $6,000, resulting in a figure of $6,500. Now consider the situation in which the property being appraised is poorer than the comparable. The comparable lot sold for $7,500 and is served by a sanitary sewer; the lot being appraised is not served by a sanitary sewer. Therefore, the appraised property is poorer than (-) the comparable by $750. The indicated market value of the lot being appraised is $6,750 ($7,500 - $750). A second technique for making adjustments used by many appraisers is described on the joint URAR form. It states: "If a significant item in the comparable property is superior to, or more favorable than, the subject property, a minus (-) adjustment is made, thus reducing the indicated value of the subject; if a significant item in the comparable is inferior to, or less favorable than, the subject property a (+) adjustment is made, thus increasing the indicated value of the subject." In the example used above, if a significant item in a comparable is inferior - that is, the lot is $500 is made to the reported sales price of the comparable, increasing the
Georgia Department of Revenue Revised 6-13-2018
The Cost Approach to Value 165
indicated market value of the property being appraised to $6,500 ($6,000 + $500). In this technique, it is necessary to remember that a favorable element of the comparable property becomes a minus and inferior element of the comparable property becomes a plus in the adjustment process. Essentially, it is simply two ways of stating the same process. In the use of both techniques, however, it is essential to remember that adjustments are being made to the property being used as a comparable for the justifiable difference between the comparable and the property being appraised. In this manner, the comparable is being made as much like the property being appraised as possible. It is not the appraiser's desire to change the characteristics of the site being appraised; rather, the comparable is adjusted to make it as similar as possible to the site being appraised. It should be emphasized that adjustments are always made to the comparable (sale) property, never to the property being appraised (subject). NOTE: In the process of analyzing the differences in the market from the time of appraisal to the time of the sale, strange phenomena may be encountered. One may tend to think that market prices and costs are even and steady in their change - that is, going up 4% per year, or remaining the same throughout a year, or declining 2% per year. This, however, may not be realistic. Markets are known for their erratic activity in short periods of time; such activity may be cyclical, seasonal or a combination of both. There may be short periods of time in an annual market period that will be very erratic activity, but the increase or decrease for the whole year would not identify it as such. For example, overall increase for the last calendar year may be 6%; however, a closer scrutiny reveals that all of this was experienced in the last quarter of the year. Use of sales data from the first three quarters would have to be adjusted accordingly.
Georgia Department of Revenue Revised 6-13-2018
The Cost Approach to Value 166
Completion Drill 3 1. What are 5 elements of comparison appraisers consider when determining
comparability of sites? 2. What is the most important element of comparison? 3. What are the most common units of comparison used in valuing land? 4. The best unit of comparison for valuing the land of a retail store requiring
substantial display area is? 5. How many square feet in an acre? 6. What types of properties would utilize units buildable as a unit of
comparison? 7. List three types of transactions that would disqualify a sale from being
considered for use in an appraisal? 8. Adjustments are always made to the property never the
property.
Georgia Department of Revenue Revised 6-13-2018
The Cost Approach to Value 167
9. Adjustments are made for between the subject and comparable properties.
10. In the reconciliation process of the appraisal, the appraiser never
the value indications of the comparable properties into a single estimate of value.
Georgia Department of Revenue Revised 6-13-2018
The Cost Approach to Value 168
Georgia Department of Revenue Revised 6-13-2018
The Cost Approach to Value 169
Chapter 5 Methods of Land Valuation
Georgia Department of Revenue Revised 6-13-2018
The Cost Approach to Value 170
Land Valuation
In appraisal procedure it is customary to derive an independent estimate of the value of the land, whether or not it is free and clear of all building improvements and available for development under a program of highest and best land use. The durability and relative indestructibility of land negates any reason for land depreciation and causes income from land to be capitalized into perpetuity. This is in contrast with site and building improvements which are subject to inevitable losses in value because of physical, functional, and economic causes of depreciation. Often, the purpose of the appraisal necessitates the separation of land value from the total value of the improved property. To illustrate: Fire insurance is generally placed on the destructible portions of a property and not on the bare land used to support he site improvements. Also, in most jurisdictions, land value and the value of the improvements are recorded separately for ad valorem purposes. The comparative sales approach is the most reliable method of land valuation. It involves comparisons and assumes that market evidence is available. Unfortunately, good, reliable sales data are not always available for use. For this reason, the assessor must resort to other methods of valuation. The five generally accepted methods are:
1. Market, or Direct (comparable) Sales comparison 2. Land Development, or Anticipated Use 3. Abstraction-Allocation, (Ratio of improvement value to site value or
Distribution method) 4. Land Residual Capitalization (Income) 5. Capitalization of ground rent (Income)
Generally only one of these approaches to land value is accepted as guiding, although a second approach, if applicable data are available, may prove useful as a check for accuracy. For purpose of clarity, the various approaches to land value will be discussed as independent appraisal techniques. In theory and practice, nevertheless, all valuation, irrespective of method or approach, is related to the local market. The interrelationship of the various approaches to value will become apparent from the discussion of recommended appraisal procedure as presented below. The land residual and capitalization methods will be covered in Course II: The Income Approach to Value.
Georgia Department of Revenue Revised 6-13-2018
The Cost Approach to Value 171
Market or Direct (Comparable) Sales Approach – Most Reliable
The most reliable method of estimating land value is based on a comparison of the subject property with similar properties in like locations which have sold in recent times. Where the market is active and the sales recent and similar in kind, the comparison approach yields satisfactory value estimates. The first and most important requirement in the market or comparison approach to value is ready access to up-to-date sources of real property sale transactions. The source of sales data in order of availability, accuracy, and convenience are as follows:
1. Abstract or title insurance company records 2. Assessor's record files 3. County clerk's official public records (PT-61) 4. Appraiser's personal office files 5. Real estate brokers multiple listing or general sales record files 6. Financial news or newspaper reporting services
The appraiser may use one or more of these sources for sales data depending on appraisal volume and procedures adopted for maintenance of a sales data bank. In many communities copies of official deed records are made available by the county clerk's office at reasonable costs. This information, when promptly posted in geographic order or by alphabetical name of subdivisions, furnishes a ready and convenient source for market sales information. This recommended practice, where available, keeps the appraiser abreast of market transactions and thus provides them with ready information concerning volume of transfers, price trends, and community growth patterns.
Irrespective of the source from which sales record data are obtained, it is the appraiser's responsibility to verify the price and terms of sale by a personal or telephone interview with the buyer, the seller, or both. Real estate transactions historically are considered private in nature and public records may or may not reveal factual circumstances which "cushioned" or "sweetened" a sale. Interviewing the parties to the transaction, or informed persons such as lawyers or brokers who guided the sale, enables the appraiser to formulate judgments in adjusting market prices paid to the prices obtainable for the subject property were it exposed for sale in the open market. If a sale cannot be confirmed, or where the prices of terms are deliberately held secretive, it is best to disregard the transaction in favor of another and more reliable sale property. When applying the market approach to value, caution must be exercised in accepting state revenue stamps affixed to deeds as reliable evidence of the transaction price. Legally, a deed is considered an instrument of "conveyance" in which the actual consideration agreed on in a prior and unrecorded contract need not be stipulated. Although
Georgia Department of Revenue Revised 6-13-2018
The Cost Approach to Value 172
most state laws require that revenue stamps based on the exact transaction price be attached to the deed, there are, nevertheless, circumstances under which these stamps do not indicate the price for which the property was exchanged. For instance: 1. A buyer may wish to give the impression that he paid an amount greater than the actual purchase price and for that reason affixes more revenue stamps than the law requires. There is no limit to the number of amount of stamps that may be purchased, and the tax agent will gladly sell all the buyer wants. The attaching of excess steps may be a device to have future buyers believe that the property is worth a great deal more than the "bargain" price at which it is offered to them. 2. Sellers who must deliver the deed at time of closing--with revenue stamps attached--may attempt, unlawfully, to save on this expenditure by purchasing fewer stamps than the sale price calls for. The county clerk from whom the revenue stamps are obtained does not question the transaction price quoted by the seller, nor the intent of the seller in obtaining more or fewer stamps than the law requires. 3. Many states do not have deed revenue stamp laws, and even where such laws are in force the requirements regarding the effects of existing mortgages differ. In some states, only the cash portions of transactions need be considered; whereas in others, state revenue stamps representing the full consideration must be attached to the deed. 4. In the case of property exchange, the interested parties may understate or overstate the transaction price for tax or other purposes which prove mutually advantageous. Although in many jurisdictions revenue stamps do reflect fairly well the actual transaction price of the property, the possible exceptions noted above should be kept in mind when accepting deed revenue stamp data as evidence of market price or value. In most condemnation trials, too, revenue stamp data as evidence of market sale price is inadmissible or subject to challenge when introduced by an expert witness.
In securing information from court house or file records for entry on the work form, it should not be taken for granted that the date of title closing represents the date of sale. Often land is sold under a contract for deed, in which case months and years may separate the date of contract from the date of title closing. The date of contract, in fact and in law, determines the time at which a meeting of minds took place, and it is that date which must serve as a basis for time adjustments reflecting changes in economic or market conditions up to the date of appraisal. Furthermore, the appraiser must make certain that the sale was concluded under objective, impersonal bargaining and that the terms of sale were fully disclosed.
Georgia Department of Revenue Revised 6-13-2018
The Cost Approach to Value 173
Sales from one relative to another, or where circumstances indicate undisclosed terms and conditions, or where prices appear unreasonable or questionable should be investigated and perhaps discarded in favor of other clear-cut, bona-fide sale transactions. Where market data for comparable properties is unavailable, limited reliance may be placed on property listings. These, however, will only indicate upper (asking prices) and lower (offering prices) value ranges.
Market Data Summary and Correlation After comparable sales have been selected, confirmed, field-inspected and analyzed, the appraiser is in a position to transfer the individual sales data to a summary sheet for adjustment and correlation purposes to derive an estimate of market value for the subject property. A sample summary sheet on which the derivation of a market value estimate for a residential site is illustrated, is shown on page 79. The property under appraisal measures 100 feet along the street front, and is 150 feet in depth. In this instance, it is compared with four reasonably similar market sale transactions that are adjusted to reflect and equalize for economically better or poorer conditions of the subject property as demonstrated. The standard depth for a typical residential site in the neighborhood is 120 feet. In following the step-by-step correlations comparable market sales data as indicated in the market value summary sheet, it will become apparent that the accuracy of the final value conclusion reached depends largely on the exercise of sound appraisal judgment. This judgment cannot be gained by textbook reading or classroom study alone, but follows as a result of diligent application of the valuation principles in field practice. Developing "real world" experience and judgment in the field is essential to good appraisal practice. The first entry on the summary sheet is the date of sale for each comparable property. This entry is important as a measure of elapsed time to date of appraisal, allowing consideration to be given where necessary to changes caused by economic forces which influenced market value during the interval. The second entry shows the indicated price paid for the sale property. The selling price should be obtained from recorded deeds, transfer slips, interviews from buyers and sellers or their attorneys or any other reliable source of information. If a sale cannot be confirmed, it may not be used. The third entry notes size of lot. With the aid of these measurements the appraiser is in a position to compute the price paid per unit (front foot or square foot) of land, and to adjust unit value where necessary to compensate for variation in lot depth. The fourth entry is the price paid per front foot (or square foot) of land. This amount is derived by dividing the total price paid (Entry 2) by the number of front feet (Entry
Georgia Department of Revenue Revised 6-13-2018
The Cost Approach to Value 174
3) of the comparable lot. The fifth entry indicates a time adjustment factor. If, because of economic conditions, the comparable sale property would bring more or less were the sale to take place today (i.e., on the date of appraisal) then an adjustment factor should indicate the percentage of increase or decreases as market conditions warrant. Where no adjustment is necessary, the entry is 1.00. A 5% plus adjustment would noted as 1.05. The adjustment factor in Entry 5 is then multiplied by the unit foot value given in Entry 4, and the resulting unit price adjusted for time is then shown in Entry 6. This time adjustment must not be made arbitrarily but rather must be based on considered study of market conditions--or at least on the opinions of informed persons such as experienced appraisers, builders, and realtors in the community. Entry 7 provides for depth factor consideration. Where all sales are of the same depth as the subject property, this and the following entry can be omitted from the summary sheet. However, whenever lot-depth variations influence the price paid, the appraiser must adjust his figures accordingly and in conformity with an appropriate depth value rule. Depth factors and adjustment will be discussed in Chapter 4. Entries 9, 10, and 11 constitute judgment conclusions based on the local market concerning the relative quality of the subject property as compared with each comparable property in regard to (a) neighborhood, (b) location advantages, and (c) site facilities. Considering the status of the subject property as compared with the sale property, the appraiser establishes a quality rating for each of the features as being better, poorer, or the same. An overall percentage rating is then reached for the subject property (Entry 12).
Georgia Department of Revenue Revised 6-13-2018
The Cost Approach to Value 175
MARKET VALUE SUMMARY SHEET
Sales Reference No.
1 2 3 4
1. Date of Sale: 1 month ago 2 months ago 12 months ago
8 months ago
2. Indicated price:
$3,500 $3,150 $2,900 $3,100
3. Size of lot: 100’ * 150’ 80’ * 200’ 90’ * 120’ 100’ * 90’ 4. Price per front foot:
$35.00 $39.37 $32.22 $31.00
5. Time of adjustment factor:
1.00 1.00 1.15 1.10
6. Unit price adjustment for time:
$35.00 $39.37 $37.05 $37.88
7. Depth Factor:
.9174 .8197 1 1.111
8. Unit price adjusted for depth:
$32.10 $32.27 $37.05 $37.88
Subject property is rated as follows in regard to: 9.Location: Inferior Same Same Same 10. Neighborhood:
Same Inferior Same Superior
11. Site facilities:
Inferior Same Same Superior
12. Net Adjustments:
1.10 1.05 1.00 .90
13. Adjusted Value:
$35.31 $33.88 $37.05 $34.09
Georgia Department of Revenue Revised 6-13-2018
The Cost Approach to Value 176
Sales Comparison Grid Example
Georgia Department of Revenue Revised 6-13-2018
The Cost Approach to Value 177
Georgia Department of Revenue Revised 6-13-2018
The Cost Approach to Value 178
Case Problems – Sales Comparison
Land Adjustments - Percentages
You must appraise the land value of ninety acres of grazing land, located north of the city. The land is flat, making it easy to maintain. The following market information pertains to the area:
Land west of the city is 10 percent less valuable than land north of the city due to bad roads; land south of the city is 5 percent less valuable than land north because of the roadways. Flat land sells for 5 percent more than hilly land. Demand for land has increased at a rate of 8 percent per year over the past three years, resulting in a corresponding increase in value
You have found the following land sales around the city:
Sale#1 Sale#2 Sale#3 Sale#4 Location South North West South No. Of Acres 100 90 95 120 Topography Hilly Flat Hilly Flat Sale Date 3 Years 1 Year 6 Months 1 Year Sale Price $150,000 $165,000 $160,000 $205,000
Subject Sale #1 Sale#2 Sale#3 Sale#4
Sale Price #Acres Date of Sale Price/Acre Time Adust Time Adjusted
Pr/Ac
Other Adjustments
Location Topography Net
Adjustment
Adjusted Value/Acre
Georgia Department of Revenue Revised 6-13-2018
The Cost Approach to Value 179
Land Adjustments – Lump Sum
Your assignment is to appraise Lot 40 in the Pine Ridge Subdivision, a premium subdivision located near the University of Georgia. The lot has good access, a campus view, typical amenities, and is adjacent to a greenbelt. It is typical size. An analysis of land sales in this area indicated that lots which have a view of the campus command a $10,000 premium. In addition, lots on (adjacent to) the greenbelt are worth $6,000 more than lots which are not. The lots are sold on a per sited basis. High demand for lots in this area resulted in a 1% per month increase in value over the last three years. All sales involved typical market conditions. The following sales occurred in the Pine Ridge Subdivision:
Sale#1 Sale#2 Sale#3 Sale#4 Location Pine Ridge Pine Ridge Pine Ridge Pine Ridge Size Typical Large Typical Typical Amenities Typical Typical Typical Typical Greenbelt No Yes No Yes View Typical Campus Campus Typical Sale Date 2 mos. ago 6 mos. ago 3 mos. ago Current Sale Price $77,000 $86,000 $78,000 $80,000
Subject Sale #1 Sale#2 Sale#3 Sale#4
Sale Price Date of Sale Time
Adjustment
Time Adjusted Price Lot
Other Adjustments
Size Amenities Greenbelt View Net
Adjustment
Adjusted Sale Price
Georgia Department of Revenue Revised 6-13-2018
The Cost Approach to Value 180
Land Adjustments - Percentages You are appraising a residential lot in an average neighborhood. The lot is level and has sewer lines, a water hookup, and on a paved street. The lot is rectangular but is more narrow and shallow than typical lots in the neighborhood. You have found four comparable sales of vacant lots in the subject neighborhood and have set the adjustments as follows:
Sale#1 Sale#2 Sale#3 Sale#4 Sale Price $6,400 $7,645 $7,365 $9,600 Date of Sale 28 Months 27 Months 11 Months 24 Months Location Equal Equal Equal Superior
20% Frontage Superior
(5%) Superior
(10%) Superior
(5%) Superior
(5%) Depth Superior
(15%) Superior
(20%) Superior
(15%) Superior
(5%) Shape Inferior
(5%) Inferior
(5%) Inferior
(5%) Equal
Topography Inferior (10%)
Inferior (5%)
Inferior (10%)
Equal
Sewer, Water, Street
Equal Equal Equal Equal
In this market, the value of land has increased one percent for every month in the past four years. Estimate the value for the subject site.
Subject Sale #1 Sale#2 Sale#3 Sale#4 Sale Price Date of Sale Time
Based on Market Comparisons In the narrative section of the valuation report, the appraiser explains why the neighborhood, location, and site facilities of the subject property are deemed better, poorer, or the same, thus justifying the overall comparative percentage rating assigned in the market value summary sheet. The overall quality percentage rating is then multiplied by the adjusted unit price (Entry 8) of the comparable property to derive an estimated value per unit measure of land for the subject property. This value is listed in Entry 13. The next step calls for correlating the adjusted values derived from the sales into a single estimate of unit value. In this instance, correlation does not mean averaging but rather assigning judgment weights to each sale on the basis of comparability, terms of sale, and reliability of sales data. The correlation procedures should be explained in the narrative section of the appraisal. For example, the appraiser might state sales #2 and 3 are most comparable to the subject because they required the fewest adjustments. There are fewer physical differences between these two properties, thus they are the most comparable and will be given the most weight. However, sales #1 and 4 are also somewhat comparable and must be given some consideration. Therefore, what is your estimate of value for the subject parcel?
Georgia Department of Revenue Revised 6-13-2018
The Cost Approach to Value 182
Base Lot Method The base lot method establishes the value of the standard, or “base”, parcel value in the area using a sales comparison analysis, with the base lot serving as the subject parcel. The base lot may be an actual lot or a hypothetical standard lot. Once the base lot value is established, it is used as a benchmark to establish value for individual parcels. The base lot method assumes that the sited characteristics are generally similar for most of the lots and the major factors causing variations in site values are such things as size, view, and traffic, etc. Adjustments for these factors must be developed using paired sales analysis or other forms of market research. Then, the comparables are adjusted to the base lot. After comparables are adjusted to the base lot, statistical analysis should be performed to test the accuracy and confidence of the base value. This method requires an adequate amount of sales data. Older sales can be added to the sales base as long as they are appropriately adjusted for any variations in market conditions.
Georgia Department of Revenue Revised 6-13-2018
The Cost Approach to Value 183
Illustration 0f Base Lot Method
Residential land in a given neighborhood tends to sell on a per lot basis except for lots with excessive width, which sell slightly higher. Location also affect prices. The base lot is a standard size interior lot.
1. Using the following data, estimate appropriate adjustments for width and location.
Sale # Size Location Sale Price
1 200 x 250 Interior $25,000
2 200 x 250 Interior $26,000
3 200 x 250 Interior $27,000
4 300 x 250 Interior $35,750
5 200 x 250 Lake $40,000
6 300 x 250 Lake $49,000
$Adjustment Formula: Sale with Different (Unlike) Characteristic – Base Lot Sale = Adjustment
Factor Adjustment Formula (Additive): Adjustment / Base Lot Sale
Factor Adjustment Formula (Multiplicative): Sale with Different (Unlike) Characteristic / Base Lot Sale
Adjustment for excess width:
Adjustment for location (lake):
2. Adjust the sales to the base lot and determine the base lot value. 3. Using the base lot method, what would be the indicated value of a lot with
excess width located on the lake?
Georgia Department of Revenue Revised 6-13-2018
The Cost Approach to Value 184
Base Lot Exercise
Suggested Solution
BASE LOTS RANGE
Sale # Size Location Sale Price
1 200 x 250 Interior $25,000
2 200 x 250 Interior $26,000
3 200 x 250 Interior $27,000
$Adjustment Formula: Sale with Different (Unlike) Characteristic – Base Lot Sale = Adjustment
Factor Adjustment Formula (Additive): Adjustment / Base Lot Sale
Factor Adjustment Formula (Multiplicative): Sale with Different (Unlike) Characteristic / Base Lot Sale
Excessive Width – Compare (Unlike) Sale #4 with Sales #1 – 3
Base Lot
Sale #
Unlike Sale Price
Minus Base Lot Sales
Additive Adjustment
Additive
Factor
Multiplicative
Factor
1 $35,750 - $25,000 $10,750.00 0.43 1.43
2 $35,750 - $26,000 $9,750.00 0.38 1.38
3 $35,750 - $27,000 $8,750.00 0.32 1.32
Lake View – Compare (Unlike) Sale #5 with Sales # 1 - 3
Base Lot
Sale #
Unlike Sale Price
Minus Base Lot Sales
Additive Adjustment
Additive
Factor
Multiplicative
Factor
1 $40,000 - $25,000 $15,000.00 0.60 1.60
2 $40,000 - $26,000 $14,000.00 0.54 1.54
3 $40,000 - $27,000 $13,000.00 0.48 1.48
Indicated Base Lot Value $ 26,000
Indicated adjustment for Excessive Width + $ 9,750
Indicated adjustment for Location (Lake) + $ 14,000
Value of Excessive Width interior lot $ 26,000 + $9,750 = $ 35,750
Value of Excessive Width/Location Lake
$26,000 + $23,750($9,750+$14,000) = $ 49,750
Georgia Department of Revenue Revised 6-13-2018
The Cost Approach to Value 185
Georgia Department of Revenue Revised 6-13-2018
The Cost Approach to Value 186
Base Lot Exercise
Residential land in a gated community tends to sell on a per lot basis except for, lots with excessive width, which sell slightly higher. Location in the subdivision also affects prices. The base lot is a standard size, interior lot.
1. Using the following data, estimate the appropriate adjustments for width and location.
Sale # Size Location Sale Price
1 100 x 250 Interior $75,900
2 100 x 250 Interior $76,000
3 100 x 250 Interior $76,100
4 200 x 250 Interior $85,750
5 100 x 250 River $90,000
6 200 x 250 River $99,000
$Adjustment Formula: Sale with Different (Unlike) Characteristic – Base Lot Sale = Adjustment
Factor Adjustment Formula (Multiplicative): Sale with Different (Unlike) Characteristic / Base Lot Sale
Factor Adjustment Formula (Additive): Adjustment / Base Lot Sale
Find adjustment for excess width:
Find adjustment for location (River):
2. Adjust the sales to the base lot and determine the base lot value.
3. Using the base lot method, what would be the indicated value of a lot with excess width located on the River?
Georgia Department of Revenue Revised 6-13-2018
The Cost Approach to Value 187
Base Lot Calculation Grid
Sale # Factor 1 Factor 2 Factor 3 Sale Price
$Adjustment Formula: Sale with Different (Unlike) Characteristic – Base Lot Sale = Adjustment Factor Adjustment Formula (Additive): Adjustment / Base Lot SaleFactor Adjustment Formula (Multiplicative): Sale with Different (Unlike) Characteristic / Base Lot Sale
Factor: Compare (Unlike) Sale # with Base Lot Sales #’s , , ,
Base Lot
Sale #
Unlike Sale Price
Minus Base Lot Sales
Additive Adjustment
Additive
Factor
Multiplicative
Factor
-
-
-
Factor: Compare (Unlike) Sale # with Base Lot Sales #’s , , ,
Base Lot
Sale #
Unlike Sale Price
Minus Base Lot Sales
Additive Adjustment
Additive
Factor
Multiplicative
Factor
-
-
-
Factor: Compare (Unlike) Sale # with Base Lot Sales #’s , , ,
Base Lot
Sale #
Unlike Sale Price
Minus Base Lot Sales
Additive Adjustment
Additive
Factor
Multiplicative
Factor
-
-
-
Factor: Compare (Unlike) Sale # with Base Lot Sales #’s , ,
Georgia Department of Revenue Revised 6-13-2018
The Cost Approach to Value 188
,
Base Lot
Sale #
Unlike Sale Price
Minus Base Lot Sales
Additive Adjustment
Additive
Factor
Multiplicative
Factor
-
-
-
Factor: Compare (Unlike) Sale # with Base Lot Sales #’s , , ,
Base Lot
Sale #
Unlike Sale Price
Minus Base Lot Sales
Additive Adjustment
Additive
Factor
Multiplicative
Factor
-
-
-
Georgia Department of Revenue Revised 6-13-2018
The Cost Approach to Value 189
Cost of Development - (Anticipated Use)
Throughout the historical development of appraisal thought, and in the writing of most appraisal literature, the existence of land has been taken for granted. In effect it is implied that land cannot be produced and hence should not be valued via the cost approach. This classic theory of land as being permanent, indestructible, immovable, and unique is valid only if applied to raw land. The appraiser, however, is concerned with "economic" land, modified and improved by man; and in this economic sense, such land value can be produced and duplicated. Man's ability to modify land and thereby produce land value is illustrated by the following story: A farmer, after years of grueling work cutting trees, pulling stumps, and plowing, had converted an overgrown forest region into a fertile and productive farm. One day while harvesting he was talking with a city cousin who was mightily impressed by the lush appearance of the farm and said: "Aren't you lucky to own this land, which God created and presented as a gift to man." The farmer looked bemused at his callused hands and replied: "It's true. But you should have seen this land when God had it all to himself." Today virtually all land has been directly or indirectly modified by man. Relatively little virgin land continues in existence direct modification has included the construction of buildings, fences, dikes, drainage canals, land filling and grading, and the conversion of forests into grazing, farming, or building sites. Land has been modified indirectly by the construction of access roads, bridges, canals, modes of rapid transportation, and other means of public improvements which increase land utility.
Appraisal Procedures Manual To use the cost-of-development method, the appraisal staff shall estimate the total development costs and subtract these costs from the projected sales prices of the developed lots to indicate the appraised value for the raw land. The projected improvements must represent the most probable use of the land. Estimated costs should include the direct costs of site preparation, utility hookups, all indirect costs, and a reasonable allowance for owner profit. The appraiser may use this method to directly value land in transition from agricultural use to residential or commercial use when there are insufficient sales to apply the comparative unit or base lot methods.
Absorption Rates When appraising a new subdivision, the appraisal staff shall use discounted
Georgia Department of Revenue Revised 6-13-2018
The Cost Approach to Value 190
cash-flow analysis in conjunction with the cost-of-development method to appraise the unsold parcels when it is anticipated that the parcels will require several more years of exposure to the market to sell. The appraisal staff may consider typical holding periods, marketing, and management practices when estimating anticipated revenues and allowable expenses. Where land is anticipated to ripen into higher economic uses, or where the conversion of farm or rur-urban (land in transition being neither farm nor suburban in use or character) acreage into suburban building sites is justified by community growth and demand, the appraiser can logically and accurately apply the land development or cost of land production approach to value as follows: Suppose an appraisal problem calls for finding the value of 50 acres of rur-urban land which a subdivider seeks to purchase and develop into residential building sites. As a result of a highest and best land use study, it appears best to subdivide the 50-acre tract into 150 lots each measuring 100 feet by 120 feet, or 3 lots pr acre. Under this development plan the 150 building lots comprise 82.5 percent of the total land area, while the balance of 17.5 percent of land, is deemed necessary for construction of access streets, avenues, traffic isles, and other public uses. Based on study and analysis as follows: 150 lots to see at 10,000 per lot.
Based on these market findings the anticipated use method yields the following results, assuming a discount rate of 12% ,a time for absorption of 5 years, and a profit rate of 10 percent: Note: Present worth of one factors; at a 12 percent discount rate are. .8929 for one year; .7972 for two years; and .7118 for three years. .6355 for four years; .5674 for five years.
30 x $10,000 x .8929 = $267,870
30 x $10,000 x .7972 = $239,160
30 x $10,000 x .7118 = $213,540
30 x $10,000 x .6355 = $190,650
30 x $10,000 x .5674 = $170,220
Total $1,081,440
Georgia Department of Revenue Revised 6-13-2018
The Cost Approach to Value 191
Less Development cost:
Street grading and paving @ $400 per lot = 60,000 Sanitary and storm sewers @ $600 per lot = 90,000 Curb and gutters @ $225 per lot = 33,750 Water mains @ $250 per lot = 37,500
Other costs: (Legal, filing, sales brokerage property taxes, and overhead) =100,000 Developer's profit (10% of gross sales) =150,000 Total development costs will be incurred the first year = 471,250 Present worth of total development costs $471,250 x .8929 = $420,779 Net Present Value $1,081,440 - $420,779 = $660,661 Residual value of "raw" land Value per acre = $660,661-/-50 acres = $13,213 per acre.
The above illustration does not include costs of sidewalks, extension of gas, electric, or telephone utilities, nor expenditures for other public or recreational facilities. Should such expenditures be incurred by the developer they must, of course, be added into the calculation. This method is an example of the economic principles of balance and surplus productivity.
Georgia Department of Revenue Revised 6-13-2018
The Cost Approach to Value 192
Allocation and Abstraction Methods
Under conditions where the market, income, or anticipated use estimates of value is not applicable, an estimate of land value may be derived from a study of typical ratios of improvement value to value of comparable sales. Under highest and best utilization of land, studies disclose certain optimum improvements to land ratios on which the appraiser may rely for value guidance. At the outset, stress is laid on the fact that ratios, like depth or corner land value rules, do not make value but rather reflect typical land-improvement relationships which serve a useful purpose in the allocation of total value to the component parts of land and building improvements.
The Allocation Method
A relationship exists between the application of the agents of production and the market value of a site. This is confirmed by the application of the principles of balance, contribution, surplus productivity and increasing and decreasing returns. Therefore, site value can be estimated by allocating the total sale price of a comparable between its two utilitarian and productive parts--the lot and the improvements. The appraiser determines what portion of a property's sale price typically may be allocated between the lot and the improvements, estimating the market value of the house and other improvements first. The balance (residual) then is allocated to the site. Statistics shown from the U. S. Census demonstrate the relationship between sale price and site value of residential properties. The statistics are presented on a national and regional basis. The older the improvements; the higher the ratio of land value to total value. The typical ratio can be affected by a site of unusual size or characteristics and by building costs. To estimate the value of unimproved property in an area where vacant land sales are lacking, the appraiser can allocate from the total sale price of a comparative property the part that could reasonably be assigned as building value. The remainder, except for intangibles, is the site value. The advantage of this procedure is that a sense of proportion is retained. If a neighborhood is typically improved with certain types of properties that can justify only a certain land value, the typical vacant lot probably will not be improved to a higher and better use. Where no vacant site sales are available, this method does afford an indication of site value. However, the results may sometimes be inconclusive and need market analysis. Where land value equals improvement value, the ratio is said to be one to one; if
Georgia Department of Revenue Revised 6-13-2018
The Cost Approach to Value 193
the investment in building improvements is double that of the land value, the ratio is two to one and so on. Commercial land in the downtown area is generally characterized by a low (but efficient) land-to-improvement ratio, and the ratio increases as the land is put to lower (less efficient) uses. Once a study of typical land uses within a community discloses a guiding relationship of improvement to site values, the appraiser may use the results as a basis for or check on the accuracy of value findings by other and more direct appraisal methods. For instance, if typical residential properties are improved with buildings costing three or four times the value of the building site, improvements ratios as low as two to one or as high as six or more to one may warn of under- or overdevelopment of the site. In either case, faulty improvement will cause a loss in building value reflected by the difference between actual and estimated potential dollar return realizable under a program of highest and best site utilization. A 1:4 residential-land-to-building-value ratio, in essence, implies that typical investors or developers purchasing building sites at 20 percent of the price at which new, improved properties sell. Thus where residential properties sell at a price of $80,000, the 1 to 4 ratio indicates a site value of $80,000 time .20 or $16,000. The prevailing ratio of land value to building value for a given class of real property also aids the appraiser in deriving, by abstraction, appropriate market rates of capitalization, as will be explained and demonstrated in Course II: The Income Approach to Value.
The Abstraction Method The abstraction method of site valuation may be helpful when no vacant sales are available for comparison. It is based on the principle of balance, which states that there is a sense of proportion in the four agents of production (see Chapter 1). Land, as one of the agents of production, should have a logical value relationship to total property value. As previously discussed, under the concept of allocation, a portion of total property value may be assigned to the site. A fair allowance is estimated, based on knowledge of the market for properties of the class under appraisal. Typical relationships are established from sales of improved properties. To establish proper ratios, the following are usually considered: (1) site values in previous years, (2) land-building ratios in similar neighborhoods, and (3) analysis of new construction o similarly classified sites. Estimate, for example, that the site should represent about 20 percent of the total property value in a given area, classified as single-family residential. The allocation is 1:4; there is one part land to four parts building. In a $40,000 property, land typically represents one-fifth, or 20 percent, of the total. The site in this
Georgia Department of Revenue Revised 6-13-2018
The Cost Approach to Value 194
example would be valued as follows: $40,000 x 20% = $8,000 or $40,000 5 = $8,000. Abstraction, as opposed to allocation, employs elements of the cost approach in the analysis of an improved property sale. The method involves subtracting the depreciated reproduction cost of improvements from the sale price of an improved property. The remainder is an indication of land value for that property. The following example illustrates this method.
Value of property as indicated by sale $40,000 Estimated replacement cost new of building $50,000 Accrued depreciation of all types $18,000 Estimated value of improvements $32,000 Indicated site value $ 8,000
Similar analysis with several sales of improved properties in a neighborhood may yield a pattern of site values as follows:
It may be estimated from this analysis that typical sites in this neighborhood have a value in the $14,000-$15,000 range. This method should be employed with caution. It relies on an up-to-date cost manual for reproduction figures and the ability to accurately and uniformly estimate accrued deprecation.
Georgia Department of Revenue Revised 6-13-2018
The Cost Approach to Value 195
Case Problem – Cost of Development You are estimating the value of a 50-acre parcel currently used for agricultural purposes. It is zoned for residential development and is in the path of residential growth. You have no vacant land sales of undeveloped tracts this large but you know from the market sales of developed properties that, typically, residential building sites sell for $12,500 in this area. Zoning will allow two residences, per acre. From contractors and developers you have determined the following costs are typical: Discount rate of 12% and a sell out period of 5 years. Note: Present worth of one factors; at a 12 percent discount rate are. .8929 for one year; .7972 for two years; and .7118 for three years. .6355 for four years; .5674 for five years Overhead and sales expenses $2400/lot Site development $3000/lot Profit, $1250/lot Problem: (1) What is the highest and best use of the land?
(2) What is the value of the land per acre? (3) What value will you enter on the digest?
Georgia Department of Revenue Revised 6-13-2018
The Cost Approach to Value 196
Case Problem – Allocation Method
A. Sale#1 sold for $120,000, and Sale#2 sold for $175,000. There are no comparable sales in the area, but a recent study showed the typical land value ratio for this neighborhood to be 26% for homes under $150,000 and 18% for homes over $150,000. What is the land value indicated for Sale#2?
B. Certain single family residential property sold for $150,000. Your
analysis shows that the ratio of land to improvement is 1:4. What is the indicated land value?
Georgia Department of Revenue Revised 6-13-2018
The Cost Approach to Value 197
Case Problem - Abstraction and Allocation In analyzing the local market and from interviews with the buyer and seller, you have gathered the following information:
Subject property is a retail store and sold recently for $250,000. The selling price was confirmed by both buyer and seller.
The buyer estimates reproduction cost new of the store to be $225,000 and feels there is accrued depreciation in the amount of $20,000.
The typical land to building ratio for properties of this type in this area is 1:4.
Similar lots in the area have sold recently in the $49,000 to $53,000 range.
Problem:
A. What is the site value of the subject using:
(1) Abstraction (2) Allocation
B. What value will you use in your appraisal report and why?
Georgia Department of Revenue Revised 6-13-2018
The Cost Approach to Value 198
Case Problem – Square Foot Versus Units Buildable You are appraising an 8-acre parcel (350,000 sq. feet) in an area zoned for multi-family development up to six stories. The subject property is close to a recreation area and a zoning variance permits the construction of a 10 story apartment building on sites of 350,000 sq. feet. In conforming with existing zoning a 10 story 450 unit apartment has been designed for the subject site. The following recent land sales have been improved with 6-story apartments which meet zoning requirements in the area. None have the benefit of the subjects zoning variance. Sale# Saleprice SqFt $SqFt Units $Units 1 $200,000 200,000 200 2 $225,000 240,000 210 3 $295,000 300,000 290 4 $280,000 300,000 282 5 $175,000 160,000 160 6 $275,000 288,000 275
Problem: Estimate the land value of the subject parcel and explain how you arrived at it.
Georgia Department of Revenue Revised 6-13-2018
The Cost Approach to Value 199
Georgia Department of Revenue Revised 6-13-2018
The Cost Approach to Value 200
Chapter 6 Formulas, Tables, Rules and Valuing Odd Shaped Lots
Georgia Department of Revenue Revised 6-13-2018
The Cost Approach to Value 201
Georgia Department of Revenue Revised 6-13-2018
The Cost Approach to Value 202
Formulas, Tables, Rules, and Valuing Odd Shaped Lots
Through the analysis of market data, formulas, tables, and rules have been designed to assist in dealing with changes in parcel size, shape, and location. They include depth tables, irregular-lot valuation tables, and corner-influence tables. It is important to bear in mind that these formulas, tables, and rules are only guides and must be supported by evidence from the local market.
Odd Shaped Lot Valuation 65/35 Rule Irregular plots often present a problem in appraising. Assuming no disutility because of odd shape and no impairment of utilization under a highest and best land employment program, an irregular site should be evaluated in accordance with the customary unit measure applied in practice for similar and regular-shaped lots., plus value allowance for odd plot portions as demonstrated in Figure 3. Residential and commercial sites are generally evaluated in relation to the number of feet fronting on a city street. Where the shape is a parallelogram as shown in Figure 3, no value adjustment is necessary for lot irregularity since the two triangles marked B and C in effect form a rectangle the combined value of which is equal to a rectangle of like street frontage.
100’
75’ B
A
C
100’
Street Front Fig. 3
Georgia Department of Revenue Revised 6-13-2018
The Cost Approach to Value 203
Odd-shaped lots such as shown in Figure 4 are valued as rectangular lots, plus the additional value of the triangular lots. Based on market study, a triangular lot, provided the base fronts the street such as Lot 2 in Figure 4, is worth 65 percent of a rectangular lot of the same frontage. A triangular lot with its apex on the street such as Lot 1 in Figure 4 is worth 35 percent of a rectangular lot with a street frontage equal to the base of the triangle. To illustrate, assuming a value of $50 per front foot, the lots illustrated in Figure 4 could be appraised as shown below the figure.
Fig. 4 Lot No. 1 A 100 feet @ $50.00 =
$5,000.00 B 25 feet @ $50.00 x .35 =
437.50 Total value Lot No. 2 $5,437.50 Lot No. 2 A 110 feet @ $50.00 =
$5,500.00 B 15 feet @ $50.00 x .65 =
487.50 Total value Lot No. 2
$5,987.50
100’
100’
B
A
100’
Front Feet $50 Street
25’
100’
110’ B
A
110’
Front Feet $50 Street
15’
100’
Georgia Department of Revenue Revised 6-13-2018
The Cost Approach to Value 204
Georgia Department of Revenue Revised 6-13-2018
The Cost Approach to Value 205
SIZE, DEPTH, SHAPE, AND CORNER LOT LOCATION INFLUENCES It is recognized that a site must be of a minimum size and shape to permit effective utilization in conformity with the principle of highest and best use under existing zoning, building, and deed restrictions. A site 10 feet wide and 100 feet deep in a residential area where building restrictions call for a minimum size lot containing 10,000 square feet of area has no value except as it may attract offers from neighboring property owners who may, at a price, be interested in adding this strip of land to their holdings. It is important, therefore, to make certain that a site under valuation meets minimum lot-size requirements. The value of a rectangular site (if residential or commercial in character) depends on the number of units, or front feet, along the abutting street, and on the depth of the lot if the same is deeper or shallower than the considered standard for the neighborhood. To illustrate: Assuming a standard lot depth of 100 feet in a given neighborhood and a front foot lot value of $50 (as supported by market comparison lot sale analysis), then a 100-foot wide by 100-foot deep lot is estimated to bring 100 x $50, or $5,000, if exposed for sale. For every street foot added or subtracted from this lot, provided the lot depth remains 100 feet, the value will increase or decrease by $50 in amount. In many instances, however, lots are either substandard or in excess of a depth considered standard for the area. To measure the value influence of depth - in conformity with the principle that the front of a lot (because of street access and utility) is more valuable than the rear - depth rules have been devised to measure changes in value resulting from variations in depth size - all other things remaining equal.
In applying depth rules, it should be kept in mind that rules by themselves do not make value but rather reflect the market actions of typical buyers in a community. Then too, rules applied should merit acceptance by professional appraisers in the area and prove acceptable in court practice. Most of the depth rules have been devised as an aid to assessors to permit uniformity of value treatment. However, these rules appear to check out with market sale transactions and are applied when other and more accurate means of measuring the value of nonstandard size lots are unavailable.
Georgia Department of Revenue Revised 6-13-2018
The Cost Approach to Value 206
As stated earlier, some depth tables may show small variations from the standard need.
4-3-2-1 Rule This depth rule has gained prominence because it is general in character and not tied by name to any person or location. The rule is based on the theory that a standard lot, if divided into four equal parts, will differ in value as follows: First quarter, 40 percent; second quarter, 30 percent; third quarter, 20 percent; and fourth quarter, 10 percent. This value allocation accounts for the rule's classification as 4-3-2-1. For every additional quarter of lot depth added beyond standard depth the value increment decreases by 1 percent from that of the last quarter. Thus the next 25 feet beyond a 100-foot standard lot adds 9 percent of value. The next 25 feet beyond that, 8 percent, the next, 7 percent, and so forth. Depth Tables. Depth tables assist in the measurement of changes in value caused by variation in lot depths where land is typically purchased on a front-foot basis. They are based on the observation that the front section of a lot is more valuable on a unit basis than the rear portion. As depth increases, the value unit decreases. The least complex basis for computing depth tables is the "4-3-2-1 rule." This rule states that the first 25 percent of depth of a lot represents 40 percent of the total lot value, the second 25 percent of depth represents 30 percent of the value, the third 25 percent of depth represents 20 percent of the value, and the fourth 25 percent of depth represents 10 percent of the value. Figure 1 illustrates the value of a 50-foot x 100-foot-deep lot having a front-foot value of $200. Some depth tables may show small variations from this standard. Figure 1 is a sample depth table, based on a standard depth of 100 feet. Using this same depth table, the value of a lot 65 x 125 feet can be computed. Assume that the unit foot value for lots with standard depth of 100 feet is $50. According to the table, the depth factor for a lot 125 feet deep is 109 percent, or 1.09. Therefore, the lot value is $3,542.50. 65 x 125-foot lot size; 65 front feet x $50 per front foot value = $3250 - Standard Lot Value $3250 x 1.09 depth factor = $3542.50 - Adjusted Lot Value
Georgia Department of Revenue Revised 6-13-2018
The Cost Approach to Value 208
Figure 1.
FIG. 1 4-3-2-1 RULE. The estimated lot value is $10,000. The 4-3-2-1 rule assumes that the first 25 feet of depth is worth 40 percent, or $4,000; the second 25 percent is worth 30 percent, or $3,000; the third 25 feet is worth 20 percent, or $2,000; and the fourth 25 feet is worth 10 percent, or $1,000.
25’
25’
25’
25’
10% of Value
20% of Value
30% of Value
40% of Value
50’
Front-Foot Price = $200
$1000
$2000
100’
$3000
$4000
Georgia Department of Revenue Revised 6-13-2018
The Cost Approach to Value 209
As stated under 4-3-2-1 depth rule, for every additional quarter of lot depth added beyond the standard depth the value increment decreases by 1 percent from that of the last quarter. Thus the next 25 feet beyond a 100-foot standard lot add 9 percent of value. The next 25 feet beyond that, 8 percent, the next, 7 percent, and so forth as shown below in Figure 2.
FIGURE 2
DEPTH COMPARISON BASED ON PERCENTAGE OF VALUE (Standard Lot = 100 Feet)
7
8
9
10
20
30
40
175’
150’
125’
100’
75’
50’
25’
0’
Feet of Depth 4-3-2-1
Street Frontage
Georgia Department of Revenue Revised 6-13-2018
The Cost Approach to Value 210
Interpolation for Depth Factors Interpolation, in a mathematical sense, is the process of finding intermediate terms or numbers in a sequence of terms or numbers. It may be used in conjunction with depth table if the depth of the subject property falls between depths listed with factors on the table being used. If this is the case then interpolation may be used to calculate the proper factor. For example Table I gives factors for depths in increments of 10 feet. The standard lot depth is 100 feet and you want the depth factor for 95 feet.
The lot is divided into equal quarters by 4-3-2-1 Rule. The depth factor desired is found in the last 1/4 of the lot. Determine how many feet of total depth are in the last 1/4 of the lot. 25 + 25 + 25 + 20 = 95 Determine what percentage 20 feet of depth is of the final 1/4 25 feet: 20 25 = .80 Multiply that percent (.80) times the percent of lot value in which the depth is contained .80 x .10 = .08 Add the newly calculated percentage to other percentages that comprise the lot. 40% + 30% + 20% + 8% = 98% Depth Factor for 95 foot deep lot.
10%
20%
30%
40%
Street Frontage
% of Value
25’
25’
25’
25’
# of feet in each section
Georgia Department of Revenue Revised 6-13-2018
The Cost Approach to Value 211
INTERPOLATION FOR DEPTH FACTORS Example #1 Depth Table with Standard Depth of 100': You want to price a lot with a depth of 115' but table only shows factor for 110' = 1.0360 and factor for 120' = 1.0720. Using the 4-3-2-1 rule find the depth factor for 115'. Example #2: Standard Depth of 100' Using the 4-3-2-1 rule find the depth factor for 65'. Example #3: Standard Depth of 200' Using 4-3-2-1 rule with a standard depth of 200' you know that 40% of the value will be in the first 25% of the depth (i.e., .25 x 200' = 50' with depth factor of .4000). Find the depth factor for 80 feet.
Georgia Department of Revenue Revised 6-13-2018
The Cost Approach to Value 212
Example #1
Step 2: In example #1, we are looking for depth factor 115'. Therefore, the quarter we are looking for will be between 100 and 125 feet. The 4-3-2-1 rule tells us this total quarter represents 9% of value added. Therefore:
9% - Number of feet in quarter = % of value per foot in quarter 15' 25' = 60
Step 3: Looking for 115' depth factor. Therefore we have 15 feet (115' - 100' = 15') in the next quarter.
Number of feet in quarter x % of value per foot added (Step 2) = % of value for subject in quarter
.60 x .09 = .054
Step 4: Depth factor for subject: Add Step 3 to preceding total % of value.
.0540 + 1.00 (100% for 100') = 1.0540 depth factor for 115' using 100' standard depth
125’
100’
75’
50’
25’
0’
9%
10%
20%
30%
40% 70%
90%
100%
Street Frontage
Step 1: Depth % of Value
100' standard depth divided by 4 = 25' per quarter
Georgia Department of Revenue Revised 6-13-2018
The Cost Approach to Value 213
Example #2
Step 2: In example #2, we are looking for depth factor for 65'. Therefore, the quarter we are looking for will be between 50 and 75 feet. The 4-3-2-1 rule tells us this total quarter represents 20% of value added. Therefore:
15' 25' = .60 Step 3: Looking for 65' depth factor. Therefore we have 15 feet (65' - 50' = 15') in the next quarter. Therefore:
.60 x .20 = .12 Step 4: Depth factor for subject: Add Step 3 to preceding total % of value. Therefore:
0.12 + .70 (70% for 50' depth) = 0.82 depth factor for 65' using 100' standard depth
100’
75’
50’
25’
0’
10%
20%
30%
40% 70%
90%
100%
Street Frontage
Step 1:Graph 100’ standard depth Depth % of Value
Georgia Department of Revenue Revised 6-13-2018
The Cost Approach to Value 214
Example #3
Step 2: In example #3, we are looking for depth factor for 80 feet. Therefore, the quarter we are looking for will be between 50 and 100 feet. The 4-3-2-1 rule tells us this total quarter represents 40% of value added. Therefore:
30' 50' = .60 Step 3: We are looking for the 80' depth factor. Therefore we have 30 feet in the quarter. Therefore:
.60 x .30 = .18 Step 4: Depth factor for subject: Add Step 3 to preceding total % of value. Therefore:
.18 + .40 (40% for 50' depth) = .58 depth factor using 200' standard depth
200’
150’
100’
50’
0’
10%
20%
30%
40% 70%
90%
100%
Street Frontage
Step 1: Depth % of Value
200’ standard depth divided by 4 = 50’ per quarter
Georgia Department of Revenue Revised 6-13-2018
The Cost Approach to Value 215
Case Problem – Calculating Depth Factors Problem 1 Using 120 feet standard depth table, what is the depth factor for 70 feet? Solution: Problem 2 Using 160 feet standard depth table, what is the depth factor for 90 feet? Solution: Problem 3: Using 200 feet standard depth table, what is the depth factor for 218 feet? Solution: Problem 4: Using 250 feet standard depth table, what is the depth factor for 195 feet? Solution:
Georgia Department of Revenue Revised 6-13-2018
The Cost Approach to Value 216
Parallel Sides of Unequal Depth 100’ Standard Depth Table
(A lot that has its side lines parallel and perpendicular depth unequal)
To compute the value of this lot, multiply the front foot rate by the width, then multiply this sum by taking the average of the two unequal sides. EXAMPLE: 100 + 120 = 220 / 2 = 110 Average Depth 10/25=.40 x .09 = .036 + .10 + .20 + .30 + .40 = 1.036 Depth Factor 70' x $50 = $3500 x 1.036 = $3,626
100’ See Table
Street Frontage $50 front foot
110
Lot 3
70’ width
120’ See 100’ Table
Avg Depth
Georgia Department of Revenue Revised 6-13-2018
The Cost Approach to Value 217
Back or Rear Lot 100’ Standard Depth Table (A lot having no street frontage, usually the result of an adjoining owner)
To compute the value of this lot, multiply the front foot rate by the width. Inasmuch as this lot does not have any frontage, we take the difference between the depth factor of the front lot and the depth factor of the rear lot and use this percentage. EXAMPLE: .40 + .30 = .70 Depth Factor @ 50’ 50 + 70 = 120’ Total Depth of Lot 20 / 25 = .80 x .09 = .072 + .10 + .20 + .30 + .40 = 1.072 Total Depth Factor 1.072 - .70 = .3720 Depth Factor for Rear Lot 50' x $50 = $2500 x .3720 = $930 Value of Lot
Street Frontage $50 front foot
50’ width
70’
50’
Lot 4
50’ width
Georgia Department of Revenue Revised 6-13-2018
The Cost Approach to Value 218
"L" Shaped Lot 100’ Standard Depth Table (a combination of a rectangular and a back lot)
To compute the value of this lot, use the same method as a rectangular lot, previously shown, and the method used in the back rear lot shown. By adding the two sums, value of lot is obtained. EXAMPLE: 15 / 25 = .60 x .10 = .06 + .20 + .30 + .40 = .960 Depth Factor @ 90’ 20 / 25 = .80 x .09 = .072 + .10 + .20 + .30 + .40 = 1.072 Total Depth Factor 1.072 - .960 = .1120 Depth Factor for Rear Lot 40' x $50 = $2000 X 1.072 = $2144 50' x $50 = $2500 x .1120 = $280 Total Value = $2424
40’ width
120’ depth
90’
Lot 5
50’ width
Street Frontage $50 front foot
30’ depth
Georgia Department of Revenue Revised 6-13-2018
The Cost Approach to Value 219
Triangular Lot (With Base on Street) 100’ Standard Depth Table
To compute the value of this lot, take 65% of the actual front foot width and multiply this result by the front foot rate, then multiply this result by the depth factor percentage to obtain value. EXAMPLE: 20 / 25 = .80 x .09 = .072 + .10 + .20 + .30 + .40 = 1.072 Total Depth Factor 65% of 100' = 65' x $50 = $3250 x 1.072 = $3484
Street Frontage $50 front foot
100’
120’ depth
Lot 6
Georgia Department of Revenue Revised 6-13-2018
The Cost Approach to Value 220
Triangle Lot (With Apex on Street) 100’ Standard Depth Table
To compute the value of this lot, take 35% of the rear width to obtain the front foot width, then multiply this result by front foot rate, then multiply the depth factor percentage along the perpendicular depth line shown to obtain the value of this lot. EXAMPLE: 35% of 140' = 49' x $50 = $2450 x 1.00 = $2450.
Lot 7
100’
140’ width
Street Frontage $50 front foot
Georgia Department of Revenue Revised 6-13-2018
The Cost Approach to Value 221
Lots Having Front on Two Streets 100’ Standard Depth Table
To compute the value of this one owner lot, determine the depth point where the values are divided and use depth factor percentage of each. Compute as per rectangular lots using both front foot rates and results for value. EXAMPLE: .08 + .09 + .10 + .20 + .30 + .40 = 1.17 Depth Factor @ 150’ 70' x $50 = $3500 x 1.17 = $4095 70' x $25 = $1750 x 1.00 = $1750 $4095 + $1750 = $5845
70’ width
150’ depth 250’ depth
Lot 9
70’ width100’ depth
Street Frontage $25 front foot
Street Frontage $50 front foot
Georgia Department of Revenue Revised 6-13-2018
The Cost Approach to Value 222
Corner Lot Valuation With the increasing width of standard residential lots--from 20 and 25 feet to 100 feet or more in suburban subdivisions--the advantages which corner locations once offered in providing better light, more convenient access and, perhaps, greater privacy have diminished to a point where the additional hazards encountered at corner locations from automobile traffic have in some instances neutralized corner location advantages. In residential areas, therefore, the recommended appraisal practice is not to assign a value increment because of corner location, unless market sales in a community or area clearly demonstrate preference for such locations. Commercial corner locations, however, do have value advantages over inside lots because of greater accessibility, increased pedestrian traffic, better merchandise display, and store visibility from two street locations. Corner lots typically command better rentals, and the net income to land is higher at corner store locations whether they are under owner or tenant occupancy. Under the income approach--that is demonstrated in Course II--the added corner value is directly accounted for by capitalization of the increased income attributable to a site location. Under the market approach, however, comparable sales data generally relate to inside lots, and adjustments are required to account for corner value influences. As stated previously, rules do not create value; nevertheless, they do offer, where tested by field practice, an opportunity to check value findings derived from other approaches to value.
Assemblage and Plottage Where the assembled lots, because of single ownership and unified control, permit more intensive utilization of the land, the added value increment is known as plottage. This plottage value is best measured by capitalizing the actual or anticipated increased income attributable to an assembled property rather than by any arbitrary percentage such as 10, 20, or more percent as was customary in years past. This will be covered in more detail in Course II: The Income Approach to Value. Two terms commonly confused in appraisal terminology are assemblage and plottage. Plottage is the process of combining two or more sites under a single ownership in order to develop one site having greater utility and unit value than the aggregate when each is separately considered. Assemblage, on the other hand, is simply the merging of adjacent properties into one of common ownership or use. Generally, when the new site has a greater utility than the sum of the old sites, the new site will have increased value. This value increment is known as plottage value. Occasionally the combining of parcels will result in the creation of a new
Georgia Department of Revenue Revised 6-13-2018
The Cost Approach to Value 223
site with lesser utility, normally resulting in lesser value. This value decrease is known as negative plottage. Corner Influence via Market Sales The market is the best source of information because the results allow the appraiser/assessor to explain to the taxpayer, Board of Equalization and Courts the justification of the value estimate by being supportable and defendable by actual market transactions in the subject's jurisdiction. The following example demonstrates how corner influence can be determined from the market using sales.
Lot 1: Sold December 29th, for $35,000 cash. Sale price per front foot -
$350; per square foot - $1.75. Lot 3: Sold December 20th for $30,000 cash. Sale price per front foot -
$300; per square foot - $1.50. Lot 4: Sold January 2nd, for $29,100 cash. Sale price per front foot - $300;
per square foot - $1.50. Problem: Using the above information, what is the indicated percentage of
value added for corner influence?
Lot 4 Lot 3 Lot 2 Lot 1
Lot 5 Lot 6 Lot 7 Lot 8
200’
90’
200’
100’ 100’ 97’
200’
MAIN STREET Market Value $250 per front foot
Georgia Department of Revenue Revised 6-13-2018
The Cost Approach to Value 224
Solution: Formula for Corner Influence (CI) is as follows: CI = Sale Price of Corner Lot* = Corner Adjustment
Sale Price of Interior Lot* *Unit of comparison may be Unit, Front Foot, or Square Foot.
CI = Sale Price Lot 1 per front foot = $350 = Sale Price Lot 4 per front foot $300
CI = 1.1667 or 16.67% Higher Than Interior Alternate Method:
Difference in Lots (1 and 4 Sale Price = $50 = .1667 (Corner Adjustment) Lot 4 Sale Price $300
Georgia Department of Revenue Revised 6-13-2018
The Cost Approach to Value 225
Case Problem – Corner Influence Calculation A recent study of sales was made and you find that Lot 1 sold for $37,500 and Lot 3 sold for $31,000. What is the indicated value for tax purposes for Lot 5 (standard depth 200')? SOLUTION:
Georgia Department of Revenue Revised 6-13-2018
The Cost Approach to Value 226
SUMMARY OF DEPTH AND CORNER INFLUENCE TABLES By using this direct comparison method, the appraiser finds how consistent the taxes within a community are and also how taxation in one community compares with competitive communities. Unit-foot depth and corner premium tables are often used to establish uniformity between assessments in valuations made by assessors for tax purposes. The purpose of such tables is to express equivalent values for one foot of frontage applicable to sites of varying depth. The standard area of land represented has one foot of frontage, in a uniform lot width, and a specified depth. For a lot of any stated type or location, a standard depth is established. It originally was fixed in most localities at 100 feet. For example, if the adopted standard depth is 100 feet, a lot 50 by 100 feet worth $2,175 would have a unit-front-foot value of $43.50. Another lot, 50 feet wide and 150 feet deep, might be worth $2,500, or $50 per front foot, with the same unit-front-foot value of $43.50 - that is, it would be equivalent in value to $43.50 per front foot for a depth of 100 feet, multiplied by a depth factor of 115%. The percentages are designed to provide a uniform system or measuring the additional value that accrues because of added depth. One of the first depth rules was the 4-3-2-1 rule, which described a system where the front quarter of a lot contributed 40% of the value; the second quarter, 30%; the third quarter, 20%; and the fourth quarter, 10%. Because this left too wide a margin for assessment purposes, the deficiency usually has been overcome by the establishment of more specific depth tables expressed in percentages for every foot, or at least for every 10 feet of depth, to reflect the conditions applicable in a certain locality or to certain types of property (residential, business, industrial, commercial). Similarly, corner influence (premium) tables have been developed for ad valorem tax purposes, to establish the amount by which the market value per unit foot of an inside lot is increased for a lot with a corner location. Such tables are also related to localities and types of land for which they are prepared. Appraisers should use extreme caution in using any standard depth or corner influence (premium) table. The use of such tables is a major cause of non-uniform assessments. To apply a table established for one neighborhood or community to another area is not good appraisal practice. The only depth tables that might be useful would be those specifically constructed for the community and neighborhood in which the appraised property is located. Assessors are required in some communities to use them to provide equalization.
Georgia Department of Revenue Revised 6-13-2018
The Cost Approach to Value 227
Use of Depth Tables, Odd Shapes, and Corner Influence Tables
Before using the tables and formulas presented in this chapter in appraising land (residential, commercial, industrial) in a given area, you must consider the following: TO FIND - DIVIDE Step 1: Determine the unit of comparison to be used. Since many
jurisdictions consider the value per foot front as the most equitable unit of comparison, we will use sale price per front foot. (Sale Price Front Feet = Sale Price per front foot unadjusted.)
Step 2: Determine the standard depth lot for the neighborhood or area you
are appraising. Remember the same depth factor may not be applicable for urban, suburban and rural areas for similarly used (developed) properties.
Step 3: Determine the market adjustments for odd-shaped lots, i.e. triangular
lots, 65/35 Rule. Remember the 65/35 rule is only a guide and should be checked against actual market sales in your jurisdiction.
Step 4: Determine the market adjustment if any, for corner influence. Step 5: Once the preceding 4 steps have been accomplished, within the
neighborhood we can determine what the adjusted sale price per front foot in the area is from the market as shown by the following formula:
Adjusted Sale Price per Front Foot = Sale Price No. of Front Feet X Depth Factor X 65/35 Rule X Corner Influence Factor Once the appraiser/assessor has estimated what lots are selling for in the area being appraised (revalued), then the appraiser/assessor can estimate the equitable value for all of the lots (sold and not sold) within the neighborhood using market information using the following steps: TO USE (MULTIPLY) Step 1: Determine the unit of comparison (Front Foot). Step 2: Determine the number of front feet in the subject being appraised.
(Use formula for odd-shaped lots where applicable.)
Georgia Department of Revenue Revised 6-13-2018
The Cost Approach to Value 228
Step 3: Multiply Step 2 by the adjusted sale price per front foot found in Step 5 of TO FIND.
Step 4: Multiply by Depth Factor for the subject being appraised from
established depth table. Step 5: Multiply by 65/35 Rule, if applicable. Step 6: Multiply by Corner Influence, if applicable. Step 7: Once the preceding 6 steps have been completed it indicates the
value of the subject being appraised as shown by the following. Estimated Value of Subject Property = No. of Front Feet x Adjusted (Estimated) Value per Front Foot x Depth Factor for Subject x 65/35 Rule x Corner Influence Factor
Georgia Department of Revenue Revised 6-13-2018
The Cost Approach to Value 229
Useful Formulas And Methods Used In Calculating Odd Areas Area of a Square Length * breadth or height. Area of a Cube # sq. ft. * height Area of a Rectangle Length * breadth or height Area of a Triangle Base * ½ altitude Area of a Parallelogram Base * altitude Area of a Trapezoid Altitude * ½ sum of the parallel sides Area of a Trapezium Divide into 2 triangles, total their area Circumference of a Circle Diameter * 3.1416 or radius * 6.283185 Diameter of a Circle Circumference * .3183 or sq. root of
area * 1.12838 Radius of a Circle Circumference * .0159055 Area of a Circle ╓y2 half diameter * half circumference-
square of diameter * .7854 or square of circumference * .07958
Side of Inscribed square Diameter * .7071 or circumference * .225
Area of Ellipse Product of the 2 diameters * .7854 Area of a parabola Base * 2/3 of altitude Surface of Sphere Diameter * Circumference Solidity of Sphere Surface * 1/6 diameter or
cube of diameter * .5236 or cube of radius * 4.1888 or cube of circumference * .016887
Diameter of Sphere Cube root of solidity * 1.2407 or Square root of surface * .56419
Circumference of Sphere Square root of surface * 1.772454 or Cube root of solidity * 3.8978
Georgia Department of Revenue Revised 6-13-2018
The Cost Approach to Value 230
Acreage and Areas Square Tracts of Land
Acres One Side Lin. Ft. Area Sq. Ft. 1/10 66.0 4,356 1/8 73.8 5,445 1/6 85.2 7,260 ¼ 104.4 10,890 1/3 120.5 14,520 ½ 147.6 21,780 ¾ 180.8 32,670 1.0 208.7 43,560 1 ½ 255.6 65,340 2.0 295.2 87,120 2 ½ 330.0 108,900 3.0 361.5 130,680 5.0 466.7 217,800
Surveyor’s Measures 7.92 inches 1-Link 25 Links 1-Rod 4-Rods 1-Chain 10 Sq. Chains 1-Acre 640 Acres 1-Sq. Mile 36 Sq. Miles or 6 Miles Sq. 1-Township
Georgia Department of Revenue Revised 6-13-2018
The Cost Approach to Value 231
To find the area of figures where all sides are equilateral --Square one side and multiply by the number on the right. #Sides Factor Triangle 3 0.433 Square 4 1.000 Pentagon 5 1.720 Hexagon 6 2.588 Heptagon 7 3.633 Octagon 8 4.828 Nonagon 9 6.181 Decagon 10 7.699 Hendecagon 11 9.365 Dodecagon 12 11.196
10 x 10 x 4.828=4828 To find the area of a circle Radius is squared * PI PI = 3.1416
10
10
10
10
10
10
10
10
Georgia Department of Revenue Revised 6-13-2018
The Cost Approach to Value 232
Case Problem: 4-3-2-1, 65/35 Rule, Corner Influence Below are five lots fronting on 53rd Street. The established value in this area is $150 per front foot for the standard depth of 100 feet. The following rules are used in this neighborhood to estimate land value:
"65-35" rule for triangular lots:
Use 35 percent of value of lot if the apex of a triangular lot is on the street.
Use 65 percent of value of lot if the apex of a triangular lot is at the rear.
Depth factors: Standard of Depth 100'. Interpolate for lots of greater or lesser depth.
Use the 4-3-2-1 Rule. Corner influences: Two lots (interior and corner) on 53rd Street sold. The interior lot sold for $9000. The corner lot sold for $9720. Determine the corner influence and apply it to the lot on Blackstone Avenue.
Calculate the value of these five lots using the above rules.
70’ 55’ 35’
115’95’ 100’
40’
35’ 40’ 25’
25’ 30’ 30’
30’
100’
70’
53 rd Street
B L A C K S T O N E A V E
D O R C H E S T E R A V E
Georgia Department of Revenue Revised 6-13-2018
The Cost Approach to Value 233
Georgia Department of Revenue Revised 6-13-2018
The Cost Approach to Value 234
Chapter 7 The Cost Approach Case Study Application
Georgia Department of Revenue Revised 6-13-2018
The Cost Approach to Value 235
Georgia Department of Revenue Revised 6-13-2018
The Cost Approach to Value 236
CASE STUDY PROBLEM Using the information found on the following pages and the necessary supplement materials, estimate the "Market Value" of the four (4) residences via the Cost Approach:
1. Estimate the land values using the appropriate sales for Area #1 using site (lot) method and Area #2 based on a front foot method.
2. Price the four houses using the appropriate cost pages.
Georgia Department of Revenue Revised 6-13-2018
The Cost Approach to Value 237
LAND VALUE WORKSHEET
AREA #1
STAGE COACH ROAD
12
13
14
15
16
17
18
19
20
9
8
7
6
5
4
3
2
1
150’
150’
150’
150’
150’
150’
150’
150’
150’ 150’
150’
150’
150’
150’
150’
150’
150’
137.40’
100’
100’
100’
100’
100’
100’
100’
99.54’
100’
100’
100’
100’
100’
100’
100’
100’
103.26’ 14’
85.96’ 105.52’
25’
85.96’
109.70’ 110.60’
SPIRIT CREEK RD.
2 $14,500 One Year Old Sale 5 $15,000 Current Year Sale 13 $14,500 One Year Old Sale 18 $15,000 Current Year Sale
Sales Data
Lot Sale Price Date
Stage Coach S/D-AREA#1 Site (Lot) Method
Georgia Department of Revenue Revised 6-13-2018
The Cost Approach to Value 238
LAND VALUE WORKSHEET AREA #2
Standard Depth 200’
What is the Front Foot Price for this Subdivision?
200’
200’
200’
202.63’
220.84’
239’
256.30’
205.51’
217.10’
235.21’
293.33’
200’
110’
115’ 115’
115’
115’ 115’
110’
110’
110’
111.50’
111.50’
108.57’
136’
49.98’
60’
110’
105’
105’
173.65’
156.79’
78.10’
83.98’
RIDGEWAY DRIVE 60’
9
8
10
11
12
13
14
27
28
29
9 $30,000-Current Year Sale 10 $30,000-Current Year Sale 28 $30,140-Current Year Sale 29 $31,020-Current Year Sale
Sales Data
Lot Sale Price/Date
Ridgeway S/D-AREA#2 Site (Lot) Method
Avg 229.92’ DF=1.054
Avg 247.65 DF=1.0864
Georgia Department of Revenue Revised 6-13-2018
The Cost Approach to Value 239
Georgia Department of Revenue Revised 6-13-2018
The Cost Approach to Value 240
Appendix
Georgia Department of Revenue Revised 6-13-2018
The Cost Approach to Value 241
COMPLETION DRILL 1
1. What are the seven criteria, by statute, the assessor must apply when determining fair market value of property?
(i) Existing zoning of property; (ii) Existing use of property (iii) Existing covenants or restrictions in deed dedicating the property to a particular use; (iv) Bank sales, other financial institution owned sales, or distressed sales, or any combination thereof, of comparable real property; (v) Decreased value of the property based on limitations and restrictions resulting from the property being in a conservation easement; (vi) Rent limitations, operational requirements, and any other restrictions imposed upon the property in connection with the property being eligible for any income tax credits described in subparagraph (B.1) of this paragraph or receiving any other state or federal subsidies provided with respect to the use of the property as residential rental property; provided, however, that such properties described in subparagraph (B.1) of this paragraph shall not be considered comparable real property for assessment or appeal of assessment of other properties; and (vii) Any other existing factors provided by law or by rule and regulation of the commissioner deemed pertinent in arriving at fair market value.
2. What are the three approaches to value?
a. Market b. Cost c. Income
3. What economic principle is the basis for the three approaches to value?
a. Substitution
4. What economic principle is the basis for the adjustment process in the market approach to value?
a. Contribution
5. What are the three steps in the cost approach to value? a. RCN – depreciation + land value
6. What are the three forms of depreciation?
a. Physical deterioration b. Functional obsolescence c. Economic obsolescence
7. What form of depreciation occurs outside the property?
a. Economic obsolescence
8. What is the first step in the appraisal process?
Georgia Department of Revenue Revised 6-13-2018
The Cost Approach to Value 242
a. Define the problem
9. At what point is it appropriate to average to arrive at the final value estimate? a. NEVER!
10. When is the cost approach the most appropriate approach to value?
a. No market properties b. Specialty properties c. When the improvement is new and is the highest and best use of the land
11. How many days does a taxpayer have to file a written appeal with the assessor?
a. 45
12. What are the three major components of a county budget? a. Schools b. Local agencies c. Bonded indebtedness
13. How is a mill (tax) rate calculated?
a. Budget divided by assessed value
14. How is a gross rent multiplier calculated? a. Sale Price divided by income (rent)
15. What is the assessor's responsibility relating to the property tax?
a. The fair, uniform and equitable valuation of all taxable property
Georgia Department of Revenue Revised 6-13-2018
The Cost Approach to Value 243
CIP Problem In September of the current year, construction of a new residence has begun in a residential subdivision. The appraiser has determined from the CAMA system that an improvement structure’s RCN is $225,000. The property was revisited in December of the current year. According to the reviewing appraiser, the improvement structure is 62% complete using the percentage completion guide on Jan 1 of the year the digest is being compiled. The CAMA system has allowed 1% physical depreciation. The land value has been determined to be $25,000. According to the Appraiser procedures Manual and absent any other market data for construction in progress real property what assessed values and digest class/strata for the land and building should be placed on the digest? RCN $225,000 * .01 = $2,250 $225,000 - $2,250 = $222,750 $222,750* .62 CIP% Jan 1 = $138,105 $138,105* .75 MKT Risk = $103,579 FMV Structure Land $25,000 Digest Values and Class $103,579 *.40 assessed value = $41,432 R1 $25,000*.40assessedvalue=$10,000R3
Georgia Department of Revenue Revised 6-13-2018
The Cost Approach to Value 244
Calculation Worksheet: AREA OF RESIDENCE TBA * Sketch Label’s Area Factor = Total Heated (Living) Square Feet 1872 * 1.00 Area Factor = 1872 Heated Area TBA 1872 Ground Floor Area PERIMETER OF RESIDENCE 62 + 32 + 34 +4 +28 +28 = 188 Perimeter SIZE-SHAPE RATIO 1872 / 188 = 9.957 or 10 SIZE-SHAPE FACTOR .94 COMPUTATION OF COST
Base cost per square foot for residence $48.97 Exterior Wall Siding Factor Adjustment *1.08 Adjusted Price Per Square Foot $52.89 1872 Heated Area square feet * $52.89 per square foot =
$99,010
TBA 1872 / 188 perimeter =9.9 or 10 Ratio Modified by size-shape factor * .94 Modified residence cost $93,069 Plus plumbing + 4,000 Plus electric + 1,680 Plus heat pump + 4,268 Plus porch + 3,086 Plus deck + 3,600 Plus garage + 17,508 Plus Utility + 5,400 Subtotal with Addons $132,611 Quality Grade Adjustment * 1.00 or (100) Grade Total estimated reproduction cost new $132,611
Georgia Department of Revenue Revised 6-13-2018
The Cost Approach to Value 245
Calculation Worksheet: TBA = HEATED AREA OF GROUND FLOOR ONLY 44 * 50 = 2,200 Ground Floor Area HEATED AREA OF RESIDENCE TBA * Sketch Label’s Story Height Factor = Total Heated (Living) Square Feet 44 * 50 = 2,200 * 1.50 Area factor = 3,300 PERIMETER OF RESIDENCE 44 + 50 + 44 + 50 = 188 SIZE-SHAPE RATIO 2,200 / 188 = 11.7 or 12 SIZE-SHAPE FACTOR .90 COMPUTATION OF COST
Base cost per square foot for residence $48.93 Exterior Wall Siding Factor Adjustment *1.08 Adjusted Price Per Square Foot $52.84 (Story Height) Cost Factor * Adjusted Price Per Square Foot
*.95
Adjusted Price Per Square Foot $50.20 3,300 Heated Area square feet * $50.20 per square foot =
$165,660
TBA 2,200 / 188 perimeter =11.7 or 12 Ratio Modified by size-shape factor * .90 Modified residence cost $149,094 Plus plumbing + $6,000 Plus electric + $2,280 Plus heat pump + $10,725 Plus porch + $8,265 Plus deck + $1,440 Plus garage + $14,400 Subtotal With Addons $192,204 Quality Grade Adjustment 1.25 Total estimated reproduction cost new $240,255 Neighborhood/Location Market Adjustment 1.15 Fair Market Value of Structure $276,293
Georgia Department of Revenue Revised 6-13-2018
The Cost Approach to Value 246
Calculation Worksheet: TBA = HEATED AREA OF GROUND FLOOR ONLY 48 * 60 = 2,880 Ground Floor Area HEATED AREA OF RESIDENCE TBA * Sketch Label’s Area Factor = Total Heated (Living) Square Feet without Bonus Room 2,880 * 1.75 Area Factor = 5,040 Total Heated (Living) Area without Bonus Room PERIMETER OF RESIDENCE 48 + 60 + 48 + 60 = 216 SIZE-SHAPE RATIO 2,880 / 216 = 13.33 or 13 SIZE-SHAPE FACTOR .88 COMPUTATION OF COST
Base Cost per square foot for residence $53.45 Exterior Wall Siding Factor Adjustment *1.01 Adjusted Price Per Square Foot $53.98 (Story Height) Cost Factor * Adjusted Price Per Square Foot
*.92
Adjusted Price Per Square Foot $49.66 5,040 Heated Area square feet * $49.66 per square foot = (Bonus room area should be included for calculation of heat pump only)
Plus plumbing 6 * $1,350 + $8,100 Plus electric + $2,980 Plus heat pump 5,040+480=5,520 * $3.10 = + $17,112 Plus porch 360 * $29.97 = + $10,789 Plus deck 588 * $12.95 = + $7,615 Plus garage $31 * 624 = + $19,344 Subtotal with addons $296,459 Quality Grade Adjustment *1.25 Total estimated reproduction cost new $370,574
Georgia Department of Revenue Revised 6-13-2018
The Cost Approach to Value 247
Calculation Worksheet: TBA = HEATED AREA OF GROUND FLOOR ONLY 1 Story Sections 360 + 360 = 720 1.5 Story Sections 2,496 720 + 2,496 = 3,216 TBA AREA OF RESIDENCE TBA * Sketch Label’s Area Factor = Total Heated Square Feet One Story Sections 360 + 360=720 * StHt Factor 1.00 = 720 Heated 1.5 Story Section 2,496 * Area Factor 1.50 = 3,744 Heated 720 + 3,744 = 4,464 Total Heated (Living) Area PERIMETER OF RESIDENCE 52 + 16 + 15 + 24 + 15 + 8 + 52 + 8 + 15 + 24 + 15 + 16 = 260 SIZE-SHAPE RATIO 3,216 / 260 = 12.36 or 12 SIZE-SHAPE FACTOR .90 COMPUTATION OF COST
1 Story Sections 360 + 360 = 720 Base cost per square foot for residence $48.93 Exterior Wall Siding Factor Adjustment *1.00 Adjusted Price Per Square Foot $48.93 720 Heated Area square feet * $48.93 per square foot =
$35,230
1.5 Story Section 2,496 * 1.50 = 3,744 Base cost per square foot for residence $48.93 Exterior Wall Siding Factor Adjustment *1.00 Adjusted Price Per Square Foot $48.93 (Story Height) Cost Factor * Adjusted Price Per Square Foot
*.95
Adjusted Price Per Square Foot $46.48 3,744 Heated Area square feet * $46.48 per square foot =
$174,021
1 Story Sections Value + 1.5 Story Section Value
$209,251
TBA 3,216 / 260 perimeter = 12.36 or 12 Ratio Modified by size-shape factor *.90 Modified residence cost $188,326 Plus plumbing + 6,000 Plus electric + 2,280 Plus heat pump + 14,508 Plus porch + 10,028 Plus garage + 14,426 Subtotal of with addons $235,568 Quality Grade Adjustment *1.45 or 145 Total estimated reproduction cost new $341,574 Neighborhood/Location Market Adjustment 1.15 Fair Market Value of Structure $392,810
Georgia Department of Revenue Revised 6-13-2018
The Cost Approach to Value 248
Residential Calculation Case Study
34
52 18 6
27
34
Base Cost $68.09 (Includes 5 plumbing fixtures) 1 Additional Fixture @ $450 1 Rough in @ $230 Forced Hot and Cool Air @ $2 per sq ft Hard wood Floors @ $3 per Sq Ft Fireplace @ $2000 Open Porch @ $10 per sq ft
Physical Depreciation @ 2% Functional Obsolescence @ 1% Location/Neighborhood Modifier for structure being on Lake of 20% Land Value 40,000 (lake front lot)
Consider the following sales data: 1. All sales took place last month. 2. All properties are single-family three-bedroom houses. 3. Sales 1, 2, and 3 properties have the same significant attributes including a single car
garage except that sale 1 has a finished basement and the others do not. 4. Sales 4, 5, 6, and 7 have the same significant attributes including a double car garage
except that sale 4 has a finished basement and the others do not. What lump-sum dollar amount does a finished basement contribute to the value of a single-family house in the market represented by these properties?
Sale No. Sale Price 1 $72,800 2 $70,000 3 $70,100 4 $75,800 5 $73,000 6 $73,050 7 $73,100
Solution: Sale (basement) – sale (no basement) = basement value. Stratum 1 (houses with single car garage) (Sale 1 – Sale 2) 72,800-70,000=2800 (Sale 1 – Sale 3) 72,800-70,100=2700 Stratum 2 (houses with double car garages) (Sale 4 – Sale 5) 75,800-73,000=2800 (Sale 4 – Sale 6) 75,800-73,050=2750 (Sale 4 – Sale 7) 75,800-73,100=2700
A finished basement contributes between $2,700 and $2,800 to the value of a single-family house in this market.
Georgia Department of Revenue Revised 6-13-2018
The Cost Approach to Value 250
Pricing Commercial Structures
5 Story Office Building (Use Code 9149) Brick on Concrete Block Frame Wall Height 11’ Central Heating & AC (qc3) Typical Plumbing Fixtures Carpet & Vinyl Tile Flooring (qc3) What is the value of the Structure?
Built-as code/Description 9149 - Office Bldg Used-as code/Description 9149 - Office Bldg Base Cost $89.14 Construction (framing) factor adjustment *1.00 (Story Height) Cost Factor * Adjusted Price Per Square Foot
*5.03
Adjusted Price Per Square Foot $448.37 TBA 1,584 * $448.37 = $710,218 TBA 1,584 / 160 perimeter = 9.9 or 10 Ratio Modified by area perimeter factor * 1.08 Wall height = 11’ and factor = * 1.02 Modified building cost $782,376 TBA 1,584 * 5.00 STHT Factor = Heated Area = 7,920
Plus heating type - Area 7,920 * 3.78 = + $ 29,938 Plus flooring type – Area 7,920 * 2.44 = + $ 19,325 Subtotal $831,639 Quality Grade Adjustment *1.20 Total estimated reproduction cost new $997,967
44
36
44
ST5 36
Georgia Department of Revenue Revised 6-13-2018
The Cost Approach to Value 251
Pricing Commercial Structures
1 Story McDonalds Restaurant (Use Code 9149) Brick on Concrete Block Frame Wall Height 12’ Central Heating & AC (qc3) Good Plumbing Fixtures with tiled walls Ceramic Tile Flooring (qc3) What is the value of the Structure?
Built-as code/Description 9040 – Restaurant Fast Food Used-as code/Description 9040 – Restaurant Fast Food Base Cost $106.12 Construction (framing) factor adjustment 1.00 (Story Height) Cost Factor * Adjusted Price Per Square Foot
1.00
Adjusted Price Per Square Foot $106.12 TBA 4,905 * $106.12 = $520,519 TBA 4,905 / 308 perimeter = 15.93 or 16 Ratio Modified by area perimeter factor * 1.03 Wall height = 12’ and factor = * 1.00 Modified building cost $536,135 TBA 4,905 * 1.00 STHT Factor = Heated Area = 4,905
Plus heating type - Heated Area 4,905 *3.53 =
+ $17,315
Plus flooring type – Heated Area 4,905 * 6.80 = + $33,354 Subtotal $586,804 Quality Grade Adjustment *1.30 Total estimated reproduction cost new $762,845
45
109
45
ST1
109
Canopy
Georgia Department of Revenue Revised 6-13-2018
The Cost Approach to Value 252
Pricing Commercial Structures
1 Story Mini Warehouse (Use Code 9117) Galvanized Metal Exterior Wall with Steel Framing Wall Height 7’ Climate Controlled Central Heating & AC (qc3) Concrete Flooring (qc3) What is the value of the Structure?
Built-as code/Description 9117 – Mini Warehouse Used-as code/Description 9117 – Mini Warehouse Base Cost $26.38 Construction (framing) factor adjustment .91 (Story Height) Cost Factor * Adjusted Price Per Square Foot
1.00
Adjusted Price Per Square Foot $24.00 TBA 10,000 * $24.00 = $240,000 TBA 10,000 / 500 perimeter = 20 or 20 Ratio Modified by area perimeter factor * 1.04 Wall height = ’ and factor = * .89 Modified building cost $222,144 TBA 10,000 * 1.00 STHT Factor = Heated Area 10,000
Plus heating type - Heated Area *3,78 = + $37,800 Plus flooring type – Heated Area * .61 = + $6,100 Subtotal $266,044 Quality Grade Adjustment *1.00 Total estimated reproduction cost new $266,044
50 50
200
ST1
200
Georgia Department of Revenue Revised 6-13-2018
The Cost Approach to Value 253
COMPLETION DRILL 2
DEPRECIATION CONCEPTS
1. Depletion is the loss of value due to consumption, such as mining and timber removal.
2. Flaking paint on a bedroom ceiling is an example of curable physical deterioration.
3. Another name for the straight-line depreciation method is the overall (age-life) method.
4. Effective age is the age of a building indicated by its observed condition.
5. Economic obsolescence, unlike functional obsolescence and physical deterioration, is generally considered incurable
6. The objective of the cost approach is to measure value, not cost.
7. The observed condition and engineering breakdown methods require separation of
elements of accrued depreciation into various categories.
8. The difference between reproduction or replacement cost new of a property and its market value as of the date of the appraisal is termed accrued depreciation.
9. Remaining economic life is the number of years from the date of appraisal to the date when
the building becomes economically valueless.
10. Curable physical deterioration is also known as deferred maintenance.
11. The depreciation of short-lived items, as treated under incurable physical depreciation is also known as curable physical postponed.
Georgia Department of Revenue Revised 6-13-2018
The Cost Approach to Value 254
Case Problem: Depreciation Calculated from Age Life Method Effective Age of Structure = 8 years Total Economic Life = 60 years Reproduction or replacement cost new = $300,000 What is the age life ratio? 8 / 60 = .1333 or .13 What is the accrued depreciation amount? $300,000 x .13 = $39,000 What is the depreciated value of the structure? $300,000 - $39,000 = $261,000
Georgia Department of Revenue Revised 6-13-2018
The Cost Approach to Value 255
12. DEPRECIATION CALCULATED FROM THE MARKET
You are developing the cost approach for the appraisal of a single family residence. You have calculated the replacement cost new and are now in the process of determining the amount of accrued depreciation. You find two properties that have sold which are similar to the subject and which have a replacement cost that is well documented. You have the following information for each sale:
Sale 1 Sale 2 Sale Price $145,000 $153,000 Replacement Cost New $150,000 $160,000 Land Value $25,000 $25000
Your market analysis (in the first step of the cost approach) has established a land value of $25,000 per site for the subject and the comparable properties. Replacement Cost New for the subject property is $155,000. PROBLEM:
Using the information above, determine the percent of depreciation applicable to the subject property and the value of the subject based on the Sales Comparison Data Method of
determining depreciation.
Solution:
Sale 1 Sale 2 Sale Price $145,000 $153,000 Less Land Value -$25,000 -$25000 Market Value of Improvements
$120,000 $128,000
Replacement Cost New $150,000 $160,000 Less Market Value of Improvements
-$120,000 -$128,000
Estimated Depreciation $30,000 $32,000 Converted to Percentage $30,000/$150,000
Depreciation Case Problem Solution: The cost of replacing a restaurant has been estimated at $61,000. Upon your inspection, you noticed the following necessary repairs.
Replace cracked glass $ 410 Replace roof covering (8,000 sq. ft. x $0.20/sq. ft) $1,600 Replace flooring (6,500 sq. ft x $.031/sq. ft.) $2,015 Replace wall covering $1,250
$5,275 The building was built 12 years ago; its effective age is 15 years and its remaining economic life is 45 years. Forty percent of the building represents the basic structure and the land value is $13,000. What is the amount of physical deterioration to the basic structure of this building? Effective Age + Remaining Economic Life = Total Economic Life 15 + 45 = 60 Effective Age/Total Economic Life = Depreciation 15/60 = .25 RCN $61,000 x .40 = $24,400 Basic Structure x .25 = $6,100 Depreciation to Basic Structure What is the total value of the property? 410 + 1,600 + 2,015 + 1,250 = $5,275 Curable Physical and Incurable Physical (Short Lived) Depreciation $5,275 + $6,100 = $11,375 Total Physical Deterioration
$61,000 – 11,375 = $49,625 + $13,000 Land = $62,625 Total Value of Property
Georgia Department of Revenue Revised 6-13-2018
The Cost Approach to Value 258
COMPLETION DRILL 3
1. What are 5 elements of comparison appraisers consider when determining comparability of sites?
a. Location b. Date of sale c. Economic trends and factors d. Physical characteristics e. Conditions of sale
2. What is the most important element of comparison?
a. Location, Location, Location
3. What are the most common units of comparison used in valuing land? a. Square foot b. Front Foot c. Acre/section d. Site e. Units Buildable
4. The best unit of comparison for valuing the land of a retail store requiring substantial display
area is? a. Front foot
5. How many square feet in an acre?
a. 43,560
6. What types of properties would utilize units buildable as a unit of comparison? a. Properties of similar size that can be developed to different degrees of density
7. List three types of transactions that would disqualify a sale from being considered for use
in an appraisal? a. Sales between family members or affiliated parties b. Original foreclosure transaction between lender and borrower c. Individual to religious or charitable organization
8. Adjustments are always made to the comparable property never the subject property.
9. Adjustments are made for differences between the subject and comparable properties.
10. In the reconciliation process of the appraisal, the appraiser never averages the value indications of the comparable properties into a single estimate of value.
Georgia Department of Revenue Revised 6-13-2018
The Cost Approach to Value 259
LAND ADJUSTMENTS: PERCENTAGES Market Comparison – Most Reliable Method
You must appraise the land value of ninety acres of grazing land, located north of the city. The land is flat, making it easy to maintain. The following market information pertains to the area:
Land west of the city is 10 percent less valuable than land north of the city due to bad roads; land south of the city is 5 percent less valuable than land north because of the roadways. Flat land sells for 5 percent more than hilly land. Demand for land has increased at a rate of 8 percent per year over the past three years, resulting in a corresponding increase in value
You have found the following land sales around the city:
Sale#1 Sale#2 Sale3 Sale#4 Location South North West South No. Of Acres 100 90 95 120 Topography Hilly Flat Hilly Flat Sale Date 3 Years 1 Year 6 Months 1 Year Sale Price $150,000 $165,000 $160,000 $205,000
Subject Sale #1 Sale#2 Sale#3 Sale#4
Sale Price 150,000 165,000 160,000 205,000 90 #Acres 100 90 95 120 Date of Sale 3 yrs 1 yr 6 mths 1 yr Price/Acre 150,000/100
1500 165,000/90
1833 160,000/95
1684 205,000/120
1708 Time Adjust 8%*3 yrs
+.24 8%*1 yr
+.08 8%* ½ yr
+.04
8%*1 yr +.08
Time Adjusted
Pr/Ac
1.24*1500 1,860
1.08*1833 1,980
1.04*1684 1,751
1.08*1708 1,845
Other Adjustments
North Location South +.05
North 0
West +.10
South +.05
Flat Topography Hilly +.05
Flat 0
Hilly +.05
Flat 0
Net Adjustment
+.10 0 +.15 +.05
Adjusted Value/Acre
1.10x1860 2,046
0 1,980
1.15*1751 2,014
1.05*1845 1,937
Sale #2 is most comparable due to least number of adjustments. Indicated value of subject property:
1980*90=178,200
Georgia Department of Revenue Revised 6-13-2018
The Cost Approach to Value 260
SALES COMPARISON APPROACH Most Reliable Method
Your assignment is to appraise Lot 40 in the Pine Ridge Subdivision, a premium subdivision located near the University of Georgia. The lot has good access, a campus view, typical amenities, and is adjacent to a greenbelt. It is typical size. An analysis of land sales in this area indicated that lots which have a view of the campus command a $10,000 premium. In addition, lots on (adjacent to) the greenbelt are worth $6,000 more than lots which are not. The lots are sold on a per sited basis. High demand for lots in this area resulted in a 1% per month increase in value over the last three years. All sales involved typical market conditions. The following sales occurred in the Pine Ridge Subdivision:
Sale#1 Sale#2 Sale3 Sale#4 Location Pine Ridge Pine Ridge Pine Ridge Pine Ridge Size Typical Large Typical Typical Amenities Typical Typical Typical Typical Greenbelt No Yes No Yes View Typical Campus Campus Typical Sale Date 2 mos. Ago 6 mos. Ago 3 mos. ago Current Sale Price $77,000 $86,000 $78,000 $80,000
Subject Sale #1 Sale#2 Sale#3 Sale#4
Sale Price 77,000 86,000 78,000 80,000 Date of Sale 2 mths 6 mths 3 mths Current Time
Adjustment 1%*2 mths
+.02 1%*6 mths
+.06 1%* 3 mths
+.03 0
Time Adjusted Price Lot
1.02*77,000 78,540
1.06*86,000 91,160
1.03*78,000 80,340
0 80,000
Other Adjustments
Typical Size 0 0 0 0 Typical Amenities 0 0 0 0
Yes Greenbelt No +6,000
Yes 0
No +6,000
Yes 0
Campus View Typical +10,000
Campus 0
Campus 0
Typical +10,000
Net Adjustment
+16,000 0 +6,000 +10,000
Adjusted Sale Price
78,540+16,000 94,540
91,160+0 91,160
80,340+6,000 86,340
80,000+10,000 90,000
Sale # 2 is most comparable due to the least number of adjustments. Subject value is 91,160
Georgia Department of Revenue Revised 6-13-2018
The Cost Approach to Value 261
LAND VALUATION You are appraising a residential lot in an average neighborhood. The lot is level and has sewer lines, a water hookup, and on a paved street. The lot is rectangular but is more narrow and shallow than typical lots in the neighborhood. You have found four comparable sales of vacant lots in the subject neighborhood and have set the adjustments as follows:
Sale#1 Sale#2 Sale3 Sale#4 Sale Price $6,400 $7,645 $7,365 $9,600 Date of Sale 28 Months 27 Months 11 Months 24 Months Location Equal Equal Equal Superior
20% Frontage Superior
(5%) Superior
(10%) Superior
(5%) Superior
(5%) Depth Superior
(15%) Superior
(20%) Superior
(15%) Superior
(5%) Shape Inferior
(5%) Inferior
(5%) Inferior
(5%) Equal
Topography Inferior (10%)
Inferior (5%)
Inferior (10%)
Equal
Sewer, Water, Street
Equal Equal Equal Equal
In this market, the value of land has increased one percent for every month in the past four years. Estimate the value for the subject site.
Subject Sale #1 Sale#2 Sale#3 Sale#4 Sale Price 6,400 7,645 7,365 9,600 Date of Sale 28 mths
27 mths 11 mths 24 mths
Time Adjust 1%*28 mths
+.28 1%*27 mths
+.27 1%*11 mths
+.11
1%*24 +.24
Time Adjusted Sale Price
1.28*6,400 8,192
1.27*7,645 9,709
1.11*7,365 8,175
1.24*9,600 11,904
Other Adjustments
AvgNeighbhood Location Equal 0
Equal 0
Equal 0
Superior -.20
Narrow Frontage Superior -.05
Superior -.10
Superior -.05
Superior -.05
Shallow Depth Superior -.15
Superior -.20
Superior -.15
Superior -.05
Rectangular Shape Inferior +.05
Inferior +.05
Inferior +.05
Equal 0
Typical Topography Inferior +.10
Inferior +.05
Inferior +.10
Equal 0
Sewer & Water Sewer, Water, Street
Equal 0
Equal 0
Equal 0
Equal 0
Net Adjustment
-.05 (-410)
-.20 (-1,942)
-.05 (-409)
-.30 (-3571)
Adj. Values 7,782 7,767 7,766 8,333 Indicated value of subject range is 7,766 to 7,782 In this scenario sale number 4 has the least number of adjustments. However the adjustment for location is very large and may not be the best comparable
Georgia Department of Revenue Revised 6-13-2018
The Cost Approach to Value 262
Suggested Solution
BASE LOTS RANGE
Sale # Size Location Sale Price
1 100 x 250 Interior $75,900
2 100 x 250 Interior $76,000
3 100 x 250 Interior $76,100
$Adjustment Formula: Sale with Different Characteristic – Base Lot Sale = Adjustment
Factor Adjustment Formula (Additive): Adjustment / Base Lot Sale
Factor Adjustment Formula (Multiplicative): Sale with Different Characteristic / Base Lot Sale
River – Compare Sale #5 with Sales #1 – 3
Base Lot
Sale #
Sale #5 Minus Base Lot Sales
Additive Adjustment
Additive
Factor
Multiplicative
Factor
1 $90,000 - $75,900 $14,100.00 0.19 1.19
2 $90,000 - $76,000 $14,000.00 0.18 1.18
3 $90,000 - $76,100 $13,900.00 0.18 1.18
Excess Width – Compare Sale #4 with Sales # 1 - 3
Base Lot
Sale #
Sale #4 Minus Base Lot Sales
Additive Adjustment
Additive
Factor
Multiplicative
Factor
1 $85,750 - $75,900 $9,850.00 0.13 1.13
2 $85,750 - $76,000 $9,750.00 0.13 1.13
3 $85,750 - $76,100 $9,650.00 0.13 1.13
Indicated adjustment for River - $ 14,000
Indicated adjustment for Excess Width + $ 9,750
Indicated Base Lot Value $ 76,000
Excess Width on River
$76,000+$23,750 ($9,750+$14,000) = $99,750
Georgia Department of Revenue Revised 6-13-2018
The Cost Approach to Value 263
LAND VALUATION PROBLEM You are estimating the value of a 50-acre parcel currently used for agricultural purposes. It is zoned for residential development and is in the path of residential growth. You have no vacant land sales of undeveloped tracts this large but you know from the market sales of developed properties that, typically, residential building sites sell for $12,500 in this area. Zoning will allow two residences, per acre. From contractors and developers you have determined the following costs are typical: Discount rate of 12% and a sell out period of 5 years Overhead and sales expenses $2400/lot Site development $3000/lot Profit $1,250/lot Problem: (1) What is the highest and best use of the land?
(2) What is the value of the land per acre? (3) What value will you enter on the digest?
20 x $12,500 x .8929 = $223,225
20 x $12,500 x .7972 = $199,300
20 x $12,500 x .7118 = $177,950
20 x $12,500 x .6355 = $158,875
20 x $12,500 x .5674 = $141,850
Present Value of estimated sales proceeds $901,200 Site development 100 lots @ $3,000 = $300,000 Overhead and sales expenses 100 lots @ $2,400 = $240,000 Profit 100 lots @ $1,250 = $125,000 Total Expenses $665,000 Total present worth expenses $665,000 x .8929 = $593,779 Net present worth of land $901,200 - $593,779= $307,421
1. Based on its zoning and growth trends the highest and best use of the land is a residential development.
2. Value per acre is $307,421 / 50 Acres = $6,148 3. Because of its current use for agricultural pursuits you probably use price per acre based
on comparable agricultural property values. You would need to see if the owner had filed for conservation use or preferential use.
Georgia Department of Revenue Revised 6-13-2018
The Cost Approach to Value 264
ALLOCATION METHOD
A. Sale#1 sold for $120,000, and Sale#2 sold for $175,000. There are no comparable sales in the area, but a recent study showed the typical land value ratio for this neighborhood to be 26% for homes under $150,000 and 18% for homes over $150,000. What is the land value indicated for Sale#2?
B. A certain single family residential property sold for $150,000. Your analysis shows that the ratio of land to improvement is 1:4. What is the indicated land value?
Solution:
A. Since sale #2 is greater than $150,000, its land to value ratio is 18% according to the recent study. $175,000*.18=$31,500
B. The land value can be found by using the land to improvement ratio to allocate the
appropriate part of the $150,000 sales price to the land. For every one dollar of land value there would be four dollars of improvement value, for a total of five dollars. Therefore, one the five total parts is land.
$150,000/5=$30,000 or 1/5=.2 Find % attributable to land .2*$150,000 Multiply % times value $30,000 Land value
Georgia Department of Revenue Revised 6-13-2018
The Cost Approach to Value 265
COMMERCIAL SITE VALUATION PROBLEM (Abstraction and Allocation)
In analyzing the local market and from interviews with the buyer and seller, you have gathered the following information:
1. Subject property is a retail store and sold recently for $250,000. The selling price was confirmed by both buyer and seller.
2. The buyer estimates reproduction cost new of the store to be $225,000 and feels there is accrued depreciation in the amount of $20,000.
3. The typical land to building ration for properties of this type in this area is 1:4. 4. Similar lots in the area have sold recently in the $49,000 to $53,000 range.
Problem:
A. What is the site value of the subject using:
(1) Abstraction Sale Price $250,000 RCN $225,000 Depreciation - 20,000 Building Value $205,000 Less building value $205,000 Indicated site value $ 45,000 (2) Allocation 1:4 1+4=5 Total parts $250,000/5=$50,000 Land value or 1/5=20% $250,000*.20=$50,000
B. What value will you use in your appraisal report and why?
A. $50,000 using allocation method B. Market information indicates sale range of $49,000-$53,000 C. Abstraction may have a weakness due to the fact that the buyer may not be
qualified to estimate depreciation
Georgia Department of Revenue Revised 6-13-2018
The Cost Approach to Value 266
SITE VALUE - UNIT OF COMPARISON You are appraising an 8-acre parcel (350,000 sq. feet) in an area zoned for multi-family development up to six stories. The subject property is close to a recreation area and a zoning variance permits the construction of a 10 story apartment building on sites of 350,000 sq. feet. In conforming with existing zoning a 10 story 450 unit apartment has been designed for the subject site. The following recent land sales have been improved with 6-story apartments which meet zoning requirements in the area. None have the benefit of the subjects zoning variance. Problem: Estimate the land value of the subject parcel and explain how you arrived at it.
Subject: 350,000 square feet 450 unit apartment Square foot method: $1.00*350,000=$350,000 Units buildable: $1,000*450=$450,000 Using the square foot and units buildable as units of comparison it appears that $1.00 per square foot and $1,000 per unit are representative of the current market. Applying each to the subject property $350,000 and $450,000 are the estimated values. The value of $450,000 is determined to be the most accurate estimate based on the zoning variance allowing a greater density of development.
Georgia Department of Revenue Revised 6-13-2018
The Cost Approach to Value 267
SOLUTION: Using Interpolation, find the depth factors for the following: Problem 1 Using 120 feet standard depth table, what is the depth factor for 70 feet? Solution: 10/30=.3333*.20=.0667+.3000+.4000=.7667
Problem 2 Using 160 feet standard depth table, what is the depth factor for 90 feet? Solution: 10/40=.2500*.20=.0500+.3000+.4000=.7500
Georgia Department of Revenue Revised 6-13-2018
The Cost Approach to Value 268
Problem 3: Using 200 feet standard depth table, what is the depth factor for 218 feet? Solution: 18/50’=.3600*.09=.0324+.1000+.2000+.3000+.4000=1.0324
Problem 4: Using 250 feet standard depth table, what is the depth factor for 195 feet? Solution:
7.5/62.50=.12*.10=.0120+.2000+.3000+.4000=.9120
Georgia Department of Revenue Revised 6-13-2018
The Cost Approach to Value 269
USAGE OF TABLES AND RULES Below are five lots fronting on 53rd Street. The established value in this area is $150 per front foot for the standard depth of 100 feet. The following rules are used in this neighborhood to estimate land value:
"65-35" rule fore triangular lots: Use 35 percent of value of lot if the apex of a triangular lot is on the street. Use 65 percent of value of lot if the apex of a triangular lot is at the rear.
Depth factors: Standard of Depth 100'. Interpolate for lots of greater or lesser depth. Use the 4-3-2-1 Rule. Corner influences: Two lots (interior and corner) on 53rd Street sold. The interior lot sold
for $9000. The corner lot sold for $9720. Determine the corner influence and apply it to the lot on Blackstone Avenue.
PROBLEM:
Calculate the value of these five lots using the above rules. Solution: Usage of Tables and Rules
A. 70*150=10,500*1.054=11,067*1.08=11,952 B. 55*150=8250*.98=8085 C.
a. 35*150=5250 b. 40*150*.65=3900 c. 5250+3900=9150
D. a. 40*150=6000*.35=2100 b. 25*150=3750 c. 2100+3750=5850
E. a. 30*150=4500 b. 30*150=4500*.65=2925 c. 4500+2925=7425
70’ 55’ 35’
115’95’ 100’
40’
35’ 40’ 25’
25’ 30’ 30’
30’
100’
70’
53 rd Street
B L A C K S T O N E A V E
D O R C H E S T E R A V E
Georgia Department of Revenue Revised 6-13-2018
The Cost Approach to Value 270
Georgia Department of Revenue Revised 6-13-2018
The Cost Approach to Value 271
You have found the following land sales around the city:
Sale#1 Sale#2 Sale#3 Sale#4 Factor1 No. Of Acres Factor2 Sale Date Sale Price
Subject Sale #1 Sale#2 Sale#3 Sale#4
Sale Price #Acres Date of Sale Price/Acre Time Adust Time Adjusted
Pr/Ac
Other Adjustments
Factor1 Factor2 Factor3 Factor4 Net
Adjustment
Adjusted Value/Acre
Georgia Department of Revenue Revised 6-13-2018
The Cost Approach to Value 272
Georgia Department of Revenue Revised 6-13-2018
The Cost Approach to Value 273
Calculation Worksheet: Problem Page 71 TBA = HEATED AREA OF GROUND FLOOR ONLY HEATED AREA OF RESIDENCE TBA * Sketch Label’s Area Factor = Total Heated (Living) Square Feet PERIMETER OF RESIDENCE (Heated Area Only) SIZE-SHAPE RATIO SIZE-SHAPE FACTOR COMPUTATION OF COST
Base Cost per square foot for residence $ Exterior Wall Siding Factor Adjustment * Adjusted Price Per Square Foot $ (Story Height) Cost Factor * Adjusted Price Per Square Foot
*
Adjusted Price Per Square Foot $ heated square feet * $ per square foot =
$
TBA / perimeter = or Ratio Modified by size-shape factor * Modified residence cost $ Plus plumbing + Plus electric + Plus heat pump + Wood deck + Plus porch + Plus utility + Plus garage + Subtotal with Addons $ Quality Grade Adjustment * Total estimated reproduction cost new $
Georgia Department of Revenue Revised 6-13-2018
The Cost Approach to Value 274
Georgia Department of Revenue Revised 6-13-2018
The Cost Approach to Value 275
Calculation Worksheet: Problem Page 73 TBA = HEATED AREA OF GROUND FLOOR ONLY HEATED AREA OF RESIDENCE TBA * Sketch Label’s Area Factor = Total Heated (Living) Square Feet PERIMETER OF RESIDENCE SIZE-SHAPE RATIO SIZE-SHAPE FACTOR COMPUTATION OF COST
Base Cost per square foot for residence $ Exterior Wall Siding Factor Adjustment * . Adjusted Price Per Square Foot $ (Story Height) Cost Factor * Adjusted Price Per Square Foot
*
Adjusted Price Per Square Foot $ heated square feet * $ per square foot =
$
TBA / perimeter = Ratio Modified by size-shape factor * . Modified residence cost $ Plus plumbing + $ Plus electric + $ Plus heat pump + $ Plus porch + $ Plus deck + $ Plus garage + $ Subtotal With Addons $ Quality Grade Adjustment . Total estimated reproduction cost new $ Neighborhood/Location Market Adjustment Market Value of Structure $
Georgia Department of Revenue Revised 6-13-2018
The Cost Approach to Value 276
Georgia Department of Revenue Revised 6-13-2018
The Cost Approach to Value 277
Calculation Worksheet: Problem Page 77 TBA = HEATED AREA OF GROUND FLOOR ONLY HEATED AREA OF RESIDENCE TBA * Sketch Label’s Area Factor = Total Heated (Living) Square Feet PERIMETER OF RESIDENCE SIZE-SHAPE RATIO SIZE-SHAPE FACTOR COMPUTATION OF COST
Base cost per square foot for residence $ Exterior Wall Siding Factor Adjustment * . Adjusted Price Per Square Foot $ (Story Height) Cost Factor * Adjusted Price Per Square Foot
*.
Adjusted Price Per Square Foot $ square feet * $ per square foot = (Bonus room area should be included for calculation of heat pump only)
$
TBA / perimeter = or Ratio Modified by size-shape factor * . Modified residence cost $ Bonus Room Cost $ Plus plumbing + $ Plus electric + $ Plus heat pump + $ Plus porch + $ Plus deck + $ Plus garage + $ Subtotal with addons $ Quality Grade Adjustment * . Total estimated reproduction cost new $
Georgia Department of Revenue Revised 6-13-2018
The Cost Approach to Value 278
Georgia Department of Revenue Revised 6-13-2018
The Cost Approach to Value 279
Calculation Worksheet: Problem Page 80 AREA OF RESIDENCE TBA * Sketch Label’s Area Factor = Total Heated Square Feet PERIMETER OF RESIDENCE SIZE-SHAPE RATIO SIZE-SHAPE FACTOR COMPUTATION OF COST
1 Story Sections Base cost per square foot for residence $ Exterior Wall Siding Factor Adjustment * Adjusted Price Per Square Foot $ square feet * $ per square foot =
$
1.5 Story Section Base cost per square foot for residence $ Exterior Wall Siding Factor Adjustment * Adjusted Price Per Square Foot $ (Story Height) Cost Factor * Adjusted Price Per Square Foot
*
Adjusted Price Per Square Foot $ square feet * $ per square foot =
$
1 Story Sections Value + 1.5 Story Section Value
$
Modified by size-shape factor * Modified residence cost $ Plus plumbing + Plus electric + Plus heat pump + Plus porch + Plus garage + Subtotal with addons $ Quality Grade Adjustment * Total estimated reproduction cost new $ Neighborhood/Location Market Adjustment . Market Value of Structure $
Georgia Department of Revenue Revised 6-13-2018
The Cost Approach to Value 280
Georgia Department of Revenue Revised 6-13-2018
The Cost Approach to Value 281
Built-as code/Description Used-as code/Description Base Cost Construction (framing) factor adjustment (Story Height) Cost Factor * Adjusted Price Per Square Foot
Adjusted Price Per Square Foot TBA * $ = TBA / perimeter = or Ratio Modified by area perimeter factor * Wall height = ’ and factor = * Modified building cost $ TBA * STHT Factor = Heated Area Plus heating type - Heated Area * = + $ Plus flooring type – Heated Area * = + $ Subtotal $ Quality Grade Adjustment * Total estimated reproduction cost new $
Georgia Department of Revenue Revised 6-13-2018
The Cost Approach to Value 282
Georgia Department of Revenue Revised 6-13-2018
The Cost Approach to Value 283
Built-as code/Description Used-as code/Description Base Cost Construction (framing) factor adjustment (Story Height) Cost Factor * Adjusted Price Per Square Foot
Adjusted Price Per Square Foot TBA * $ = TBA / perimeter = or Ratio Modified by area perimeter factor * Wall height = ’ and factor = * Modified building cost $ TBA * STHT Factor = Heated Area Plus heating type - Heated Area * = + $ Plus flooring type – Heated Area * = + $ Subtotal $ Quality Grade Adjustment * Total estimated reproduction cost new $