92
Georgia EDUCATION SECTOR POLICY REVIEW: STRATEGIC ISSUES AND REFORM AGENDA November, 2014 Education Global Practice Europe and Central Asia Region

62
Georgia
EDUCATION SECTOR POLICY REVIEW:STRATEGIC ISSUES AND REFORM AGENDA
November, 2014
Education Global PracticeEurope and Central Asia Region

1Georgia: Education Sector Policy Review
Table of ContentsAbbreviations ...........................................................................................................................3
Preface.......................................................................................................................................4
Executive Summary .................................................................................................................5
Chapter 1. Key System-wide Issues...................................................................................141.1 Student Learning and Labor Market Outcomes ................................................................................. 161.2 Access and Equity ........................................................................................................................................... 221.3 Governance........................................................................................................................................................ 351.4 Strategic Management of the Ministry of Education and Science............................................... 371.5 Public Spending in Education .................................................................................................................... 381.6 Cross-cutting Issues ....................................................................................................................................... 441.6.1 Life-long Learning...............................................................................................................................................441.6.2 Information and Communication Technologies (ICT) .......................................................................48
Chapter 2. Priority Sub-sector Issues................................................................................502.1 Early Childhood Development: School Readiness............................................................................. 502.2 General Education: Teaching Quality...................................................................................................... 522.3 Strengthening Vocational Education and Training........................................................................... 582.4 Higher Education Financing ....................................................................................................................... 59Chapter 3. Recommended Priority Interventions............................................................62
Chapter 4. Implementation of Sector Reforms ................................................................704.1 Addressing Executive Management Challenges ................................................................................. 704.1.1 Strengthening the Executive Management Functions .......................................................................704.1.2 Strengthening Policy, Strategy and Planning Functions ..................................................................714.1.3 Strengthening Management Information Systems Capacity ..........................................................724.2 Addressing Main Operational Functions............................................................................................... 734.3 Addressing Implementation Start-Up Challenges ............................................................................. 734.3.1 Pre-Implementation Phase .............................................................................................................................744.3.2 Implementation Start-up Phase ...................................................................................................................74
Annexes ...................................................................................................................................76Annex 1: The structure and institutional setup of the education system .............................................. 76Annex 2: Statistical Information.............................................................................................................................. 79Annex 3: Review of Higher Education Financing Options and Accountability Instruments.......... 83References...............................................................................................................................88

2Georgia: Education Sector Policy ReviewList of Tables
Table 1.1: A unique “intervention cluster” exists for each improvement journey, with six interventions commonacross all journeys........................................................................................................................................15
Table 1.2: Employment rates among Georgian’s youth (age groups of 19-34) by education attainment, 2012 ...19Table 1.3: Georgian’s youth (25-34) economic activity and occupation statistics by education attainment ........20Table 1.4: Job-related characteristics that secondary education and university graduates lack............................21Table 1.5: Main Social Inclusion Gaps in Net Enrolment from 2010 to 2012 .....................................................24Table 1.6: Reasons for Not Attending Kindergarten among 3-5 years old group in 2011 ...................................25Table 1.7: Gross and Net Enrolment Rates in General Education (%) .................................................................25Table 1.8: Higher Education Net Enrolment Rate by Population Subgroups in 2012..........................................30Table 1.9: Private Tutoring by Family Income in Grade 12 .................................................................................31Table 1.10: Student breakdown by types of state grants in 2009 and 2013..........................................................32Table 1.11: Higher Education Enrolment and Allocation of Grants by Residence in 2010 .................................32Table 1.12: General Government Expenditures on Education (state + local).......................................................39Table 1.13: Education Expenditures by level of education ..................................................................................40Table 1.14: State Budget Allocations to the MES by Economic Categories ........................................................40Table 1.15: State Budget Education Expenditures by Major Programs................................................................41Table 1.16: Expenditure, student population in public education and unit costs by level (2012).........................41Table 1.17: Higher Education Public and Private Expenditure ............................................................................43Table 2.1: Performance on cognitive tasks at the beginning of their primary education among the children who
attended kindergartens and who did not attend kindergartens .....................................................................51Table 2.2: Teacher and Student Numbers 2005-2014...........................................................................................52Table 2.3: Number of Schools, Students & Teachers by Class Size, 2012...........................................................53Table 2.4: Percentage of pension-age teachers .....................................................................................................54Table 2.5: Higher Education Financing Indicators, Georgia and Selected ECA Countries..................................60
List of Figures
Figure 1.1:Mean Scores in Reading, Mathematics and Science in International Context (2011 PIRLS & TIMSSResults) ........................................................................................................................................................17
Figure 1.2: Share of students scoring levels 2 or above and 4 or above in PISA (2009+)....................................17Figure 1.3: The Dynamics in the gaps in Student performance from 2006 to 2011 .............................................19Figure 1.4: Preschool Net Enrolment Rate (2011)................................................................................................23Figure 1.5: Drop Out Rates by Grade ...................................................................................................................26Figure 1.6: Trends in enrolment and number of vocational education institutions (excluding Higher Education
institutions) ..................................................................................................................................................27Figure 1.7: Map of professional (Level 1-5) programs as of 2013 .......................................................................28Figure 1.8: Higher Education Gross enrolment ratio in Georgia in an international context, 1999-2012 ............30Figure 1.9: Comparative data on public spending on education as a share of GDP .............................................39Figure 1.10: Average Monthly Salaries (2013) ....................................................................................................42Figure 1.11: Teacher Salaries Relative to GDP Per Capita in Georgia and PISA 2009 Participant Countries in
2008 .............................................................................................................................................................43Figure 1.12: The Institutional framework of lifelong learning policies................................................................46Figure 2.1: Ratio of Students to Teaching Staff in Secondary Education, 2011...................................................53Figure 2.2: Average Hours of Teaching per Teacher by Age Range (2012-2013) ..............................................54Figure 2.3: Student Average University Admission Test Scores by Field of Study in 2011 ................................55

3Georgia: Education Sector Policy Review
AbbreviationsCAT Centralized School Leaving Exams - Computer Adaptive TestingCIS Commonwealth of Independent StatesCVET Continuing Vocational Education and TrainingELLI European Lifelong Learning IndicatorsEMIS Education Management Information SystemEQF European Qualifications FrameworkESCO European Skills Competences, Qualifications and OccupationsEU European UnionGDP Gross Domestic ProductGEL Georgian LariGeostat National Statistics Office of GeorgiaGER Gross Enrolment RateGI-GXII Grade one - Grade twelveHER Home Educational Resources IndexIVET Initial Vocational Education and TrainingLLL Lifelong learningMoES Ministry of Education and ScienceNAEC National Assessment and Examination CentreNCEQE National Centre for Education Quality EnhancementNER Net Enrolment RateNGOs Non-Government OrganizationsNQF National Qualifications FrameworkNTPDC National Teacher Professional Development CentreOECD Organization for Economic Co-operation and DevelopmentPIRLS Progress in International Reading Literacy StudyPISA Program for International Student Assessment (OECD)QA Quality AssuranceSBM School Based ManagementTE Tertiary EducationTEDS-M Teacher Education Study in MathematicsHEI Higher Education InstitutionsTIMSS Trends in International Mathematics and Science StudyUNICEF United Nations Children’s FundVET Vocational Education and TrainingWB World Bank

4Georgia: Education Sector Policy ReviewPrefaceGeorgia has made significant progress in reforming its education system and the country hasimplemented a range of sweeping reforms targeted at redesigning the Post-Soviet education systemand creating a new system more consistent to a rapidly changing world with complex technicalrequirements and increased international competitiveness. Despite of this comprehensive set ofreforms, yet many challenges remain with respect to the quality and equity of education and trainingservices, including linkages to the labor market.
The government’s new socio-economic development strategy emphasizes high quality of education toimprove human capital. Strategic priorities include increasing labor market relevance of educationalprograms to meet workforce requirements, increasing access to preschool education, improvingquality of general education, emphasizing vocational training, and enhancing the attractiveness of theteaching profession. This document is aligned with the goals set forth by the government in the newsocio-economic development strategy.
For this purpose, the Ministry of Education and Science (MoES) has launched the development of anew National Education Sector Strategy that will build on current reforms and analysis ofachievements and challenges facing the education and training sector. The new strategy will spanfrom early childhood education to higher education and other post-secondary training and the key ofthis integration will be the notion of life-long learning. The lead responsibility for developing theEducation Sector Strategy lies with the Minister of Education and Science, supported by a StrategyDevelopment Team.
The World Bank was requested to provide analytical and technical advisory services with the goal ofsupporting and building the capacity required at the MoES to develop a comprehensive NationalEducation Sector Strategy and an Action Plan. This report intends to provide a comprehensiveanalytical framework and a series of actionable policy options that the Georgian authorities can use asa guiding document to the development of such National Education Strategy and its Action Plan. Thepresent review included all levels of education except for Research and Development given that in-depth science audit was recently undertaken by the MoES and the findings will be reflected in thegovernment’s final strategy. The contents of this report are presented in the following main sections:
Part I: Key System –wide Issues. A thorough analysis and recommendations on key sector issues:student and labor market outcomes, access and equity, governance, strategic management of theMinistry of Education and Science, public spending in education and cross-cutting issues.
Part II: Priority Sub-sector Issues. Diagnostic and recommendations of the most pressing sub-sectorissues at each level of education: Early Childhood Development (ECD): School Readiness; TeacherQuality in general education; Strengthening Vocational Education and Training (VET) sector; andFinancing of Higher Education;
Part III: Recommended Interventions for the Education Sector Strategy. A summary of keyrecommendations and policy interventions for the government’s ten-year consolidated educationsector strategy (2015-2025).
Part IV: Implementation of Sector Reforms.
This document was prepared by a team led by Nino Kutateladze (Task Team Leader, EducationOperations Officer, ECSH2) comprising Natia Andghuladze (WB Consultant), Sophie Gorgodze (WBConsultant) and Nelson Stratta (WB Consultant), with additional support from Daniel Kutner (JuniorProfessional Associate, ECSH2), Jason Weaver (Education Specialist, ECSH2) and Dandan Chen(Sector Leader, ECSH2) and administrative and logistical support from Lela Ghongadze. Thecontributions of key government counterparts were critical in the preparation of this draft, which alsoreflects consultations with government entities held on March, 2014. The team would like to take thisopportunity to thank Minister Tamar Sanikidze as well as the Strategy Development Team, led by Ms.Medea Akhalkatsi, which she nominated to work with and provide guidance to the Bank team onthese tasks.

5Georgia: Education Sector Policy Review
Executive Summary
1. The scope and pace of education reforms in Georgia over the last decade are unique in theregion but have not yet yielded the expected improvements in the quality of education. Inparticular, reforms of financing and governance of educational institutions, that other countries havebeen grappling with for years, have been implemented. The key reforms included: (i) thedecentralization of the management; (ii) the adoption of a “per-student” financing mechanism at alllevels of education; (iii) the creation, under the umbrella of the Ministry of Education and Science, ofnew public legal entities responsible for ensuring the quality of reforms; (iv) the adoption of newstandards and outcome-based national curricula in general education along with the development ofnew textbooks; and (v) the design of a new national assessment and examination system. These policymeasures were complemented by a greater focus on educational inputs such as investments ininfrastructure and technology, the physical security of schools, and in improving the tuition ofEnglish. Despite the many innovations and important changes to the education sector, reforms havenot yet translated into gains particularly in the quality of education. The majority of students inGeorgia demonstrate below average levels of performance in reading, mathematics and science asmeasured by national and international student assessments (such as PISA 2009+, TIMSS & PIRLS2011).
2. The government has set a clear vision for the future of the education sector as a tool forhuman capital development to support economic growth. One of the most important objectives inthe government’s new Socio-Economic Development Strategy of Georgia-2020 is to prepare labormarket-responsive workforce and to strengthen research potential in the education system. Thedocument identifies certain priorities in terms of development of the education and research sector,such as improving the quality and accessibility of education; increasing motivation and qualificationsof teachers; increasing participation of stakeholders in preschool and Vocational Education andTraining (VET) sector; improving learning outcomes of students in literacy, exact and naturalsciences; and supporting internationalization of higher education. To achieve the new vision for thesector’s development, the Government needs to address the remaining challenges both at the systemand sub-sector level.
3. The analysis presented in this report reveals that the major challenge across all levels ofeducation in Georgia is improving quality and, more specifically, improving student outcomes.The analysis and policy options outlined in the report emphasize the need to engage in a second waveof reforms focusing on the quality dimension and improving system’s performance since the countryhas already made improvements in the transparency and efficiency of the sector via the reformsimplemented over the last two decades. Creating improvements requires a long-term and sustainedeffort as evidenced by the experience of many countries with now advanced education systems.Georgia can benefit from the experiences and lessons learned from the education reforms of thosecountries (e.g. Poland, Finland), who have made impressive gains. The document presentscomparative analysis and brings in relevant examples from other countries and country comparisonsfor that purpose.
Key System-wide issues
4. Learning and Labor market outcomes. Georgia’s prospects to compete in the global economywill depend on its ability to produce a highly-skilled workforce. This largely depends on the relevanceand quality of the education received by the students. To improve relevance, the education systemneeds to be aligned with the requirements of economy and the quality of teaching and learning needsto be improved. The key challenge is to improve significantly the achievement level of Georgianstudents in key domains, such as reading comprehension, mathematics and science. Over 60 percentof the surveyed 15-year-old Georgian students were found to be three years behind their peers on thereading scale as compared to OECD average scores. The education outcomes also indicate important

6Georgia: Education Sector Policy Reviewdifferences between students from different socio-economic backgrounds and residence. The lowemployment rates among Georgian youth (at about 51 percent) may suggest skills mismatch ofgraduates with the labor market needs and relevance problems for education programs apart fromstructural unemployment issues. Employer surveys confirm that among Georgian graduates, there islack of specific professional skills in demand by the economy. Georgia needs to provide keycompetencies to all students and accelerate the creation of highly skilled workforce demanded by thelabor market.
5. Access and Equity. Georgia compares well to comparator countries in Europe and Central Asia(ECA) region in terms of the enrollment rates at compulsory education level, but there is room forimproving access to other levels of education. Preschool enrolment in Georgia is relatively low byregional comparisons. However, the enrollment rates showed moderate but promising growth in thelast decade increasing from 46 percent to 57 percent in the last two years. The abolishment of parentalcontribution towards pre-school education in September 20013 has resulted in higher coverage, but isnot likely to enhance the quality of the service being provided if no further measures are taken. Ifdemand for preschool education significantly grows, there will not be enough vacancies in preschoolinstitutions (in the short-term). The enrolment in compulsory education is almost universal, although,participation in upper secondary education is low at 73 percent. The demand for VET programs hasbeen on the rise with enrolments doubling between 2010 and 2012 attributed to the concertedGovernment reform efforts during recent years. Nonetheless, participation still remains low due to thelimited geographical coverage and more importantly, due to dead ends and rigid pathways to higherlevels of education after completing the VET programs. Enrolment in Higher Education in Georgia islow by international standards. In 2012 the gross enrolment ratio in higher education reached 28percent, which is one of the lowest in the region and significantly lower compared to the averagegross enrolment rate (GER) in Western European and Central and Eastern Europe (CEE) countries.
6. The population from lower economic backgrounds, living in rural areas and from ethnic minoritygroups is systematically excluded from the education system. The difference in PISA results betweenstudents that belong to the wealthiest quintile and those that belong to the poorest quintile is over 2years of education (80 PISA points) in reading and mathematics. The difficulties for these groups arevery similar for all education areas, namely limited access to education and limited or insufficientfinancial support. The lack of consolidated social inclusion policy exacerbates the problem. Inaddition, most students from these underrepresented groups do not continue into higher education,perhaps due to their insufficient preparation and ability to obtain tutoring to compete with their peersfor the selection process. The Government’s attempts to provide support for these groups have notbeen sufficient.
7. Governance. The remaining challenge for the sector is to shift towards the governance andaccountability paradigm that would support the existing decentralized management in a moreeffective manner. The existing accountability mechanisms at all levels of education are concentratedon controlling for inputs and regulatory norms and less so on monitoring outcomes, which restricts theMoES capacity to improve the quality of education. These governance constraints are manifested indifferent forms at each level of education. At the general education level, the Education ResourceCenters act as mediators between the MoES and schools and are responsible for the monitoring ofschools. Nonetheless, the role of Education Resources Centers remains limited and capacity needs tobe further developed. There is no proper accountability framework between the MoES and schoolsand internal quality assurance mechanisms at the school level are weak. Moreover, insufficientcapacity development has been provided to support participation of key actors (e.g. school boards,principals). The existing accountability mechanisms at VET and higher education levels restrict theautonomy of institutions and the MoES capacity to improve the quality of education.
8. Strategic Management of the Ministry of Education and Science. Implementation issuescaused the recent reforms not to generate the expected incremental and systemic improvements. Thepath of recent reforms shows that large-scale reforms were introduced before gathering a clearunderstanding about all their potential consequences. The speed at which these reforms wereintroduced in many cases did not leave sufficient time for their proper planning and consultation.Some of the measures introduced were not in line with existing capacity and management limitations.

7Georgia: Education Sector Policy ReviewAs a result, in many cases, after the reforms were implemented, several reversals were made. Thishappened in key areas (such as school decentralization reform, teacher training provision), producinga general sense on instability and, at the end of the day, longer periods to consolidate the desiredoutcomes of the reforms compared to what a proper introduction would have required.
9. Public Spending in Education. Expenditure in education is low by any international standards.The average level of education expenditure in Georgia as a percentage of GDP has been oscillatingbetween 2 percent and 3 percent for a decade. This is much lower than the average for new MemberStates in the European Union (over 5 percent) or comparable countries in the Commonwealth ofIndependent States (CIS) (around 8 percent). The level of expenditures is much lower than othercountries with similar level of income per capita. Although total education budget substantiallyincreased since 2006, as a share of total public spending government allocation for education did notshow significant improvement. The highest share of the education budget is allocated for generaleducation sector. The bulk of current expenditures in general education is spent on teacher salaries,which represents 75-80 percent of current expenditures. At 8.5 percent, the student to teacher ratio ofgeneral education in Georgia is considerable lower than the OECD or EU21 countries (at 13.6 and 12,respectively; see figure 2.1) suggesting the need to raise efficiency in the management of teachingforce, although this could be a politically sensitive issue. However, Teacher salaries in Georgia areamong the lowest compared to other countries that participated in PISA 2009. Analyzing 2009 teachersalaries relative to GDP per capita, teachers with minimum training and 10 years of experience inGeorgia are paid at substantially lower levels compared to other countries. Despite the gradualincrease of teacher salaries in the last decade, they remain below the average national salaries.According to figures of the National Statistics Office of Georgia the average monthly salary for 2013(fourth quarter) is of 875 GEL, while the average monthly salary in education is 475 GEL. The lowsalary system of the teaching profession makes it a poor career choice in Georgia.
10.Life-long Learning. Georgia does not yet have an integrated national policy and strategy for Life-long Learning (LLL), nonetheless, the ongoing efforts of MoES to develop a consolidated strategy forthe entire sector in line with the principles of LLL is a major step forward. Georgia’s institutionalcapacity would require substantial development to be capable of applying a coherent and integratednational lifelong learning policy. The scope of LLL policies goes beyond the boundaries of theeducation system and demands a coherent public sector response in a variety of areas.
11. Information and Communication Technologies (ICT). Currently there is no coherent policyframework to ensure meaningful use of ICT to advance teaching and learning. Individual ICTprograms are not integrated and aligned with the curriculum goals. There is no systematicunderstanding of the ICT infrastructure gaps in Georgian schools. Nonetheless, the MoES recentlylaunched concerted efforts to develop an ICT policy paper.
Priority Sub-sector Issues
12. Apart from the system-wide issues described above, there are pressing challenges specific toparticular sub-sectors of education emerging from the sector analysis. The key areas for priorityattention identified at each level of education are as follows: improving school readiness in preschooleducation; improving teaching quality in general education; strengthening Vocational Education andTraining; and improving financing of the Higher Education.
13. Early Childhood Development (ECD) School Readiness. In Georgia, the majority of thechildren who attended preschool institutions show very low school readiness. The decentralizedpreschool education model has the advantage of being flexible and easy to be shaped to the particularneeds of each region and this is an important virtue. However, the lack of supervision, monitoring,and quality assurance leads to wide differences in the quality of the service across the country. One ofthe major constraints towards improving the quality of preschool education is the lack of the nationalpreschool education standards and the absence of instruments for their enforcement.
14. Teaching Quality in General Education. Improving teacher quality is one of the most pressingchallenges for the general education sector as well as a top priority given that the long term solutions

8Georgia: Education Sector Policy Reviewto address education quality constraints will largely depend on resolving the issue of teaching quality.The key factors contributing to low teaching quality include the issues of teacher management,deployment, career path development, compensation, and performance evaluation. More specifically,low salaries make teaching an unpopular choice. The poor management of supply and demand ofteachers and teacher deployment nationwide has resulted in imbalances between demand and supplyof teachers in some subject areas and geographic locations. The inefficient use of the teaching forcecreates negative implications for improving effectiveness of the system. The existing teacher pre-service and in-service training system does not produce the intended results. The new TeacherProfessional Development Scheme, currently in works, provides an excellent opportunity to addressmany of these constraints.
15. Strengthening Vocational Education and Training. The improvement of the quality andrelevance of VET programs could be enhanced with greater participation of employers. Someprogress has been made in establishing coordination mechanisms to engage stakeholders in the VETsector. However, the engagement of employers and social partners has been still insufficient in sectorplanning, management, program development and evaluation, which greatly limits the sector’seffectiveness.
16. Higher Education Financing. At the higher education level, the existing level of financing andfinancial instruments are not conducive to improving quality of teaching and learning, and forstrengthening research capacity. Introducing student state grants was instrumental in increasingtransparency in the allocation of public resources for higher education. However, the student grant isnearly the main public financing instrument available. There are limited opportunities for competitiveresearch grants. Also, the capacity of higher education institutions to generate other sources ofrevenue has been limited. Therefore, the tuition fees collected from students is the main source ofrevenue for the higher education sector. Though the mechanism helps create healthy competition forstudents among institutions, it also drives universities to maximize student numbers beyond theircapacity, which negatively affects the quality of teaching. Moreover, the existing financingarrangement does not support the development of the higher educational institutions’ researchcapacity and the integration of research into teaching and learning process. Government shouldconsider setting up complementary financing mechanisms for supporting research more effectively inuniversities.
17. Implementation of Sector Reforms. To succeed in achieving the national education goals,objectives, and targets, the implementation of the future sector reforms must have a solid foundation.The development and implementation of a sector-wide Education Strategy will require activestakeholder engagement, the definition of efficient coordination mechanisms and clear lines ofresponsibility, authority and accountability at central as well as at decentralized levels. It is importantto avoid the creation of heavy bureaucratic structures in favor of an efficient usage of the existinginternal structure developing agile working groups supported with appropriate technical assistance.
Key Policy Recommendations
A number of important policy reforms have been identified as follows.
Recommendation 1: Improving Quality of Education as measured by Student and LaborMarket Outcomes1
Researchers can now document that the quality of human resources, as measured by assessmentscores, is closely related to individual earnings, productivity and economic growth. Increasing, policymakers have shifted attention from inputs in the education system to learning outcomes, whatknowledge, attitudes and skills are obtained by learners as a result of their exposure to schooling and
1 The labor market outcomes are assessed by the characteristics of employment status of graduates,skills content of the job and the occurrence of qualification mismatches.

9Georgia: Education Sector Policy Reviewto what extent these competencies are compatible to the needs of the global competitive economy ofthe 21st century. The following recommendations are aimed at improving the quality of education asmeasured by student and labor market outcomes:
Focus on the acquisition of key competencies by students in general education throughcurricular improvements. The large majority of students in general education lack basicproficiency skill in key learning domains, such as literacy and numeracy, as evidenced byexisting student assessments. The national curriculum has an important role to guide teachersfor improving teaching and learning outcomes. However, the changes introduced in thecurriculum content in 2010 were not based on a comprehensive evaluation of the curriculumimplementation in the previous years. The 2013 monitoring results of curriculumimplementation indicate that majority of teachers do not work towards transferring higher-order cognitive processes and individual formative assessments described in nationalcurriculum. The emphasis should be made on strengthening the curriculum implementationprocess at the school level, namely supporting and strengthening curriculum experts, schoolprincipals, teachers, actively engaging parents and communities in the process. The futurecurriculum improvements will require strengthening the mechanisms for applying evidence(such as national assessments, examinations, feedback from educational institutions, curriculabased international assessments) in further curriculum development.
Focus on relevance by shifting to a demand-led approach in which employers’ feedbackhelp shape the education system. The low employment and underemployment amongstgraduates suggest relevance problems for vocational education and training and highereducation programs. It will be essential to engage business and industry as well as trainingproviders in the definition of skills development priorities and design of programs. Theexisting quality assurance system needs to be developed in line with the internationallyrecognized quality assurance frameworks and focus on relevance fostering a demand-ledapproach.
Recommendation 2: Access and Equity
Develop a Social Inclusion Policy for improving access and equity. Improving access andequity is a key strategic objective that requires strategic, sector-wide planning andmanagement. Social inclusion standards, targets, measures and tools must be defined at thenational level and not left to the arbitrary decision of the schools and municipalities. Thenature of the social inclusion programs and measures cuts across all the educational areas, andtherefore, their overall monitoring and evaluation requires special ministerial attributions thatare not today defined at the centralized level. The responsibility for implementing andmonitoring of many of these policy measures can be delegated to sub-sector area managementunits (pre-school, general, etc.), however there is subject specific knowledge (children withdisabilities, usage of mother tongues in education, adult education, etc.) that would benefitfrom a more integral understanding of the topics for all education areas.
Promote gradual expansion of preschool enrolment with a particular attention todisadvantaged groups. To address the issue of low preschool enrolment the followingmeasures need to be considered: (i) prioritize the five-year old children, in case there are nospots for all children. Providing all children with at least one year of preschool education islikely to improve school readiness; (ii) encourage the growth of private providers; (iii) buildpublic awareness; (iv) phase in free of charge service provision for all, and prioritize thedisadvantaged socioeconomic groups; (v) improve efficiency in the use of existing preschoolinfrastructure. The government could consider using the facilities of existing, underutilizedprimary schools.
Eliminate dead-ends and improve the attractiveness of VET programs In Georgia, due tothe nature and structure of programs, VET graduates have significant difficulties in pursuingfurther education, which hinders career advancement for many people. The 2007 Law onVocational Education institutionally separated vocational education from general educationremoving also general education content from the VET programs. This approach has resultedin the so-called educational “dead-ends”. The inclusion of general content in the VET courses

10Georgia: Education Sector Policy Reviewis likely to reduce the content gap between general and VET track graduates. In itself, thiswould make it easier for VET graduates to compete for university admission. A cost-effectiveapproach would be to add general content to VET courses that can help reduce “dead ends”and improve VET graduates’ chances in case they need to look for a job different than the onethey studied for.
Expand the geographical coverage of VET programs in rural areas and smaller towns.The present initiatives to increase supply should be slightly refocused to address supplydeficiencies to provide access to people living in these areas, for which VET would be veryimportant. Expanding the existing financing scheme to accommodate indirect costs (livingexpenses) of VET participation can also be considered.
Improve the existing student grant allocation system in higher education toaccommodate the needs of underrepresented groups. It is recommended to review theusage of the student grants and expansion of existing programs to promote the participation ofdisadvantaged groups. Many of these measures could have an important short-term socialimpact and can be introduced fairly quickly without substantially increasing actual fundingrequirements. These measures include expansion of needs-based grants and introduction offlexible study programs.
Recommendation 3: Governance
Develop a new school performance review and support system that will be focused onmonitoring school quality and supporting school development. The existing structure ofthe education system (General Education Management and Development Department,National Curriculum Department, Education Resource Centers, National QualityEnhancement Center, Teachers’ Professional Development Center, National Assessment andExamination Center) can provide good foundations for such a system in terms of providingthe needed expert support, particularly for low performing schools. The new schoolperformance review and support system can play a leading role in helping the schools toidentify their challenges and develop school improvement plans. The ERCs should play a rolein the capacity development of boards of trustees to avoid one time, costly and sporadictrainings and provide more long-term and sustainable support to individual school boardmembers. The ERCs should be equipped by centrally developed guidelines and manuals forsuch support.
Introduce result-based accountability mechanisms at VET and Higher Education levels.These accountability mechanisms should be built around measuring performance of theseinstitutions according to defined outcomes, which can serve as the major driver for theimprovement of the quality and output. The performance indicators should be agreed uponamong key stakeholders and their tracking and verification need to be done by institutions andan independent agency respectively. It would be important to ensure that the future reform ofexisting authorization and accreditation system is not in conflict with the principles ofinstitutional autonomy.
Recommendation 4: Strategic Management of the Ministry of Education and Science
Develop the Ministry’s policy and planning capacity, including data management andapplication, to support key strategic management functions and sustain the introduction ofmanagement by results practices. In particular, developing a comprehensive and evidence anddata-based long-term sector strategy would create the opportunity to negotiate the necessaryincreases in the medium term financial support for the education sector development. It isimportant that the management system of the Ministry and all relevant agencies andinstitutions is clearly elaborated, including responsibilities, lines of accountability, verticaland horizontal communication, monitoring and evaluation systems. Having strong and clearmanagement system will be crucial for the implementation of the new strategy andachievement of anticipated results in the medium and long-term.
Recommendation 5: Public Spending in Education

11Georgia: Education Sector Policy Review Georgia will need to prioritize increasing public investment in education. Government
spending on education in Georgia is low compared to countries with similar per-capitaincomes and relative to both the shortage of human capital and the country’s ambitions.
Georgia could consider prioritizing teacher salary increase over other investments ineducation sector. The teacher salaries in Georgia are one of the lowest as compared to othercountries and other public employees in Georgia. This creates negative implications for theimprovement of the quality of teaching and learning across the system. Attracting andretaining high-caliber teachers is a challenge worldwide. Specific interventions related to thisrecommendation are discussed in teaching quality part of the document.
Recommendation 6: Life-Long Learning
Georgia needs to develop a coherent national strategy for integrating LLL principlesacross all education levels. The Government does not have an integrated national policy andstrategy for LLL which substantially limits the country’s potential for meeting workforcedevelopment needs. Georgia’s institutional capacity would require substantial development tobe capable of applying a coherent and integrated national lifelong learning policy. A greaterfocus on educational outcomes will be required from Georgian education policy. The scopeof the policies to promote lifelong learning goes beyond the boundaries of the educationsystem and demands a coherent and integrated public sector response in a variety of areas.
Recommendation 7: Information and Communication Technologies
Develop a coherent policy framework to ensure meaningful use of ICT to advanceteaching and learning throughout the education system. This policy framework shouldaddress how ICT can support the resolution of many of the educational issues that weredescribed, such as: (i) major curriculum revisions and shifts in pedagogy and assessmentchanges; (ii) specific curriculum reforms that emphasize higher levels of understanding ofkey concepts within subject areas and aimed to reduce functional illiteracy; (iii) curricularreforms aimed to introduce the abovementioned lifelong learning approaches and especially,to develop the ability to solve complex, real-world problems (providing key competences)that prepare students for the knowledge economy, such as creativity, informationmanagement, communication, collaboration, and the ability to direct one’s own work andlearning; (iv) support the pedagogical role of teachers by providing resources and explicitlymodelling cognitive and social processes and prompting students to take up these practices;and (v) the use of technology to efficiently deliver online content and assessments in all areasof education and especially to support second chance, adult education.
Recommendation 8: Improving School Readiness
The state of preschool education would benefit if the MoES played a more active role.The decentralized model has the advantage of being flexible and easy to be shaped to theparticular needs of each region and this is an important virtue. However, the lack ofsupervision, monitoring, and quality assurance leads to wide differences in the quality of theservice. Given the importance of preschool education, it is important to include this sector inthe whole continuous education system, particularly it is important to pay attentions to schoolreadiness of five-year old children for which MoES could play a pivotal role in setting upcurricula and quality standards, supporting and monitoring the implementation process.
Strengthening service quality should be a priority. The expansion of pre-school educationis mainly justified by its great potential for improving the beneficiaries’ future educationaldevelopment. However, this is not likely going to happen if quality is not achieved. As thisprocess will take a long time, initial actions are important. Clear estimations of the costs ofimproving quality are needed, especially to resolve MoES and municipal capacity limitations.

12Georgia: Education Sector Policy ReviewRecommendation 9: Improving Teaching Quality in General Education
Develop a sustainable school-based professional development model. This will require asubstantial capacity building at the school level, creating a critical mass of qualified teachersto assume the role of a leading teacher, encouragement of peer learning among the teachersand trained school principals to focus on instructional leadership. The latter would focus onnew modalities, such as lesson study, action research and school-based professionaldevelopment teams. These new modalities will allow teachers to collaborate in order toidentify academic programs, formulate instructional plans, use evidence to developinterventions for improvement, observe and reflect on their interventions and thus engage incontinuous improvement. Continued in-service support to school principals will be alsocritical. Georgia can benefit from the already existing small-scale but successful initiativesbeing implemented in this area by the USAID supported G-Pried project and Ilia StateUniversity.
Emphasize the development of new cadre of university teachers equipped with modernexpertise in the field for strengthening the existing pre-service teacher training system.
Provide incentives to attract qualified professionals into teaching. It is essential to addressthe issue of lack of competitive compensation for teaching profession. The government mayconsider setting high starting salaries to attract better graduates into teaching. Thegovernment may consider increasing salaries of the existing teachers complying with thequality requirements set by the teacher professional development standards.
Develop a comprehensive teacher evaluation system, which one hand serves as aneffective instrument for managing teacher quality and on the other hand, provides a clear pathand opportunities to teachers for professional growth and career advancement linked tofinancial incentives.
Improve the management of teacher supply and demand and teacher deploymentnationwide. In Georgia, there is an overall surplus of teachers in general education, butshortages of teachers by teaching subject and by geographic location. The existingcertification and professional development scheme can play an important role in themanagement of the teaching force. However, the existing instruments should be based onprofound understanding of teacher supply and demand issues as well as influencing factors.Moreover, the expansion and improvement of the existing teacher deployment mechanismswould help address teacher shortage issues in remote areas.
Recommendation 10: Strengthening the Vocational Education and Training Sector
Engage employers and relevant stakeholders to improve quality, relevance and providea demand-led approach for VET supply. The National Qualification Framework andprofessional standards need continued improvement. Significant efforts are being made in thisarea. Its completion would impact the overall system and can be achieved in the short term.Priority efforts should be carried out to improve the MoES capacity to properly manage theengagement of wider range of stakeholders, particularly the private sector employers. Thisshould be staring point as it affects the quality of all subsequent reforms in this area.
Encourage Public Private Partnerships both in financing and delivery of vocationaleducation. This may an important move toward improving the alignment of VET programswith labor market needs. The business sector should play an increased role in the design ofVET curriculum, management and service delivery options, which will serve as incentives forthe private sector to contribute to the financing of this level of education.
Recommendation 11: Improving Financing of Higher Education
Increase the level of financing for the higher education sector for improving quality ofteaching and learning, and strengthening research capacity. Higher education needsadequate financial resources allocated in a manner that promotes fair competition but alsoensures sustainability. Georgia should at least triple its public spending on higher education,up to 1 percent of GDP. Although highly vulnerable to external shifts and inflation risks,
13Georgia: Education Sector Policy ReviewGeorgia’s economy is growing at a steady pace. The Government should be able to maintainits current government spending.
Diversify funding instruments for higher education. The current limited fundingmechanisms for higher education also lack clear strategic purpose in terms of improvingefficiency and equity. Funding mechanism need to first align with the sector reformobjectives. Assuming Georgia increases its public funding to higher education institutions, theGovernment could introduce new funding mechanisms in the system to encourage improvedinstitutional performance and support the development of HEIs. After identifying its mainpolicy objectives (access, equity, quality, labor market relevance, etc.) for Georgia’s highereducation system, the Ministry of Education and Science should reassess how its currentfunding model fits or aligns with those objectives. The government could considerdiversifying the funding mechanisms in line with international best practice in this are tofacilitate research and innovation, improve the quality of teaching and learning and facilitateknowledge transfer. The options of output-based funding formula, performance contracts orcompetitive grants could be considered.

14Georgia: Education Sector Policy Review
Chapter 1. Key System-wide Issues
1.1 The scope and pace of the Georgian education reform over the last decade are unique inthe region but have not yet yielded the expected improvements in the quality of education. Inparticular, reforms of financing and governance of educational institutions, that other countries havebeen grappling with for years, have been initiated at a stroke. They introduce the per capita financingprinciple of ‘money follows the student’ in general education and decentralizing financing andmanagement to the school level. A similar formula-funding model for teaching activities has beenintroduced for higher education and vocational education and training institutions. A crucialcontribution to reduction in corruption and reform of higher education admission has been made bythe introduction of sophisticated unified entrance examinations, launched in 2005 and administered bya new National Assessment and Examinations Center (NAEC). Similar agencies have been set up inareas important to quality assurance and support – Teachers Professional Development Center(TPDC), National Center for Educational Quality Enhancement (NCEQE), Education ManagementInformation System (EMIS) and Education and Science Infrastructure Development Agency(ESIDA). Ambitious programs for computerization and rehabilitation of educational institutions havealso been launched. Other areas of innovation include vocational education, early childhood care andeducation and inclusive education (for which development of policy is at a relatively early stage).The government is also grappling with the particular educational problems of ethnic minorities, thebiggest of which is lack of proficiency in the state language. Despite the many innovations andimportant changes to the education sector, reforms have not yet translated into gains in the quality ofeducation. The majority of students in Georgia demonstrate below average levels of performance inreading, mathematics and science as measured by national and international assessments.
1.2 The analysis presented in this report reveals that one of the major challenges across alllevels of education in Georgia is improving the quality of education and more explicitly,improving student outcomes. The analysis and policy options outlined in the report emphasize theneed to engage in a second wave of reforms focusing on quality dimension and improving system’sperformance since the country has already made important improvements in the transparency andefficiency of the sector via the reforms implemented over the last two decades.
1.3 Creating improvements requires a long-term and sustained effort as demonstrated bythe experience of many countries with now advanced education systems. Georgia can benefitfrom the experiences and lessons learned of other advanced school systems, which have madeimpressive gains after structural reforms (e.g. Poland, Finland). The report includes a box illustratingPoland’s reform path to success, which Georgia may find relevant in pursuing future reforms (see box1 in annex 2). The McKinsey & Company (2010) report - “How the World’s Most Improved SchoolSystems Keep Getting Better” - examines the reform experiences of twenty school systems that haveachieved significant, sustained and widespread gains as measured by national and internationalassessments. According to the same report, successful education reforms have the followingcharacteristics in common: (i) a vision for the future of the education system and longevity of theeducation leadership to sustain the vision over time; (ii) a set of comprehensive, relevant, andmutually reinforcing interventions; (iii) structural measures to ensure the sustainability of the reformsimplying that these systems are not merely changing the explicit structure and approach of the systembut put considerable effort in transforming teachers’ perceptions about teaching; and (iv)contextualizing the interventions to navigate their challenges and use their context to their advantage.The analysis also revealed that all improving school systems appear to adopt a similar set ofinterventions, one that is appropriate to their stage of development of the journey. These sixinterventions are: (i) revising curriculum and standards, (ii) ensuring an appropriate reward andremuneration structure for teachers and principals, (iii) building the technical skills of teachers andprincipals, (iv) assessing students, (v) establishing data systems, and (vi) facilitating the improvementjourney through the publication of policy documents and implementation of education laws (see the

15Georgia: Education Sector Policy Reviewtable below). The Table shows some of the milestones that systems in different development stagesshould pursue in order to improve. Georgia has already adopted some of the interventions presented inthe table (decentralization of management, adoption of per student financing scheme to improvetransparency, adoption of teacher standards and certification system) getting the foundations in place,but not all the essential components from the same cluster (putting in place proper accountabilitysystem to support decentralized management), therefore Georgia will need to finalize and consolidategains from the initial reform efforts, but also move forward into the next stage of developmentemphasizing reform interventions illustrated for transition from “good to great” system, such asraising caliber of entering and existing teachers and principals, supporting school-based decisionmaking.
Table 1.1: A unique “intervention cluster” exists for each improvement journey, with six interventionscommon across all journeys
ImprovementJourney
Poor to Fair Fair to Good Good to Great Great to Excellent
Theme Achieving the basics ofliteracy and numeracy
Getting the foundations inplace
Shaping the professional Improving through peers andinnovation
InterventionCluster
Providing motivation andscaffolding for low skillteachers- Scripted teaching
materials- Coaching on
curriculum- Instructional time
on task- School visits by
center- Incentives for high
performance
Getting all schools to aminimum quality level- Outcome targets- Additional support
for low performingschools
- Schoolinfrastructureimprovement
- Provision oftextbooks
Getting students in seats- Expand school seats- Fulfil students’
basic needs to raiseattendance
Data and accountabilityfoundation- Transparency to
schools and/orpublic on schoolperformance
- School inspectionsand inspectionsinstitutions
Financial andorganizational foundation- Optimization of
school and teachervolumes
- Decentralizingfinancial andadministrativerights
- Increasing funding- Funding allocation
model- Organizational
redesign
Pedagogical foundation- School
model/streaming- Language of
instruction
Raising caliber ofentering teachers andprincipals- Recruiting
programs- Pre-service
training- Certification
requirements
Raising caliber ofexisting teachers andprincipals- In-service
trainingprograms
- Coaching onpractice
- Career tracks- Teacher and
communityforums
School-based decisionmaking- Self-evaluation- Independent and
specializedschools
Cultivating peer-ledlearning for teachers andprincipals- Collaborative
practice- Decentralizing
pedagogical rightsto schools &teachers
- Rotation andsecondmentprograms
Creating additional supportmechanisms forprofessionals- Release
professionals foradmin burden byproviding additionaladministrative staff
System-sponsoredexperimentation/innovationacross schools- Providing additional
funding forinnovation
- Sharing innovationfrom front-line to allschools
Common acrossall journeys
Six interventions: (i) revising curriculum and standards; (ii) reviewing reward and remunerations structure; (iii) buildingtechnical skills of teachers and principals, often through group or cascaded training; (iv) assessing student learning; (v)utilizing student data to guide delivery; and (vi) establishing policy documents and education laws.
Source: McKinsey & Company, How the World’s Most Improved School Systems Keep Getting Better, 2010.Note: the analysis is based on the evaluation of twenty country systems: Singapore; Hong Kong; South Korea; Ontario,Canada; Saxony, Germany; England; Latvia; Lithuania; Slovenia; Poland; USA; Long Beach, CA, USA; Boston,Massachusetts, USA; Armenia; Western Cape, South Africa; Chile; Minas Gerais, Brazil; Madhya Pradesh, India; Ghana;Jordan;

16Georgia: Education Sector Policy Review1.4 This chapter presents a thorough analysis of the status of the education sector in Georgia in termsof student learning achievement, labor market outcomes and social inclusion issues. The objective ofthis chapter is to provide evidence based background for setting the strategic priorities of theEducation Sector Strategy.
1.1 Student Learning and Labor Market Outcomes
1.5 Quality of education in Georgia is monitored through diverse instruments, such asnational and international student assessments, monitoring curriculum implementation andcentralized examinations, but not in a systematic manner. Policy makers in all best-performingeducation systems resort to various assessment procedures (examinations, national and internationalassessments) to obtain information on what knowledge, attitudes and skills are obtained by learners asa result of their exposure to schooling and to what extent these competencies are compatible to theneeds of the global competitive economy of the 21st century. The interest in assessing studentlearning has grown in countries where public services are being reorganized to allow for the use ofdecentralized provision of services and in education systems which undergo fundamental reforms.These changes require putting in place new clear regulations and arrangements for monitoring thesystem, compliance with the set goals and for evaluating the performance of actors.
1.6 National assessments have not been carried out on a regular basis and used to informpolicy making. The responsibility for assessment function has shifted many times among threedifferent education agencies, which affected both the quality and possibility to compare trends overtime. The reasons behind were that each institution had varied capacity and used differentmethodologies in each of the assessment round. To date, the most useful source for judging thequality of student learning outcomes are the results of international assessments. Georgia joinedTIMSS and PIRLS international assessments since 2006 and a PISA assessment was conducted onlyonce in 20092 . It is important to establish coordinated mechanisms for national assessments andensuring the platform to discuss, plan, monitor and use the results effectively. MoES needs to put inplace central advisory council for the elaboration of policy and approaches for national assessmentswith wide participation of all important stakeholders.
1.7 Improving student performance is a key challenge facing Georgia. According to theresults achieved in TIMSS and PIRLS 2011, academic performance of Georgian students in keylearning domains (literacy, mathematics and science) remains low as compared to CIS countries, CEEand Western European countries, as illustrated in Figure 1.1 below.
2 It was discontinued after that ant it seems that it will be resumed again as Georgia may take part in the next PISAassessment

17Georgia: Education Sector Policy ReviewFigure 1.1:Mean Scores in Reading, Mathematics and Science in International Context
(2011 PIRLS & TIMSS Results)
Source: Team calculations based on TIMSS, 2011, PIRLS 2011Note: International Average is defined at 500 points
1.8 The education system is failing to provide functional literacy to an overwhelmingmajority of students. This point is well demonstrated by the Program for International StudentAssessment (PISA 2009 Plus) results. In the PISA 2009 Plus, only a small percentage of the surveyedGeorgian 15 year olds (30% to 40% depending on the subject) scored level 2 or above, the thresholdthat is usually referred to as functional literacy. These results are a very important warning sign forthe education system as a whole, as it means that over 60% of the surveyed 15-year-old population inschools would be considered as functionally illiterate by international standards. The gap betweenGeorgia and other comparative countries on the reading scale is quite significant and it means adifference of approximately three years of school (each year accounts for 40 points) compared toOECD average scores.
Figure 1.2: Share of students scoring levels 2 or above and 4 or above in PISA (2009+)
Source: PISA 2009 (OECD). Note: R, M and S refer to reading, mathematics and science, respectively. All countries exceptfor Georgia and Moldova participated in the 2009 PISA, while Georgia and Moldova participated in 2009+ wave.
1.9 National Curriculum has an important role to guide teachers for improving teachingand learning outcomes. Georgia has already achieved much through the adoption of the first national
488450 455
431 420
506482 471 481 484
533499
521489 510
535 524 519 524496
0
100
200
300
400
500
600
Literacy Mathematics Sciences Mathematics Sciences
Grade 4 Grade 8
Georgia Commonwelth of Independent States
Central and Eastern Europe Western Europe

18Georgia: Education Sector Policy Reviewcurriculum in 2005 and full-scale implementation across the country since 2006.The underlyingprinciple for the new curriculum I to ensure modern and outcomes-based teaching. The document isoriented on students’ personal development and on equipping students with solid, dynamic andfunctional education in line with modern challenges and demands. The new curriculum was furtherrevised in 2010. However, the implementation of the National Curriculum has been a major challengedue to many institutional changes in the system and given the fact that the changes introduced in theNational Curriculum were not aligned with sufficient capacity building of teachers. The short-termtrainings and the lack of sufficient professional development support at the school level, preventedteachers to fully internalize the new concepts prompted by the new curriculum and adapt theirclassroom practices accordingly. Moreover, changes introduced in the curriculum content in 2010were not based on the comprehensive evaluation of the curriculum implementation in the previousyears. The absence of the curriculum implementation monitoring system at the classroom level haslimited the potential benefits of improved curriculum. Moving forward, comprehensive evaluation ofthe curriculum content and regular monitoring of the National Curriculum implementation at theclassroom level will be critical to identify curriculum improvements needs, modify the curriculumcontent, textbooks and support materials, and teacher training accordingly.
1.10 Evidence from different learning measurements shows that there is a clear gap betweenstudents living in urban and rural areas. The results of 2011 PIRLS and TIMSS indicatesignificant disparities in the performance of students by residence (urban/rural). More specifically, 4th
grade students in urban areas scored 49, 42 and 40 points higher compared to their peers in remoteand rural areas in reading, mathematics, and sciences respectively. These findings are consistent withPISA 2009 results. The students in Tbilisi perform 49, 55 and 35 points higher on average in reading,mathematics, and science respectively compared to students who live in villages (see table 1 in annex2). These differences are equivalent to 1.6, 1.8, and 1.2 years of schooling. The differences betweenrural and urban students remain after controlling for student socio-economic characteristics.
1.11 Education outcomes also indicate important differences between students from differentsocio-economic backgrounds. PISA results show that students who performed better are more likelyto come from: (i) the capital or large cities; and (ii) more advantaged families, according to the HomeEducational Resources (HER) Index. This index is based on parents and students’ reports of thenumber of books, the number of children’s books, the presence of four educational aids (computer,study desk for own use, books of their own, and access to a daily newspaper) in the home, and onparents’ education. Performance differences for students with these socioeconomic backgrounds arequite remarkable.
1.12 The comparison of data trends further highlights the correlation between socio-economic indicators and student performance. As illustrated in the figure below, performance ofstudents with higher parental education in TIMSS has improved considerably between 2007 and 2011,namely by 45 points in science and by 79 points in mathematics. In contrast, performance of studentswhose parents have only basic education has deteriorated by 16 and 25 points in science andmathematics respectively. The reading achievement results from PIRLS also indicate that studentswith parents with higher education attainment have improved their performance by 24 points.

19Georgia: Education Sector Policy ReviewFigure 1.3: The Dynamics in the gaps in Student performance from 2006 to 2011
Source: Team estimates based on TIMSS and 2011, PIRLS 2011
1.13 Employment rates among Georgian youth are low irrespective of their level ofeducational attainment. The differences in employment rates are not significant between uppersecondary and VET graduates in the age group of 19 to 24, but in the older age group employmentrates are lower for VET graduates. However, it must be noted that the share of hired professionals ismuch higher for the graduates of VET programs as compared to the graduates of upper secondaryeducation in both age groups. The employment rate is higher among higher education graduates aged19-24, however, the difference is not significant among the older age group. Young people withhigher education diplomas are more likely to have higher earnings3 compared to their peers withsecondary education. Nonetheless, a large share of these young people has the jobs that do notrequire higher education (see tables 1.2 and 1. 3 below).
Table 1.2: Employment rates among Georgian’s youth (age groups of 19-34) by education attainment, 2012
Age groups
Employment Indicators (%) by Education Level
Upper secondary VETHigher
Education
19-24 years old
Employed 35 39 51
Hired employed 13 21 46
Self-employed 22 18 4
Unemployed 16 27 26
Non-active 50 34 23
25-34 years old
Employed 59 49 62
Hired employed (20) (30) (46)
Self-employed (39) (19) (16)
Unemployed 15 19 18
Non-active 26 32 20
3 EPPM, 2013
350
370
390
410
430
450
470
490
510
530
550
Father with higher education Father with basic education National Average
2007 2011
Mathematics in Grade 8
2007 2011
Science in Grade 8
2006 2011
Reading in Grade 4
Father with higher educationFather with basic education

20Georgia: Education Sector Policy ReviewSource: Team calculations based on Geostat’s National Household Integrated Survey of 2012
Table 1.3: Georgian’s youth (25-34) economic activity and occupation statistics by education attainment
Uppersecondaryeducation
Secondaryprofessional
program
Bacheloror
equivalentMaster orequivalent
Employed 59% 49% 62% 61%
Legislators, senior officials and managers 0% 0% 5% 6%
Professionals 0% 1% 17% 23%
Technicians and associate professionals 3% 15% 11% 9%
Clerks 0% 1% 2% 4%
Service workers and shop and market sales workers 7% 7% 8% 5%
Skilled agricultural and fishery workers 34% 15% 10% 8%
Craft and related trade workers 6% 5% 2% 2%
Plant and machine operators and assemblers 3% 3% 2% 1%
Elementary occupations 6% 2% 4% 3%
Inactive 26% 32% 20% 17%
Unemployed 15% 19% 18% 22%Source: Team estimates based on Geostat’s National Household Integrated Survey of 2012
Education is producing neither cognitive nor social skills. There is a large pool of jobless workerswith tertiary and secondary education, which could suggest that employers should not have problemsfinding workers with skills to perform the necessary labor. However, many Georgian employerscomplain that hiring workers with required skills is difficult. Importantly, innovative and growingfirms suffer from skill shortages the most. According to the World Bank 2012 Employer Survey, thelargest problem that employers face in Georgia is the skills of their workers. Employers in Georgiaare looking for the professionals with effective social, literacy and numeracy skills, and higher ordercognitive skills, such as solving problems and making presentations. According to Georgianemployers, young workers most often lack foreign language, leadership, creative thinking andproblem solving skills, as reported in Table 1.4. It should be noted that part of the mismatch may beexplained by the fact that employers expect graduates to learn job-specific skills in school and that isnot the objective of the education system. In any case, there are indications that graduates come to thelabor market with severe basic skills gaps. This is also evidenced by PISA 2009 which shows thatupon the completion of compulsory education, the prevailing majority of students do not have thebasic cognitive skills that are needed to successfully engage in further studies or enter the labormarket. This implies that skill shortages, if not addressed, may become an important constraint to themodernization and growth of the Georgian economy4 .
4 Rutkowski, 2013

21Georgia: Education Sector Policy ReviewTable 1.4: Job-related characteristics that secondary education and university graduates lack
Source: Rutkowski, 2013. World Bank Employer STEP survey 2012
1.14 High unemployment rates can be partially explained by the lack of specific professionalskills in demand by the economy. The majority of jobs in Georgia are located in the traditional, low-productivity sectors, while only a minority is in modern, high-productivity sectors. While common tomany countries, this traditional employment structure limits the demand for highly educated workers.5
This is further supported by the World Bank 2012 employers’ survey, which showed that there is agrowing demand for middle-skilled workers, which the education sector is not producing.
1.15 Student choices of study programs are made without adequate knowledge of labormarket needs and existing instruments for making impact on student choices are not effective.The majority of university students are enrolled in academic fields in social sciences, humanities, arts,business, and law. However, according to a recent study6, the unemployment rate is higher for thegraduates of social sciences, humanities, and arts programs. Enrolment in these programs in Georgiais higher compared to European and CIS average. In order for students to make intelligent decisionson their future career fields, they need to have reliable information on labor market prospects. Startingfrom 2010, the Government has been trying to affect the students’ choice through financing. There isa higher share of grants allocated into sciences, engineering, education compared to law and businessso that students enrolled in business and law can receive the state funding only in case they score highenough to be eligible for the 100% tuition fee waiver. However, the quality of government estimatesis also not quite reliable as the links with private sector market employers are practically non-existent.Informed decision making in the process of choosing the profession still represents the significantchallenge for the pupils and potential students. In order to address the need, the MoES startedestablishment of professional orientation system, which will be piloted from 2014 in 300 generaleducation institutions.
Key Recommendations1.16 A radical improvement of the relevance of education and training is necessary.Education and training must be relevant to individuals and to the labor market. Recent studies onGeorgia’s workforce development and skill mismatch recommend that substantial progress must beachieved to enable the MoES to acquire a good understanding of labor market needs and develop thecapability to design and redesign programs so that they fit the needs of employers and the society.
5 Rutkowski, 20136 EPPM, 2013

22Georgia: Education Sector Policy ReviewThis would require a renewed partnership between the education and training system and the privatesector to close information and knowledge gaps that would allow employers to better communicatewhat they expect from education and training sector, and educators to improve quality and to betterassess and certify learning. The education system in Georgia would benefit from regular assessmentsof the needs of the labor market, which could help increase the relevance of lifelong learning for bothjob seekers and employers. Additionally, regular analysis of vacancies should be also carried out toguide retraining services. However, this is likely to be an activity which requires coordination ofmultiple ministries and stakeholders, not only the MoES. For these purposes, it is important that thegovernment recognizes employers as strategic partners and formalizes their role, in setting prioritiesand in enhancing skills-upgrading for workers7.
1.17 The diagnostic analysis reveals two key challenges facing the general education sector inGeorgia: (i) poor learning outcomes, the education system is failing to provide functional literacy toan overwhelming majority of students (over 60% of the surveyed 15 year olds are functionallyilliterate); and (ii) Indications of a skills mismatch between what is learned and what the labor marketneeds. The key recommendations targeted at improving the quality of education are as follows:
To address the issue that a large majority of students in general education lacks basicproficiency skill in key learning domains, such as literacy and numeracy (applied to analyzingand solving problems tested by PISA), as evidenced by the existing student assessments,improvements to the quality of education – including curricular improvements- should focuson eradicating functional illiteracy and developing key competencies that would preparesecondary education graduates to either pursue higher education or succeed in the labormarket. In its efforts for strengthening competency based curriculum improvements, Georgiamay benefit from the resources and networking opportunities available through the Europeanproject Key Competence Network on School Education (KeyCoNET). The latter is a growingnetwork of European countries for improving implementation of key competencies ineducation reform.
It is essential to harmonize other components of the education system with the nationalcurriculum changes. This includes alignment of the in-service teacher training andprofessional development, high stakes examinations and school improvement anddevelopment policies and plans with the curricula modifications and innovations.
The low Employment and underemployment amongst graduates suggest relevance problemsfor vocational education and training and higher education programs. The Focus onrelevance by shifting to a demand-led approach in which employers’ feedback help shape theeducation system will be needed. This will require a better understanding of the currentsituation and building consensus among training providers, employers, and key policyproviders. In the meantime, the existing quality assurance system needs to be developed inline with the internationally recognized quality assurance frameworks and focus on relevancefostering a demand-led approach.
1.18 Georgian youth need adequate information on the labor market prospects to make informedstudy and career choices. This can be achieved by introducing counselling services at educationalinstitutions or resources centers and web based programs providing information on the employmentrates by study programs and institutions.
1.2 Access and Equity
1.19 The nature of the social inclusion issues cuts across all the educational levels and ismanifested in major gaps in participation rates. The disadvantaged groups, such as children and youth
7 Ibid:“Georgia workforce development SABER Country Report” WB, 2013 and “Skills Mismatch & Unemployment/LaborMarket Challenges In Georgia”, WB 2013

23Georgia: Education Sector Policy Reviewfrom poor socio-economic backgrounds, ethnic minorities, special needs students, face variouschallenges related to access and equity at each level of education. While participation issues arelargely attributed to social and cultural issues, lack of consolidated social inclusion policy furtherexacerbates the problem.
1.20 Preschool enrolment in Georgia is low by regional standards. Regional comparisons showthat the net enrolment rate in Georgia (46% for 2011/12 of which 40% in public and 4% in privatekindergartens) is higher than Azerbaijan and Armenia but significantly lower than New MemberStates (EU) or CIS countries, such as Belarus, Moldova, and Ukraine and far from EU’s or OECD’s
nearly universal coverage (see figure 1.4 below).8
1.21 The enrolment rates showed moderate but promising growth in the last decade.Preschool enrolment sharply declined following Georgia’s independence and Net Enrollment Rate(NER) in public kindergartens decreased from 44.6% in 1989/90 to 28.3% in 2001/02. This sharpdecrease was attributed to several factors that affected the country during that period: economiccrises, political destabilization, the Abkhazia War and civil war9. In the early 2000s, it started torecover, rising from approximately 28% in 2001 to almost 40% in 2006. However, after thedecentralization reform of preschool education was introduced in 2005 this recovery abruptly stoppedand enrolment rates have remained almost stagnant for several years. This can be explained by the2005 decentralization reform placing the financial burden on municipalities. Many municipalitieswere not able to sustain the existing kindergartens due to the lack of resources. Recent signs ofimprovement are encouraging, as enrolment rates showed moderate but promising growth during thelast five years from 36.9% in 2008 to 57% in 2013 (figure 1 in annex 2).The growth can be partiallyexplained by the increase in the municipality budget for preschool institutions.
Figure 1.4: Preschool Net Enrolment Rate (2011)10
Source: PER, 2014; Geostat, 2014.Note: Figures show data for 2011, except for Georgia (2013) and Slovakia (2010).
1.22 Significant enrolment disparities are visible across regions. The recent evolution of grossenrolment rates by regions shows clear signs of growth in all regions since 2003 (see table 3 in annex2). However, recent trends also indicate marked enrolment disparities exist across regions. Grossenrolment rates are over 70% in some regions (Tbilisi and Mtskheta and Tianeti) and less than half of
8 For OECD and EU figures, see OECD (2013), p. 286.9 UNICEF 201310 Note: Net enrolment rate of children aged 3-6 (or 3-5, depending on the country). Figures for 2011, except for Georgia(2012) and Slovakia (2010).

24Georgia: Education Sector Policy Reviewthat in others (31% in Samtskhe and Javakheti).. These disparities among municipalities appear to becorrelated with the intensity of public expenditure after controlling per child expenditures.
1.23 Although recent trends show positive improvement in enrollments, considerable gapsbetween various population groups remain. Significant parts of the Georgian society areunderrepresented in their participation in preschool education. Although their enrolment showedpositive signs and increased in the last few years, their relative position is still poor. Table 1.5 showsthe evolution of net enrolment rates for the most important underrepresented groups: people living inrural areas and people from different economic backgrounds. The gross enrolment ratio among ruralchildren has increased to 41% from 2010 to 2013. Participation is also increasing steadily amongchildren from poor backgrounds (from 42% in 2010 to 57% in 2013). The gap between richest and thepoorest quintiles between urban and rural children remain the same.
1.24 There is wide variationin fees charged for preschoolservices across the country. In2007, municipalities started toexempt some families from fees.Although the share of childrenenrolled free of charge was low in2007 (only 1% of total publicenrolment), the policy wasstrengthened in the followingyears. By 2011 mostmunicipalities enrolled variousdisadvantaged groups free ofcharge. The increase in enrolmentcould also be associated with theincrease in private preschoolenrolment. According to NationalIntegrated Household Survey data,enrolment in private kindergartensincreased from 4% to 9% from2009 to 2011. The effect ofpoverty on preschool enrolmentdiffers largely across regions,
which could be partially attributed to the variation in the fee exemption policies among municipalitieswithin the regions.
1.25 Abolishment of parental contribution towards pre-school education in September 20013has resulted in higher coverage, but is not likely to enhance the quality of the service beingprovided if no further measures are taken. The role of the Ministry of Education and Science hasremained limited and there has been no effective enforcement of minimum quality of service deliveryand equal provision across the country. Similar to Georgia, in the majority of countries, preschoolprovision is decentralized to the local levels and such arrangement has many strengths. In contrast,however, the central government tends to play an active role in setting coherent national qualitystandards and monitoring service delivery. Given that currently the Ministry is developing a new lawon preschool education and new consolidated educations sector strategy, there is an excellentopportunity to re-examine the role of MES in preschool education and introduce mechanisms withinthe current institutional set up to provide (i) coherent national goals for preschool education; (ii)coherent preschool education standards and curricula: (iii) viable system to facilitate and monitor thequality of preschool education service delivery across the country.
1.26 The limited geographical coverage of the preschool network is the most important factor forenrolment disparities in rural areas. About half of the parents interviewed in 2011 said the reason theirchild was not enrolled in a kindergarten was that there was none close to their home or in their village.
Table 1.5: Main Social Inclusion Gaps in Net Enrolment from 2010 to2012
Population Subgroups 2010 2012 2013
Type of residence
Urban 54 60 70
Rural 28 42 41
Ethnicity
Georgian 45 55 62
Consumption based poverty quintiles
Poorest quintile 34 42 51
Quintile 2 34 48 49
Quintile 3 41 55 58
Quintile 4 47 58 67
Richest quintile 54 63 67
National Average 42 52 57
Source: Team estimates based on the National Integrated Household Surveyof 2010, 2012, and 2013.

25Georgia: Education Sector Policy ReviewAs NIHS data suggests, physical access to kindergartens is particularly problematic for ethnicminority population. Forty-eight percent of parents in rural population and sixty-seven percent ofAzerbaijani parents said there was no kindergarten close to their home or in their village (see Table1.6).
Table 1.6: Reasons for Not Attending Kindergarten among 3-5 years old group in 2011
Grounds for notbringing the child toKindergarten
Settlement type Poverty Quintiles Ethnicity
Tot
al
Urban Rural Poorest Q2 Q3 Q4 Richest Geo Azeri
PerceptionsThe child is tooyoung
53 23 30 31 34 32 44 39 10 33
I prefer home care 18 12 12 10 16 18 15 12 21 14
AccessNo K close to home(in the village)
2 48 28 38 29 35 31 25 67 32
Money Shortage 13 12 24 12 11 6 4 15 1 12
Perceived QualityBad conditions at K 3 1 3 2 2 0 1 2 0 2
Other 11 5 3 8 9 10 5 7 1 7Source: Team estimates based on the National Household Integrated Survey of 2011.
1.27 Enrolment in compulsory education is almost universal, although, participation inupper secondary education is low. Georgia has historically enjoyed universal literacy rates and highvalue placed on education. Table 1.7 below shows that enrolment is high in compulsory educationachieving NER of 96.9 percent in primary education (Grades 1 through 6) and 85 percent in lowersecondary (Grades 7 through 9). However, enrolment at upper secondary education level is only 73.1percent.
Table 1.7: Gross and Net Enrolment Rates in General Education (%)
Level of Education 2008-2009 2009-2010 2010-2011 2011-2012 2012-2013 2013-2014
Gross Enrolment Rate (GER)
Primary 104 103 103 105 104 102
Lower Secondary 97 99 101 99 101 102
Upper Secondary 83 91 84 75 74 79
Net Enrolment Rate (NER)
Primary 97 95 96 97 97 97
Lower Secondary 85 86 88 87 88 86
Upper Secondary 73 75 74 68 68 73Source: EMIS, 2014
1.28 The transition from lower to upper secondary education is problematic. A reduction inenrolment is visible at the end of lower secondary, where dropout rates rapidly escalate from Gradeseight to nine raising from 0.88% to 6.48%. Figure 1.7 below shows that high dropout rates are thencommon throughout upper secondary (Grades 10 through 12). A plausible explanation for thissituation points to recent school management practices applied after the introduction of the schoolleaving exams in 2011. The low performance of students in school leaving exams was used to fireprincipals in several schools, without giving consideration to the complexities pertinent to specificschools based on their location. This punishment provided incentives to the principals to identifystudents at risk of failing the exams early in the process and discourage them to continue studies inupper grades. This seems to explain the visible effects in the following school year (2012-13) wheremany students either repeated the class or dropped out altogether. The situation appears to haveimproved since the punishment was not formally repeated in the subsequent years, however, it is stilltoo early to say that this tendency is definitive as it is not known if school principals continue to applythese measures informally. This situation is creating a significant early school-leaving situation; this isa problem that the country will have to address rapidly as early school leaving generates substantial

26Georgia: Education Sector Policy Reviewsocial costs in the medium term. Prevention is the most important action to address early schoolleaving, as the compensation policies that are needed to resolve it are usually very costly.
1.29 Success rates for completingupper secondary education showimportant regional differences. At theend of upper secondary education (Grade12), students must pass school leavingexaminations in eight core curricularsubjects to receive a Diploma, which is anecessary prerequisite to access highereducation. Regional differences aremarked for the pass rates of the schoolleaving examinations. The nationalapproval average is of 82% countrywide.Pass rates in Tbilisi are over 90%11 as well
as in other big cities. However, much lower rates are achieved in Kvemo Kartli (Marneuli: 44%,Bolnisi: 64% and Tsalka: 63%) and Samtskhe Javakheti (Akhalkalaki: 62%).
1.30 Inclusion of special needs students in general education remains a challenge. Initialefforts to introduce the principles of inclusive education in the education sector were launched in2004. The inclusive education has been promoted at the general education level. Since 2012, effortswere launched to provide inclusive education at the vocational education and training level. Neithervocational nor higher education law has been amended to guarantee the rights of special needsstudents. All public schools are required to implement inclusive education, however not all of themhave appropriate facilities. According to MoES, only 249 general education schools are equipped withramps and 190 with special resource room. Public schools’ learning environment is not adapted forthe children with sensory disabilities. Currently the education system only provides boarding schoolsfor children with hearing disability, for visually impaired children and for children with mentaldisorders. Approximately 3,450 Special Education Needs (SEN) students are currently involved informal education system. The demand from parents to expand opportunities for SEN students hasbeen growing in recent years, which is a positive trend but much work remains to be done to ensureadequate learning environment and well trained teachers to accommodate this need.
1.31 Within the reform framework a multidisciplinary team has been introduced at the Ministry ofEducation and Science consisting of psychologist, special education teacher and occupationaltherapist to assess those children, whose parents require such assessment. Evaluation procedures areyet to be developed for placement of students in an institution, boarding school or just a regularclassroom. The standard evaluations would need to include IQ, academic, adaptive, social/emotionaland motor skills.
1.32 The Inclusive Education group at the Ministry of Education and Science has developed anaction plan for the development of Inclusive Education 2014-16, which has to following provisions:elaborating the legal framework, improving the financing mechanism for SEN pupils and students,ensuring quality inclusive education at all three levels of education (school, vocational, higher) anddeveloping the mechanism for monitoring SEN pupils and students.
1.33 The new per capita financing system has special provisions of inclusive education.Namely, if a school has 1 to 7 special needs children, they are staffed with one special educationteacher with the annual funding of 4,200 GEL; schools with 7 to 14 students special needs students
11 NAEC, 2013
Source: EMIS, 2014
0
5
10
15
Grade 9 Grade 10 Grade 11 Grade 12
2011-2012 2012-2013
Figure 1.5: Drop Out Rates by Grade

27Georgia: Education Sector Policy Revieware entitled to have two special needs teachers with annual funding of 8,400 GEL; schools with 4 to23 students - 3 teachers and 12,600 GEL; More than 23 students - 4 teachers and 16,800GEL.
1.34 Following the rise of new private institutions, VET enrolment is growing to approachthe level prior to 2008. According to information gathered by MES and Geostat, enrolment in VETprograms sharply decreased in 2008 with the closure of many vocational education institutions. Thedemand has been on the rise with enrolment doubling between 2010 and 2011 and further increasingin 2012 (Figure 1.8). The increase in participation can be attributed both to positive and somewhatcontroversial interventions in recent years. On one hand, the government’s investments ininfrastructure of public institutions, increased focus on improving quality of the programs, andincreasingly important network of private providers might have increased the attractiveness of thesector. At the same time, many low-performing students were discouraged to continue academicstream since in 2010 school principals were made accountable for student results in school leavingexams (discussed previously). Moreover, participation increased at the expense of very short VETprograms, the quality of which, though not formally assessed, is not seen as being high.
The ample majority of students enrolled in VET belongs to the age group of 15-18 (7,800 students)and the age group of 19-21 (7,160 students), but these figures represent only a fraction of these agegroup populations (for example, only 4% of 19-21 age group participate in VET) (Team’scalculations based on VET 2013 database provided by EMIS).
Figure 1.6: Trends in enrolment and number of vocational education institutions (excluding HigherEducation institutions)
Source: Geostat for 2001-2009; MES for 2010-2013.
Note: Between 2009 and 2011 Geostat stopped collecting VET data resulting in data gap for this period.
1.35 Despite recent attempts to increase the number of VET programs, the geographicalcoverage of VET programs represents a major obstacle to further improvements in enrolment.Currently, there are 34 public and 66 private VET centers, community colleges, and universities thatoffer vocational education and training programs. The network of VET programs has grown from 442to 529 in 2013.12
12The MoES has collected the data on enrollment from public and private VET centers in 2012 and 2013; however, the dataon private enrollments is incomplete. Therefore, it is the dynamics in private enrolments.
0
5000
10000
15000
20000
25000
30000
35000
2001
2002
2003
2004
2005
2006
2007
2008
2009
2010
2011
2012
2013
Enr
olm
ent
Private Public Total
0
10
20
30
40
50
60
70
80
90
100
2004/2005 2008/2009 2012/2013
Num
ber
of in
stit
utio
ns
Public Private

28Georgia: Education Sector Policy Review1.36 Access to VET remains a challenge in several regions of the country. In some parts of thecountry there are no VET centers. Young people from these regions have to move to other cities tostudy, which is associated with high cost especially for the poor who represent the major barrier toVET. From 2012 to 2013 the number of VET centers has increased, but their geographicaldistribution is still not addressing these issues fully; .
Figure 1.7: Map of professional (Level 1-5) programs as of 2013
Source: EMIS VET Database, 2014
1.37 Since the approval of the State Professional Education Reform Strategy 2013-2020, one of themost important initiatives was the development of VET network expansion plan. Throughout 2013,the MoES also introduced new admission exams specifically designed for VET applicants andexpanded VET applicant registration sites from 3 to 103 centers. On the quality side, the Ministrythrough EU and UNDP support updated 75 standards13 based on Dacum methodology, which focuseson engaging employers in the standard revision process; Moreover, work was launched to revise theexisting Qualification Framework; the Modular Education Concept Note, Validation Guide and othermethodological materials were developed in close consultation with the stakeholders. The strategy forprivate sector engagement in VET was also prepared through the support of the MillenniumChallenge Account Georgia. In 2013, inclusive education has been introduced and more than 100beneficiaries have been enrolled in vocational colleges. The inclusive education specialists andassistants started working at vocational colleges, training materials are being adapted, theinfrastructure projects are planned according to the principles of universal design.
1.38 Dead ends and rigid pathways to higher levels of education are also constraints of thecurrent VET system. Prior to the 2005 reform, vocational and technical education was offered at thesecondary level and students enrolled in secondary vocational and technical programs receivedsecondary education together with vocational and technical education and training. The rationalebehind the 2005 reforms was to create easier paths to employment and to quickly address the existingskills mismatch, which resulted in the introduction of numerous short and medium (from 3 months to2 years) vocational education programs for graduates of compulsory lower secondary educationprograms (grade 9). Vocational education and training programs became disengaged from secondaryeducation and students who enroll in vocational programs based on lower secondary education nolonger receive a secondary education diploma and qualifications entitling them for further educationpaths. More specifically, these students are not prepared to pass external examinations for obtainingschool diploma, a prerequisite for participation in the university entrance examinations. This hassomewhat decreased the attractiveness of vocational and technical education and is probably relatedwith a marked reduction in enrolment (from 20% in 1999 to 3% in 2009). An additional problem iscreated by the fact that the credits accumulated in VET programs are not recognized in higher andtertiary education programs creating further dead ends.
13 50 standards were updated by NCEQE, 17 by EU and 8 by UNDP.

29Georgia: Education Sector Policy Review1.39 Despite recent progress, dropouts in VET are still generating significant wastage ofresources. According to latest data, the overall dropout rate for VET programs decreased from 20%to 8% from 2012 to 2013 (EMIS, 2014). This reduction was more marked in public education (from23% in 2012 to 8% in 2013) than in private and 8% of public VET program students drop out. Thismeans that more than 1,000 VET students dropped out from the public education system in2013There is no comprehensive analysis of the reasons explaining the high dropout rates, but severalissues emerged from the available analysis: (i) low academic readiness of students for the selectedprogram; (ii) the lack of information about the course and the profession (when the decision is made)and poor counselling; (iii) low quality of some of the programs (such as Gardening, Marketing, TourOperator and Restaurant Administrator), which are marked by particularly high dropout rates onaverage.
1.40 The first voucher scheme was introduced by the Government in April 2012. The voucherprogram was the main source of VET financing for students in Georgia. . The financing for VETprograms levels I to III was provided in the form of student vouchers (both full and partial). Thevoucher amount was flat fixed at 1,000 GEL and did not differentiate the costs of the different studyprograms. Tuition waiver of 700 GEL was applicable only for priority programs determined byMoES. Only vulnerable students and students under state care were given full funding as well as theones passing specific tests. Programs at levels IV and V had similar financing arrangement as highereducation programs, where financing was provided through student grants based on the resultsachieved in the general aptitude test of the university entrance examinations.
1.41 Financing of the VET sector was reformed and the new financing scheme was launchedin November, 2013. Three main financing mechanisms were introduced: (i) differentiated vouchersbased on the number of students taking into account costs of individual study programs and replacingthe previous flat vouchers. These vouchers cover teacher salaries and learning materials; (ii) Programbudget transferred quarterly to VET institutions to cover administrative costs and utilities, the size ofbudget support varies depending on the size of VET institutions; and (iii) targeted program financingto support Ministry’s different priority initiatives. According to the new scheme, vouchers areawarded to all students who successfully pass the newly introduced VET unified admission examsand are admitted in public vocational institutions. Despite these positive shifts, some critical problemsregarding financing remain to be addressed. The indirect costs borne by the students are not includedin the voucher. The cost of living expenses pose serious challenges for poor students from rural andremote areas, because students who wish to enroll in VET programs have to pay for their livingexpenses. Because of this reason, the MoES paid rent for VET students in Mestia in 2014.
1.42 Enrolment in Higher Education in Georgia is low by international standards. Currently,50 private and 18 public research and teaching universities and colleges enroll a total of 146,600students. In 2012 the gross enrolment ratio in higher education reached 28%, which is one of thelowest in the region and significantly lower compared to the average GER in Western European andCEE countries. Compared to other levels of education in Georgia, private enrolment is highest athigher education level, although it has dropped from 53% in 1999 to 25% in 2011. At pre-primary andgeneral education levels (Grades 1 to 12), private enrolment constitutes to 10% of total enrolment.Georgia’s private enrolment at higher education level is high compared to most countries in the regionexcept for Kazakhstan (50%), Latvia (94%), Estonia (84%), Romania (37%) and Poland (33%).
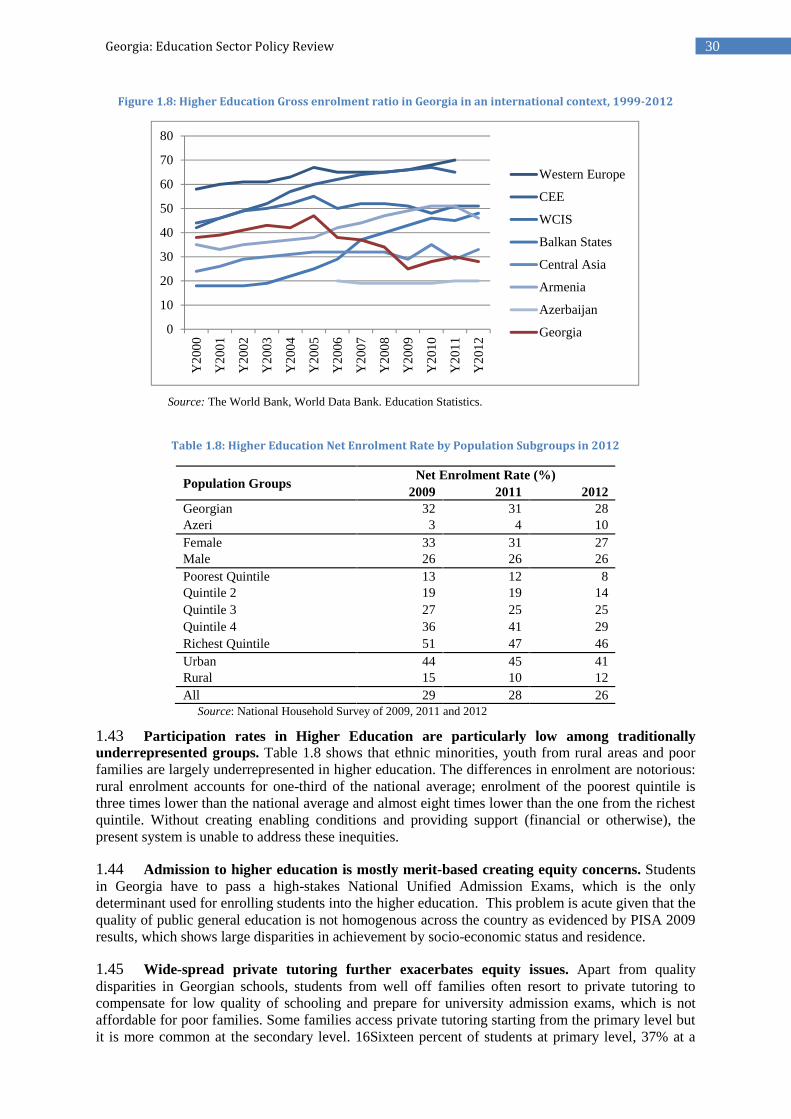
30Georgia: Education Sector Policy ReviewFigure 1.8: Higher Education Gross enrolment ratio in Georgia in an international context, 1999-2012
Source: The World Bank, World Data Bank. Education Statistics.
Table 1.8: Higher Education Net Enrolment Rate by Population Subgroups in 2012
Population GroupsNet Enrolment Rate (%)
2009 2011 2012Georgian 32 31 28Azeri 3 4 10Female 33 31 27Male 26 26 26Poorest Quintile 13 12 8Quintile 2 19 19 14Quintile 3 27 25 25Quintile 4 36 41 29Richest Quintile 51 47 46Urban 44 45 41Rural 15 10 12All 29 28 26
Source: National Household Survey of 2009, 2011 and 2012
1.43 Participation rates in Higher Education are particularly low among traditionallyunderrepresented groups. Table 1.8 shows that ethnic minorities, youth from rural areas and poorfamilies are largely underrepresented in higher education. The differences in enrolment are notorious:rural enrolment accounts for one-third of the national average; enrolment of the poorest quintile isthree times lower than the national average and almost eight times lower than the one from the richestquintile. Without creating enabling conditions and providing support (financial or otherwise), thepresent system is unable to address these inequities.
1.44 Admission to higher education is mostly merit-based creating equity concerns. Studentsin Georgia have to pass a high-stakes National Unified Admission Exams, which is the onlydeterminant used for enrolling students into the higher education. This problem is acute given that thequality of public general education is not homogenous across the country as evidenced by PISA 2009results, which shows large disparities in achievement by socio-economic status and residence.
1.45 Wide-spread private tutoring further exacerbates equity issues. Apart from qualitydisparities in Georgian schools, students from well off families often resort to private tutoring tocompensate for low quality of schooling and prepare for university admission exams, which is notaffordable for poor families. Some families access private tutoring starting from the primary level butit is more common at the secondary level. 16Sixteen percent of students at primary level, 37% at a
0
10
20
30
40
50
60
70
80
Y20
00
Y20
01
Y20
02
Y20
03
Y20
04
Y20
05
Y20
06
Y20
07
Y20
08
Y20
09
Y20
10
Y20
11
Y20
12
Western Europe
CEE
WCIS
Balkan States
Central Asia
Armenia
Azerbaijan
Georgia

31Georgia: Education Sector Policy Reviewbasic level and 60% of students in the 12th grade take private classes on a regular basis. Privatetutoring differs by place of residence and family income, as shown in table below. As a consequence,merit-based university admission system further penalizes poor segments of population.
1.46 The cost of universityeducation is high and difficultto afford for large part of thepopulation. During the last fouryears, the annual tuition fee inmost public universities wasGEL 2,250 per year (equivalentto USD 1,350) and rangedroughly between USD$1,200 to
USD$6,424 in private institutions. As a share of GDP per capita, this represents 37% in publicinstitutions, 94% in private research universities and 51% in private teaching universities. This levelof tuition fees is common to some post-soviet countries (Azerbaijan, Armenia, Kazakhstan) but veryhigh when compared to countries in Europe and Northern America as well as other developedcountries (Japan, South Korea, Australia). In contrast, tuition fee as a percentage of GDP in thesecountries range from 1 to 20 percent in public universities, 2 to 50 percent in private universities. Thisputs Georgia among the countries with the highest tuition fees both in public and private tertiaryinstitutions (see table 4 in annex 2).
1.47 The bulk of the financial support provided to students is in the form of merit-based stategrants, full or partial. Only 6 to 10 percent of the total student grant amount is allocated by means ofneed-based support for students from minority language schools, schools in remote areas, studentsfrom conflict zones, orphans and students with several siblings, students eligible for social assistance,etc. The allocation of the need-based grants also has a merit component in it. The students who applyfor need-based grants are ranked by their test scores within their quota group and the ones with thehighest scores receive the grant. The government does not offer student loans to support students tobear the costs of higher education (see table 1.10).
Table 1.9: Private Tutoring by Family Income in Grade 12
Family Income(in GEL)
Private Tutoring(%)
Up to 400 36
Between 401-700 72
Over 700 87
Source: EPPM 2013

32Georgia: Education Sector Policy ReviewTable 1.10: Student breakdown by types of state grants in 2009 and 2013
Students in 2009-2010
Students in 2013
Admitted All
# % # % # %
Students paying full fees 46,796 62 19,160 63 80,288 64Merit-based grants:
100% 7,186 9 1,186 4 5,760 5
70% 3,844 5 1,437 5 7,150 6
50% 5,736 8 4,018 13 12,142 10
30% 9,747 13 0 0 13,870 11
Total merit-based grants 26,513 34 6,641 22 38,922 31Of which needs based grants14
30% (242) (0) (68) (0) (397) (0)
50% (254) (0) (225) (1) (698) (1)
70% (455) (1) (0) (0) (683) (1)
Total needs-based grants 1720 2 1006 3 2411 2Students in priority areas - - 3,426 11 3,426 3Total 75,363 100 30,458 100 12,5047 100
Source: Salmi and Andguladze, 2011; National Education Quality Enhancement Center, 2014
1.48 The current system for the allocation of student grants intensifies inequities. Table 1.10shows that up to 50 percent of all students receive different subsidies from the state. Tertiaryenrolment and grant allocation figures for secondary school graduates in 2010 show clear disparitiesin grant allocation by residence (see table 1.11). The share of students who received state studentgrant was 13% larger among Tbilisi residents when compared to students living in towns and rurallocations and 8% larger than for students living in other major cities (Kutaisi, Batumi, and Rustavi).Moreover, students with more educated parents are also more likely to benefit from the currentstudent support system. A higher education graduate tracer study conducted in 2013 showed that 47%of students whose both parents had higher education degree received state grant while the share ofstate grant beneficiaries was 28% and 16% for students with only one parent with higher educationand none of the parents with higher education respectively.
Table 1.11: Higher Education Enrolment and Allocation of Grants by Residence in 2010
Student's residence TbilisiOthercities
Towns and rurallocations
Country
Mean score received on the NationalUnified Exam
1894 1872 1816 1823
Total Grant recipients 40% 32% 27% 33%
100% grant recipients (6%) (4%) (4%) (5%)
70% grant recipients (7%) (5%) (4%) (6%)
50% grant recipients (10%) (9%) (6%) (8%)
30% grant recipients (17%) (14%) (13%) (14%)
Students paying full fees 60% 67% 73% 67%Source: Salmi and Andguladze, 2011
1.49 The existing higher education programs are rigid and do not meet the needs of studentswho need to work on a full or part-time basis. An emerging challenge in TE education is the largeshare of undergraduate students being employed full-time. According to 2012 Integrated HouseholdSurvey, 15% of students enrolled in TE institutions have part or full time jobs and almost half of thesestudents work 40 or more hours a week (see table 5 in annex 2). The students might be working for
14 Supplementing merit based grants

33Georgia: Education Sector Policy Reviewfinancial reasons or for accumulating the experience that would make them more competitive in thelabor market. According to the World Bank Study, employers value previous experience highly.15
These students, however, are not given an option of part-time studies because the law on highereducation does not allow for such option for universities to offer. Irrespective of how many courses astudent takes a semester, s/he has to pay the full tuition. This arrangement makes the universitysystem highly rigid and forces students into less engagement in their studies. Other options such asacknowledging progress through a credit system, providing part-time or evening courses are notavailable.
Key Recommendations1.50 Improving access and equity is a key strategic objective that requires strategic, sector-wide planning and management. Social inclusion standards, targets, measures and tools must bedefined at the national level and not left to the arbitrary decision of the schools and municipalities.The nature of the social inclusion programs and measures cuts across all the educational areas, andtherefore, their overall monitoring and evaluation requires special ministerial attributions that are nottoday defined at the centralized level. The responsibility for implementing and monitoring of many ofthese policy measures can be delegated to sub-sector area management units (pre-school, general,etc.), however there is subject specific knowledge (children with disabilities, usage of mother tonguesin education, adult education, etc.) that would benefit from a more integral understanding of the topicsfor all education areas.
1.51 A fundamental issue that needs to be addressed is that the ministry is operating in theabsence of a Social Inclusion Policy that should define the main principles, goals and targetstogether with the criteria to guide its implementation. Partial initiatives are already emerging inthis area, (regarding adult education, children with disabilities and dealing with displaced populationand ethnic minorities), but a more integral approach and stronger support is needed to achieve goodeducational results.
To address the issue of low preschool enrolment by regional standards despite moderateincrease in the last decade, and the exclusion of several groups (ethnic minorities, ruralchildren and children leaving in poverty); it is critical to find the most affordable solutionbefore starting the preschool network expansion. The expansion should take into account allpossible means of reducing costs for the provision of new classrooms (including efficiencygains, public private partnerships and other) in all areas. Consultation with a wide range ofstakeholders should be a precondition for any further expansion of the system. The followoptions can be considered:
o Prioritizing the five-year old children, in case there are no spots for all children.Providing all children with at least one year of preschool education is likely to improveschool readiness.
o Bringing the private sector in can have beneficial impact. By encouraging the privatesector to provide preschool education, the Government would (i) allow for differentoptions of service delivery, which can be appealing to parents that are willing to pay forthese differentiated services and (ii) free spots for poorer children in the public system. Ifdemand is in place and supply of public institutions is not large enough or parents havedifferent preferences with respect to the type of preschool education, private institutionswith different models will arise. In this scenario, the existence of a body that assuresquality standards and monitoring preschool institutions is critical.
o Building public awareness. The individual benefits of preschool education should beunderscored as a means of making parents more knowledgeable about preschooleducation and hence more willing enroll their children. There is anecdotal evidence that
15Rutkowski, 2013 based on World Bank employer STEP survey, 2012

34Georgia: Education Sector Policy Reviewin many cases, parents are more concerned with food provision rather that the quality ofteaching and care.
o Planning for more inclusive access to existing pre-school services. The measures that arebeing applied somehow worked, but enrolment is not growing fast enough for theseunderrepresented groups. The preparation of a national plan is essential, and it should notbe a costly exercise. It may take a full calendar year to complete, as it is necessary todevelop it in consultation with key stakeholders (including samples of the families offuture users). The plan must offer clear estimations of the costs of resolving financial andcapacity asymmetries for all municipalities.
o Phasing in free of charge service provision for all, and prioritizing the most needy anddisadvantaged socioeconomic groups would be important. Whenever there isoversubscription in public institutions, ensure priority is given to low-income/socio-economic status families and ethnic minorities. The possibility of using the existingTargeted Social Assistance (TSA) mechanism to support the disadvantaged familiescould be considered. The possibility that rich children – whose parents could pay for thisservice – takes up the place of poor children in free preschool is of important concern..
o Improving efficiency in the use of existing preschool infrastructure. The governmentcould consider using the facilities of existing, underutilized primary schools.
To address the issue that the curriculum at upper-secondary education is rigid and nottailored for students with different academic backgrounds and aspirations and thus narrowenrolment at this level, there is need to diversify education paths at upper secondary level inorder to accommodate students with various interest, aspirations, and backgrounds. Thisincludes introduction of more flexible curriculum to allow students concentrate in the areas ofinterest along with core curriculum.
To address the issue of dead ends for VET graduates, as well as low attractiveness of VETstream, adding general education component to VET programs should be considered. Thiswould help to improve the employability of these students and compensate for the fact thatthey are streamed relatively early in their lives, before they get the basic skills. Additionalgeneral education helps prepare students to adapt to changing labor market circumstances,rather than training them for a specific occupation, which raises obstacles for those whochoose or need to switch professions later in their lives. Alternatively, adding more generaleducation content to the vocational track would also contribute to improving permeability ofthe VET system. In Georgia, due to the nature and structure of programs, VET graduates havesignificant difficulties in pursuing further education, which hinders career advancement formany people. The inclusion of general content in the VET courses is likely to reduce thecontent gap between general and VET track graduates. In itself, this would make it easier forVET graduates to compete for university admission. A cost-effective approach would be toadd general content to VET courses that can help reduce “dead ends” and improve VETgraduates’ chances in case they need to look for a job different than the one they studied for.
To improve the inclusion of special needs student in general education, a good plan for socialinclusion in general education is necessary. This is not costly, time consuming or difficultexercise, but it should be done in consultation with key stakeholders. The plan must offerclear estimations of the costs of addressing inclusion. Its final application may be costly, as itis could involve voucher-based support or other conditional cash transfers.
To further expand geographical coverage of VET programs, there in need to re-orient theexpansion plans of the system to offer better service provision in rural areas and smallertowns. The present initiatives to increase supply should be slightly refocused to addresssupply deficiencies to provide access to people living in these areas, for which VET would be

35Georgia: Education Sector Policy Reviewvery important. Expand the existing financing scheme to accommodate indirect costs (livingexpenses) of VET participation can also be considered.
To increase the low participation rates in higher education, particularly among traditionallyunderrepresented groups, there is need to reduce the high cost of higher education andimprove student grant allocation system. It is recommended to review the usage of the studentgrants and expansion of existing programs to promote the participation of disadvantagedgroups. Many of these measures could have an important short-term social impact and can beintroduced fairly quickly without substantially increasing actual funding requirements. Thesemeasures include expansion of needs-based grants, introduction of subsidized student loansand introduction of flexible study programs.
1.3 Governance
1.52 Georgia’s current education governance system has been shaped by the decentralizationand finance reforms launched in 2005. The Ministry of Education and Science is the dominantplayer in education policy-making and has the primary role for the sector oversight and managementfor all levels of Education (except for preschool education) in accordance to the sector priorities set bythe Parliament of Georgia through education legislation. The decentralization process was applied toall levels of education, as part of which, management was decentralized at the institutional level(except for preschools) and all education institutions were transformed into legal entities of public lawand new structures of internal accountability were created. More specifically, School Boards ofTrustees in schools, Supervisory Councils in VET centers and Academic and Representative Councilsin higher educational institutions. At the preschool education level, the management and financinghave been decentralized to the local government level. The intermediary institutions were set up atpreschool level (Kindergarten Agencies) and general education level (Education Resource Centeracross the country). The financing system has also been transformed introducing per capita financingsystem in general education and student vouchers in higher education and vocational education andtraining. More details about the organizational structure of the education sector and the Ministry ofEducation and Science are presented in the Annex 1.
1.53 The remaining challenge for the sector is to shift towards the governance andaccountability paradigm that would support the existing decentralized management in a moreeffective manner. The existing accountability mechanisms at all levels of education are concentratedon controlling for inputs and regulatory norms, which restricts the MoES capacity to improve thequality of education. These governance constraints are manifested in different forms at each level ofeducation, as described below.
1.54 At the general education level, the functions of the existing internal audit are limited toinvestigating only the compliance with regulatory norms without little attention to schoolperformance. The new school authorization standards are limited to evaluating only inputs, checkingtechnicalities related to school mission, human resources and infrastructure. At the school level, thedivision of responsibilities between BoTs and Principals lacks clarity. The functions of the newlycreated ERCs, originally created to support the implementation of education reforms, came down toonly bureaucratic functions. Eventually the Ministry became closely engaged in the school levelfunctions (selection of school principal, approving staff plans, etc.
1.55 Internal quality assurance mechanisms are ineffective. At school level, BoTs are supposedto monitor performance of principals. The evaluation should assess school principal’s standard;strategic plans of schools; school budgets and annual reports of principals. However, the structure andquality of baseline documents is poor. Strategic plans of schools are mostly identical; they don’tcontain clearly formulated indicators to provide enough information for monitoring. Insufficientattention to BoT capacity building in the state policy is also a constraint.

36Georgia: Education Sector Policy Review1.56 Current mechanisms of evaluation of school performance are mostly based on theanalysis of inputs. There was only one attempt to evaluate school outcomes using the results ofschool leaving examinations, but the results were used for punitive measures without properconsideration of school characteristics that could have contributed to low results. When attempting toassess outcomes, the MoES adopted a criterion to evaluate principals that was too narrow: principalswere fired if the failure rate for school students in school leaving exams was high. This policy resultedin negative unintended consequences. Specifically, this gave incentives to the principals to identify atrisk students and discourage them to continue studies. This practice resulted in massive student dropouts and increased repetition rates in the following years. One alternative is to follow more successfuleducation systems, which adopt a comprehensive set of outcome based monitoring instruments thatare used as part of the school accountability system, such as student performance as measured byschool based student assessment, parent satisfaction, etc. Assessment results are used to strengthenand support school performance rather than punish individuals. A more sophisticated metric like thiscan be used to assess principals’ performance.
1.57 There was insufficient investment for running the new system. According to the users ofthe system, school level strategic planning “makes no sense” as funds are barely enough to paysalaries of teachers and to cover running costs. Lack of funding put principals under the pressure tomake difficult choices between competing budgetary priorities.
1.58 At VET and Higher Education levels, the absence of effective accountability instrumentsis a major obstacle to the improvement of the quality of educational institutions. The excessivefocus on inputs and processes in the present accountability mechanisms, particularly at the highereducation level, deludes the attention from what really matters – the academic results that theeducational institutions seek to achieve. In most parts of the world, educational institutions are heldaccountable on various aspects including equity, quality, relevance, the contribution that universitiesmakes to the local or national development and nation building, internal efficiency and sustainabilityof these institutions. In contrast, in Georgia, the Government puts considerable effort into controllinginputs and processes in the post-secondary education system, which substantially restricts institutionalautonomy. At the same time, the mechanisms for measuring the results achieved by these institutionsare non-existent. Also, the accountability system is highly centralized where the state represents theonly party with little cooperation with employers, alumni, students and other stakeholders. This seemsparticularly paradoxical considering that the share of government funding with regard to highereducation and in the entire system in general is very small compared to the household’s contribution.More successful education systems exercise the accountability mechanisms that concentrate on theresults rather than the operation of HEIs, bring positive incentives rather than punishment, and aremutually agreed or accepted voluntarily.
Key Recommendations1.59 Despite the decentralization reform, Georgia has not been able to shift towards thegovernance and accountability paradigm that is now part of leading education systems. The existingschool based management system fails to support school improvement. The following factors affectthe effectiveness of the school management system: (i) There is no proper accountability frameworkbetween the MoES and schools; (ii) Internal quality assurance mechanisms are ineffective;(iii)insufficient capacity development was provided to support participation of key actors;
1.60 Meaningful combination of effective school accountability and support mechanism will be animportant prerequisite to improve the quality of general education. Future quality efforts should betargeted towards further enhancement of school autonomy through the development of strong schoolaccountability instruments and school improvement mechanisms. In this regard, successfuleducational systems are increasingly resorting to introducing outcomes-based accountabilitymechanisms focusing on school development. When introducing new school accountabilityinstruments, it would be essential to take into consideration the three main principles: (i)accountability mechanisms should be designed to evaluate schools (including principals and teachers)and help them improve. Hence, punitive measures should not be the ultimate goal of thesemechanisms, but perhaps an alternative to be used in extraordinary situations; (ii) school performance

37Georgia: Education Sector Policy Reviewreview should include diverse assessment measures and should not be relying only on standardizedtests for measuring school performance given that tests can only measure part of students’ learning;(iii) different schools face different challenges. For example, a school with the majority of studentsfrom lower socioeconomic background faces challenges that are very different from a school withwell-off students.
1.61 The following measures should be considered to address these school and educationinstitution accountability and quality assurance issues in Georgia:
Developing a new school performance review and support system that will be focused onmonitoring school quality and supporting school development. Such new system should be apart of a school improvement and development policy and tightly linked with the teacher in-service training and professional development. The system will also require specializedprofessionals who provide expert advice to schools. The existing structure of the educationsystem (Education Resource Centers, National Quality Enhancement Center, Teachers’Professional Development Center, National Assessment and Examination Center) can providegood foundations for such review in terms of providing the needed expert support,particularly for low performing schools. The new school performance review and supportsystem can play a leading role in helping the schools to identify their challenges and developschool improvement plans. The ERCs should play a role in the capacity development ofboards of trustees to avoid one time, costly and sporadic trainings and provide more long-term and sustainable support to individual school board members. The ERCs should beequipped by centrally developed guidelines and manuals for such support.
At VET and Higher Education levels, introducing result-based accountability mechanisms isessential for quality improvement. These accountability mechanisms should be built aroundmeasuring performance of these institutions according to defined outcomes, which can serveas the major driver for the improvement of the quality and output. The performance indicatorsshould be agreed upon among key stakeholders and their tracking and verification need to bedone by institutions and an independent agency respectively. The indicators should be sharedpublicly with all higher education stakeholders (e.g. parents, students, employers, etc) toinform both policy and personal decisions. It would be important to ensure that the futurereform of existing authorization and accreditation system is not in conflict with the principlesof institutional autonomy.
1.4 Strategic Management of the Ministry of Education andScience
1.62 The path of recent reforms shows some recurrent problems that should be avoided inthe future. Georgia has made significant progress in reforming its education system, however, theapproach used for introducing many of them should be carefully reviewed before addressing large-scale reforms in the future. These constraints include the following: (i) very important, large-scalereforms were introduced before gathering a clear understanding about all their potentialconsequences; (ii) the speed for the introduction of these reforms in many cases did not leavesufficient time for their proper planning and consultation. Hence, a substantial degree of“improvisation on the go” was later required during the implementation phase; (iii) some of themeasures introduced were not in line with existing capacity and management limitations; (iv) in manycases, after the reforms were implemented, several “back and forth” revisions were made. Thishappened in key areas, producing a general sense on instability and, at the end of the day, longerperiods to consolidate the desired outcomes of the reforms compared to what a proper introductionwould have required.
1.63 The scope and quality of the data provided by the Education Management InformationSystem does not effectively support the implementation of a sector-wide strategy. EMISdevelopment made important achievements so far and is a good experience to build on. The presentsystem could be improved by: (i) expanding EMIS coverage from general education to VET and

38Georgia: Education Sector Policy Reviewhigher education; in most cases, this data is available but not part of the formal EMIS. (ii) makeaccess to data easier for all users and information more readily available from different databasesexisting in isolation in various education agencies (i.e. EQE, NAEC) into one consolidated EMIS; and(iii) improving the application of the existing data to support evidence-based policy making. Someinitial steps to address these issues have been launched. The new concept of school score-cards hasbeen developed, which is aimed to provide unified information on each school based on standardizedcriteria.
1.64 The financial planning capacity of the MoES is relatively weak to ensure availabilityand consistency of financial support for the implementation of a national education strategy.More specifically, more developed economic simulation scenarios, to project the financial impact ofpopulation trends and of specific measures that the Ministry may want to introduce or similarfinancial planning tool that could substantiate any attempt to improve financial predictability andlong term support (either from the government or the international cooperation partners).
1.65 With the available data, not enough information is produced to support effectivedecision-making; the production of knowledge to support strategic management is in great needof improvement16. In many cases, the data that is available in the EMIS and other systems is notintegrated and collated to produce usable information (general statistics and trends about enrolment,schools, teachers, social inclusion and other key areas) to support management at the national orregional levels. The Ministry does not systematically produce all the knowledge and analysis that isneeded to support its decision-making and most of the key analytical studies that are produced arefinanced by donors. Moreover, the way in which this knowledge is produced is not helping to developthe technical capacity of the Ministry and make it self-sustainable in the long term.
Key Recommendations1.66 The lack of a strategic vision, consistency and contradictions in the introduction of manyreforms are not generating the expected incremental and systemic improvements. “Back and forth”implementation of radical reform measures generates instability and lack of credibility of all involvedparties about the future of education that will be difficult to overcome. The MoES “navigates blindly”in some areas as it does not collect the data that would be necessary to appropriately manage theeducation process. To address this issue, it is recommended to:
Develop the Ministry’s policy and planning capacity, including data management andapplication, to support key strategic management functions and sustain the introduction ofmanagement by results practices. In particular, developing a comprehensive and evidence anddata-based long-term sector strategy would create the opportunity to negotiate the necessaryincreases in the medium term financial support for the education sector development.
1.5 Public Spending in Education
1.67 Georgia’s expenditure in Education is low by regional standards. Expenditures as a shareof the country’s GDP have oscillated between 2 and 3 percent since the late 1990s17. Figure 1.11shows that this level of expenditure is low if compared to countries in the Commonwealth ofIndependent States (CIS) and New Member States in the European Union (EU). Public expendituresin 2012 and 2013 (estimated) have been 2.8% and 2.9%, respectively, including public funding forpreschool education expenditures. The level of expenditures is much lower than other countries withsimilar level of income per capita.
16 It is understood here that the strongest contribution of Information technology and systems is to assist primarily withcollecting, collating and analyzing data and information. While technology is a key enabler, it is up to humans to take thisdata and information and turn it into knowledge that can be applied in the education management process. Precise definitionsof the meaning of terms “data”, “information” and “knowledge” that used in this section is provided in Annex 3.17 Source: World Bank, EdStats.

39Georgia: Education Sector Policy ReviewFigure 1.9: Comparative data on public spending on education as a share of GDP
Source: WB Georgia Education Public Expenditure Review, 2013
1.68 Although total education budget substantially increased since 2006, in relative termsgovernment allocation for education did not show appreciative improvement. The expansion oftotal government expenditure in current values18 accounted to 84% for the period 2006-2013 (seetable 1.12). The budget for education followed a similar trend and, despite some oscillations,remained stationary around an average value of 8.3% of total government expenditure for the wholeperiod. The growth rate of the education budget was on average 9.52% for this period and showedconsistency with the exception of two low growth years: a sharp decrease noted during the economiccrisis in 2008 and a slight decrease in 2011 due to the decline in public allocation for preschool
education by 24% with the introduction of parental fees in 201119. The overall size of governmentexpenditures (total government expenditure as a percentage of GDP) showed a marked contraction in2011 and recent figures appear to confirm that this tendency will be maintained in the near future.This does not provide a very optimistic scenario for expecting substantial increases in the share ofeducation in government expenditure in the near future.
Table 1.12: General Government Expenditures on Education (state + local)
2006 2007 2008 2009 2010 2011 2012 2013 est.
Total Government Expenditure(current GEL values)
4,208 5,865 7,119 6,536 7,273 7,728 8,287 7,726
Total Education Expenditure(current GEL values)
378 438 480 531 586 629.3 727 777
Share of Education Expenditure(Ed Exp. as % of Total Gov.)
8.98 7.47 6.74 8.12 8.06 8.14 8.77 10.06
Growth of Education Expenditure(% of current values)
15.87 9.59 10.63 10.36 7.39 15.53 6.88
Gross Domestic Product (GDP)(current GEL values)
13,790 16,994 19,075 17,986 20,743 24,344 26,167 26,800
Education expendituresas % of GDP
2.7 2.6 2.5 3.0 2.8 2.6 2.8 2.9
Government size(Total Gov. Exp. as a % of GDP)
30.5 34.5 37.3 36.3 35.1 31.7 31.7 28.8
Source: WB Georgia Education Public Expenditure Review, 2013 based on MoF, MoES and GeoStat data
1.69 General education represents the largest share of total education spending followed byHigher and Pre-school Education. The large share of general education of the total educationbudget (over 62% in 2012) highlights the relative importance of the role of public sector financing at
18 Similar figures are obtained when comparing real values (taking into account the incidence of inflation measured by theCPI Index)19 WB Georgia Education Public Expenditure Review, 2013
0.02.04.06.08.0
10.012.0
Geo
rgia
Rus
sian
Fed
erat
ion
Bel
arus
Ukr
aine
Mol
dova
Slo
vak
Rep
ubli
c
Bul
gari
a
Cze
ch R
epub
lic
Hun
gary
Pol
and
Cro
atia
Lat
via
Est
onia
Lit
huan
ia
Rom
ania
Arm
enia
Aze
rbai
jan
CIS New Member States (EU) SouthCaucasus
2000 2010 Unweighted group average 2010

40Georgia: Education Sector Policy Reviewthis level of education. Table 1.13 shows that the relative share of education spending for alleducational areas was stable during 2006-2012 with the only exception of VET, which suffered amarked reduction: from 3.5% of total education expenditure in 2007 to 1.28% in 2012. For alleducation levels, the majority of government funding is channeled through the MoES. Preschooleducation is the main exception, which is under the responsibility of local government. A small shareof the education budget is also managed by other line ministries, which mostly support programs invocational and higher education in technical areas that are related to their area of competence (forexample: health; medical education; agriculture; police academy, etc.).
Table 1.13: Education Expenditures by level of education
2006 2007 2008 2009 2010 2011 2012 2013 est
Total Education expenditures 377.5 437.7 480.4 530.7 586.2 629.3
727.0
776.9
Preschool 29.2 53.7 59.9 71.1 82.1 64.5 74.5 96.9
General education 199.3 293.8 315.3 331.0 367.3 392.1
451.6
502.9
Vocational education 0 15.3 13.3 11.7 10.7 9.2 9.3 9.3
Higher education 23.6 48.2 52.5 65.0 64.3 68.2 79.6 78.8
Other education programs 125.5 26.7 39.4 51.9 61.9 95.3 111.9
89.0
Source: WB Georgia Education Public Expenditure Review, 2013 based on MoF data
1.70 Current expenditures represent the major economic category in the state educationbudget. The majority of routine expenditures is allocated for per capita financing of the generaleducation schools followed by subsidies and transfers to other education entities, (such as Teacher’sProfessional Development Centre, Education Infrastructure Agency, National Examination Centre) toimplement education programs. The bulk of recurrent expenditures is spent on salaries, whichrepresents 75-80 percent of current expenditures in general education. Capital expenditures have beenon the rise since 2008 given the increased focus of the government to address the existing investmentneeds of the education infrastructure. 20
Table 1.14: State Budget Allocations to the MES by Economic Categories
2006 2007 2008 2009 2010 2011 2012 2013est
Total Expenditures 358 411 458 490 538 553 627 675Current Expenditure 358 411 408 462 501 491 556 616Compensation of employees& social contrib. 3 5 5 5 10 17 21 21Other goods and services 1 2 12 12 38 48 62 58Subsidies and transfers 354 404 330 375 384 348 351 442of which: General edu.
vouchers 187 201 269 300 325 316 326 410Social provision 0 0 6 5 2 2 2 3Other expenditure 0 0 55 65 68 75 121 92Capital expenditures 1 0 50 28 36 62 71 59
Source: WB Georgia Education Public Expenditure Review, 2013 based on MoF data
1.71 The government has also introduced some targeted programs in specific disciplinesalthough they form a small share of education spending. The largest share of resources is spent onper capita financing of general education schools. Voucher financing of higher education institutionsand infrastructure programs are a distant second and third. In parallel, over the last few years, theMoES has initiated relatively small-scale but well-targeted programs (see table 1.15) placing a focuson Information and Communication Technologies (ICT) such as “My First Computer” for first
20 Figures and final redaction of this paragraph need revision. We are awaiting for MoES data to do this.

41Georgia: Education Sector Policy Reviewgraders, the physical security of schools (“Mandaturi” Program for enhancing safety and disciplinarymeasures in all schools), and provision of English language classes taught by native speakers (“Teach& Learn with Georgia” inviting native English speakers to teach in Georgia).
Table 1.15: State Budget Education Expenditures by Major Programs
2006 2007 2008 2009 2010 2011 2012 2013
Total MoES 358 411 458 490 538 553 627 675
General education per capita vouchers 187 201 269 300 325 316 326 410
National examination center 0 2 6 8 9 17 12 12
Science Programs and Grants 17 22 31 40 38 22 19 27
Education Infrastructure Development 82 99 37 14 16 38 72 43
Teachers' professional development 0 0 1 2 9 18 18 14
VET support programs 4 6 8 8 8 6 18 14
HED support programs 30 40 47 52 52 56 81 78
WB: APL1, APL2 10 9 8 18 13 3 0 0
Other small scale projects 29 31 51 47 68 76 81 76Source: WB Georgia Education Public Expenditure Review, 2013 based on MoF data
1.72 On a per student basis, Georgia’s expenditures are lower than that of comparators in alleducation levels. In preschool education the unit cost is approximately 12% of the GDP per capita (inaddition to which parents used to pay approximately 30% until 2013) while OECD and EU countriesspend about 20% of the GDP per capita. The unit cost of preschool is approximately 80% of that ofgeneral secondary education, which is similar to the ratios in OECD and EU, however at a lowerabsolute level. Expenditures per student in higher education are 30% higher than those of generalsecondary education. This is relatively low when compared to the EU and OECD countries, whichspend approximately 60% more per higher education student. Vocational education expenditures in2012 were particularly high because of heavy capital investment. There are 12,746 students attendingpublic institutions. In addition to these students, there is a small share of students who receive thestate voucher and attend private institutions.
Table 1.16: Expenditure, student population in public education and unit costs by level (2012)
Level of educationExpenditures(million GEL)
Students(2012)
Unit cost(GEL)
Unit cost(USD)
Ratio(generalsec. = 1)
Share ofGDP per
capita
Preschool 74,500 103,027 723 438 0.8 12.4
General secondary 451,600 516,738 874 529 1.0 14.9
Vocational education 9,300 12,746 730 442 0.8 12.5
Higher education 79,600 70,922 1,122 680 1.3 19.2
Source: WB Georgia Education Public Expenditure Review, 2013 based on MoF data21
1.73 The low salary system of the teacher profession makes it a poor career choice inGeorgia. Despite the gradual increase of teacher salaries in the last decade22, they remain below the
21 Note: Preschool spending includes expenditures by local governments and parental contributions. Other levels consideronly public spending. Vocational education expenditures in 2012 were particularly high because of heavy capital investmentThere are 12,746 students attending public institutions, but there are some students who receive the state voucher andattended private institutions. Due to this, we provide an upper bound for the unit cost (assuming that no students in privateinstitutions had the voucher).22 In order to make the profession more attractive, the government introduced changes in the teacher compensation schemein January 2013. The base salary of teachers rose from 245 GEL, set in 2009, to 305 GEL. As a result, this change has raisedteachers’ wages in a range of 26 to 60 percent amounting to about 60-205 GEL.

42Georgia: Education Sector Policy Reviewaverage national salaries. According to figures of the National Statistics Office of Georgia the averagemonthly salary for 2013 (fourth quarter) is of 875 GEL, while the average monthly salary in educationis 475 GEL23. As can be seen in the figure 1.12, the education staff receives the lowest salaries fromall professions. Entry salaries and progressions do not offer great incentives either. Neither thenumber of years in service nor the academic degrees determine significant salary increases. Forexample, the salary of a BA holder beginner teacher is of 359.90 GEL, the difference with a BAholder who has 5 to 10 years of experience is only 14 GEL (373.63 GEL). The salary of BA holderwith up to 5 years of experience compared to a teacher who gained an MA degree only increases by40 GEL (from 359.90 to 394.98 GEL)24.
Figure 1.10: Average Monthly Salaries (2013)
Source: Geostat, 2014
1.74 Teacher salaries in Georgia are among the lowest compared to other countries thatparticipated in PISA 2009. Analyzing 2009 teacher salaries relative to GDP per capita, teachers withminimum training and 10 years of experience in Georgia are paid at substantially lower levels ascompared to other countries (see Figure1.13 below).
23 The agency gives overall salaries in education, which also include non-teaching staff, therefore this information could belittle inaccurate but it does not change much in comparative terms24 More data about this is provided in Annex I: Statistical Information
712
355
389
398
425
599
602
623
650
844
874
891
943
1031
1402
National Average
Education
Fishing
Hotels and restaurants
Agriculture
Health and social work
Other community services
Manufacturing
Wholesale and retail trade..
Real estate, renting and business activities
Mining and quarrying
Construction
Transport and communication
Public administration
Financial intermediation

43Georgia: Education Sector Policy ReviewFigure 1.11: Teacher Salaries Relative to GDP Per Capita in Georgia and PISA 2009 Participant Countries in2008
Source: WB NAEC 2014 based on data from PISA 2009
1.75 Private sector financing of higher education in Georgia is amongst the highest in theregion. Table 1.16 shows the comparative figures for both private and public expenditure as apercentage of GDP for a selection of countries. Private expenditure as a share of GDP in Georgiaaccounts for 0.75%, this is much higher than Kazakhstan (0.52%), Russian Federation (0.53%),Belarus (0.40%) and the average values of other European countries (0.35%). Despite of the relevantshare of higher education from the national education budget (11% for 2012), in comparative termsthe contribution of public sector financing in higher education in Georgia is much lower than most ofthe reference countries listed in Table 1.17 and to other European countries.
Table 1.17: Higher Education Public and Private Expenditure
TE PublicExpenditure as
% of GDP Year
TE PrivateExpenditure as
% of GDP Year
Georgia 0.47 2013 0.75* 2013
Armenia 0.25 2012
Tajikistan 0.28 2011
Kazakhstan 0.40 2010 0.52 2007
Belarus 0.73 2012 0.40 2012
Kyrgyz Republic 0.87 2010
Russian Federation 0.95 2008 0.53 2007
Moldova 1.30 2012
Ukraine 1.79 2005
CEE 0.87 2010 0.29 2010
Other European Countries 0.87 2010 0.35 2010Source: World Bank Databank; State Budget Report for 2013*TE private expenditure in Georgia includes only tuition fees paid by students and was estimated based on EQE enrolmentand NAEC tuition fee data
Key Recommendations1.76 The relationship between education expenditure and sector outcomes is not always linear andcounts after a certain minimum threshold. As evidenced by international studies, increasing level offinancing does not always translate into better learning outcomes unless accompanied with otherstructural measures. However, in countries where public spending is below adequate level, increasedinvestment has substantial impact on the quality. In the meantime, there are still areas that spendingefficiency can be sought. The key issues and recommendations on public spending in Georgia can besummarized as follows:
0
0.5
1
1.5
2
2.5C
roat
ia
Geo
rgia
Est
onia
Nor
way
Hun
gary
Cze
ch R
epub
lic
Uni
ted
Stat
es
Pola
nd
Bul
gari
a
Kyr
gist
an
Finl
and
Slov
enia
Net
herl
ands
Eng
land
Irla
nd
Mon
tene
gro
Scot
land
New
Zea
land
Japa
n
Spai
n
Port
ugal
Sing
apor
e
Ger
man
y
Shan
ghai
-Chi
na
S. K
orea
Hon
g-K
ong

44Georgia: Education Sector Policy Review Government spending on education in Georgia is low – compared to countries with similar
per-capita incomes and relative to both the shortage of human capital and the country’sambitions. Given continuous increase in the national GDP, Georgia should prioritizeincreasing public investment in education as a proportion of the GDP.
The teacher salaries in Georgia are one of the lowest as compared to other countries andother public employees in Georgia. This creates negative implications for the improvement ofthe quality of teaching and learning across the system. Georgia could consider prioritizingteacher salary increase over other investments in education sector. Attracting and retaininghigh-caliber teachers is a challenge worldwide. Many developed countries have dealt withthis challenge by increasing real wages of teachers. Between 2000 and 2011, OECD and EUcountries increased teachers’ wages by around 15-20 percent in real terms. Comparatorcountries such as Czech Republic and Estonia experienced dramatic increases: approximately
100 percent and 60 percent, respectively 25 . Specific interventions related to thisrecommendation are discussed in teaching quality part of the document.
1.6 Cross-cutting Issues
1.6.1 Life-long Learning
1.77 Several factors contribute to the growing importance of lifelong learning policies overthe 21st century. These include an increased demand for a better skilled work force, acceleratedtechnological changes and shifting demographics. Initial measurements of the European lifelonglearning indicator (ELLI) showed there is a strong correlation between ELLI’s performance and threeimportant measures of a nation’s wellbeing: global competitiveness, accessibility of healthcare andreduction of corruption26. These are the end results of long chains of causal factors, chains thatinvariably begin with learning and human development.
1.78 Georgia does not yet have a consolidated national policy for integrating lifelong learning(LLL) in the education sector. The existence of a national policy would be helpful to guide agradual and consistent introduction of lifelong leaning approaches in Georgia. The notion of lifelonglearning defines a process that involves the development of knowledge, skills and values throughoutall stages of a person’s life from early childhood through adulthood27. This concept of uninterruptedlearning encompasses all forms of learning, conventionally categorized as: formal, non-formal andinformal learning28. A holistic policy approach would be useful in Georgia as it will be necessary toredefine some aspects of formal education and to develop and integrate to it two important learningsystems: (i) the recognition of workplace learning and the need to value and support learning atwork, which will require addressing many questions about the nature of the curriculum, the relation ofeducators to employers, and practical arrangements to locate or connect, and to recognize andaccredit, purposeful learning on as well as for the job and (ii) the recognition and accreditation oflearning that takes place away from the classroom. This integration must be also developed, as it
25 OECD (2013), p. 392.26 See Annex 3 for more details about these correlations27 The European Commission defines lifelong learning as: “Lifelong learning embraces all learning activity undertakenthroughout life, with the aim of improving knowledge, skills/competences and/or qualifications for personal, social and/orprofessional reason” European Commission 200128 (i) Formal learning typically provided by an education or training institution, structured (in terms of learning objectives,learning time or learning support) and leading to certification. Formal learning is intentional from the learner’s perspective.(ii) Non-formal learning is embedded in planned activities not explicitly designated as learning, but which contain animportant learning element and structured (in terms of learning objectives, learning time or learning support). It is usuallyprovided outside public educational institutions and caters to persons of all ages. Non-formal learning is intentional from thelearner's point of view. It normally does not lead to certification. (iii) Informal learning resulting from daily activities relatedto work, family or leisure. It is not organised or structured (in terms of objectives, time or learning support). Informallearning is in most cases unintentional from the learner's perspective and includes self-education, in which the individualdoes not test the acquired knowledge. It is not institutionally coordinated and usually it is not systematic. It typically doesnot lead to certification See more of this in Annex 3: The notion of Lifelong Learning policies and its relevance

45Georgia: Education Sector Policy Reviewshould enhance the standing and recognition of informal learning, in its own right and as a way intomore formal education and training.
Key Recommendations
To tackle the current challenge that the Government does not have an integrated national policyand strategy for LLL which substantially limits the country’s potential for meeting workforcedevelopment needs. Georgia needs to develop a coherent national strategy for integrating LLLprinciples across all education levels. The following points should be considered in thedevelopment of LLL strategy:
o Georgia’s institutional capacity would require substantial development to be capable ofapplying a coherent and integrated national lifelong learning policy. The scope of thepolicies to promote lifelong learning go beyond the boundaries of the education system anddemand a coherent and integrated public sector response in a variety of areas. Figure 1.14above portrays the wide range of these policy areas based on the time-age dimension of itsbeneficiaries (vertical axis) and the type of learning (horizontal axis). The main challenges forthe Georgian institutional system will be to provide a coordinated government response for, atleast, the following policy areas:
(i) Initial Education: this area (core of Quadrant 1) mainly involves the MoES and thegeneration of knowledge acquired at primary, secondary and tertiary educationinstitutions.
(ii) Continuing Education: This area (Quadrant 2) includes all forms of education ortraining after initial education or after entry into working life. This includes: full-timeand part-time programs for older adults leading to qualifications, courses taken forvocational reasons or leading (but not necessarily) to credits, diplomas and degrees,courses taken by graduates. This area is crucial for supporting the employability ofindividuals and one of the most challenging in Georgia as it would require coherencein policies domains as: education, labor, ALMP and CVET.
(iii) Vocational Learning. Applied skills, closely tied to occupational success, (Quadrants1 and 2); work-related knowledge and skills that may be acquired in educationalinstitutions and/or vocational training institutions (e.g. tertiary or work-oriented post-secondary institutions) or even workplace training. The availability of such type oftraining, which may or may not be accessible outside the working environment, iskey to keeping the country’s workforce competitive. Georgia needs substantial workto articulate recognition, supply and demand.
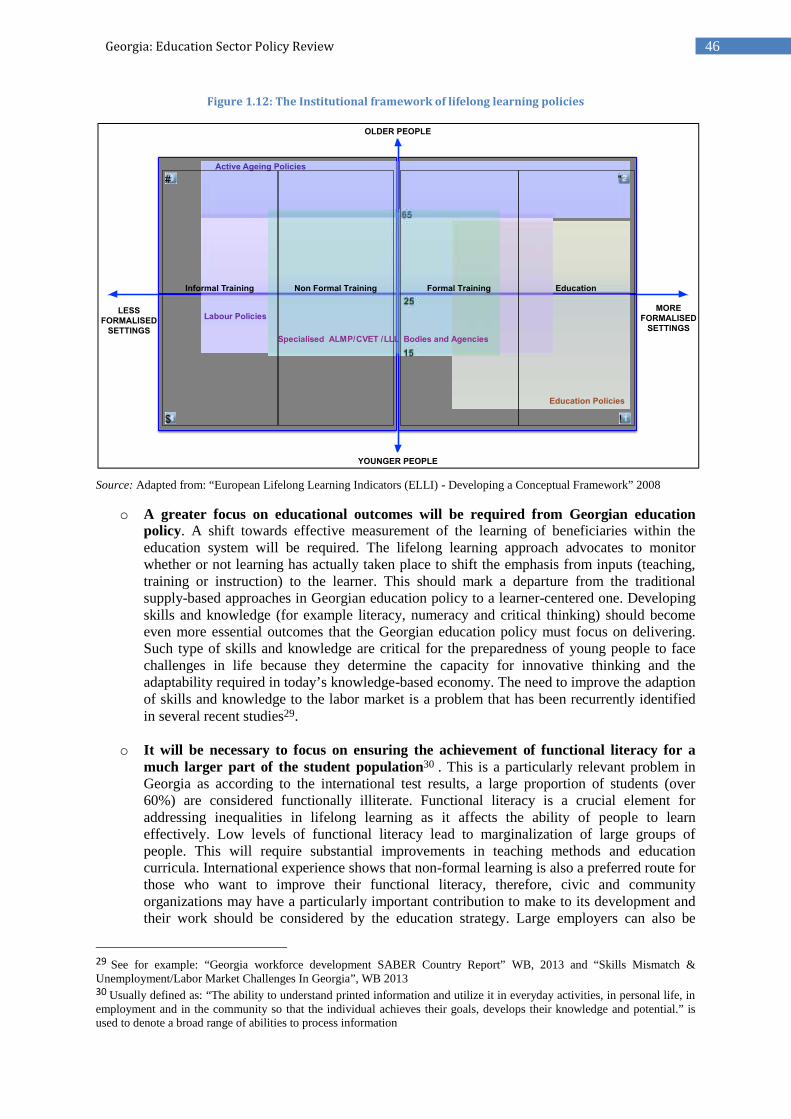
46Georgia: Education Sector Policy ReviewFigure 1.12: The Institutional framework of lifelong learning policies
Source: Adapted from: “European Lifelong Learning Indicators (ELLI) - Developing a Conceptual Framework” 2008
o A greater focus on educational outcomes will be required from Georgian educationpolicy. A shift towards effective measurement of the learning of beneficiaries within theeducation system will be required. The lifelong learning approach advocates to monitorwhether or not learning has actually taken place to shift the emphasis from inputs (teaching,training or instruction) to the learner. This should mark a departure from the traditionalsupply-based approaches in Georgian education policy to a learner-centered one. Developingskills and knowledge (for example literacy, numeracy and critical thinking) should becomeeven more essential outcomes that the Georgian education policy must focus on delivering.Such type of skills and knowledge are critical for the preparedness of young people to facechallenges in life because they determine the capacity for innovative thinking and theadaptability required in today’s knowledge-based economy. The need to improve the adaptionof skills and knowledge to the labor market is a problem that has been recurrently identifiedin several recent studies29.
o It will be necessary to focus on ensuring the achievement of functional literacy for amuch larger part of the student population30 . This is a particularly relevant problem inGeorgia as according to the international test results, a large proportion of students (over60%) are considered functionally illiterate. Functional literacy is a crucial element foraddressing inequalities in lifelong learning as it affects the ability of people to learneffectively. Low levels of functional literacy lead to marginalization of large groups ofpeople. This will require substantial improvements in teaching methods and educationcurricula. International experience shows that non-formal learning is also a preferred route forthose who want to improve their functional literacy, therefore, civic and communityorganizations may have a particularly important contribution to make to its development andtheir work should be considered by the education strategy. Large employers can also be
29 See for example: “Georgia workforce development SABER Country Report” WB, 2013 and “Skills Mismatch &Unemployment/Labor Market Challenges In Georgia”, WB 201330 Usually defined as: “The ability to understand printed information and utilize it in everyday activities, in personal life, inemployment and in the community so that the individual achieves their goals, develops their knowledge and potential.” isused to denote a broad range of abilities to process information
OLDER PEOPLE
YOUNGER PEOPLE
MOREFORMALISED
SETTINGS
LESSFORMALISED
SETTINGS
Education Policies
Labour Policies25
65
15
Active Ageing Policies
Specialised ALMP/CVET /LLL Bodies and Agencies
Formal Training EducationNon Formal TrainingInformal Training
!
"#
$

47Georgia: Education Sector Policy Reviewimportant agents to bridge the functional literacy gap by providing on the job training.Although their programs are usually labelled differently (report writing, communication, etc.)most of them are conducive to the same end. Their integration would require newmanagement approaches at the MoES as the institution has demonstrated systematicweaknesses to work in partnership with employers and other stakeholders in several areas.
o The education system should evolve towards ensuring competence-based learning andthe provision of key competencies. A complementary challenge for the education system inGeorgia will be to develop the capacity to assess quality of learning in terms of competences.This will require a holistic understanding of the individual and which combine knowledge,skills, attitudes and values towards learning. There is a greater need than ever for citizens toacquire the knowledge and key competences that are necessary to meet recent changes of themodern life work31. The European Qualifications Framework for Lifelong Learning identifieseight key competences that the education system should provide 32 even before completion oflower secondary. The acquisition of these key competences represents a new standard ofquality that substantially affects the present conception of educational programs. This newrequirement should be consistently incorporated both into framework educational programsfor primary and secondary education and also into the entry requirements for highersecondary education levels, as well as into the requirements on final examinations forcompulsory education.
o It is essential to successfully conclude the introduction of effective and internationallyrecognized quality assurance frameworks. Effective systems of standards and accreditationthat enable students to document what they have learned and employers to identify workerswith the relevant skills are the core of an LLL system. For this purpose, the education systemshould continue the development of relevant and reliable quality assurance frameworks andtools. The final integrated system should include: (i) a National Qualifications Frameworkthat covers most occupations and a wide range of skill levels, (ii) a National Classification ofOccupations that registers all major occupations and identifies the corresponding learningoutcome-based competencies required for them; (iii) new and robust protocols for assuringthe credibility of skills testing and certification33; (iv) a professional system of accreditationstandards that guarantees the quality of training provision; (v) an institutionalized process toengage participation of key stakeholders (especially employers) in all these areas. For thesepurposes, it is important for Georgia to continue the path of adopting internationallyrecognized standards34 and to strengthen the operation of key institutional actors, as forexample, the NCEQE and Sector Committees to ensure the full alignment of their role andresponsibilities with the needs of the labor market35.
o It will be necessary to develop a more open system for lifelong learning diversifyingpathways for skills acquisition and adopting new and effective systems to recognizeprior learning. Recognizing the results of all forms of learning should be promoted,
31 Globalization, development of new technologies, changes in the organization of work and the structure of enterprisesdefine ever-increasing requirements on the qualifications of employees.32 These are: (i) communication in the mother tongue; (ii) communication in foreign languages; (iii) mathematicalcompetence and basic competence in science and technology; (iv) digital competence; (v) learning to learn; (vi)interpersonal, intercultural, and social competences, together with civic competence (vii) entrepreneurship; and (viii) culturalexpression. In addition, critical thinking, creativity, initiative taking, problem solving, risk assessment, decision making, andmanaging feelings constructively are seen as playing a role in all eight key competencies. The EQF identifies the essentialknowledge, skills, and attitudes related to each.33 These must ensure that skills testing for most occupations follows standard procedures, is competency-based and assessesboth theoretical knowledge and practical skills and provides certificates that are valued by most employers (for more detailssee the WB SABER-WfD Analytical Framework)34 Such as: the alignment of the NQF and the European Qualifications Framework, and the introduction of otherequivalences in areas such as European Credit System for Vocational Education and Training, and the European QualityAssurance in Vocational Education and Training.35 See: “Georgia workforce development SABER Country Report” WB, 2013

48Georgia: Education Sector Policy Reviewensuring that the transitions between education sub-sectors are facilitated and their pathwaysdo not lead students to “dead ends”. Recognition of prior learning is also very important todemonstrate qualifications required for employment. A broad range of vocational skillsacquired either on or off the job should be easily recognized by established mechanisms. Anopen systems focus should provide: (i) mechanisms to facilitate the recognition anddemonstration of qualifications acquired by non-formal and informal training; (ii) flexibleways to increase access for adults to primary and lower secondary education studiesprioritizing the reinsertion of people without primary education; and (iii) more flexible waysto increase access of adults to TVET and higher education studies. These reforms will requiresubstantial institutional capacity development in a variety of government agencies that gobeyond the limits of the MoES.
o Ensuring effective stakeholder participation is mandatory to ensure effectiveness ofresources invested in this area. As it was mentioned before in this document, this is one ofthe areas where the MoES has shown important structural weaknesses. Unfortunately,stakeholder collaboration is critical for the achievement of increased access and improvedquality and relevance and other LLL goals. Coordinated efforts are needed of a large numberof heterogeneous lifelong learning actors, including: government agencies at the central andregional levels, employers, trade unions, service providers and NGOs. In particular, privatesector employers should be encouraged to become active players in the market for LLL, bothby articulating their needs, partnering with the supply side (education and training providers)and by promoting learning in the workplace. Intra governmental, formal “partnerships” arealso important to assure coherent, structured government coordination and deliver effectiveinterventions.
1.6.2 Information and Communication Technologies (ICT)
1.79 Currently there is no coherent policy framework to ensure meaningful use of ICT toadvance teaching and learning. The individual ICT programs are not integrated and aligned with thecurriculum goals. The Ministry runs the “Buki” project for first graders countrywide and all 1st classpupils receive netbooks (specially designed by Intel Corporation for Georgian schools) with installededucational programs/games on mathematics, logics, in Georgian and foreign languages. Thisprogram opens the gates for very important transformations and changes in student’s learningcapacities that should be further capitalized with the modernization of the curriculum for primary andsecondary education. An ICT curriculum was developed for the students of Grades V and VI, but it isdesigned to develop only general skills of using personal computers (such as MS applications) at thelevel of a basic computer user. Existent curriculum should be adapted following current globalstandards that aim to equip students to use computational thinking and creativity, and have deep linkswith mathematics, science and design. The number of application currently used in Georgian publicschools must be expanded, at present it only includes: (i) Microsoft Windows office products, (ii)Intel classroom management software, (iii) interactive games (for ISCED6 level I), (iv) InternetBrowsers (Google Chrome, Opera, Mozilla Firefox) and (v) Adobe Products. Out of these, theinteractive games for ISCED Level I are the only applications available in Georgian. Nonetheless, theMoES recently launched concerted efforts to develop an ICT policy paper.
1.80 The adequacy of the skills and knowledge of ICT teachers at the school level is notproperly assessed. There is still limited awareness among schoolteachers and administrators on ICTtools to be applied in education. The school curriculum of most subjects does not certify that ICTs areused by school teachers in delivering classes or presentations in other topics but ICT. The level ofsupport provided to teachers in integrating ICT in education systems is uneven and greatly depends onthe school leadership. Positive transformations have been recently introduced in the area of ICTtrainings for in-service training of teachers provided by the National Centre for Teachers' ProfessionalDevelopment (TPDC). The TPDC offers: basic courses, second level courses and primary class tutor'straining sessions. In addition, it provides other training courses related to principles to be applied in

49Georgia: Education Sector Policy Revieweducation and integration of ICT into the education process and also offers access to online resourcesto advance teaching quality in schools. The extension of these services is still limited; NTPDC selectstraining participants countrywide to ensure that at least 32% of teachers per school attend ICTtrainings36. However, it is also reported that teachers from the schools located in rural areas, remoteand mountainous regions have very limited access to receive even the initial training in basiccomputer skills.
1.81 There is no systematic understanding of the ICT infrastructure gaps in Georgianschools. EMIS reports that all 2,328 schools in Georgia (2,084 public and 244 private) are providedwith computers and Internet access; however, other evidence also suggests that although Internet isreported to be available in all regions in Georgia, not all schools have access to it, especially schoolsin rural and remote areas37. An important dispersion in connectivity quality is also visible, as high-speed optic-fiber connection is available but to a very limited number of schools mainly located in thecentral regions of the country (capital and nearby cities)38. Many schools experience problems inmaking computer labs equally accessible for students and teachers. The major reason is that someschools physically allocate all computers in one specific area/room, thus making it difficult to conductsimultaneous ICT sessions. The EMIS developed a set of internal policies developed for schools, suchas: (i) User's access policy; (ii) External hard/flash drive restriction policy; (iii) Software updatepolicy; (iv)Users' guideline for maintenance school computers; (v) Internet access restriction policyand its ICT specialists are in charge of maintaining school infrastructure and software. This mighthave worked as a short-term solution, but it is not sustainable in the long run. The main focus area ofthe EMIS, should be to continue to improve the quantity and quality of data and information tosupport decision making and monitoring and evaluation of the educational process. The developmentof the ICT policy, including infrastructure development plans and ICT-related support to schoolsbelong to a more specialized ICT management unit that is not available right now in the presentorganizational structure of the MoES.
Key Recommendations To fill the gap of lack of coherent policy framework to ensure meaningful use of ICT,
such framework needs to be developed to advance teaching and learning throughout theeducation reform. This policy framework should address how ICT can support theresolution of many of the educational issues that were described in the previous sections, forexample: (i) major curriculum revisions and shifts in pedagogy and assessment changes; (ii)specific curriculum reforms that emphasize higher levels of understanding of key conceptswithin subject areas and aimed to reduce functional illiteracy; (iii) curricular reforms aimed tointroduce the abovementioned lifelong learning approaches and especially, to develop theability to solve complex, real-world problems (providing key competences) that preparestudents for the knowledge economy, such as creativity, information management,communication, collaboration, and the ability to direct one’s own work and learning; (iv)support the pedagogical role of teachers by providing resources and explicitly modellingcognitive and social processes and prompting students to take up these practices; and (v) theuse of technology to efficiently deliver online content and assessments in all areas ofeducation and especially to support second chance, adult education.
36 Dolidze, 201437 USAID, ibid38 Dolidze, ibid

50Georgia: Education Sector Policy Review
Chapter 2. Priority Sub-sector Issues2.1 Early Childhood Development: School Readiness
2.1 Apart from the low rates of participation and equity issues in preschool educationexamined in chapter 1 more broadly, the quality of preschool education is also a pressingchallenge. There is an accumulating body of evidence39 that shows that investment at an early stageof life is an effective policy. Research by Nobel laureate in Economics James Heckman praisedinvestment in disadvantaged young children as “a rare public policy with no equity-efficiencytradeoff” as it promotes social justice and fairness by reducing inequality and at the same time raisesthe productivity of society. It has also been shown that, due to the nature of the skill formationprocess, early investments are those with the highest rate of return. Both medical and economicsliterature agree that gaps in both cognitive and non-cognitive skills emerge early in life and persist.Policies to mitigate these gaps later in life have proven very costly.
2.2 Early childhood interventions are very effective at boosting non-cognitive skills. Theseare often neglected at the expense of cognitive skills. However, research has found that they are veryimportant determinants not only of schooling, but also of labor market and behavioral outcomes (suchas participation in criminal activities and teenage pregnancy). Evidence shows that increasing non-cognitive ability is associated with a reduction both in the probability of being a high school dropoutand in the likelihood of spending time in jail. It is also a good predictor of who will graduate fromcollege. Moreover, these effects seem to be more pronounced for females and disadvantaged groups.Estimated benefit-to-cost ratio of increasing enrolment in preschool from 25 percent to 50 percent inlow- and middle-income countries ranges from 6.4 to 17.640.
2.3 In Georgia, the majority of the children who attended preschool institutions show verylow school readiness. Although children who attended preschool institutions on average show higherschool readiness, than those who don’t, there is a large variation in school readiness among childrenwho attended preschool institutions. In 2011 the National Curriculum and Assessment Center(NCAC) conducted a school readiness study that evaluated five domains of child development amongchildren during the early days of their first year of schooling. Only one-third of the children presentedsatisfactory school readiness. The share of children, who have relevant cognitive, emotional andsocial, and fine motor skills development, is still very low. Only one-third of children who attendedpreschool institutions meet cognitive milestones expected of them, which casts doubt on the quality ofpreschool education (see Table 2.1).
39 See Heckman and Masterov (2007), Heckman (2006), Cunha and Heckman (2006) and Carneiro and Heckman (2003)among others.40 See The Lancet, Volume 278, Issue 9799, 2011.

51Georgia: Education Sector Policy ReviewTable 2.1: Performance on cognitive tasks at the beginning of their primary education among the children
who attended kindergartens and who did not attend kindergartens
KindergartenAttendance
Yes No All
Can tell own date of birth 35 25 32.1
Can tell seasons of the year 59.5 38 53.4
Can tell the days of the week 38.4 19.7 33.1
Can name 6 animals 66.3 57.2 63.7
Can name 6 birds 30.3 25.7 29
Can count up to 20 41.6 32 38.9
Can calculate 9-3 74.7 60.6 70.7
Can calculate 4+5 65.4 51.2 61.4
Can calculate 5-1 93.1 84 90.5
Can calculate 3+2 91.7 85.4 89.9Source: NCAC, 2011
2.4 There are marked disparities in the quality of preschool institutions that these groupshave access to.41 Among children who participate in preschool education, children from rural areasshow lower school readiness as compared to their peers living in urban areas.42 This is a significantbottleneck given that an accumulating body of evidence43 shows that gaps in both cognitive and non-cognitive skills that emerge early in life and persist throughout adulthood. Policies to mitigate thesegaps later in life have proven very costly and investment at an early stage of life is the most effectivepolicy. Analysis of Georgia’s performance in PISA 2009 shows that students who attended preschoolattain significantly higher scores than those who did not. The long-term impact of these inequities ishard to quantify as the government does not keep records about children enrolled in pre-schooleducation in the EMIS and therefore, has serious limitations to address these fundamental gaps. Thepresent de-concentration of the system did not provide support for adequate social inclusion policiesto address these asymmetries and the resolution of these situations is left to the initiative, capacity andwillingness of municipal and regional authorities.
2.5 One of the major constraints towards improving the quality of preschool education isthe lack of the national preschool education standards and the absence of instruments for theirenforcement. Preschool education management and service delivery are highly decentralized andquality standards are not enforced. Reform of preschool education shifted the responsibility for thedelivery of preschool education from the MoES to the local governments. Attendance is notcompulsory and provision and financing are the responsibility of local self-governments(municipalities) and the full-day delivery model is the most prevalent. As a consequence ofdecentralization, there is wide variation in service modalities and quality. Financing also variessignificantly. While exemptions are given in some cases (low-income families, second child, disabled,orphans, etc.), local governments usually require parental contributions. The only role played by theMoES is that of proposing to local governments a set of standards, which are not enforced often dueto limited human and financial resource capacities in municipalities. Given the high level ofdecentralization, it is unlikely that the majority of the municipalities have the institutional capacity toimplement and monitor quality standards proposed by the MoES. Neither has the MoES tools tomonitor and enforce the standards proposed.
Key Recommendations To address the issue of low school readiness, quality disparities, lack of quality standards and
capacity for delivering and monitoring these standards, the following needs to be considered:
41 UNICEF: Comprehensive Costing and Finance Strategies for the Early Learning System in Georgia, 201342 NCAC (2011), School Readiness Study.43 See Heckman and Masterov (2007), Heckman (2006), Cunha and Heckman (2006) and Carneiro and Heckman (2003)among others.

52Georgia: Education Sector Policy Reviewo The state of preschool education would benefit if the MoES played a more active role. The
decentralized model has the advantage of being flexible and easy to be shaped to the particular needsof each region and this is an important virtue. However, the lack of supervision, monitoring, andquality assurance leads to wide differences in the quality of the service. Given the importance ofpreschool education, the MoES could play a pivotal role in setting up curricula and quality standardsfor facilities and teachers, and monitoring them.
o Strengthening service quality should be a priority. The expansion of pre-school education ismainly justified by its great potential for improving the beneficiaries’ future educational development.However, this is not likely going to happen if quality is not achieved. As this process will take a longtime, initial actions are important. Clear estimations of the costs of improving quality are needed,especially to resolve MoES and municipal capacity limitations.
2.2 General Education: Teaching Quality
2.6 Long term solutions to address education quality constraints will largely depend onresolving the issue of teaching quality: a more efficient management of the teacher force, theintroduction of better recruitment policies, a new teacher career regime and salary incentives andmore effective pre-service and in-service training investments. Ineffectiveness in the utilization of theteacher force manifests itself in a variety of symptoms.
2.7 Capacity limitations, especially for human resource management and forecasting, leadto an overall surplus in the quantity of teachers. This problem is expressed by the low nationalaverages of the student/ teacher ratios (roughly 8.2 for 2013/14). This surplus is caused by a variety offactors, amongst which: (i) the poor capacity of the system to adapt to the general populationreduction trends that caused a steady decline in student population. In the last decade, the totalnumber of students decreased by approximately 23% whereas the teacher to student ratios remainedalmost the same (see Table 2.2); (ii) Additional challenges generated by poor school managementpractices that resulted in the occurrence of massive “forced drop-out of students” in upper secondaryeducation. The threat of destitution of school principals, if too many students showed poorperformance in school leaving exams, create additional idle capacity in the system; (iii) lowered entryrequirements for new teachers that tended to add quantities of low-skilled new entrants to the teacherforce. In fact, present rates of teacher to student ratios in Georgia are so low that teaching capacitycould be virtually doubled with the present number of teachers.
Table 2.2: Teacher and Student Numbers 2005-2014
Year2005-2006
2006-2007
2007-2008
2008-2009
2009-2010
2010-2011
2011-2012
2012-2013
2013-2014
Nr.Students
634,700 636,000 614,700 635,616 624,526 595,394 568,486 558,589 553,016
Nr.Teachers
75,829 76,339 75,492 76,887 79,891 71,747 69,955 67,917 67,339
S/T Ratio 8.4 8.3 8.1 8.3 7.8 8.3 8.1 8.2 8.2
Source: EMIS, 2014
2.8 Ample variances in the dispersion of the teacher to student/ratios by regions and by typeof schools suggest that there is room for additional efficiency improvements in teachermanagement. At 8.5 percent, the student to teacher ratio of general education in Georgia isconsiderable lower than the OECD or EU21 countries (at 13.6 and 12, respectively; see figure 2.1).Despite the general trend of having a low teacher to student ratio, the ratio significantly differsaccording to location and school size. In big cities it is relatively high while in the regions it is low.For example: in Tbilisi it can be as high as 15/1 while in mountainous Adjara or Racha-Lechkumi itcan be 2.8/144. In larger schools (1,000 student and above) these ratios are more efficient (15,6%)while in small size schools can be as low as 2% (see Table 2.3 below). Over 36% of the students inGeorgia learn in schools with one digit student to teacher ratios.
44According to data from EMIS 2012, MoES

53Georgia: Education Sector Policy ReviewFigure 2.1: Ratio of Students to Teaching Staff in Secondary Education, 2011
Source: OECD, Education at a Glance 2013, pg. 275Note: Data for Georgia was provided by EMIS for 2012
Table 2.3: Number of Schools, Students & Teachers by Class Size, 2012
Classsize
School Size(StudentNumber)
Number ofSchools
Share of Total
Number ofStudents
Share of Total
Number ofTeachers
Share of Total
Student/TeacherRatio
3-4 1-50410(18%)
12,287(2 %)
5,889(9%)
2
4-15 51-100475(21%)
35,426(6%)
9,509(14%)
3.7
15-18 101-3201033(39%)
164,796(29%)
25,067(38%)
6.5
18-30 320 -1000449(19%)
252,453(45%)
21,563(32%)
11.7
30-35 1000 and above67(3%)
93,175(16%)
5,946(9%)
15.6
Total 2,322 558, 137 65, 666 8.5Source: Data from EMIS 2012, MoESs
2.9 Teaching workloads are very low. According to the statutory requirements, a full timeteacher is defined as a teacher who has 18 contact hours and 18 non-teaching hours45 per week,primary teachers and science teachers have even less teaching hours (14 and 15 respectively). Basedon an academic year of 36 weeks, the average yearly teaching hours in Georgia accrue to less than600 while the average teacher in an OECD country teaches 790 hours in primary, 709 in lower-secondary, and 664 in upper-secondary education. In countries such as the United States and Chile,these figures go beyond 1,000 hours per year (25 per week)46. Since there is no formal procedure formonitoring teaching and learning processes and no accountability system, there is no way to assess ifteachers really take non-teaching hours seriously and spend the time for preparing lessons.Considering the widespread practice of private tutoring in Georgia, many qualified teachers engage inprivate teaching after school, which means a significant part of the teacher force may not dedicatemany of the non-teaching hours for other pedagogic purposes.
45 Ministerial Decree 576, 200546 OECD (2013), Table D 4.2, p. 402. For more on this see WB Public Expenditure Review, 2014
8.510.6 11 11.4 11.5 11.9
13.1 13.7
17.8
1213.6
02468
101214161820
Geo
riga
Pola
nd
Slov
enia
Cze
ch R
epub
lic
Hun
gary
Est
onia
Finl
and
Slov
ak R
epub
lic
Tur
key
EU
21 A
vera
ge
OE
CD
Ave
rage

54Georgia: Education Sector Policy Review2.10 Despite the excess ofteachers, shortages of teachersby teaching subject and bygeographical location alsohappen. There is a generalizedshortage for science,mathematics and Georgianlanguage teachers everywhere.Remote and rural schools haveproblems to attract teachersespecially in foreign languages,mathematics and sciences. Acombination of factors rangingfrom poor teacher deployment,financial limitations of theregions and low schoolmanagement incentives
contribute to generate this situation.
2.11 As a consequence of the existing management practices, teaching is becoming an agingprofession in Georgia, leaving few opportunities for the youth to join. The average age of theteacher force is 47 years old. Less than 19% of the teachers are 35 or younger, while almost 20% are60 and older. It is also exceptional to note that 3.9% of teachers are in the 70-80 age group and 0.3%are above 80 years old47. A large proportion of the active teachers have already retired (18 % of allteachers) but despite reaching their retirement age, teachers remain in their teaching position andcontinue to teach. This is mainly because pensions are low but especially because the teacherretirement policy encourages them to stay in school: after reaching the retirement age, teachersreceive both pension and salary. In the last three years the average age of teachers has increased byone year. Data from EMIS shows that it was 45 in 2011-12, and 46 in 2012-13 and the percentage ofpension age teachers grew from 14.3% to 18.2% in the last three years. The space for young peopleentering in the teaching force is quite limited by these practices. However, new entrants are notprecisely quite young either. EMIS figures also show that in the last two years, the average age of newentrants to the teaching force was of 39 years in 2012-13 and of 40 years old in 2013-14.
Table 2.4: Percentage of pension-age teachers
2011-2012 2012-2013 2013-2014
Number of Teachers 69,955 67,917 67,339
Number of pension age teachers 10,015 11,321 12,301
Percentage of pension age teachers 14.3% 16.6% 18.2%Source: EMIS 2014, MoES
2.12 Teaching in not attractive career path in Georgia. The country’s brightest students rarelychoose teaching as their profession. This is evident from the test scores of university entrants whereeducation students have one of the lowest average scores according to the fields of study48. This isprobably associated to the fact that the low salary system of the teacher profession makes it a poorcareer choice in Georgia. A recent teacher Supply and Demand Analysis49 indicated that surveyedteachers expectations on an acceptable average salary is GEL 771, which is close to the nationalaverage salary and double of the present average teachers level salary. The same research also showedthat from those teachers who declared that they want to leave their jobs in the next ten years, lowsalary and pensions are amongst the two primary reasons.
47 More data about this is provided in Annex 2: Statistical Information48 NAEC, 201149 ISSA,2012
Figure 2.2: Average Hours of Teaching per Teacher by Age Range(2012-2013)
Source: EMIS, 2014
4.3
13.8 14.9 15.3 15.113.8 13.2 12 11.5
14.7
0
5
10
15
20<
20
20-2
9
30-3
9
40-4
9
50-5
9
60-6
9
70-7
9
80-8
9
90-9
9
Ave
rage

55Georgia: Education Sector Policy Review2.13 With the present conditions, the system is incapable of attracting qualified youngcandidates. This is alarming information as the poor quality of the TE pool is an important limitationfor in-service training performance. Countries with successful education systems have understood theimportance of having top quality teachers and created mechanisms to attract and retain talent.Currently there is no motivation for young people to enter teaching, considering the teachingprofession that pays below the average national salary, that does not reward higher qualifications andthe longer commitment to teaching does not mean more benefits. Acting teachers have no motivationto raise their qualifications; however, they may still be motivated to remain in teaching for longerperiods (as the profession offers more free time, stable conditions, etc.)50. It is possible to concludethat the current policies contribute to having retaining teachers, as well as not attracting the highestqualified people into the profession.
Figure 2.3: Student Average University Admission Test Scores by Field of Study in 2011
Source: National Assessment and Examination Center, 2011
2.14 Despite the government’s efforts, only about 25 percent of teachers have been certifiedtill present. There are few metrics of teachers’ quality in Georgia, one of the criteria employed iscertification examinations administered since 2010. Both new and in-service teachers take two typesof tests to be certified: a subject matter test and a test in pedagogical abilities. However, nocomprehensive teacher evaluation system is in place that would capture actual teacher performance inthe classroom. Certification rates (share of test-takers approved) have been very low. In particular,subjects such as mathematics, physics and primary education have seen approval rates below 25%,which cast doubt on the quality of teachers.
2.15 The quality of the pool of pre-service graduates is low. Universities that prepare teachershave a number of problems impeding sound initial teacher education: (i) from the outset they get thestudents, who, on average, have low scores at National University Entrance Examinations; (ii) theyexperience a deficit of well-trained professors in modern teaching and learning methods. There are noincentives to enroll in doctoral programs in education, which is the only way to be able to teach at theuniversity in teacher education programs (exception applies to some lecturers that can have status ofan invited lecturer, but there is a limit for such invitees); and (iii) universities and schools do not haveincentives to work closely together to provide meaningful practice for student teachers. Theseincentives could encompass rewarding teachers for accepting students from the universities forpractice and making it part of their professional development. Identifying best practices of meaningfulcooperation between schools and universities could become example for other schools anduniversities. The only comparative measurement on the quality of pre-service teacher educationprograms is a Teacher Education Study in Mathematics (TEDS-M) conducted in 2008. The studyshowed that competencies of future mathematics teachers near the end of their programs were very
50 Same research ranks love for children, free time and stable job as the top three reasons why teachers choose to teach(ISSA, 2012).
17191779
182818511853
18751885189118911894
1945
AgricultureEducation
EngineeringSocial sciences
Information TechnologiesHumanities
LawArts
Medicine and social workerHard and Natural Sciences
Business

56Georgia: Education Sector Policy Reviewlow and revealed that teachers in Georgia performed significantly below most of the 16 participatingcountries when assessed both in terms of their knowledge of mathematics as well as their knowledgeof how to teach mathematics.
2.16 Teacher in-service development and support systems are also underperforming. In 2004,the Ministry decided to decentralize the provision of teacher training to eligible accredited trainingproviders. The objective was to encourage the much-needed competition and stimulate qualityimprovements in the delivery of teacher training. The system was implemented for only one yearwhen the government decided to go back to centralized trainings. Currently the National TeacherProfessional Development Centre (NTPDC) provides all trainings for teachers. This exercise hasdiverted the focus of NTPDC from being a major policy planning organization in teacher issues tobecoming a training center. Teachers’ perceptions on the quality of delivered trainings does not varyfor centralized or decentralized model, however; when asked if the training system should becentralized or centralized, a great majority of teachers prefers a decentralized model as opposed to27%, who prefer centralized51. Another research on the impact of training decentralization on schooleffectiveness shows that, after the programs have been centralized the trainings became lessdiversified and their availability has worsened52. Teachers are not required by law to take a certainnumber of hours of professional development trainings; however the general requirement ofprofessional development exists. So far, the government has paid (through vouchers) for theprofessional development of teachers, both in centralized and decentralized models but no meaningfulresults from these investments were yet obtained.
2.17 The current teacher professional development model is ineffective because its content andstructure provides neither incentives nor mechanisms for teachers to internalize the knowledgeacquired through trainings and use it in the classroom. Limiting teacher professional development totrainings contradicts basic principles of contemporary learning theories by failing to acknowledge thatlearning occurs from experience, reflection, and practice. Short-term trainings where teachers takeup the roles of passive learners do not ensure that the knowledge that is transmitted to teacherstranslates into understanding of the concepts and principals of effective teaching and redefiningteaching. Growing evidence shows that traditional teacher professional development modalities arenot effective in changing teaching practices53 . More effective teacher professional developmentmodalities give teachers the opportunity to work on academic programs long enough to solve themand discover causal connections between their instruction and student outcomes.
2.18 Short-term subject matter trainings are not aligned with the teachers’ needs. If themajority of teachers fail to meet subject matter standard requirements according to teachercertification results, it is unlikely that short-term trainings are going to address the major knowledgegap. The relevant agencies should provide a more comprehensive analysis of the areas where teachersfail to demonstrate sufficient knowledge of their subject. The information should be used to developthe content, structure, and format of the subject matter courses and modules.
2.19 The lack of qualified inclusive education teachers is also an important concern. Someprogress has been made with the adoption of Special Education Teacher Standards. The NationalCurriculum also has a requirement that SEN children should study according to the individualizededucation program. However few teachers have the capacity and resources to materialize thisrequirement. Teachers Professional Development Center (TPDC) offers in-service trainings forinclusive education teachers as well as some non-governmental organizations offer such trainings. Inthe past, no pre-service training opportunities existed for inclusive education teachers. However, it isimportant to note that new programs have been introduced in one of the higher education institutionsin recent years.
51 ISSA,201252 CDI, 201353 Darling-Hammond and Bransford, 2006; Gallimore et al 2009; Little, 1982; Little and McLaughlin, 1993; Little, 2003;Grossman et al, 2009.

57Georgia: Education Sector Policy Review2.20 The development of school principals as instructional leaders is also a challenge.Moreover, insufficient professional development for school principals further limits their leadershipcapacity. Main causes for this are: (i) principals in-service training process remains sporadic and lesslinked with the overall needs of school leadership workforce development; (ii) the package of trainingmodules for principals available through MoES and different private providers is considerably smallerthan that for teachers; (iii) an integrated professional development scheme for principals that is linkedwith salary hasn’t yet been developed.
2.21 The new Teacher Evaluation and Professional Development Scheme currently underdevelopment provides a good opportunity to improve management of the teaching profession.The design of the new framework should take into consideration the following factors: (i) teaching isan aging profession in Georgia and the existing pension policies encourage pension-age teacherscontinue teaching leaving limited opportunities for young professionals to enter into the system; (ii)unemployment rate among young professionals is high, which can be considered as an opportunitygiven right policies are in place.
Key Recommendations
To improve teacher quality, Georgia will need to build a new system for teacher professionaddressing multiple challenges, which will require a long-term holistic approach addressingall the essential components for building the critical mass of professional teachers. Thespecific recommendations outlined below should be viewed as part of one integral vision,where recommended policy options reinforce each other to achieve the intended results.
To improve the effectiveness of teacher in-service training and professional development,emphasis should be made on the introduction of a sustainable school-based teacherprofessional development model. This will require a substantial capacity building at theschool level, creating a critical mass of qualified teachers to assume the role of a leadingteacher, encouragement of peer learning among the teachers and trained school principals tofocus on instructional leadership. The latter would focus on new modalities, such as lessonstudy, action research and school-based professional development teams. These newmodalities will allow teachers to collaborate in order to identify academic programs,formulate instructional plans, use evidence to develop interventions for improvement,observe and reflect on their interventions and thus engage in continuous improvement.Georgia can benefit from the already existing small-scale but successful initiatives beingimplemented in this area by the USAID supported G-Pried project and Ilia State University.
To improve the performance of teacher pre-service training, emphasis should be given to thedevelopment of new cadre of university teachers equipped with modern expertise in the field.School principal training courses would be particularly important for developing futureschool leaders.
Provide incentives to attract qualified professionals into teaching. It is essential to address theissue of lack of competitive compensation for teaching profession. The government will haveto consider setting high starting salaries to attract better graduates into teaching. Thegovernment may consider increasing salaries of the existing teachers complying with thequality requirements set by the teacher professional development standards.
Develop a comprehensive teacher evaluation system, which one hand serves as an effectiveinstrument for managing teacher quality and on the other hand, provides a clear path andopportunities to teachers for professional growth and career advancement linked to financialincentives.
To correct the overall surplus of teachers in general education, there is need to improve thecurrent poor management of supply and demand of teachers nationwide. This will require a

58Georgia: Education Sector Policy Reviewsolid understanding of teacher supply and demand status and influencing factors andimplementation of targeted policies/measures to respond to emerging trends.
To address the shortages of teachers by teaching subject and by geographic location, theexpansion and improvement of the existing teacher deployment programs will be needed.Georgia has implemented small-scale programs providing financial incentives to qualifiedcandidates to teach in remote and ethnic minority schools and can build on this experience.
2.3 Strengthening Vocational Education and Training
2.22 In the last few years, Vocational Education and Training (VET) has undergone variousreforms, the pace and scope of which have varied significantly and the system has been adaptedmultiple times in response to the political context. Key developments underpinning Georgia’s reformsin this area are the integration in the Bologna Process in 2005, the adoption of the Law on VocationalEducation in 2007 and the development of the VET strategy for 2009-2012. Much of these effortswere oriented towards bringing the VET sector closer to the labor market demands and encouragingprivate sector participation. In recent years, further amendments were made to the Law on VocationalEducation (2010), and the Law of Georgia on Development of Quality of Education (2010) wasadopted. The reform process involved radical changes and reorganization of the sector including: (i)optimization and consolidation of vocational education institutions in 2008-2009; (ii) introduction of avoucher financing system for level I and III programs in May 2012, as part of which eligible studentscould use their voucher funding in accredited state educational institutions for level three VETprograms and funding through grants for lever four and five VET programs in accredited state orprivate educational institutions offering priority programs set by the government; and (iii) significantinvestments were pledged by the government for supporting the VET sector as part of the 2012-2016program of the previous government, which was targeted on new school infrastructure, launch ofthree new vocational colleges, construction of the new technological university in Batumi , andsummer jobs for students.
2.23 However, the reforms in the VET sector were launched without a comprehensivedevelopment plan, full understanding of the skills development needs and potential impact ofthe new proposed programs. This translated into a set of rushed and improvised measures. One suchmeasure was the separation of VET pathways from general education by the 2007 VET law andintroduction of artificially fragmented short-term programs in 2010 (sometimes as short as twomonths) to meet the government objective of creating rapid path to employment. Many youngstudents with compulsory education enrolling in these programs found it difficult to get employmentas the competencies acquired were not sufficient to meet the labor market needs. At the same time,these changes resulted in dead-ends in the system.
2.24 The improvement of the quality and relevance of VET programs is hindered by thelimited participation of employers. Progress has been made in establishing coordinationmechanisms to align supply with demand, but substantial progress is still needed. One importantinstrument for ensuring the relevance of VET programs is the National Qualification Framework andqualification descriptions. In 2011, the National Centre for Education Quality Enhancement created14 Subsector committees. The purpose of these committees was to accommodate the needs of thelabor market into the qualifications and competencies described in the National QualificationFramework. 54 However, the engagement of employers and social partners in these subsectorcommittees is still minimal. As the subsector committee meeting reports show, the prevailing majorityof the participants are from government agencies, universities and VET centers. Increased
54 Committees were established in the following areas: (1) mining and geological engineering; (2) engineering, technology,metallurgy and materials science; (3) arts; (4) business administration; (5) tourism; (6) health; (7) marine, railway, air, landtransport; (8) energy and commerce; (9) agricultural sciences; (10) mass media and journalism; (11) construction andenvironmental protection; (12) computer science and telecommunications; (13) architecture; and (14) sciences

59Georgia: Education Sector Policy Reviewinvolvement of the business community would help make the system more responsive to employerneeds, while regular assessments of current and future skills needs could increase the informationavailable to decision makers.
2.25 VET Teacher professional development is limited and focused on the development ofteaching skills only. While teacher training is conducted annually and several hundred teachersparticipate in VET programs participate in them, the trainings were mainly focused on thedevelopment of general skills but not specific occupational skills.
Key Recommendations
The improvement of the quality and relevance of VET programs is hindered by the limitedparticipation of employers. Therefore the follow should be considered:
o Greater stakeholder participation is needed to improve quality, relevance andprovide a demand-led approach for VET supply. The National QualificationFramework and professional standards need continued improvement. Significantefforts are being made in this area. Its completion would impact the overall systemand can be achieved in the short term. Priority efforts should be carried out toimprove the MoES capacity to properly manage the engagement of wider range ofstakeholders, particularly the private sector employers. This should be staring pointas it affects the quality of all subsequent reforms in this area.
o Public Private Partnerships should be encouraged both in financing anddelivery of vocational education. This may an important move toward improvingthe alignment of VET programs with labor market needs. The business sector shouldplay an increased role in the design of VET curriculum, management and servicedelivery options, which will serve as incentives for the private sector to contribute tothe financing of this level of education.
2.4 Higher Education Financing
2.26 The government of Georgia introduced changes in the financing of the sector aimed atincreasing transparency and efficiency in allocating public resources. Direct budgetary allocationshave been gradually substituted by student grants and research grants and lump sum funding hasfaded over time. A similar observation can be made about research funding. The state has diminishedtraditional (based on historical trends) lump sum funding and substituted it with competitive researchgrants.
2.27 The financing of this sub-sector of education remains low. Public spending on highereducation is 0.47 percent of GDP and less than 0.2 percent of GDP on research and development in2013. Private spending on higher education constitutes 0.75 percent of GDP for the same year. Publichigher education expenditures allocated to institutions as well as per student expenditures is very lowin Georgia as compared to selected ECA countries (see table 2.5).

60Georgia: Education Sector Policy ReviewTable 2.5: Higher Education Financing Indicators, Georgia and Selected ECA Countries
Country
Total public expenditure oneducational institutions and
administration as a % of GDP.Public expenditure per pupil as
a % of GDP per capita
(1) (2)
Georgia 0.30 12.2
Bulgaria 0.54 15.6
Czech Republic 1.15 27.3
Estonia 1.17 23.8
Hungary 0.97 28.8
Latvia 0.87 20.0
Lithuania 1.33 23.9
Moldova 1.36 42.9
Poland 1.03 20.9
Romania 0.77 19.7
Source: WDI Database, 2014
Note: Figures for all countries are 2011, figures for Bulgaria and Poland for indicator one are from 2010, Estonia forindicator two from 2010.
2.28 While the funding reform was instrumental to increase transparency in the allocation ofpublic resources for higher education, existing financing instruments fail to support theimprovement of quality of teaching and learning and increasing research capacity. The largestshare of higher education revenues comes from student tuition fees only, which motivates highereducation institutions in Georgia to maximize their enrolment numbers. In 2009, the share of tuitionfees in public higher education institutions was 73 percent of the total revenues. By 2011, the share oftuition fees in some public universities (Georgian Technical University and Tsereteli State University)exceeded 80 percent of the total budget. As tuition fees are used to finance not only currentexpenditure of higher educational institutions but also capital investments, universities try to makesavings on other costs such as staff salaries.
2.29 The sector’s capacity for generating private sources other than tuitions paid byhouseholds is limited, which is largely attributed to financial autonomy constraints and theabsence of formal incentives for the private sector participation. Georgian universities, in theory,can generate income from contracts with business sector, philanthropy, services, and internationalpublic funding sources. There are no national data available on revenues raised from these sources.However, the budget plans (2012) and budget reports (2011) of several leading research universitiesas well as small teaching universities show that resource mobilization from private sources other thanstudents’ fees is low. Research universities like Tbilisi State University, Ilia State University, andState Medical University generate 20 to 30 percent of their revenues from research contracts, services,rent, and other research and education grants. However, in other universities funds generated fromthese sources are insignificant Philanthropic funding is rare for Georgian universities. Budget reportsof 2010-2012 for 10 Public universities (including the three largest research universities) show onlyone case when a local foundation donated money to a higher educational institution55 (see HEIincome sources in table 6 in annex 2).
Key Recommendations Existing financial resources allocated to higher education is insufficient for improving quality
of teaching and learning, and strengthening research capacity. Higher education needs
55 In 2011 a national foundation established by a Georgian billionaire contributed GEL 0,8 million to Ilia State Universityfor sustainable development of the Georgian Botanical Garden.

61Georgia: Education Sector Policy Reviewadequate financial resources allocated in a manner that promotes fair competition but alsoensures sustainability. Georgia should at least triple its public spending on higher education,up to 1% of GDP. Although highly vulnerable to external shifts and inflation risks, Georgia’seconomy is growing at a steady pace56.
The current limited funding mechanisms for higher education also lack clear strategicpurpose in terms of improving efficiency and equity. Diversifying funding instruments will beessential. Funding mechanism need to first align with the sector reform objectives. AssumingGeorgia increases its public funding to HEIs, the Government could introduce complementaryfunding mechanisms in the system to encourage improved institutional performance andsupport the development of HEIs. After identifying its main policy objectives (access, equity,quality, labor market relevance, etc.) for Georgia’s higher education system, the Ministry ofEducation and Science should reassess how its current funding model fits or aligns with thoseobjectives. (Annex 3 describes different financing mechanisms against main policy priorities).
The government could consider diversifying the funding mechanisms in line withinternational best practice in this are to facilitate research and innovation, improve the qualityof teaching and learning and facilitate knowledge transfer. The following options couldcomplement some form of base funding:
o Output-based funding formulae or payment for results: Denmark, Australia,South Africa, and the Netherlands use output-based formula funding to distributepublic funds in a transparent way based on mutually agreed output indicators. In thisfunding modality the amount a university receives is linked to the number ofgraduates or institutional output indicators. Some systems diversify the amount perstudent by field of study (Salmi and Hauptman, 2006).
o Performance contracts: In France, Finland, Denmark, Spain, Chile, and several U.S.states governments enter into regulatory agreements with institutions to set mutualperformance-based objectives. Denmark signs so called development contracts overimprovement goals of HEIs (Salmi and Hauptman, 2006).
o Competitive funds: The Government of Georgia already has the practice of usingcompetitive funds for financing research projects. This practice could be extended toother development areas in higher education system such as infrastructuredevelopment and innovative teaching projects etc. International experience showsthat setting clear criteria and procedures are critical factor for ensuring transparencyand fairness. Some countries with a relatively small or isolated academic communityinvite international or transnational reviewers to reduce the danger of complacencyand subjective evaluation among a limited group of national colleagues. Scandinaviancountries and the Netherlands offer a good example of involving transnationalreviewers in the process.
56 Global Economic Prospects June 2011: Regional Annex: Europe and Central Asia. The World Bank. Retrieved from:http://siteresources.worldbank.org/INTGEP2010/Resources/GEP2010Summer2010-ECAAnnex.pdf

62
Chapter 3. Recommended Priority Interventions3.1 Based on the strategic analysis and recommendations presented in the previous sections, a list of priority interventions has been identified for thegovernment’s consideration as part of the new Education Sector Strategy. This is not an all-encompassing list but a prioritized selection of essential interventionsneeded. These programs were selected based on their importance to the sector strategic focus as stated above. Each recommendation is assessed according tofollowing three criteria: sequencing (short (six months), medium (one year) and long–term (two years) indicating the time taken to start the reform), impact(high/low impact on improving learning outcomes), and technical complexity (low, medium or high covering cost implications, political sensitivity, andimplementation level risk).
3.2 This matrix presents proposed priority interventions grouped under each “key recommendations” discussed in Chapter 1 and 2 of the report.
Key Recommendations Sequencing Impact TechnicalComplexity
Proposed Policy Interventions
1. Improving Quality of Education as measured by Student Learning Outcomes and Labor Market Outcomes
1.1 Improvement to the quality of education – includingcurricular improvements- should focus on eradicatingfunctional illiteracy and developing key competencies thatsecondary education graduates need to acquire to meet theneeds of the labor market.
Short-term High High 1.1.1 Introduce further changes into the curriculum consistent withthe existing challenges of functional illiteracy and lack of keycompetencies that are necessary to meet the basic needs of the labormarket.
1.1.2 Strengthen the mechanisms for applying evidence (such asnational assessments, examinations, feedback from educationalinstitutions, curricula based international assessments) prior toincorporating further changes in the curricula content.
1.2 Focus on relevance by shifting to a demand-led approachin which employers’ feedback help shape the educationsystem. Quality assurance mechanisms need to be revisitedfor the new mechanism to be functional.
Short-term High High 1.2.1 Develop formal mechanisms (employer and graduate surveys;labor market studies) to identify labor market needs, skillsforecasting and training needs and strengthen Ministry capacity toapply this information for improving qualifications framework andstandards.1.2.2 Strengthen the MOES capacity in the engagement of theemployers and sector specific professionals in the development ofVET standards and programs.

63Georgia: Education Sector Policy Review1.2.3 Improve accreditation process through increasing engagementof sector-specific practitioners and employers in the process
1.2.4 Develop a stronger career counseling and guidance services ateducational institutions/resource centers and ensure access toinformation on employment statistics by study programs andeducational institutions
2. Access and Equity
2.1 Promote increased participation in preschool educationstarting with older children first (5 year old) and focus onsocial inclusion.
Short-term High High 2.1.1 Develop and implement a plan to gradually promoteparticipation starting with the aim of enrolling the older childrenfirst (5 year olds) and progressing to other groups in closecooperation with the Ministry of Regional Development andmunicipalities.2.1.2 Develop a national plan promoting incentives for increasingthe role of private sector in providing preschool education.
2.1.3 Develop targeted awareness campaigns to stimulate parents’interest towards preschool education.
2.1.4 Develop national criteria and targeted financial measures topromote participation of underrepresented groups
2.1.5 Plan more efficient use of underutilized government schoolinfrastructure to extend service coverage
2.1.6 Retrain underutilized teachers from general education tobecome full-time preschool teachers
2.2 Increase participation rate in upper secondary education Medium-term
High Medium 2.2.1 Introduce general education component in the vocationaleducation and training stream (also discussed in VET program)
2.2.2 Develop more flexible and diversified curriculum options atupper secondary level (along with minimum core curriculum,introduce students with option for diversified streams, such asadvanced science and math, social sciences and/or humanities)
2.3 Increase inclusion of special needs students in generaleducation
Medium-term
Medium High 2.3.1 Expand in-service and pre-service teacher professionaldevelopment programs for inclusive education
2.3.2 Expand the existing number of schools with infrastructuretailored to handicap access

64Georgia: Education Sector Policy Review2.4 Expansion of VET network to increase access consistentwith focus on quality improvements.
Long-term High High 2.4.1Identify geographical locations for new VET centers toimprove regional coverage and encourage the development ofprivate VET providers through introducing financial incentives
2.4.2 Expand the existing financing scheme to accommodate indirectcosts (living expenses) of VET participation.
2.4.3Expand the opportunities for special needs students to attendvocational courses and eliminate artificial barriers
2.5 Eliminate dead-ends and improve the attractiveness ofVET.
Medium-term
High Medium 2.5.1 Introduce general education component into vocationaleducation and training programs
2.6 Establish effective mechanisms to expand enrolment andpromote participation from under-represented groups,especially students from poorer backgrounds and studentsfrom traditionally under-represented communities(particularly rural and ethnic minorities).
Short-term Medium Medium 2.6.1 Gradual expansion of needs-based grants for underrepresentedgroups, such as students from low socio-economic background,ethnic minorities and special needs students
2.6.2 In cooperation with local banks, develop and implement a pilotprogram of subsidized student loan program targeting studentsenrolled in TE programs with the highest private return to TE
2.6.3 Development new measures for stimulating the participation ofstudents that are employed full time, such as: acknowledgingprogress through a credit system, providing part-time or eveningcourses or financial support
3. Governance
3.1 Develop and fully implement and new schoolmanagement system
Short-term High High 3.1.1 Develop school level performance monitoring instruments totrack progress towards achieving national education and curriculumgoals: (i) student enrolment, retention and transition; particularattention should be paid to school efforts to ensure participation o ofmore vulnerable groups and early detection and early interventionssystems to prevent early school leaving; (ii) student learningoutcomes at least in core competencies through standardized testsand examinations; ensure a balanced assessment mechanism thatcombines indicators of input, output and process;

65Georgia: Education Sector Policy Review3.1.2 Develop support system to help school leadership and teachersaddress school challenges: school inspectorate responsible both forperformance review and school support through specialized teams towork closely with schools; the latter will require close cooperationamong education agencies;
3.1.3 Improve the quality standards of internal quality assurancebaseline documents (i.e. school self-evaluation report) ensuring theyprovide clearly formulated indicators and enough information formonitoring
3.1.4 Introduce a new modular, credit-based in-service and pre-service school principal development system to ensure that allschool principals are capable to serve as instructional leaders
3.1.5 Consistently improve the capacity of Board of Trusteesthrough more focused and sustainable procedures through engagingERCs and resources to ensure the effective functioning of the newinternal mechanisms of quality monitoring in schools
3.1.6 Revisit the division of functions and responsibilities betweenMoES and schools for principals recruitment and re-define goals andprocedures of the interview stage of principals selection process
3.2 Reform the post-secondary education governance byimproving accountability while providing autonomy
Medium-term
High High 3.2.1. Develop and implement a sound monitoring and evaluationframework consisting of accountability indicators built throughconsensus among the major stakeholders, which are concentrated ongraduate satisfaction, employment, research output and measure thepost-secondary educational institutions contribution to other aspectsof national and local development; also consider integrating leadingGeorgian universities into a European university ranking system.
3.2.2 Review the legal framework for authorization andaccreditation to ensure that these instruments are not in conflict withthe principle of institutional autonomy
4. Strategic Management of the Ministry of Education and Science

66Georgia: Education Sector Policy Review4.1 Develop the Ministry’s policy and planning capacity,including data management and application, to support keystrategic management functions and sustain the introductionof management by results practices
Short-term High Medium 4.1.1 Develop a comprehensive, long-term sector strategy viarelevant stakeholder consultation process that would create theopportunity to negotiate the necessary increases in the medium termfinancial support for the education sector development.
4.1.2 Develop and implement a monitoring framework for each ofthe desired outcomes of the strategy programs providing an initialset of targets, baseline measurement and time frames to achievethem4.1.3 Define and request the systematic preparation of evaluationstudies concerning the main programs and measures implemented bythe Ministry.
4.1.4 Fully integrate all available information into an EMIS systemthat provides all managers access to all available data, informationand knowledge
5. Cross-cutting issues5.1 Ensure the application of LLL principles across all levelsof education
Long-term High High 5.1.1 Develop the MoES capacity to coordinate, implement andmonitor the development of the National LLL Policy and Strategy
5.1.2 Develop National LLL Policy and Strategy
5.2 Ensure meaningful use of ICT to advance teaching andlearning and skills development
Medium-term
Medium High 5.2.1 Revise the curriculum to ensure effective application of ICT inteaching and learning.
5.2.2 Evaluate the impact of “Buki” for improving the quality ofteaching and learning and education outcomes.
5.2.3Develop ICT based teaching and learning resources. Thedevelopment of the resources should prioritize basic education andthe subject areas where teacher shortage is a long-term issue.
6. ECD: School Readiness
6.1 The MoES must be capable of ensuring that preschoolquality standards are achieved across the whole country.
Short-term High Low 6.1.1 Development of preschool education law to ensure mandatoryenforcement of national preschool education standards andcurriculum mandatory
6.1.2 Development of teacher and principal standards for preschoolsthat should guide the selection/entry into the preschool profession
6.1.3 Develop pre-service and in-service preschool educationprograms.

67Georgia: Education Sector Policy Review6.1.4 Develop instruments to measure school readiness of childrenentering primary education, which should serve as basis for capacitydevelopment support to municipal and regional government toenforce national preschool quality standards.
6.1.5 Develop MoES capacity to manage pre-school developmentreforms
6.1.6 Provide the capacity development support to decentralizedauthorities to enforce national quality standards.
7. General Education: Teaching Quality
7.1 Strengthen teacher in-service and professionaldevelopment system
Short-term High Medium 7.1.1 Develop a new policy for teacher professional developmentthat is built around the concept of school based professionaldevelopment model and create a critical mass of teachers who willlead school-based professional development process at individualschool level7.1.2 Diversify the existing in-service trainings through theintroduction of the decentralized teacher training system, wherevarious organizations including higher education institutions wouldoffer trainings to schools in line with quality standards enforced byMoES
7.1.3 Develop and implement measurement systems to assess andmonitor the impact of in-service PD investment in increasing thequality of education
7.1.4 Introduce a new modular, credit-based in-service schoolprincipal development system to ensure that all school principals arecapable to serve as instructional leaders
7.2 Strengthen pre-service teacher training Short-term High Low 7.2.1 Review and modernize pre-service programs, including schoolleadership programs for school principals. This would requireproviding targeted support to transform quality in the selected pre-service teacher training programs: (i) faculty development throughfinancing study abroad programs; (ii) extending leading expertsupport for program revision; (iii) infrastructure improvements; (iv)improving quality and availability of learning resources.

68Georgia: Education Sector Policy Review7.2.2 Develop, implement and ensure communication of newmeasures (such as scholarships, subsidies and bonding systems) toensure the flow of qualified students entering pre-service training
7.3 Provide competitive compensation to attract top calibercandidates into teaching
Long-term High High 7.3.1 Provide high starting salaries for qualified teacher candidates
7.4 Develop a comprehensive teacher evaluation system Short-term High High 7.4.1 Develop multiple measures for the assessment of teachingquality apart from the existing certification system; This wouldrequire development of new instruments to measure teacherperformance in the classroom
7.5 Improve management of teacher supply and demand Short-term Medium Low 7.5.1 Develop a system for forecasting and managing teacher supplyand demand
7.5.2 Expand and improve the existing teacher deployment programsto ensure teaching quality in remote and rural areas and in allteaching subjects
8. Strengthening Vocational Education and Training
8.1 Ensure greater stakeholder participation to improvequality, relevance of VET programs.
Short-term High High 8.1.1 Develop formal mechanisms (employer and graduate surveys;labor market studies) to identify labor market needs, skillsforecasting and training needs and apply this information forimproving qualifications framework and standards
8.1.2 Strengthen the Ministry capacity in implementing the demand-led approach in the VET sector and engaging employers and sectorspecific professionals in the development of VET programs
8.1.3 Reform existing accreditation mechanisms to ensure employerand sector-specific practitioners’ participation in VET programevaluation8.1.4 Introduce financial and other incentives for fosteringpartnerships (e.g. for supporting apprenticeships) between VETcenters and business and industry
9. Higher Education Financing
9.1 Align higher education financing mechanism with theGovernment’s national objectives in higher Education
Medium-term
High High 9.1.1 Develop and implement a pilot plan for introducing innovativefinancing mechanisms (e.g. competitive innovation grants andperformance contracts)

69Georgia: Education Sector Policy Review9.1.2 Develop MoES capacity in (i) using higher educationinstitutions’ performance information to identify and evaluate linkswith financing instruments and TEI performance indicators and (ii)refining financing instruments to ensure better link with the nationalgoals in TE9.1.3 Based on the results of pilot programs and after discussingwith stakeholders (HEIs, private sector, and relevant GoG agencies)introduce new financing framework with clear procedures for (1)allocating pubic sources among HEIs and students, (2) theirmonitoring and evaluation and (3) further modification.

627070
Chapter 4. Implementation of Sector Reforms4.1 Georgia has made significant progress in reforming its education system and adoptedswift reforms in many areas. As the government is ready to implement more large-scale reforms toadvance the education system, this section describes the main overarching areas that should be alsoaddressed to ensure the appropriate implementation of sector-wide Education Strategy during 2015-2024. These recommendations pretend to mitigate some of the key issues described in Chapter 1,Strategic Management of the Ministry of Education and Science: (i) lack of a strategic approachapplied to the overall management of the ministry operations considerably limited the achievement ofthe desired outcomes; (ii) lack of consistency and contradictions in the introduction of many reformsdid not generate the expected incremental and systemic improvements or took too long to do it; (iii)the ministry sometimes “navigates blind” in some areas as current EMIS does not integrate all criticaleducation data; (iv) with the data available, the ministry does not produce sufficient and periodicinformation and knowledge (evaluation studies for example) to feedback and improve the strategicmanagement of education; (v) social inclusion standards, targets, measures and tools are strategic andmust be defined at the national level and not left to the arbitrary decision of the municipalgovernments. The following are the areas that will deserve special attention:
Addressing Management Challenges: ideas to strengthen the executive management capacityand the operational management support structure and mechanisms that will be needed.
Monitoring and Evaluation Framework: the main elements of the monitoring plan to track theprogress of program implementation and the achievement of outcomes of the strategic plan.
Start-up Phase: the implementation of the plan will demand a series of changes andmodifications and stages to ensure the long-term introduction of this new work approaches.
Critical Success Factors and Risk Management: the major internal and external factors that mayaffect the overall success of the plan and how to address them.
4.1 Addressing Executive Management Challenges
4.2 To succeed in achieving the national education goals, objectives, and targets, theimplementation of the plan must have a solid foundation. The effective implementation of asector-wide Education Strategy will require the definition of efficient coordination mechanisms andclear lines of responsibility, authority and accountability at central as well as at decentralized levels.It is important to avoid the creation of heavy bureaucratic structures and favor an efficient usage ofthe existing internal structure developing agile working groups supported with appropriate technicalassistance.
4.1.1 Strengthening the Executive Management Functions
4.3 The Minister of Education and Science should act as the chief executive officer in managingthe implementation of the sector wide strategy and should provide leadership, ongoing problem-solving and executive decisions to ensure the smooth operation of the Program ImplementationTeams and their accountability. At the strategic management level, a new coordination mechanism, aStrategic Plan Coordination Group, could be defined under the coordination of the Minister ofEducation and Science. This Group should be responsible for overseeing the entire implementationprocess, making sure that the Ministry structure is fully supportive of the achievement of the StrategicPlan goals and targets. The Coordination Group should receive technical inputs and additionalsupport from the following ministry functions:
Finance: provide adequate budgeting financial management support and information systems. Legal Advisory: review on a continuing basis the existing rules and regulations to be improved
and revised as necessary in addition to setting up a supportive, enabling regulatory frameworkfor effective implementation of the education reform concepts embedded in the Strategic Plan.

71Georgia: Education Sector Policy Review Policy, Planning and EMIS Support: these functions are essential to ensure provision of key
technical support for managing and monitoring the implementation of the plan and are explainedin more detail later
4.4 The characteristics of some of the priority programs (especially PP1: Teaching Quality andPP2: School Accountability and Support Systems) will require the direct involvement of the Ministerand other top management authorities of the ministry. This will be needed to provide the generalcoordination, initial orientation and the criteria that will be used to guide the capacity strengtheningsupport to some of its present capacities or for the creation of new capacities.
4.1.2 Strengthening Policy, Strategy and Planning Functions
4.5 Changes to the present structure of the MoES are needed to create a special technical unit, anew Strategy, Policy and Planning Department to develop the technical capacity to support keystrategic management functions and sustain the introduction of management by results practices.Without adequate management by results, the implementation of sector-wide reforms risks of failureare increased, as there are too many areas that require horizontal and vertical coordination that willnot be automatically provided by the present structure. This department should also provide (i)monitoring and evaluation frameworks and (ii) host the development and implementation of crosscutting policies that involve the whole sector, such as for example, social inclusion, lifelong learningor early school leaving policies. The strategic planning services provided by this unit should cover thefollowing main functions:
Monitoring Framework. A sector-wide monitoring framework should compile for each of thedesired goals a specific set of key performance indicators, targets and baseline measurement aswell as the intermediate results and time frames to achieve them. For each of the implementationpriorities well defined multi annual plans and budgets must also be provided
Annual Action Planning. Develop methodologies to support national authorities in thepreparation of Annual Action Plans and Budgets to correctly reflect the specific implementationrequirements for each priority programs and sector results.
Management by Results. These MBR tools should combine the traditional, “input-based”expenditure monitoring systems with “output-based” project and program monitoring using theinformation contained in the execution calendars established in the Annual Plans. This tool willhelp the Ministry to prepare expenditure plans and avoid administrative bottlenecks but moreimportantly, it will enable to begin to monitor that the resources spent were actually used toachieve the desired results.
Performance Assessment and Evaluation Framework The new department must also providetools to assess the achievement of educational as well as management goals and outcomes statedin the strategy and priority programs. For this purpose, systematic and evidence-based studiesmust be carried out to provide regular follow-up of the adequacy and impact of the selectedpolicy interventions.
4.6 To monitor and review overall progress of the strategy implementation, the MonitoringFramework should describe the outcomes to be achieved, the target figures selected for the keyoutputs and the ways of measuring their achievement. This list can be divided by year, andtherefore, provide the main elements necessary to monitor progress in the implementation of theprograms. A more detailed framework will be necessary to monitor the implementation of the AnnualAction Plans, as these require a more detailed description of the actions to be performed. Outputplanning will have to be readjusted on a yearly basis: after measuring what has been achieved duringthe previous year it will be necessary to adjust the plans for the year which follows to ensure theachievement of the long-term targets.
4.7 The new department could also be instrumental in supporting the development andimplementation of crosscutting policies that require the active intervention of central anddecentralized bodies of the Ministry. A good example could be provided by a top priority: thedevelopment and implementation of a Social Inclusion Policy. The following are the main actions

72Georgia: Education Sector Policy Reviewneeded to create an appropriate institutional framework and support system that clearly demarcatesresponsibilities at the national municipal and school levels:
Define and implement a national social inclusion policy to promote the educational success ofsocially marginalized groups57 ensuring that they gain full access to the same opportunities,rights and services that are accessed by the mainstream of society
Regulate the articulation of national policy definitions and financing for social inclusionmeasures and regional /municipal responsibilities for their implementation
Develop evidence-based studies to analyze the most vulnerable groups that should receiveassistance in all education sectors and the best means to support them
Define general policy criteria to use voucher/grants and other tools for providing financialsupport to stimulate participation of the desired target groups in all education sectors
Define coherent principles for using mother tongues in all education levels Define the scope and quality of the support that the government will be able to provide to
children with special educational needs Establish the extent of the educational support to strengthen the reinsertion of displaced
populations Define the criteria to reduce other problems that hinder enrolment and retention, such as: the
hidden costs of education, distance to schools, inadequacy of school buildings, violence inschools and the perception that families have about the quality and usefulness of the educationthat the children will receive
Produce regular assessments of the impact of the measures implemented and their cost-effectiveness
4.1.3 Strengthening Management Information Systems Capacity
4.8 A key element for providing evidence based information for monitoring programimplementation and assessing educational outcomes will be the availability of reliable andcomprehensive data from the EMIS 58 . A comprehensive EMIS should be designed to store,retrieve, analyze and evaluate raw data on student enrolment, staffing and school infrastructure andasset inventory at all educational levels (from pre-school to tertiary education). The EMIS could alsobe compatible with and integrate valuable data from other internal sources, such as financialexecution data, infrastructures payroll and human resources management, allowing access to a seriesof predefined integrated management indicators. It could also provide access to a number of externaldatabases (national census and population data, general infrastructural databases, poverty maps andsurveys) that would add value not only to the decision-making process but also to the Monitoring andEvaluation process.
4.9 To fully benefit from the introduction of ICTs and Management Information Systems toappropriately support education management at the central, municipal and school management levels,the Ministry should strengthen the following capacities:
Design and implement systems and procedures to ensure the expansion of EMIS to cover alleducational areas (including preschool, VET and tertiary education) and extend present EMISinformation with enrolment information at the classroom level (linking teachers withclassrooms)
Fully develop a Human Resource MIS. The system should contain information about all MoESadministrative employees, schools, and boards of trustees and integrate all available informationabout teachers (personal history, classroom performance, in-service training, etc.)
Develop a School MIS to include detailed information about students (school attendance,assessments, achievements, etc.), history (mobility of students, etc.), electronic journals and
57 Those groups who are systematically denied access to entitlements and services because of their socio-economiccondition, ethnicity, language, race, religion, age, gender, disability, HIV status, migrant status, or where they live58 As has been planned in Priority Area “Planning, Budgeting and Information Systems”

73Georgia: Education Sector Policy Reviewtime-table of lessons. The system should allow schools to fully maintain educational processonline and provide daily information to parents and students (attendance and academicachievements, student support systems).
Develop social inclusion management information support systems to enable schools to bettermanage the situation of children from socially vulnerable families and under-represented groups(access to grants, learning and counselling history, etc.)
Develop a system to support school infrastructure management and accumulate informationabout physical school infrastructure (buildings, school yard, etc.), idle capacity, inventory, etc.
Develop geo-referenced capabilities of the EMIS to allow it to plot the education outcomes/input information on maps to assist macro and micro education planning and inspections basedon real-time evidence
Fully integrate all available information in internal databases (human resources, teachers, in-service training records, school infrastructure development/assessments, financial) and allrelevant external databases (census, population relocation, new-born, poverty, infrastructuredevelopment plans, etc.) into the MIS system
Develop user-friendly and customizable user interfaces and web access to facilitate the usage ofavailable data for all management staff (central, regional or school level)
Design and implement a comprehensive capacity development program to ensure that all MoESmanagement are capable of using these systems to achieve excellence in their managerial duties
Gradually develop the quality of the ICT infrastructure and access systems (intranet, web basedaccess, school connectivity, etc.) to allow efficient access to all potential users
4.2 Addressing Main Operational Functions
4.10 At the operational level, the implementation can be ensured by the definition of PriorityProgram Implementation Teams. The main function of these teams will be: (i) to ensure propercoordination between the different components and activities of each program; (ii) to prepare andimplement Annual Action Plans with the technical support of the Coordination Group; (iii) to monitorthe implementation of the plan through regular structured meetings; and (iv) to prepare regular reportson the program implementation. Each implementation team will be composed of the peopleresponsible for the different education sub-sectors/departments directly involved in carrying out thecorresponding program and will include the technical advisors working in each area. For each teamthe following key roles should be established:
Team Leader. Each program should have only one team leader. This person will be directlyaccountable to a Deputy Minister and responsible for the successful implementation of thePriority Program. Team leaders should normally correspond with one Deputy Minister. Therewill be some cross cutting programs (Teaching Quality, Donor Coordination) that may requirethe creation of specific coordination teams. In that case, a team leader will be selected fromamong the heads of the directorates that are mainly responsible for the Program implementation.
Focal Point. For each program, one technical person should be appointed to facilitate theplanning and monitoring tasks to be carried out by the implementation team. The Focal Pointwill act as the contact person to define the technical tasks to be performed by the Team, (forexample: preparing the team’s annual action plans, the data for the management by resultsmonitoring tool, and reporting to the Coordination Group). Focal Points will be selected on thebasis of precise criteria including having: the technical skills to deal with data, information andperformance indicators; good communication skills, and the ability to coordinate effortsregarding the implementation of the plan.
4.3 Addressing Implementation Start-Up Challenges
4.11 The implementation of the Strategic Plan will start in 2015. A pre-implementation stageshould be defined to make a series of preparatory arrangements and ensure that in 2015 theimplementation is correctly addressed. The early stages of the implementation are of criticalimportance, as substantial changes will happen at the same time: (i) new managerial staff in charge;

74Georgia: Education Sector Policy Review(ii) new managerial practices introduced to implement the plan, (iii) the need to start implementingcalendars that will require significant levels of coordination. The following are the key inputs toensure an adequate start for the Pre-Implementation and the early Implementation Phases:
4.3.1 Pre-Implementation Phase
4.12 During pre-implementation phase, the following issues should be addressed:
Ministry Structure Review: the present Ministry structure must be analyzed to establish if anychanges are needed to facilitate the implementation of the Strategy.
Ensure an appropriate 2015 budget allocation: 2015 should mark a discontinuity point from thetraditional budgeting for Education. The budgetary proposal to be presented to the PrimeMinister may require substantial increases from the traditional education budgets. This is notgoing to be achieved overnight, and several rounds of negotiations supported by accuratetechnical documents will be required during 2014
Define Key Donor Support: it will be necessary to ensure that all necessary support can beobtained to implement key priority actions where the Ministry may not have the technicalexpertise or the volume of investment that will be required to start the implementation of theplan. It is important to engage all donors as early as possible and start the process of defining allnecessary proposals to ensure adequacy of their 2014-2020 cooperation support since theirdecision making processes may take substantial time to process the Ministry’s requests.
Prepare an Adequate Inception for the Strategy Management Teams: all priority program teamsshould undergo an intensive training and induction process by the end of 2014. During thisperiod, they should be able to excel in the following areas: (i) general understanding of thecontents of the Strategy; (ii) in depth analysis on the priority program that they have toimplement; (iii) understand management by results monitoring and reporting principles andtools; (iv) preparation of annual budgets and plans (v) engage in the preparation of the 2015Annual Action Plans
4.3.2 Implementation Start-up Phase
4.13 The initiation of the Implementation Phase will require addressing the following issues on aone-off basis:
Baseline and Performance Assessment Framework: it is important to define the indicators thatwill be used to monitor performance and the starting point data that will be used to compare to.This is an activity that needs to be developed as soon as possible.
Donor Coordination: close donor coordination is important to ensure smooth implementationfrom the outset.
Coordination with the Government: new mechanisms should be established to ensureparticipation of the Prime Minister’s office and the Ministry of Finance in the initial steps ofstarting up the implementation of the Strategy. There will be a significant number of situationsthat will benefit from their participation. It will also help to initiate a new, and more coordinatedway of working with all other executive branches of the government and regional governments.
Significant managerial leadership will be required to ensure that the Implementation of theStrategy starts on the right track and to anticipate and avoid initial coordination and managementproblems. This will no longer be a “business as usual” situation and a critical success factor willbe an engaged and focused leadership from the Minister and key Directors.
4.14 Several critical success factors to ensure the success of the implementation of the overallstrategy:
An important shift in the allocation of public financial resources to education will be required toensure the various aspects of the strategy can be realized.

75Georgia: Education Sector Policy Review Careful and results-oriented management of the public resources, ensuring that annual spending
is coherent with the implementation needs emerging from the monitoring and evaluation systemwill be needed.
An ongoing and well-managed capacity building plan will be indispensable for the sustainabilityof the outcomes stated in the Strategy
A sector-wide approach to coordinate the support of all development partners is needed to makepossible the smooth implementation of all the targets of the plan, as well as their sustainability
It will be also critical to achieve an effective dissemination of the plan to enable learners,teachers, parents, and, indeed, all Georgians, to realize the importance of the proposed changes
Maintaining a good degree of flexibility and developing the ability to adapt to change will alsobe crucial in light of Georgia’s ever-changing circumstances
4.15 The achievement of project objectives is always subject to influences beyond the directcontrol of the MoES management. It will also be important to monitor this ‘external’ environmentto identify whether or not the assumptions that have already been made are likely to hold true, whatnew risks may be emerging, and to take action to manage or mitigate these risks where possible. ARisk Analysis and Management Matrix should be built once the main characteristics of the priorityprograms of the strategy are fully defined.

76Georgia: Education Sector Policy Review
AnnexesAnnex 1: The structure and institutional setup of the educationsystem
Georgia’s National Qualifications Framework59 consolidates and defines qualifications at alllevels of the education system. General education system consists of non-compulsory pre-schooleducation (2-5/6 years60), compulsory education (9 years: 6-12 years/grades 1-6 for primary educationand 12-15 years for lower secondary education/grades 7-9) and upper secondary education (15-18years/grades 10-12). After completing the compulsory basic education, students can choose to enrollin vocational education (levels1 to three according to the European Qualifications Framework), 15-18years). Students completing the third level of VET can choose to continue studies in the subsequentlevels (levels 4 and 5). For some programs, the occupational standards require to have generaleducation diploma in order to enroll in VET programs 4 and 5. Higher education consists ofBachelor’s Degree (4 years), Master’s Degree (two years) and PhD (3 to 6 years). Students arerequired to successfully pass the unified university entrance examinations (UEE) for progression tothe academic stream of higher education.
Figure1: Structure of Georgia’s Education System
Continuous Education
Academic Education Vocational Education and TrainingPhD Studies
Master StudiesBachelor Studies
Bachelor’s DegreeVocational Education Levels IV and V
Tertiary EducationUpper Secondary Education
General (X-XII)VocationalEducation
Level I
VocationalEducationLevel II
VocationalEducationLevel III
Lower Secondary Education (VII-IX)Primary Education (Grades I-VI)
Pre-School Education
The Ministry of Education and Science (MES) has the overall responsibility for education policyformulation and control over its execution while some of the key implementation functions areassigned to the Legal Entities of Public Law (LEPL). The MES has the primary responsibility forthe policy and management of the education sector in Georgia. Nonetheless, some of the corefunctions such as examinations and assessment, teachers’ professional development, qualityassurance, educational infrastructure development, science development, education statistics areimplemented by the specialized semi-autonomous LEPLs under the umbrella of the Ministry, aspresented in Figure 2 and Figure 3 below. These institutions receive financing from the state budgetbut also generate revenues through their activities. The National Examination Center (NAEC) is
59 Adopted by the Ministry of Education and Science (MES) Decree N120/N on December 10, 2010.60 Amendments to the law on education in 2010 reduced enrolment age in primary education from 6 to 5.
26
12
15
18
22
24
29
31
Age

77Georgia: Education Sector Policy Reviewresponsible for administering school leaving examinations, teacher certification examinations andinternational assessments of learning outcomes. The National Center for Educational QualityEnhancement (NCEQE) is responsible for authorization and quality control of educationalinstitutions. The National Center for Teachers Professional Development Center (NCTPDC) setsteacher standards, certification requirements, and administers professional development programs.The Central Education Management Information System (EMIS) collects data on general educationand is responsible for ICT infrastructure development in the sector. School Infrastructure is managedby the National Agency for the Development of Education and Science Infrastructure.
Figure 2: Institutions involved in Georgia's education sector governance

78Georgia: Education Sector Policy ReviewFigure 3: Organizational Chart of the Ministry of Education and Science

79Georgia: Education Sector Policy ReviewAnnex 2: Statistical InformationBox 1
PolandIn 2012, Poland was among the top performers across the whole world in the PISA survey, which assesses15-years-old students. Poland’s average score (across reading, mathematics and science) was 520 points,above both the OECD average and also that of most countries in the EU. It is also more than 40 pointsabove the country’s average score in 2000, when PISA’s first wave was conducted. This unprecedentedleap in education quality is equivalent to the knowledge acquired in one extra year of education.In 1989, when Poland started its transition towards a market economy, no one could have predicted itwould become one of the greatest examples of successful education reforms. Prior to that, the system hadbeen focused on preparing youth for jobs. Vocational education was considered a safe, stable path to life-long employment, in particular for the disadvantaged. Students were streamed into different types ofschools at the age of 14 or 15 (after 8 years of general education). The track was defined by a stringentplacement exam and the streams were (i) two-year basic vocational schools run by sector industries, (ii)two-year technical schools, or (iii) three-year general secondary lyceum. After 1989, many of the industriesstopped funding vocational schools, as a result of which some vocational schools were converted ingeneral or technical schools. Moreover, in the 1990s the importance of teaching basic, general skills hadalready been recognized and a four-year technical lyceum, that included general and technical education,was introduced.In the late 1990s, a concerted effort to promote structural reforms led to a major education reform. Itsobjectives were to: (i) increase secondary and higher education qualifications, (ii) ensure equal educationopportunities and (iii) improve the quality of education. In order to accomplish these goals, the structure ofthe education system was changed to ensure that students would attend at least 9 years of general education(6 years in primary and 3 years in lower secondary) before being streamed into 3 additional years ofacademic or vocational education. This provided all students with an additional year of academic studies.In addition, a new core curriculum for lower secondary education was introduced to raise the level ofeducation and expectations (previously, most students were expected to go to basic vocational education).Curricular standards were set at the national level, but curriculum development was decentralized to thelocal level, engaging teachers and helping to change the teaching philosophy and culture of schools.Finally, an accountability system to monitor results was put in place. External examinations at the end ofprimary, lower secondary and upper secondary education were introduced.
The results are impressive and came about quickly. Poland’s PISA score jumped from an average of 479 to497 between 2000 and 2003(The students tested in 2000 had already been streamed in different types ofschools while after that most students were still in lower secondary). Very importantly, the results were notconcentrated among the top performers although they also improved. In 2003, 21.4 percent of the Polishhad not acquired the basic mathematical skills by the age of 15. In 2012, this figure had dropped to 13.8percent. At the same time, only 8.1 percent were considered top performers in 2003 while 15.4 percentreached that level in 2012.The story of Poland provides an invaluable example of how smart reforms, if well implemented, can leadto positive outcomes in the medium term.
Source: page 224 of OECD (2011), Lessons from PISA for the United States, Strong Performers and Successful Reformers inEducation, OECD Publishing.

80Georgia: Education Sector Policy ReviewTable 1: Students’ performance in PISA 2009+ by school location and family characteristics
Source: Team calculations based on PISA 2009 Results
Figure 1: Evolution of Net Enrolment Rate in Pre-School Education
Source: UNICEF estimates based on official sources (IHS by Geostat NCAC, MoES and TransmonEE2012 database)
Population characteristics Mathematics Reading ScienceSchool's legal status
Private school 435 435 424Public School 376 371 370
School LocationVillage 355 347 353Town 377 364 371Small City 387 386 380City 391 385 385Tbilisi 404 402 389
Number of Books at Home0-10 Books at home 324 319 332201-500 Books at home 427 426 414
Parents' highest education attainmentNone of the parents with higher education 362 356 358Both parents with higher education 422 420 419
National average 380 374 373
44.60%
28.30%
33.70%37.20%
39.50%39.70%38.70%35.90%36.90%
38.50%42%
4%
0%
5%
10%
15%
20%
25%
30%
35%
40%
45%
50%
PrivatePublic

81Georgia: Education Sector Policy ReviewTable 2: Preschool Enrollment Gaps by Regions from 2003 to 2012
RegionsGross Enrolment Rate (%)
2003 2006 2009 2012RegionsSamtskhe and Javakheti 8 14 28 31Achara 14 14 47 50Lower Qartli 12 23 42 43Mtskheta and Tianeti 20 27 65 71Imereti, Racha and Lechkhumi 22 18 62 67Samegrelo and Upper Svaneti 23 34 71 67Kakheti 18 21 55 75Inner Qartli 13 11 26 44Guria 7 12 39 63Tbilisi 26 35 55 77Total 19 23 52 63
Source: The World Bank Poverty Assessment in Georgia based on the national Integrated Household Survey. Teamestimates based on the National Integrated Household Survey of 2009, 2010, 2011, and 2012.
Table 3: Average tuition fee as a share of GDP per capita at public and private Higher EducationInstitutions in the countries charging tuition fees
Selected countriesPublic
institutions
Governmentdependent private
institutions
Independentprivate
institutions
Australia 12 25Netherlands 4United Kingdom 13United States 13 48New Zealand 11 15Austria 2 2 1-30Norway 9Iceland 8-22 27-41Belgium (Fr.) 2 2France 1-4 3-24 3-24Ireland 8-27Italy 4 14Mexico 37Poland 11-14Portugal 5 21Slovak Republic 12Spain 3Switzerland 2 17Japan 13 21Korea 20 35Kazakhstan* 33 27 -271Georgia 37 37-200Source: Salmi and Andguladze, 2011

82Georgia: Education Sector Policy ReviewTable 4: Breakdown of employed students by workloadBreakdown by workload per week %
20 hours and less a week 18.821-40 hours 23.741-60 hours 45.6More than 60 hours 5.1Depends on a period (season) 6.9
Source: IHS 2012
Table 5: Income structure for public and independent HEIs: Share (%) of various funding sources in theuniversity budget
Funding sourcesT
bilis
i (Iv
. Dja
vakh
ishv
ili)
Stat
eU
nive
rsity
Stat
e M
edic
al U
nive
rsity
Geo
rgia
n T
echn
ical
Uni
vers
ity
Ilia
Sta
te U
nive
rsity
Kut
aisi
(T
sere
teli)
Sta
te U
nive
rsity
Btu
mi (
Rus
tave
li) S
tate
Uni
vers
ity
Sokh
umi S
tate
Uni
vers
ity
Gor
i sta
te U
nive
rsity
Stat
e C
onse
rvat
ory
Akh
alts
ikhe
Sta
te U
nive
rsity
Inst
itute
of
Dra
ma
and
The
atre
State lump sum funding 10 5 0 12 3 19 0 2
98 12
3
State Excellence stipends for students 1 0 1 1 1 1 0 0
National Research Foundation 4 1 2 5 4 4 0 0
State student grant 2955 94
16 10 7 1170 90
Tuition from individual students 29 47 81 56 66
2
88Research contracts, services, rent, interest 10
21
4 10 4 2 1 0 7
Research grants from bilateral and multilateralagencies
7 010
0 1 0 0 0 0
Other international grants 1 0 0 0 0 0 0
Surplus from previous year 9 18 0 0 0 11 20 27 0 0
Total revenues in GEL (million) 58.3 31.9 31.4 29.4 13.1 11.1 5.5 4.9 3.5 2.1 1.5
Source: Salmi and Andguladze, 2011
Table 6: Teacher pay scheme in GEL (monthly wages)
QualificationLess than 5 years
Between 5and 10years
More than10 years
General education 290 303 308Vocational education 325 339 343BA 360 374 378MA 395 409 413Masters 430 444 448AdditionalsMulti-grade 31Georgian culture, language, history 31Head teacher 76Certification 75ICT 125Certification (excellent scores) and ICT 1000 per month
Source: MoES, 2013

83Georgia: Education Sector Policy Review
Annex 3: Review of Higher Education Financing Options andAccountability Instruments
Financing Mechanisms
After identifying its main policy objectives (access, equity, quality, labor market relevance, etc.) forGeorgia’s higher education system, the Ministry of Education and Science should reassess how itscurrent funding model fits or aligns with those objectives. Specifically, the MoES may want toconsider diversifying its financing methods to serve as policy instruments to help steer the highereducation sector towards the national priorities in higher education. The table below shows differentfinancing mechanisms, none of which are mutually exclusive) that could be used, for example, tofacilitate research and innovation, improve the quality of teaching and learning, facilitate knowledgetransfer, and make universities more socially inclusive. These financing instruments are:
Competitive grants: Well-designed competitive funds can greatly stimulate the performance ofhigher education institutions and can be powerful vehicles for their transformation and innovation– all while still respecting the diverse profiles of institutions within the system. Competitive fundsare typically established for the purposes of improving quality and relevance, promotinginnovation, and fostering better management. 61 Competitive grants can be used to facilitateresearch and innovation and improve the quality of teaching and learning. According to Salmi andHauptmann, one way of improving quality through competitive research grants is to use qualityimprovement as a criterion in evaluating proposals and selecting recipients. In Georgia,competitive grants can also be used to encourage cooperation between more resourcefuluniversities in Tbilisi with universities in the regions, or cooperation with foreign universities todevelop and deliver joint programs and conduct joint research.
Priority based funding formula: The traditional way for funding relevance occurs when centralbodies determine which programs to fund based on their determination of relevance. The Ministryintroduced priority based funding in 2013: priority programs identified by the Ministry receivestate funding based on the number of students enrolled. This financing instrument can be effectivein increasing the relevance of TE programs. Together with priority fields (such as engineering,education, etc), the government could use the funding instrument to increase the attractiveness oftertiary level type B programs. However, identification of priority programs should be based onvalid criteria and reliable labor market data.
Performance contracts: This financing mechanism is aimed to articulate explicitly the agreementbetween the government and universities. The mutually-agreed upon contract details theexpectations (degrees awarded, research output, etc.) the government has for the institutionreceiving state funding. While there may be financial incentives for exceeding expectations, thereshould also be financial penalties for failing to meet expectations. This funding instrument can beused together with competitive grants to reward the universities with high performance onresearch and innovation or knowledge transfer.
Needs based grants are used to remove financial barrier for poor students. Currently Georgiaprovides partial and full needs based grants for some 4 percent of the student population. Existingpoverty assessment infrastructure provides a good opportunity for Georgia to identify the targetpopulation: potential beneficiaries can apply for assessing their need and based on the assessment,students will become eligible for the means tested state grant.
Subsidized student loans: The experience with student loans has been mixed. Some student loanschemes have been successful in meeting its goals and also maintaining high repayment andrecovery rations. Georgia has the experience of offering subsidized student loans. In 2008, the
61Salmi and Hauptman, 2006

84Georgia: Education Sector Policy ReviewGovernment introduced “Tsodnis Kari” program. The program offered subsidized student loansfor Georgian citizens to study in graduate programs abroad. The program awarded 54 loansthrough five commercial banks. The recovery rate of the loans has not been investigated and it ishard to judge about the effectiveness of the program. The issue of subsidized loans needs to befurther investigated in terms its potential for lifting financial budget for some groups of students.Traditionally, student loans schemes were designed for poor students. In Georgia, however,subsidized student loans can also be targeted towards non-poor students enrolled in programs thathave potentially high individual rate of return. This way the scheme will target the students whoare more likely to be able to pay for the loans after graduation.
Portable student grants: the principle of portability is to give students the freedom to take thegrant or scholarship to the institutions of his/her choice. This has indirect impact on the quality ofteaching and learning because it gives the students the voting power in favor of the universitiesthat offer better quality education. Georgia’s student grants scheme is based on this principal.However, in order for the principal to be realized, applicants and students should have reliableinformation on the quality of teaching and learning in Georgian universities.
Merit based scholarships: The scholarships that reward students for good performance atuniversity have positive effect on students’ engagement in education. Georgia introduced merit-based scholarships in 2009. Students are ranked according to GPA and the students with thehighest GPAs receive scholarships. Unlike merit based grants, merit based universities administerthe scholarships: the Ministry distributes a certain amount among universities based on the size oftheir undergraduate student population. However, this instrument is effective only if students’learning is assessed in a reliable and objective way and motivates students to perform well. Thisaspect of the Georgian merit based scholarships needs further investigation. Embedding thescholarship recipients’ success in the labor market and further education as well as students’attitudes towards the university policy in awarding the scholarships as indicators in TEaccountability instrument would help inform universities and improve their assessment practices.
Table 1: Financial Mechanisms by Strategic PrioritiesStrategic Priority Financing Mechanism Enabling ConditionsImproving Qualityof Teaching andLearning
Merit based studentscholarships based on studentachievement during theirperformance in a university
Competitive research grants
- TEI accountability mechanismmeasuring the quality of teaching andlearning
ImprovingRelevance:graduates meetlabor market needs
Priority-based fundingformulaPerformance based contracts
- TEI accountability mechanismmeasuring TEI graduate employmentrelated indicators
- Labor market information system toidentify and project labor market needs
Increasing Researchand InnovationCapacity:
Competitive grantsPerformance contracts
- TEI accountability mechanismmeasuring TEIs by research andknowledge transfer indicators
Increase equity andaccess: increase theshare oftraditionallyunderrepresentedgroups
Needs based grantsStudent loans
- Reliable and transparent mechanism toassess need
- Reliable labor studies to projectstudents’ employment chances andsalaries after graduation
Source: The authors’ adaptation based on Salmi and Hauptman, 2006

85Georgia: Education Sector Policy Review
Accountability Instruments
Accountability mechanisms that are developed through consensus among the major stakeholders andare concentrated on measuring HEIs according their outcomes can serve as the major driver for theimprovement of the quality, equity, effectiveness, efficiency, and relevance of HEIs. The HEIoutcome indicators should be related to the role the TE system should play in national development.The indicators should be built and modified with participation of stakeholders and the performance ofhigher education institutions should be measured by an independent agency.Recently developed European classification and ranking instruments provide a very good example forGeorgia as well as the opportunity to join this initiative. In 2005, researchers at the Center for HigherEducation Policy Studies (CHEPS) piloted their first European classification of tertiary educationinstitutions – the U-MAP, which groups universities in homogenous groups according to indicators in6 dimensions. In 2010, U-Multirank was developed which ranks universities according 5 of the 6 U-MAP’s dimension indicators. U-Multirank ranks universities according to the following indicatorsunder the dimensions of teaching and learning, research, knowledge transfer, regional engagementand general indicators such as percentage of online programs, size of an institution etc.
Joining U-Multirank initiative would serve multiple purposes for diverse audiences - HEIs, students,employers, policy-makers, and researchers - in the following way:
Higher Education Institutions will be better able to develop and communicate their missions,to show their profiles to stakeholders and to engage more effectively in partnerships,benchmarking and networking.
Students will be better able to identify their preferred higher education institutions and makebetter choices regarding their study programs and labor market perspectives.
Business and industry: the classification reveals which types of institutions are of particularinterest for them, facilitating easier creation of mutual partnerships and stronger relationships.
Policy-makers in governmental and other contexts will benefit from a deeper insight intoinstitutional diversity. National and European policies for higher education cannot be basedon a ‘one size fits all’ approach. Instead, policies need to be attuned to diversity in such a waythat they can be made to work most effectively.
Researchers and analysts: A classification serves as a methodological tool for researchers. Itwill provide analysts and other experts with more insight into institutional diversity bothmethodologically and analytically which will assist them in policy analyses, internationalcomparative studies, and institutional benchmarking studies (van Vaught et al 2010).
Table 2: U-Multirank Dimensions and IndicatorsDimension Indicators
Teaching and Leaning
Expenditure on teaching(%)
Percentage of expenditure on teaching
Graduate Students (%) Percentage of graduate & post graduate students (master and beyond)
Scope Degree of comprehensiveness/specialization measured by the number ofbroad subject areas offered
Level of study Degree levels at which the institution awards degrees
Broad Subject Area Broad fields of study in which the institution offers programs
Research
Expenditure on Research Percentage of expenditure on research
Professional ResearchPublications
Number of professional publications (self-reported data)
Academic researchpublications
Number of research publications (bibliometric data)

86Georgia: Education Sector Policy ReviewKnowledge Transfer
Income from PrivateSources
Percentage of income from private sources
Patent Publications Number of patent applications
International OrientationIncome from InternationalSources
Percentage of income from foreign sources
Foreign degree seekingstudents
Percentage of degree seeking students with foreign qualifying diplomas
Regional Engagement
Income from RegionalSources
Percentage of income from regional sources
New entrants from theregion
Percentage of first year students from the region
General
Size of an institution Number of students (head count)
Legal Status Legal status of the institution
Age of an Institution Foundation year of the institution or its oldest constituent part
Percentage of OnlinePrograms
Online programs as a percentage of all degree programs
Source: www.u-multirank.eu
U-Map and U-Multrirank choose universities as data providers. The reason, as the authors explain(2010), is that international databases comprising comparable data at the institutional level do notexist or cover only a very limited part of the data needed. In many countries national databases existbut they are not comprehensive and, even more importantly, are seldom disaggregated to theinstitutional level, which makes their use problematic. This implies that the higher educationinstitution is the central source of information for the classification tool (CHEPS, 2010).
The main instrument to collect data from the higher education institutions is the on-line questionnairefor higher education institutions. The questions in the new version of the U-Map questionnaire areorganized around seven sections.
General information: name and contact; public/private character and age of the institution Students: numbers; modes and age; international Graduates: level of degrees awarded; subjects; orientation; graduates in the region Staff data: FTE and headcount; international Income: total; sources of income Expenditure: total; by cost center; use of full cost accounting Research and knowledge exchange: publications; patents; concerts and exhibitions; start-ups
Together with the U-Multirank indicators, Georgia should use other indicators that are essential inmeasuring HEIs effectiveness, efficiency, relevance and equity. These indicators may include theshare of various vulnerable groups in an institution, student engagement index, students’ engagementin research, graduate employment and graduate satisfaction indicators etc. (see table 3).

87Georgia: Education Sector Policy Review
Table 3: Sample Additional Dimensions for an External Results Based Accountability Mechanism inGeorgia
Dimension Description Data SourceAdmissions Data from institutions on number of new
students by program and program type, placeof origin (intl/domestic), prior education, etc
Institutions
Social Inclusion Data on socio-economic, ethnic, disabilitybackgrounds, etc. of new students
Government survey
Professoriate Data on rank, pay & qualifications of staff InstitutionsInstitutional finances Data on income from various sources
(government, students, other), plusexpenditures by type (academic salaries, non-academic salaries, IT, etc)
Institutions
Studentengagement/financialsurvey
Survey data from student which describe thequality and extent of their engagement andexperiences, as well as questions aboutincome and expenditure
Mandatory institution-al surveys, withgovernment support
Attrition data Data on students enrolled in previous yr whodid not return & students newly enrolled whowere previously at another institution
Institutional data
Graduation data Number of graduates by program/field ofstudy
Institutional
Graduate Survey Following up on graduates 24 months aftergraduation to examine questions ofemployment, income, further education plans,satisfaction, etc.
Mandatory institution-al surveys, withgovernment support
Employers survey Survey of employers to ask about satisfactionwith recent graduates, whether skills areimproving or worsening, areas forimprovement
Mandatory institution-al surveys, withgovernment support

88Georgia: Education Sector Policy Review
ReferencesBregvadze, T. Machabeli G. and Abkhazava R. 2011. Private Tutoring in Georgia. Available from
www.eppm.org
Cedefop (2008). Terminology of European education and training policy: a selection of 100 keyterms. Luxembourg: Publications Office of the European Union. Available from Internet:
Darling-Hammond, L. & Bransford, J. (2006). Preparing teachers for a changing world: Whatteachers should learn and be able to do. San Francisco: Jossey-Bass. Sikula, J. (Ed.). (1996).Handbook of research on teacher education. New York: Simon & Schuster.
Dewey, J. (1965). The relation of theory to practice in education. In M. Borrowman (Ed.), Teachereducation in America: A documentary history (pp. 140–171). New York: Teachers CollegePress.
Education Council (2009). Council conclusions of 12 May 2009 on a strategic framework forEuropean cooperation in education and training (ET 2020). Brussels: Education Council.
Education for All. Global Monitoring Report 2012. Retrieved fromhttp://www.unesco.org/new/fileadmin/MULTIMEDIA/HQ/ED/pdf/gmr2012-report-edi.pdf
Educational and Scientific Infrastructure Development Agency (2013). Awarding the best students.http://www.esida.ge/programebi.html?lang=ka
European Commission (2001): Making a European Area of Lifelong Learning a Reality, Com-mission Communication, COM(2001) 678 final.
European Commission/EACEA/Eurydice (2013). Key Data on Teachers and School Leaders inEurope. 2013 Edition, Eurydice Report. Luxembourg: Publications Office of the EuropeanUnion.
European Training Foundation. "Strategy for Reform on Vocational Education and Training (2009-2012). Georgia. Report on Main Outputs and Outstanding Challanges."http://mes.gov.ge/content.php?id=4336&lang=geo, November 2012.
European Training Fund (2012). Strategy for reform of vocational education and training (2009-2012), Report on main outputs and outstanding challenges, Turin, Italy.
European Union. 2008. “Recommendation of the European Parliament and of the Council of 23 April2008 on the Establishment of the European Qualifications Framework for LifelongLearning.” Official Journal of the European Union C (111): 1–7.
Fullan, M. (2010), All Systems Go: The Imperative for Whole System Reform, Corwin Press,Thousand Oaks, Canada Ontario
Gallimore R, B.E Ermeling, W.M. Saunders, C. Goldenberg (2009) The Elementary School Journal.Volume 109, Number 5. The University of Chicago.
Government of Georgia 2013. Socioeconomic Strategy 2020. Draft Document

89Georgia: Education Sector Policy ReviewGreen, F., Ashton, D., James, D., & Sung, J. (1999). The Role of the State in Skill Formation:
Evidence from the Republic of Korea, Singapore, and Taiwan. Oxford Review of EconomicPolicy , 82-96.
Grossman, P., Hammerness, K., McDonald, M. (2009). Redefining teacher: Re-imagining teachereducation. Teachers and teaching: Theory and practice, 15(2), 273-290.
Herczynski, Jan and Durglishvili, Sergo. 2011. School Vouchers in Georgia: Implementation of aSimple Idea in a Complex Environment. Reforming Education Finance in TransitionCountries. Six Case Studies in Per Capita Financing Systems.
Ingvarson, Lawrence, John Schwille, Maria Teresa Tatto, Glenn Rowley, Ray Peck and Sharon L.Senk. 2013.The analysis of teacher education context structure and quality-assurancearrangements in TEDS-M countries.http://www.iea.nl/fileadmin/user_upload/Publications/Electronic_versions/TEDS-M_Findings.pdf
Institute of Social Research and Analysis -ISSA. 2012. Teacher Supply-Demand Analysis. TeacherProfessional Development Center. http://www.tpdc.ge/uploads/pdf_documents/DATA-BASE%20Analysis.pdf Issue 4: Investing in Better Education
Juan Diego Alonzo and Alonzo Sanches, Editors. Washington DC: The international Bank forReconstruction and Development/The World Bank
Law of Georgia on General Education. http://laws.codexserver.com/ (10.03.14)
Little, J. (1982). Norms for collegiality and experimentation: Workplace conditions of school success.American Educational Research Journal, 19(3), 325–340.
Little, J., & McLaughlin, M. (Eds.). (1993). Teachers’ work: Individuals, colleagues, and contexts.New York: Teachers College Press.
Little, Judith Warren (2003) Inside Teacher Community: Representations of Classroom Practice.Teachers College Record Volume 105, Number 6, August 2003, გვ. 913-945 TeachersCollege, Columbia University
McKinsey & Company, How the World’s Most Improved School Systems Keep Getting Better, 2010.
Ministry of Education and Science of Georgia. 2005. Ministerial Decree # 576. Tbilisi
Ministry of Education and Science of Georgia. 2008. Teacher’s Standard.http://www.tpdc.ge/?action=page&p_id=100&lang=geo
Ministry of Education and Science of Georgia. 2011. National Curriculum, 2011-2016.
National Center for Educational Quality Enhancement (2013). Annual Report.http://eqe.ge/geo/about/annual_accounts
National Examination and Assessment Center. 2014. Teacher Certification in Georgia.Background Report. Prepared for the World Bank NAEC Capacity Building Project
Network of Education Policy Centers, 2014. Mapping teacher policies in the NEPCregions: comparative study of teacher policies in 10 countries. Presented at a policy lab inBaku, May 21.

90Georgia: Education Sector Policy ReviewOECD (2011). The Impact of the 1999 Education Reform in Poland, OECD Education Working
Papers, No. 49, OECD Publishing.
OECD (2013). Education at a Glance 2013: OECD Indicators, OECD Publishing.
Open Society Institute. 2010. Drawing the Line: Parental informal payments for education acrossEurasia
Parliament of Georgia. 2005. Law of Georgia on General Education.
Policy Advocacy and Civil Society Development in Georgia (2013). School Education: Descriptionand Analysis of Current Situation. Tbilisi: Open Society Institute
Policy Advocacy and Civil Society Development in Georgia (2013). Concept of School Education.Tbilisi: Open Society Institute
Rutkowski, Jan. Workforce Skills in the Eyes of Employers. World Bank, 2013.
Salmi, Jamil, and Natia Andguladze. Tertiary Education Governance and Financing in Georgia.Draft Policy Report, Tbilisi: World Bank, 2011
Salmi, Jamil. "The Growing Accountability Agenda in Tertiary Education: Progress or MixedBlessing?" Education Working Paper Serries, January 2009.
Sharvashidze, Gia. New Trends in Higher Education: Private Education in Georgia.http://unesdoc.unesco.org/images/0014/001405/140561e.pdf, Tbilisi: UNESCO, 2005.
State Audit Office. "Professional Education in Georgia: Ongoing Reforms and Challanges."http://sao.ge/audit/audit-reports/performance-audit, Tbilisi, 2013.
Tabatadze, Sh. Giorgi Sordia, Mamuka Komakhia, Giorgi Mshvenieradze and Giorgi Amariani .2013. Assessment of Tolerance and Civil Integration National Concept and 2009-2014 ActionPlan
The Government of Georgia. 2005. Law of Georgia on General Education.http://laws.codexserver.com/
UNDP. n.d. National MDG Targets and Indicators . Retrieved fromhttp://old.undp.org.ge/index.php?sec_id=65&lang_id=ENG#sthash.B6rKnZ3A.dpuf .
UNICEF (2012). The Well-Being of Children and their Families in Georgia: Georgia WelfareMonitoring Survey Second Stage 2011, University of York.
UNICEF: Comprehensive Costing and Finance Strategies for the Early Learning System in Georgia,Tbilisi 2013s
vanVught, F.A. Kaiser, F.File, J.M. Gaethgens, C. Peter, R. Westerheijden, D.F. (2010) TheEuropean Classification of Tertiary education Institutions. Retrieved from http://www.u-map.org/U-MAP_report.pdf
World Bank. 2009. Georgia - Poverty assessment. Washington, DC: World Bank.http://documents.worldbank.org/curated/en/2009/04/10503390/georgia-poverty-assessment

91Georgia: Education Sector Policy ReviewWorld Bank. 2013. Georgia: Skills Mismatch and Unemployment, Labor Market Challenges.
Washington, DC. World Bank. https://openknowledge.worldbank.org/handle/10986/15985
World Bank. 2013. Public Expenditure on a frontline: Strategic Issues and Reform Agenda
World Bank. Georgia - Poverty assessment.http://documents.worldbank.org/curated/en/2009/04/10503390/georgia-poverty-assessment,Washington, DC: World Bank, 2009.


