46
Georgia Private Sector Financing And The Role Of Risk-bearing Instruments November 2013

GeorgiaPrivate Sector Financing
And The Role Of Risk-bearing InstrumentsNovember 2013


Private Sector Financing In The Eastern Partnership Countries And The Role Of Risk‐bearing Instruments
Country report: Georgia November 2013
BFC Max-Högger-Strasse 6 Phone: +41 44 784 22 22 [email protected] CH-8048 Zurich, Switzerland Fax: +41 44 784 23 23 www.bfconsulting.com

EPTATF VISIBILITY
"The present study was commissioned by the European Investment Bank (EIB). The study is financed under the Eastern Partnership Technical Assistance Trust Fund, EPTATF. This Fund, which was established in 2010, to provide TA for investment projects (pre‐feasibility studies and feasibility studies, institutional and legal appraisals, environmental and social impact assessments, project management and borrower support), develop local capacity as well as financing upstream studies and horizontal activities. It focuses on the four priority sectors energy, environment, transport and telecommunication with climate change and urban development as cross‐cutting issues.”
DISCLAIMER
"The authors take full responsibility for the contents of this report. The opinions expressed do not necessarily reflect the view of the European Investment Bank. "
Table of contents List of Acronyms ............................................................................................................................ 4
About this report ........................................................................................................................... 1
1. Executive summary .................................................................................................................... 2
2. Macroeconomic environment .................................................................................................... 3
2.1 Economic development and growth.......................................................................................................... 3
2.2 The structure of the economy ................................................................................................................... 4
2.3 Inflation and asset prices .......................................................................................................................... 5
2.4 Balance of payments ................................................................................................................................. 5
2.5 The fiscal and political situation ................................................................................................................ 6
3. Financial sector overview ........................................................................................................... 7
3.1 Financial sector overview .......................................................................................................................... 7
3.2 Banking sector .......................................................................................................................................... 7
3.3 Microfinance sector ................................................................................................................................ 11
3.4 Private equity and venture capital .......................................................................................................... 12
3.5 Other financial sector institutions ........................................................................................................... 13
4. Demand analysis ....................................................................................................................... 15
4.1 Size and growth of the segment .............................................................................................................. 15
4.2 Characteristics of SMEs ........................................................................................................................... 16
4.3 Performance ........................................................................................................................................... 17
4.4 Institutional and regulatory issues .......................................................................................................... 18
4.5 Innovation ............................................................................................................................................... 19
4.6 Demand for finance ................................................................................................................................ 20
5. Supply analysis .......................................................................................................................... 23
5.1 Number and type of intermediaries ........................................................................................................ 23
5.2 Type of funding instruments ................................................................................................................... 24
5.3 Characteristics of funding recipients ....................................................................................................... 24
5.4 Institutional and regulatory issues .......................................................................................................... 25
5.5 Funding of intermediaries ....................................................................................................................... 26
5.6 Supply estimate ...................................................................................................................................... 26
6. Gaps in private sector financing ................................................................................................ 28
6.1 Gaps by instrument ................................................................................................................................. 28
6.2 Gaps by type of SME ............................................................................................................................... 28
6.3 Gaps in funding of intermediaries ........................................................................................................... 29
6.4 Potential and capability of IFIs to fill gaps ............................................................................................... 29
Annex 1: Macroeconomic indicators ............................................................................................. 31
Annex 2: Financial sector indicators .............................................................................................. 32
Annex 3: Prudential ratios for banks ............................................................................................. 33
Annex 4: Key banking regulations ................................................................................................. 34
Annex 5: List of largest financial institutions ................................................................................. 36
Annex 6: Prospects of the large enterprise sector ......................................................................... 37

LIST OF ACRONYMS
ADB Asian Development Bank
ADF Agriculture Development Fund
BFC Business & Finance Consulting GmbH
BoG Bank of Georgia, the largest bank in the country
BSTDB Black Sea Trade and Development Bank
CAR Capital adequacy ratio
CGF Caucasus Growth Fund
DFI Development finance institution
EBRD European Bank for Reconstruction and Development
EU European Union
FDI Foreign Direct Investment
GDP Gross Domestic Product
GeoStat Statistics Georgia
GRDF Georgia Regional Development Fund
ICT Information and Communication Technology
IFC International Finance Corporation
IFI International Financial Institution
IMF International Monetary Fund
LIBOR London Interbank Offered Rate
MFI Microfinance Institution
MSME Micro, Small and Medium Enterprise
NBG National Bank of Georgia, the central bank
NPL Non‐performing loan
OECD Organisation for Economic Cooperation and Development
PAR Portfolio at risk
ROA Return on assets
ROAA Return on average assets
ROAE Return on average equity
ROE Return on equity
SEAF Small Enterprise Assistance Funds
SME Small and Medium Enterprise
US United States
USA United States of America
USAID United States Agency for International Development
VAT Value added tax
YE Year end
End of period exchange rates used in this report
June 30, 2013
2012 2011 2010 2009 2008
USD/EUR 1.30 1.32 1.29 1.33 1.43 1.41
GEL /EUR 2.16 2.18 2.16 2.35 2.42 2.36 Sources: NBG, Oanda.com

EIB: PRIVATE SECTOR FINANCING IN THE EASTERN PARTNERSHIP COUNTRIES AND THE ROLE OF RISK‐BEARING INSTRUMENTS
Country Report: Georgia Page 1
ABOUT THIS REPORT
This report is one of a series of reports produced by Business & Finance Consulting GmbH (BFC) for European Investment Bank (EIB) as part of the project “Private Sector Financing In The Eastern Partnership Countries And The Role Of Risk‐bearing Instruments.” The series of reports includes individual country reports on Armenia, Azerbaijan, Georgia, Moldova, and Ukraine, as well as a synthesis report which considers the results from all five countries. The purpose of the project is to assess the financing needs of SMEs in the Eastern Partnership countries and identify market failures that prevent the development of the SME sector. The project was carried out from June 3, 2013 to November 1, 2013 by a team of four experts from BFC. Onsite visits were conducted for each country in order to meet with representatives from financial institutions, development institutions, the government, and other relevant actors who can comment on the SME sector and its access to finance. The visit to Georgia took place from July 1 to July 5, 2013, during which time meetings were held with representatives from 21 organizations, including 15 local financial institutions, four international development institutions, one government body, and one business association. The authors take full responsibility for the contents of this report. The opinions expressed do not necessarily reflect the view of the European Investment Bank.

EIB: PRIVATE SECTOR FINANCING IN THE EASTERN PARTNERSHIP COUNTRIES AND THE ROLE OF RISK‐BEARING INSTRUMENTS
Country Report: Georgia Page 2
1. EXECUTIVE SUMMARY
Georgia is a true success story, by regional and global standards, making great strides economically since the Rose Revolution in 2003. Under the Saakashvili administration, Georgia saw a steep decline in corruption and a vastly improved business environment, paving the way for a thriving private sector, including healthy growth among SMEs, specifically. Accordingly, FDI inflows have been strong, contributing greatly to near‐consistent GDP growth with the exception of 2009, due to the country’s 2008 war with Russia coupled with the global financial crisis. Georgia’s economy, while still strong, is in a temporary lull during the transition to a parliamentary system under new Prime Minister Ivanishvili. With this transition has come economic uncertainty, driving a slowdown in economic activity and a shifting of political priorities. Georgia’s financial sector is dominated by the banking sector, which accounts for 95% of financial sector assets. Even within the banking sector there is a high level of concentration, with two banks holding over 70% of banking sector assets. Despite this concentration, SMEs are relatively well served by the financial sector, with the majority of banks naming SMEs as a priority business line, dedicating entire departments and dedicated loan officers to such clients. That said, the diversity of financial products for SMEs is lacking, with the majority of SME finance comprised of working capital or term loans. Products such as factoring, leases and risk capital are scarce for various reasons, a lack of funding and outright demand for the products chief among them. While Georgia lacks both a nationally accepted definition of an “SME” as well as a government body charged with pro‐SME policy development, the sector continues to grow, bolstered by a supportive regulatory environment in which a company can be established quickly and cheaply through a one‐stop‐shop system. Nevertheless, while SMEs dominate the business landscape by number of entities, they continue to lag in terms of contribution to employment, total business turnover and value added. SMEs are highly concentrated in the trade & services sector, as well as in manufacturing and real estate and related activities. Just over half of SMEs are located in or around Tbilisi. The most evident financing gap for SMEs is the lack of long term local currency funds, especially at affordable prices. This gap originates directly from a lack of such funding at the wholesale level, a gap which has not begun to be addressed in the market. Commercial banks report very little supply of LCs and guarantees to SMEs, with noticeably higher volumes for guarantees than for LCs; most of the trade finance supply is allocated to large enterprises. Latent demand for other financial products, namely leases and risk capital, is also pervasive. Providers of both such products remain limited, and insufficient financial literacy in Georgia means that SMEs are not fully aware of the benefits of either type of product.

EIB: PRIVATE SECTOR FINANCING IN THE EASTERN PARTNERSHIP COUNTRIES AND THE ROLE OF RISK‐BEARING INSTRUMENTS
Country Report: Georgia Page 3
2. MACROECONOMIC ENVIRONMENT
Conclusion: In general, Georgia’s economy has seen very strong growth over the past decade, interrupted only by the country’s 2008 war with Russia and the uncertainty resulting from the October 2012 elections. Key findings:
While GDP growth will likely not reach pre‐Rose Revolution levels, it remained strong from 2010 to 2012 and is expected to increase in 2014
Georgia consistently runs large negative current account and trade balances, due to high FDI inflows and a Russia‐imposed ban on wine and agricultural imports in 2006
The country is currently in a period of high economic and political uncertainty following the October 2012 elections, resulting in a change from a presidential to parliamentary system under businessman Bidzina Ivanishvili
Overall macroeconomic conditions are favorable to SMEs, despite the recent slowdown resulting from temporary political and economic uncertainty. Future growth is expected to come from sectors in which SMEs have a large presence, such as trade, services and tourism. The new government’s pro‐agriculture stance will help bolster small and medium‐scale players along the agriculture value chain. And reforms under the Saakashvili administration drastically reduced corruption and the pervasiveness of the informal economy, paving the way for SMEs to thrive. Key macroeconomic indicators for the country are presented in Annex 1.
2.1 Economic development and growth
Georgia’s economy has made great strides in the past decade following the 2003 Rose Revolution, making it a true success story. The country saw especially strong growth between 2003 and the country’s war with Russia in August 2008. During this period, real GDP growth averaged about 10%, going up to 12.3% in 2007, driven largely by high levels of foreign direct investment (FDI).1 Growth dropped dramatically following the war, turning negative in 2009 to ‐3.8%. Post‐war growth has been considerable, rebounding in 2010 when GDP increased by 6.3%, driven mainly by the manufacturing, financial intermediation and trade sectors. Growth remained steady in 2012, at 6.1%, with most of the expansion occurring in the first three quarters of the year before the October elections and ensuing political uncertainty. The construction and manufacturing sectors, bolstered by state‐financed infrastructure projects,2 drove the expansion in 2012, as did trade and services, sectors in which SMEs are highly active. GDP growth for 2013 was previously estimated at 6.0% by the National Bank of Georgia (NBG, the central bank) and the IMF, but has since been revised downward to 4.0%.3 The downward revision was due mainly to poor growth in the first half of the year. Growth is expected to come from the agriculture and manufacturing sectors as well as continued growth in trade and tourism, sectors in
1 Source: http://www.imf.org/external/pubs/ft/scr/2008/cr08328.pdf 2 Source: NBG Inflation Report, February 2013 3 Source: http://www.imf.org/external/np/ms/2013/061013.htm

EIB: PRIVATE SECTOR FINANCING IN THE EASTERN PARTNERSHIP COUNTRIES AND THE ROLE OF RISK‐BEARING INSTRUMENTS
Country Report: Georgia Page 4
which SMEs predominantly operate. According to the IMF, high growth (8%, annualized) is expected in H2 2013.4 In absolute terms, the Georgian economy is small at EUR 12.0 billion in 2012, and GDP per capita was relatively low at EUR 2,6635 (Armenia EUR 2,482, Azerbaijan EUR 5,523).6 With strong economic growth has come increased income inequality. Georgia had a Gini coefficient of 46% in 2011, up from a more equal 37.1% in 1996, making it the 35th most unequal country in the world,7 on par with the US with a coefficient of 45.0%.8 The poverty rate, as defined as the percent of the population receiving subsistence allowance from the government, has increased in recent years from 8.4% in 2008 to 9.7% in 2012. The incidence of extreme poverty, according to the World Bank’s definition of USD 1.25 per day, was 5.8% in 2010, the highest rate among the Eastern Partnership countries. According to the IMF, the numerous economic reforms implemented during the Saakashvili administration were accompanied by very little increase in employment. The official unemployment rate was 15% as of YE12, although this excludes the high level of underemployed in agriculture.9
2.2 The structure of the economy
The country’s main economic activities include trade, transport & communication, manufacturing, and agriculture. In 2012, the largest contributor to GDP was the retail and wholesale trade sector, making up 14.3% of the total (2011: 14.6%). Likewise, retail and wholesale trade dominates the SME sector, with 37.8% of SMEs operating in the sector as of Q2 2013. Transport & communication made up another 9.1% of the economy as a whole, or 4.3% of SMEs. Manufacturing made up 9.0% and agriculture made up 7.2%, or 9.8% and 1.0% of SMEs,10 respectively. In the long term, for the economy as a whole, trade, tourism, manufacturing and construction are expected be the main drivers of sustained growth. The growth in trade, especially, will bolster the SME sector, as will growth in tourism, made up of small restaurants and hotels. Given the new government’s pro‐agriculture stance, there will likely also be growth in this sector, where already much of the country’s population is either unemployed or underemployed. Growth in the number of SMEs will be visible in this sector, if not by output. State owned enterprises play a minimal role in the economy following privatization in the immediate post‐Soviet era; they now account for 0.7% of total enterprises and 7.5% to total business output. While the informal economy still exists, despite regulatory reforms to reduce the number of informal businesses over the past decade, it is not pervasive enough to undercut more formalized SMEs. From the World Bank’s Enterprise Surveys, 27.6% identified practices of competitors in the informal sector as a major constraint, although this has likely declined since 2008 when the surveys were completed in Georgia.
4 Source: http://uk.reuters.com/article/2013/06/11/uk‐georgia‐economy‐imf‐idUKBRE95A0U720130611 5 Source: GeoStat; GEL/EUR exchange rate from National Bank of Georgia (NBG). 6 Armenia and Azerbaijan are as of 2011 (2012 data not yet available). 7 Source: https://www.cia.gov/library/publications/the‐world‐factbook/geos/gg.html 8 Source: https://www.cia.gov/library/publications/the‐world‐factbook/geos/us.html As of 2007, as this is the latest data available 9 Source: http://www.imf.org/external/np/ms/2013/061013.htm 10 Source: GeoStat
EIB: PRIVATE SECTOR FINANCING IN THE EASTERN PARTNERSHIP COUNTRIES AND THE ROLE OF RISK‐BEARING INSTRUMENTS
Country Report: Georgia Page 5
2.3 Inflation and asset prices
Inflation has been volatile over the past five years, with a high of 11.2% observed in 2010 and deflation of ‐1.4% in 2012. The IMF attributes the recent deflation to the lagged effects of exchange rate appreciation, lower food and energy prices and the slowdown in domestic demand. Inflation in 2013 has remained below the NBG’s medium‐term target of 6.0%, with some deflation in the first half of the year following declining food and fuel prices.11 In response, the NBG lowered its policy rate from 8% in mid‐2011 to 4.25% in H1 2013 to spur greater lending and consumption. Despite this decrease, credit growth actually slowed down in the first quarter of 2013. Eventually SMEs should benefit from the lowered policy rate as the period of uncertainty ends and banks start to extend credit more readily, at lower prices and for longer maturities. Following a real estate boom in the pre‐war period, prices appear to be rising again with the real estate sector one of the fastest growing sectors of the economy, attracting much FDI. There is likely to be some trickle‐down effect for SMEs, many of which operate in the “real estate, renting and business activities” sector.
2.4 Balance of payments
Georgia consistently runs a negative current account balance and trade balance, equivalent to 11.4% and 34.6% of GDP, respectively, in 2012. Large capital inflows and central bank intervention have helped to prevent exchange rate depreciation, which has benefited SMEs borrowing in dollars.12 The trade deficit worsened slightly in 2012 due to increasing capital goods imports but may see some improvement under the new government, which has focused efforts on repairing trade relations with Russia. In 2006 Russia placed a trade embargo on wine and agricultural product imports, which was lifted on wine and mineral water in February 2013. Previously Russia accounted for 70% of Georgia’s wine exports, and the ban had a considerable effect on the country’s economy.13 In general, Georgia’s liberal investment environment and equal rights for local and foreign investors make it an attractive destination for FDI,14 with most of the inflows coming from EU countries.15 FDI increased considerably in the pre‐war lead up, growing at compound annual growth rate of 42.7% between 2003 and 2008, and peaking in 2007 at EUR 1.5 billion.16 This growth was particularly due to two large pipeline projects and privatization. The post‐war period has seen a drop in FDI, with a declining investment in the pipelines coupled with struggling EU economies, although there are signs of recovery. FDI reached EUR 655 million in 2012,17 with the largest share of the funds (22.2% of total FDI) going to the manufacturing sector and another 19.8% to the energy sector. Other sectors that benefit considerably from FDI include the financial sector (18.0%) and transportation & communication (17.2%).18 SMEs in particular have benefited from FDI through various financial intermediaries with international shareholdings and strong social missions, such as funds that invest in SMEs, foreign‐owned microfinance institutions that lend to SMEs and commercial banks with foreign ownership.
11 Source: NBG Inflation Report, February 2013 12 Source: http://www.imf.org/external/np/ms/2013/061013.htm 13 Source: http://www.ft.com/cms/s/0/13269432‐6ee9‐11e2‐9ded‐00144feab49a.html#axzz2Yj1VOTsk 14 Source: http://en.wikipedia.org/wiki/Economy_of_Georgia_(country) 15 Georgia is rated BB‐ by both Fitch and S&P and Ba3 by Moody’s. 16 Source: OECD Eastern Partner Countries SME Policy Index 2012 17 Source: GeoStat Database 18 Source: http://www.conservapedia.com/Republic_of_Georgia

EIB: PRIVATE SECTOR FINANCING IN THE EASTERN PARTNERSHIP COUNTRIES AND THE ROLE OF RISK‐BEARING INSTRUMENTS
Country Report: Georgia Page 6
Georgia’s economy is highly dollarized, with the majority of bank credit being extended in dollars. As of June 2013, the country’s dollarization ratio was 58.4%, down from 60.4% at YE12. This level of dollarization has a direct effect on SMEs, for much of their debt is in dollars while their revenues are in local currency, exposing them to high unhedged currency risk.
2.5 The fiscal and political situation
The country’s fiscal balance has been negative since 2008 but achieved sustainable levels of ‐0.9% of GDP in 2011 and ‐1.4% in 2012. The latest amendment to the Georgian constitution caps public expenditure, the budget deficit and outstanding government debt at 30%, 3% and 60% of GDP, respectively, starting in 2014, in line with the convergence criteria of the Euro zone. While Georgia aspires to join the EU, membership is not likely in the foreseeable future.19 External government debt to GDP was 16.2% in 2012, up from 10.9% in 2008. Following over a decade of mal‐equipped leadership and historically weak institutions, a legacy of the Soviet era, the 2003 Rose Revolution ushered in a new period of widespread economic success, led by President Mikhail Saakashvili. Early in his administration, Saakashvili instituted several broad‐based anti‐corruption measures, one of the most inadvertently pro‐SME measures of the past decade. Under Saakashvili, institutions improved greatly as did the business environment in general, as discussed later.20 These strides forward paved the way for a thriving SME sector, as evidenced by a 213.4% increase in registered businesses between 2004 and 2011.21 Saakashvili’s second and final term ends in September 2013, at which point Georgia will transition from a presidential to a parliamentary political system under Prime Minister Bidzina Ivanishvili. In anticipation of this transition, the country has faced increased economic and political instability, already apparent during the October 2012 parliamentary elections. This instability has led to enormous uncertainty across all sectors of the economy, especially apparent in the slowdown in credit extended as well as decreased demand for credit from SMEs.
19 Source: http://www.dw.de/who‐is‐where‐on‐the‐path‐to‐eu‐membership/a‐16748597 20 Source: IFAIR: Georgia’s Transformation: Before and After the Rose Revolution; June 20, 2012 21 Source: Statistical Yearbook of Georgia, 2012

EIB: PRIVATE SECTOR FINANCING IN THE EASTERN PARTNERSHIP COUNTRIES AND THE ROLE OF RISK‐BEARING INSTRUMENTS
Country Report: Georgia Page 7
3. FINANCIAL SECTOR OVERVIEW
Conclusion: The Georgian financial sector is dominated by banks, which hold about 95% of total financial sector assets. Key findings:
The banking sector is comprised of 20 commercial banks, 19 of which are foreign controlled
Commercial banks are generally very well capitalized and were in a period of high liquidity in mid‐2013
Remaining financial sector players include microfinance institutions, leasing companies, credit unions, insurance companies, pension funds, exchange bureaus, the stock exchange and a very small amount of risk capital
3.1 Financial sector overview
Georgia’s financial sector is overwhelmingly dominated by the 20 commercial banks, with other players making up only 5% of financial sector assets. In addition, financial intermediation remains low in comparison with OECD countries, with total bank assets under 60% of GDP. The banking sector itself is highly concentrated, with two banks holding 72.1% of total banking sector assets as of YE12. Capital levels are generally high, with a sector‐wide capital adequacy ratio (CAR) of 17.0%, and the banks are especially liquid during this period of political and economic uncertainty. Profitability, on the other hand, has been somewhat volatile, as has asset quality. The microfinance and credit union sectors are fairly well developed, serving niche customers, while the leasing sector is highly constrained by lack of access to funds. Risk capital in Georgia is minimal. Number of financial institutions by type
Type of institution Q2 2013 2012 2011 2010 2009
Banks 20 19 19 19 19
Microfinance institutions 63 62 62 49 38
Non‐bank deposit institutions 18 18 18 18 18
Exchange bureaus 1,030 1,029 1,500 1,624 1,352
Insurance companies 14 15 15 16 14
Pension funds 6 6 7 6 6
Stock exchanges 1 1 1 1 1Source: National Bank of Georgia
3.2 Banking sector
3.2.1 Structure
Number of banks: The Georgian banking sector is made up of 20 commercial banks, up from 19 at the end of 2012. Pasha Bank, a subsidiary of an Azeri bank, is the newest entrant into the Georgian banking sector, receiving its license in January 2013. Prior to Pasha Bank’s entrance into the market, the number of players had remained mostly steady over the past five years at 19. One microfinance institution, FINCA, is currently applying for a banking license, which will bring the total number of banks to 21. No other changes are expected by the NBG, with no plans for immediate consolidation despite the presence of some very small players.

EIB: PRIVATE SECTOR FINANCING IN THE EASTERN PARTNERSHIP COUNTRIES AND THE ROLE OF RISK‐BEARING INSTRUMENTS
Country Report: Georgia Page 8
Ownership: Of the country’s 20 banks, 19 are foreign controlled, including three which are branches of foreign institutions. The only Georgian owned bank is Progress Bank, a Tier 3 bank holding 0.1% of total banking sector assets as of YE12.22 There are no state‐owned banks, as they were all privatized in the immediate post‐Soviet era. Several IFIs hold ownership stakes in Georgian banks. For instance, the EBRD, IFC, FMO and DEG jointly own 57% of TBC Bank. The EBRD also has a 3.3% stake in Basis Bank, down from 15% in 2008.
Q2 2013 2012 2011 2010 2009
Number of banks 20 19 19 19 19
Number of bank branches23 838 833 708 641 633
Bank assets (EUR billions) 6.9* 6.1 5.3 4.0 3.4Source: GeoStat, *As of May 2013
Growth: Total bank assets grew 16.8% in 2012, a slowdown from 23.1% in 2011 due to the transitional political environment prompting both decreased demand for credit as well as the banks’ decreased appetite for risk. Bank assets also grew at a compound annual growth rate of 13.1% between 2007 and 2012, to reach EUR 6.1 billion by YE12. Growth continued apace in the first two quarters of 2013 to reach EUR 6.9 billion, making up 57.6% of 2012 GDP, up from 46.9% in 2011. Bank assets make up nearly 95% of the financial sector’s total assets. Concentration: Georgia’s banking sector is highly concentrated, with two banks dominating the sector: Bank of Georgia (BoG), holding 42.9% of total banking sector assets at YE12, and TBC Bank holding 29.2%. Both banks have benefited substantially from foreign support, including IFI funding, over the past decade, allowing them to grow to what they are today. BoG is listed on the London Stock Exchange and owned by a broadly diversified investor community. As well as holding the largest share of banking sector assets, it also held 36.0% of total sector gross loans as of YE12. TBC is majority owned by four IFIs (IFC, EBRD, FMO, DEG), but its Georgian founders still maintain considerable shares and influence. Including the microfinance subsidiary Bank Constanta, TBC held 29.0% of sector gross loans. TBC Group’s network of 105 branches at YE12 ranks third, just more than half the size of BoG’s, but almost twice as vast as any tier 2 bank. Tier 2 players include ProCredit Bank (7.9% of sector assets), Liberty Bank (6.3%), Bank Republic (6.0%) and VTB Georgia (4.1%). The balance of sector assets was spread among 14 tier 3 banks, among which the most active lenders and deposit takers are TaoPrivat Bank, KORStandard Bank and Cartu Bank. All tier 1 and 2 players have majority foreign ownership.
3.2.2 Performance
The Georgian banking sector emerged from the financial crisis mostly unscathed due to high levels of capitalization and on‐going support from IFIs. The sector continues to be well capitalized and soundly managed, adhering to conservative prudential ratios established and enforced by the NBG. That said, some indicators have been quite volatile as a result of general economic instability over the past five years. Capital Adequacy: Overall Georgian banks are very well capitalized, with a sector‐wide total CAR of 17.0% at YE12, down slightly from 17.1% at YE11. Both are quite high compared to the NBG’s minimum of 12.0%. The tier 1 capital ratio was 13.4% at YE12, down from 11.3% a year ago and well above the NBG minimum of 8.0%.
22 Progress Bank’s beneficial owner is the current Minister of Energy, with the Prime Minister holding another 21.7%. 23 Including service centers

EIB: PRIVATE SECTOR FINANCING IN THE EASTERN PARTNERSHIP COUNTRIES AND THE ROLE OF RISK‐BEARING INSTRUMENTS
Country Report: Georgia Page 9
Profitability: Profitability of the banking sector has been quite volatile over the past five years, with key indicators varying widely. ROAA and ROAE were a rather low 1.4% and 8.6%, respectively, in 2012, due largely to high impairment charges on corporate loan portfolios following political change in late 2012 and an ensuing shift in government priorities. These figures are down substantially from a year earlier when they were a high 3.5% and 20.6%, respectively. Indicators were negative in 2009 following the downturn in the economy that year, with ROAA of ‐0.8% and ROAE of ‐4.1%. Interest rates are rather high, although spreads have decreased lately and are expected to continue the downward trend. Liquidity: The sector’s loan to deposit ratio has remained consistently above 100% (2012: 114.2%, 2011: 114.7%), indicative of Georgian banks’ dependence on borrowings, especially from IFIs (above all EBRD) and commercial lenders, such as Commerzbank. Meanwhile, liquid assets to total assets was a high 27.3% at YE12, up from 21.3% at YE11 following low credit demand in Q4 2012. Likewise, liquid assets covered 47.6% of total deposits at YE12, up from 36.1% a year earlier. Customer deposits have seen uneven growth over the past five years, at 16.7% in 2012, down from a high of 36.6% in 2010. That said, deposit growth has outpaced loan growth consistently over the past four years, leading to an improved liquidity position for the sector. As of July 2013, all banks were decreasing their deposit rates due to their exceptionally high level of liquidity. Credit Risk: After suffering some decrease in asset quality during the financial crisis, Georgian banks have seen an improvement in portfolio quality, with loans 90 or more days overdue at 3.7% of gross loans as of YE12, down from 4.5% at YE11 and from a high 6.3% at YE09.24 This ratio increased to 4.5% as of Q1 2013, reflecting the general state of the economy. The non‐performing loan ratio, which takes into account collateral coverage, borrower capitalization, and various qualitative factors, stood at a high 9.3% as of YE12, with a 1.5 percentage point increase in the fourth quarter alone, following the elections. This growth was mainly in the FX denominated loans25 and loans for large infrastructure projects, a result of the NBG’s requirement to reclassify loans that would be affected by the new government’s intention to scrutinize these projects. By February 2013, many of the companies that had previously held such contracts had in fact lost them. Market and Other Risk: Altogether FX assets, liabilities, commitments and contingencies are broadly matched. The banking sector’s on‐balance net open currency position represented 3.0% of aggregate regulatory capital at YE12, and 3.3% including off‐balance sheet items. Despite a rather stably managed exchange rate, the population prefers to save in hard currency. Hence, most bank assets and liabilities continue to be denominated in USD rather than the local currency (GEL). The NBG puts a very high risk weighting on FX‐denominated loans of 175%, 100% of which is to cover credit risk and 75% is to cover currency risk. Despite this high risk rating, banks continue to lend primarily in USD because of their funding sources. There are very few hedging mechanisms available, with the most mentioned one being a Dutch currency exchange fund, TCX. The cost of this mechanism, however, is very expensive.
3.2.3 Regulation and state support
The Georgian banking sector is regulated by the NBG, an independent body, largely under the Law of Georgia on Activities of Commercial Banks, adopted in 1996. This legal act contains a range of provisions, including prudential norms, corporate governance standards, reporting standards and bank licensing rules.
24 Source: http://elibrary‐data.imf.org/Report.aspx?Report=4160276&Country=915 25 Source: NBG Inflation Report 2012

EIB: PRIVATE SECTOR FINANCING IN THE EASTERN PARTNERSHIP COUNTRIES AND THE ROLE OF RISK‐BEARING INSTRUMENTS
Country Report: Georgia Page 10
Capital Adequacy: Capital adequacy requirements are bank‐only and are based on Basel I with a market risk charge, but assign a higher risk weight to FX‐denominated loans (175%, 100% of which is ascribed to credit risk and 75% to currency risk). Moreover, all investments in subsidiaries must be subtracted from regulatory capital, as opposed to only investments in financial subsidiaries under the Basel accord. Reserve Requirements: Reserve requirements are set more for monetary than prudential purposes, and are higher on foreign currency deposits and other short‐term foreign currency borrowings (15%), compared to local currency obligations (10%). This policy is one of many NBG policies that promote de‐dollarization.26 The Georgian banking sector emerged from the twin crises of 2008/2009 relatively unscathed partly as a result of the countercyclical monetary and supervision policies of the NBG27 and the emergency liquidity support which it provided.28 The list of prudential ratios for banks applied by the central bank is presented in Annex 3. A short description of key regulations is presented in Annex 4.
3.2.4 Funding
Commercial banks are primarily funded by deposits, which made up 69.1% of total banking sector liabilities as of May 31, 2013 (YE12: 63.9%). More than half of banking sector deposits (54.9% as of May 31, 2013) were term deposits and a high 59.6% were in foreign currency,29 mostly USD. Borrowed funds made up a not insignificant 23.6% of liabilities as of the same date, with much of this funding coming from IFIs. The largest IFI funders include the EBRD, IFC and German state development bank KfW. Subordinated debt is a small but not uncommon source of funding for banks, with much of it coming from either shareholders, other related parties or IFIs, especially the IFC, EBRD, FMO and DEG. Much of the subordinated debt is convertible and is counted in Tier 2 capital. Deposits are an affordable source of funding for banks, with average rates on USD‐denominated deposits at 2.0% to 5.0% and in GEL at 6.0% to 9.0%. Deposit interest rates have decreased recently as banks are currently in a period of high liquidity. Interest rates on borrowings vary, but have an average of about 7.0% fixed or 3.0% to 5.0% plus LIBOR variable for foreign currency denominated loans, most of which are in USD. GEL‐denominated loans are much more expensive, up to 14.0%, and are almost always for less than two years. Overall there is an extreme shortage of long term GEL‐denominated loans, one of the key market failures given the high demand for such loans from SMEs. As of January 1, 2013, a very high 81.3% of all commercial bank loans to legal entities were in foreign currency, mostly USD. Banks have access to short term local currency funding from the NBG. The NBG currently has plans to offer longer term GEL‐denominated funding at a floating exchange rate, tied to the policy rate. The pool of money for such lending totals an estimated GEL 200 million (EUR 94.1 million) as of July 2013. There is also an NBG initiative to have the government issue treasury bills, depositing the proceeds long term with commercial banks in order to encourage long term GEL lending by banks.30
26 Source: http://www.standardandpoors.com/ratings/articles/en/us/?articleType=HTML&assetID=1245337203010 27 Source : http://www.mfa.gov.ge/index.php?lang_id=ENG&sec_id=648 28 Source : http://www.imf.org/external/pubs/ft/survey/so/2010/int010510a.htm 29 Source : http://www.nbg.gov.ge/uploads/publications/bulletinstatistics/statbiul/2013/bulletinjune2013_eng.pdf 30 Source: IMF, http://www.imf.org/external/np/ms/2013/061013.htm

EIB: PRIVATE SECTOR FINANCING IN THE EASTERN PARTNERSHIP COUNTRIES AND THE ROLE OF RISK‐BEARING INSTRUMENTS
Country Report: Georgia Page 11
Georgia does not have any state‐led guarantee schemes at the wholesale level. The only credit guarantee facilities have been developed by international financial institutions (IFIs), such as USAID’s Development Credit Authority, which guarantees up to 50% of loans from local or international financial institutions to local financial institutions on a pari passu basis. As of July 2013, AG Leasing and TBC Leasing both had access to such a guarantee. Likewise, in 2007/2008, KfW had a EUR 10.0 million credit guarantee fund that covered 90% of the credit risk on loans from international commercial banks to three local banks: BoG, TBC and Bank Republic. Through this fund, all three banks obtained loans from Commerzbank. They remain customers of Commerzbank today. At the sub‐loan level, the IFC reported a lack of interest in credit guarantee schemes from the commercial banks given their relatively low NPLs. Parent company funding is a meaningful source of funding in Georgia. For example, TBC Bank has received subordinated debt from most of its shareholders, most recently about EUR 11.0 million from FMO in December 2012. In December 2011 Liberty Bank raised EUR 7.7 million through a rights issue, mostly purchased by the bank’s majority shareholder, with some going to the minority shareholders. Cartu Bank had EUR 52.1 million in subordinated debt outstanding as of December 31, 2012, all of which was ultimately from the bank’s shareholders.
3.3 Microfinance sector
3.3.1 Structure
As of June 30, 2013 there were 63 registered MFIs operating in Georgia, up considerably from only 27 at YE08. Until recently the sector was highly underdeveloped with much unmet demand, where micro loans are roughly defined as those under USD 10,000 (EUR 7,500).31 The total number of MFIs exclude two entities, ProCredit and Constanta (a TBC subsidiary), that serve the microenterprise sector but are registered as commercial banks, allowing them to accept deposits from the public. According to 2013 data, MFIs in Georgia32 reached 221,705 borrowers (about 5% of the population) with an aggregate loan portfolio of EUR 624.8 million33 (5.2% of YE12 GDP).
3.3.2 Performance
MFIs in Georgia have exhibited high and improving profitability over the past 2 ½ years, driven by very high interest rates of up to 36% for shorter term (less than two years) micro loans. The interest rate decreases as the loan size increases, reaching a minimum interest rate of about 20%, still above commercial banks’ average rates. Given these high rates, the MFI sector achieved an ROE and ROA of 28.9% and 7.3%, respectively, in 2012, following a 73.5% increase in net profit that year. The sector is poised for similar levels of profitability in 2013, with annualized ROE and ROA of 31.6% and 8.0% as of Q2 2013.34 According to MixMarket, asset quality is mixed, with some MFIs having PAR>30 of more than 10%. Most, however, are under 4%.
3.3.3 Regulation
In general, the regulatory environment for MFIs is conducive to the development of the sector, with some exceptions. MFIs are regulated by the NBG under the Law of Georgia on Microfinance Organizations, adopted in 2006. Among other things, the law lays out approved activities for MFIs, which includes loans, money transfers, insurance services and other services such as micro leasing, factoring and foreign exchange, but excludes taking deposits from the public. The law also limits MFI
31 Estimate based on interviews with the three largest MFIs: FINCA, CREDO and Crystal. 32 Including ProCredit and Constanta 33 Source: Mix Market: http://www.mixmarket.org/mfi/country/Georgia 34 Source : NBG

EIB: PRIVATE SECTOR FINANCING IN THE EASTERN PARTNERSHIP COUNTRIES AND THE ROLE OF RISK‐BEARING INSTRUMENTS
Country Report: Georgia Page 12
loans to a single borrower to GEL 50,000 (EUR 22,900). These two factors limit the growth of individual MFIs. Paid in capital may not be less than GEL 25,000 (EUR 11,450).
3.3.4 Funding
Since MFIs are not allowed to mobilize deposits, they are solely dependent on external funding, especially funding from international markets. As of Q2 2013, 82.4% of the MFI sector’s funding was from senior loan borrowings, 60.5% of which was from international financial organizations.35 The remaining portion of funding came from subordinated liabilities and the MFIs’ own debt securities. Subordinated liabilities made up a small 4.7% of total funding, with only some larger MFIs reporting subordinated debt on their balance sheets. For instance, CREDO has subordinated debt from Triple Jump (interest rate of 12.5%), Deutsche Bank (11.65%) and KfW (11.0%). The larger MFIs reported an average cost of funds of 7% to 9%, in both fixed and floating rates, while smaller ones pay between 13% and 18% on borrowings. In general, the larger MFIs report easy access to short term USD denominated funds, with local currency funding being much harder to obtain.
3.4 Private equity and venture capital
3.4.1 Sector overview
Risk capital is still in the nascent stages in Georgia. In 2006, Millennium Challenge Georgia, a government entity, established the USD 30.0 million (EUR 22.7 million) Georgia Regional Development Fund (GRDF). This fund, registered in Delaware, USA as a limited liability company and managed by Small Enterprise Assistance Funds (SEAF), focuses on investments in SMEs. The fund is fully invested and is comprised mostly of debt with equity‐like features, and some convertible debt. As of July 2013 one company had been exited through refinancing, with a full exit planned for 2015. At its peak, the fund invested in a total of 14 companies. Under GRDF, “SMEs” were loosely defined as having annual turnover of less than USD 5.0 million (EUR 3.8 million) and fewer than 250 employees. The profits of the fund will be reinvested in educational scholarships. In March 2012 SEAF established the Caucasus Growth Fund (CGF) to invest in growth‐oriented SMEs (annual turnover of less than USD 50.0 million, or EUR 38.0 million) in Georgia, Armenia and Azerbaijan, with the majority of investments in Georgia, followed by Armenia. The ultimate fund size is expected to be USD 75.0 million with USD 48.0 million committed as of July 2013. Investors include SEAF itself as well as several IFIs (EBRD, IFC, FMO, and BSTDB). Also a limited liability company, CGF is registered in the Cayman Islands. Unlike GRDF, CGF will focus on straight equity investments in more established companies, with an average investment size of up to USD 6.0 million. The only other known entities making direct equity investments in Georgia are the IFC and EBRD, although their target investees do not necessarily qualify as SMEs. For instance, the IFC is about to invest in a Georgian hydropower company. BoG is also in the process of establishing an equity fund of an estimated USD 40.0 million (EUR 30.0 million) to invest in small hydropower projects.
3.4.2 Ecosystem
There is no government support system or programs for private equity or venture capital in Georgia. Both SEAF funds are accompanied by limited capacity building funds (USD 2.0 million for GRDF and even less for CGF, funded by the Development Bank of Austria), but no broad based programs, either publicly or privately funded, with considerable outreach. There are no known incubators or angel investor networks.
35 Source: National Bank of Georgia

EIB: PRIVATE SECTOR FINANCING IN THE EASTERN PARTNERSHIP COUNTRIES AND THE ROLE OF RISK‐BEARING INSTRUMENTS
Country Report: Georgia Page 13
3.4.3 Regulation
There is no specific law on investment funds, and no regulatory body, with reference only to such activities in the Tax and Civil Code of Georgia. According to the NBG, the government is now in the process of “normalizing” existing legislation to make it more familiar to international investors. Foreign funds, such as SEAF’s funds which are registered abroad, are not subject to local supervision and there is no restriction on repatriation of profits.
3.5 Other financial sector institutions
3.5.1 Leasing companies
The Georgian leasing sector originated in 2001 and remains underdeveloped today, with total assets of roughly EUR 45.0 million, less than 1.0% of GDP.36 To date, the sector has been restricted by both lack of access to funding and an adverse regulatory environment. The sector is dominated by two major players, both subsidiaries of the two largest banks: TBC Leasing (TBC Bank, 53.7% market share37) and Georgian Leasing Company (BoG, 40% to 45% market share). There is one smaller player with about 3% to 5% market share, Alliance Group Leasing, a daughter company of Alliance Group Holdings.38 The majority (90%) of leases are financial leases. Leasing companies are not directly regulated by the NBG or any other entity, and there are neither licensing nor minimum capital requirements to enter the sector.39 While leasing companies were previously subject to the 2002 Law on the Promotion of Leasing Activities, this law not only contradicted the civil code, it also had many provisions that undermined the sector as a whole, affecting the sector’s performance and level of non‐performing assets. This law was abolished in 2011, replaced that same year by leasing‐related amendments to the Tax and Civil Code, Law on Commercial Banks and Law on Bankruptcy.40 The new amendments, especially to the Tax and Civil Code, maintain contractual equality while also preventing abuses by either lessor or lessee that could result in unjust enrichment or gross disparities.41 Confiscatory tax issues were also done away with under the new legislation, a vast improvement for the sector. As a result of the previously poor legislation and high exposure to the construction sector, the Georgian leasing sector was severely hit by the 2008 financial crisis. During this time, total leasing companies’ assets were halved.42 Leasing companies are not allowed to accept deposits, and thus are funded almost exclusively through loans. Given the small size of the industry, with limited funding needs, Georgian leasing companies are largely overlooked by international commercial banks such as Deutsche Bank or Commerzbank43. Instead, leasing companies access funding through DFIs such as BSTDB, ResponsAbility and Symbiotics.44 One leasing company is currently exploring the option of issuing bonds. Ultimately, lack of access to funding is the largest bottleneck for the sector’s development.45
36 Source: OPIC: http://www.opic.gov/sites/default/files/files/Information%20Summary%20for%20Georgia%20Leasing%20Company.pdf 37 According to TBC Bank: http://www.tbcbank.ge/ir/?site‐lang=en&site‐path=about/business/ 38 Market share figures are estimates based on on‐site interview with TBC Leasing 39 Source: “Developing Leasing in Georgia,” USAID, May 23, 2012 40 Source: OECD Eastern Partner Countries SME Policy Index 2012 41 Source: “Developing Leasing in Georgia,” USAID, May 23, 2012 42 Source: http://www.georgianews.ge/business/6905‐leasing‐sectors‐breakthrough‐anticipation‐.html 43 See Confidental Annex for additional information. 44 Both sited by TBC Leasing as funders 45 Source: “Developing Leasing in Georgia,” USAID, May 23, 2012

EIB: PRIVATE SECTOR FINANCING IN THE EASTERN PARTNERSHIP COUNTRIES AND THE ROLE OF RISK‐BEARING INSTRUMENTS
Country Report: Georgia Page 14
3.5.2 Credit unions
There are 18 operating credit unions in Georgia, the total assets of which make up less than 0.1% of the Georgian financial sector. In general, credit unions are set up by the rural populations that then avail of their services. The NBG regulates the sector under the 2002 Law of Georgia on Non‐Bank Depository Institutions‐Credit Unions.46 Georgian credit unions are non‐profit and can perform basic banking functions for their members only. They are funded almost entirely through their deposit base, the bulk of which (94.7% as of 1Q13) are term deposits.
3.5.3 The stock exchange
The Georgian Stock Exchange was established in 1999 and as of September 1, 2013, 133 companies were traded on it, with total market capitalization of EUR 0.73 billion,47 or 6.0% of 2012 GDP. Daily turnover is low at about EUR 850. According to the NBG’s Deputy Governor, there is a move to make the stock exchange more active. In order for a company to list securities on the GSE it must meet certain minimum capital requirements, depending on the listing category (minimum of about EUR 46,000), and have been profitable for at least two years, among other requirements.48 Anecdotal evidence suggests that it is nowhere near common practice for SMEs to be listed on the GSE.
46 While MFIs are also non‐deposit taking institutions, they are regulated separately from credit unions 47 Source: http://www.gse.ge/Staff/staff.htm 48 Source: http://www.gse.ge/Rules/Admission%20of%20Securities%20to%20the%20Trading%20System%20of%20the%20Georgian%20Stock%20Exchange%20and%20Listing.pdf, Appendix 1

EIB: PRIVATE SECTOR FINANCING IN THE EASTERN PARTNERSHIP COUNTRIES AND THE ROLE OF RISK‐BEARING INSTRUMENTS
Country Report: Georgia Page 15
4. DEMAND ANALYSIS
Conclusion: The SME sector has benefited from improvements in the business climate over the past decade, resulting in strong growth and good financial performance on average, accompanied by increasing demand for funding. Key findings:
There are 48,100 active MSMEs in Georgia
MSMEs contribute about 40.9% of employment but only 17.4% of business turnover
Trade & services dominates the SME sector, with agriculture making up a very small portion by number
Overall the regulatory environment is very strong for SMEs, especially in terms of the ease of starting a business, which can be accomplished through a one‐stop‐shop
There remains considerable unmet demand for financing from SMEs, across all financial products
4.1 Size and growth of the segment
4.1.1 Size and definition of the sector
By number of companies, MSMEs49 comprise almost the entire business population, accounting for 94.0% of active businesses50 as of Q1 2013, down slightly from 96.0% in 2010.51 As of Q1 2013 there were 48,100 MSMEs, 42,478 of which were micro and small enterprises (88.3% of total MSMEs), and 5,622 medium enterprises. Number of active MSMEs in Georgia by year
Number of enterprises Q1 2013 2012 2011 2010 2009
Micro and small enterprises 42,478 45,672 48,255 37,073 32,260
Medium enterprises 5,622 5,660 6,214 3,807 3,839
Total 48,100 51,332 54,469 40,880 36,099Source: GeoStat
There is no single definition for SMEs used across all public and private institutions. The Law on Georgian National Investment Agency gives one, which is used for statistical purposes, and there is another, based on turnover only, used by the Tax Code of Georgia to give preferential treatment to smaller firms. All statistics quoted in this section utilize the first definition.
Micro Small Medium
Definition #1 – For statistics
Headcount n/a ≤ 20 employees 20‐100 employees
Annual turnover n/a ≤ GEL 500,000(EUR 230,000)
GEL 500,000‐1,500,000(EUR 230,000‐690,000)
Definition #2 – For tax purposes only
Headcount n/a n/a n/a
Annual Turnover ≤ GEL 30,000 ≤ GEL 100,000 n/a
49 GeoStat does not separate out microenterprises from SMEs 50 The data is for the number of active enterprises – the number of registered enterprises is much higher 51 Source: GeoStat

EIB: PRIVATE SECTOR FINANCING IN THE EASTERN PARTNERSHIP COUNTRIES AND THE ROLE OF RISK‐BEARING INSTRUMENTS
Country Report: Georgia Page 16
(EUR 13,800) (EUR 46,000)Source: “SME Policy Index: Eastern Partner countries” OECD, Law on Georgian National Investment Agency; Tax code of Georgia Consistent with the lack of a nationally accepted definition of SMEs, all financial institutions interviewed gave different internal definitions. For instance, commercial banks generally define SMEs by loan size and annual turnover, with SME loan sizes not exceeding GEL 1.5 million (EUR 706,000) at the high end, and on average closer to a maximum of EUR 375,000. By annual turnover, a secondary metric for most institutions, commercial banks’ definitions differ quite a bit with a maximum of EUR 7.5 million and an average of closer to EUR 3.75 million.
4.1.2 Importance of the sector
Despite the high proportion of MSMEs to total businesses, the contribution of MSMEs to employment, total business turnover and value added is relatively low. As of Q1 2013, MSMEs employed 40.9% of all registered tax payers, down from a high of 45.6% at YE11.52 MSMEs made up a small 17.4% of total business turnover at Q1 2013, down from a high of 19.9% at YE11, and contributed only 21.8% of value added at YE11. MSMEs, Contribution to total
% Q1 2013 2012 2011 2010 2009
Employment 40.9 43.5 45.6 43.6 42.4
Total business turnover 17.4 19.2 19.9 16.1 15.6
Value added n/a n/a 21.8 19.3 18.7 Source: GeoStat
MSMEs’ reported contribution to business output and employment may be understated due to the presence of informal enterprises and tax avoidance. The definition of SMEs, with an upper boundary of just 100 employees and turnover of less than EUR 1 million, also plays a role in the apparently low contribution to employment and turnover. If Georgia applied the EU definition of 250 employees and EUR 50 million in turnover, the economic contribution would naturally be much higher.
4.2 Characteristics of SMEs
Not uncommon to developing countries, MSMEs in Georgia are highly concentrated in the trade & services sector. As of Q1 2013, 37.8% of all MSMEs were in the sector labeled “trade, repair of vehicles, personal and household goods,” more than three times as many as any other sector. The next largest sector, by number of companies, was labeled “real estate, renting and business activities”, comprising 11.7% of all SMEs. Manufacturing made up another 9.8% and construction 6.7%. Agriculture, excluding small scale farmers, made up a mere 1.0% of MSMEs.53 Percent of total MSMEs by economic sector
% Q1 2013 2012 2011 2010 2009
Trade, repair of vehicles, personal and household goods
37.8 37.4 37.9 42.6 40.2
Real estate, renting and business activities
11.7 11.7 12.0 13.3 12.6
Manufacturing 9.8 9.9 10.3 14.6 17.1
52 Source: GeoStat 53 GeoStat’s data excludes small scale farmers, such as farming households

EIB: PRIVATE SECTOR FINANCING IN THE EASTERN PARTNERSHIP COUNTRIES AND THE ROLE OF RISK‐BEARING INSTRUMENTS
Country Report: Georgia Page 17
Construction 6.7 6.8 6.4 6.6 5.9
Hotels and restaurants 4.6 4.7 4.7 4.5 4.5
Other 29.4 29.5 28.7 18.4 19.7 Source: GeoStat
By employees, MSMEs dominated several sectors of the economy, including the agriculture sector (66.4% of all employees in the sector worked for MSMEs), fishing (100%), hotels and restaurants (67.8%), education (75.8%) and “real estate, renting and business activities” (73.2%). Meanwhile, large enterprises dominated the electricity, gas and water supply sector (97.4% of all employees) and transport and communications (81.4%). By total number of enterprises, the trade sector showed modest growth between 2007 and 2011 of 14.6%; the hotels and restaurants sector grew 21.8% over the same period of time and real estate a high 42.4%.54 By region, just over half (54.4%) of all MSMEs were located in Tbilisi as of Q1 2013, with the rest spread throughout the country. Large companies were much more concentrated in Tbilisi, with 68.9% of the total number based there as of Q1 2013.55 Percent of total MSMEs by region
% Q1 2013 2012 2011 2010 2009
Tbilisi 54.4 54.4 51.3 46.7 43.0
Rest of the country 45.6 45.6 48.7 53.3 57.0Source: GeoStat
4.3 Performance
The MSME sector has performed well over the past five years. Between 2008 and 2012, annual turnover of the sector achieved a 31.0% compound annual growth rate, with especially high growth in 2011. This is compared to 17.2% growth for the large enterprise sector. However, MSME turnover decreased by 2% in 2012 in connection with economic troubles in the fourth quarter. Sector wide net profit achieved a compound annual growth rate of 48.5% between 2008 and 2011, the latest year available, compared to only 21.9% for the large enterprise sector.56 Turnover and profit growth were driven by both high economic growth in general, with the exception of 2009, and a consistent increase in the number of SMEs. SMEs appear to have mostly weathered the 2009 recession well, with the exception of a decrease in net profit for medium enterprises in 2009. Total turnover, however, continued to grow and small enterprises achieved a 68.6% increase in net profit in 2009.57 Anecdotally, Georgian SMEs are not known for being growth oriented, lacking a strong appetite for internationalization of operations. In addition, competitive skill sets of entrepreneurs remain low, with very few opportunities – government or otherwise sponsored – for business or professional training. Regardless, the sector continues to grow, pulled along by the country’s strong economic growth and consistently increasing number of SME players.
54 Source: GeoStat 55 Source: GeoStat 56Source : GeoStat 57 Source : GeoStat
EIB: PRIVATE SECTOR FINANCING IN THE EASTERN PARTNERSHIP COUNTRIES AND THE ROLE OF RISK‐BEARING INSTRUMENTS
Country Report: Georgia Page 18
4.4 Institutional and regulatory issues
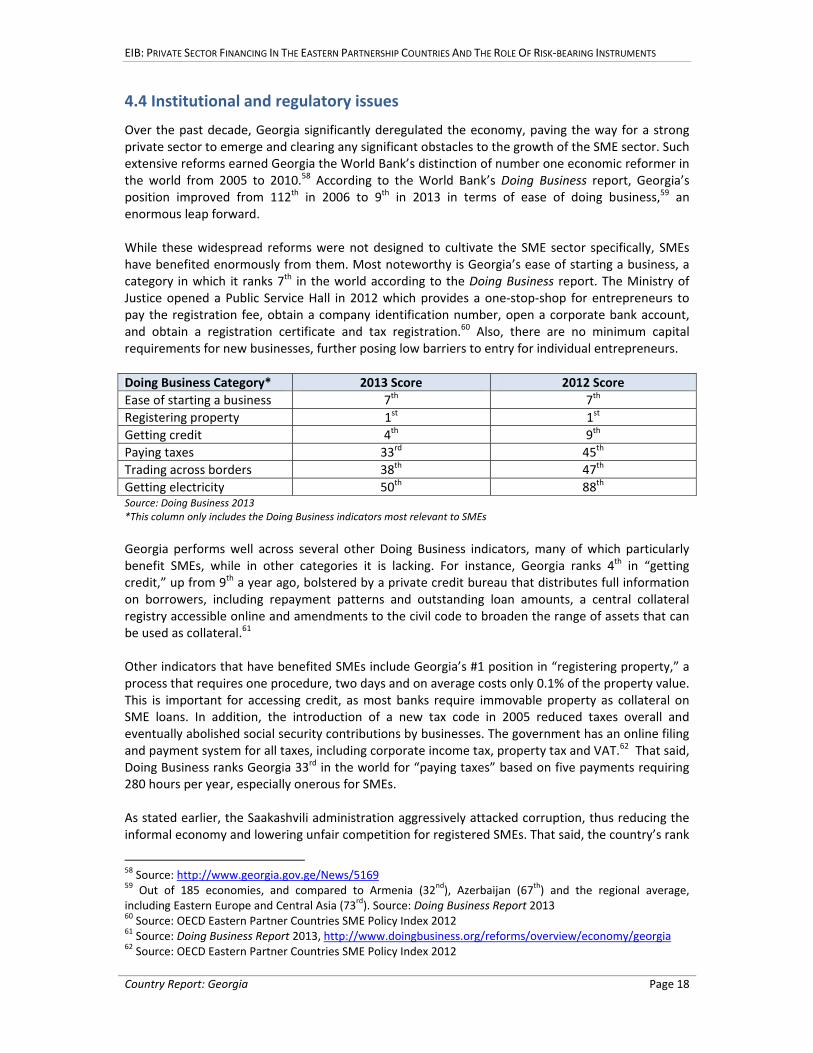
Over the past decade, Georgia significantly deregulated the economy, paving the way for a strong private sector to emerge and clearing any significant obstacles to the growth of the SME sector. Such extensive reforms earned Georgia the World Bank’s distinction of number one economic reformer in the world from 2005 to 2010.58 According to the World Bank’s Doing Business report, Georgia’s position improved from 112th in 2006 to 9th in 2013 in terms of ease of doing business,59 an enormous leap forward. While these widespread reforms were not designed to cultivate the SME sector specifically, SMEs have benefited enormously from them. Most noteworthy is Georgia’s ease of starting a business, a category in which it ranks 7th in the world according to the Doing Business report. The Ministry of Justice opened a Public Service Hall in 2012 which provides a one‐stop‐shop for entrepreneurs to pay the registration fee, obtain a company identification number, open a corporate bank account, and obtain a registration certificate and tax registration.60 Also, there are no minimum capital requirements for new businesses, further posing low barriers to entry for individual entrepreneurs.
Doing Business Category* 2013 Score 2012 Score
Ease of starting a business 7th 7th
Registering property 1st 1st
Getting credit 4th 9th
Paying taxes 33rd 45th
Trading across borders 38th 47th
Getting electricity 50th 88th Source: Doing Business 2013 *This column only includes the Doing Business indicators most relevant to SMEs
Georgia performs well across several other Doing Business indicators, many of which particularly benefit SMEs, while in other categories it is lacking. For instance, Georgia ranks 4th in “getting credit,” up from 9th a year ago, bolstered by a private credit bureau that distributes full information on borrowers, including repayment patterns and outstanding loan amounts, a central collateral registry accessible online and amendments to the civil code to broaden the range of assets that can be used as collateral.61 Other indicators that have benefited SMEs include Georgia’s #1 position in “registering property,” a process that requires one procedure, two days and on average costs only 0.1% of the property value. This is important for accessing credit, as most banks require immovable property as collateral on SME loans. In addition, the introduction of a new tax code in 2005 reduced taxes overall and eventually abolished social security contributions by businesses. The government has an online filing and payment system for all taxes, including corporate income tax, property tax and VAT.62 That said, Doing Business ranks Georgia 33rd in the world for “paying taxes” based on five payments requiring 280 hours per year, especially onerous for SMEs. As stated earlier, the Saakashvili administration aggressively attacked corruption, thus reducing the informal economy and lowering unfair competition for registered SMEs. That said, the country’s rank
58 Source: http://www.georgia.gov.ge/News/5169 59 Out of 185 economies, and compared to Armenia (32nd), Azerbaijan (67th) and the regional average, including Eastern Europe and Central Asia (73rd). Source: Doing Business Report 2013 60 Source: OECD Eastern Partner Countries SME Policy Index 2012 61 Source: Doing Business Report 2013, http://www.doingbusiness.org/reforms/overview/economy/georgia 62 Source: OECD Eastern Partner Countries SME Policy Index 2012

EIB: PRIVATE SECTOR FINANCING IN THE EASTERN PARTNERSHIP COUNTRIES AND THE ROLE OF RISK‐BEARING INSTRUMENTS
Country Report: Georgia Page 19
is 51st out of 176 economies in Transparency International’s Corruption Perception Index 2012 (up from 85th in 200263), leaving room for further improvement. This ranking is partially affected by an opaque government contracting system, mostly affecting larger enterprises. Regardless, Georgia’s rank is good compared to its neighbors: Armenia (105th) and Azerbaijan (139th). In terms of the OECD’s Small Business Act, Georgia was a top performer across most of the ten dimensions compared to the other Eastern Partner countries in 2012, including: entrepreneurial learning and women’s entrepreneurship,” “operational environment for SMEs,” “public procurement,” “access to finance for SMEs,” “enterprise skills,” and “internationalization of SMEs.” There is no ministry charged with pro‐SME policy making, and to date the government lacks an official SME strategy. The State Strategy for Regional Development of Georgia for 2010‐17 states its support for the development of competitiveness, innovation and entrepreneurship, although it is unclear to what extent this strategy will hold up under the new government. SMEs are likely to be featured in the economic development strategy currently being developed, but specific tools and techniques have not yet been laid out.
4.5 Innovation
The State Commission for Regional Development is responsible for the development of innovation policy in Georgia, and the Ministry of Economy and Sustainable Development is tasked with developing targeted initiatives to support innovative start‐ups. To date, however, there are no specific initiatives with the exception of the new agriculture fund. Furthermore, there is currently no comprehensive innovation strategy in Georgia,64 and most financial institutions interviewed did not have examples of innovative SMEs to cite. This is potentially due to the lack of an environment that truly fosters and rewards innovation. In addition, banks are typically risk averse enough to not finance pure start‐ups. Innovation is likely to be a feature of the government’s new economic development strategy, with a focus on human capital, education and technology transfer. There is currently much focus on Georgia’s burgeoning hydropower sector, attracting private FDI as well as involvement from several IFIs, including the IFC and EBRD.
Box 1: Example of an innovative SME Delta Comm Limited, based in Tbilisi, is one of Georgia’s main suppliers and service providers of ICT. In 2007 it began the construction of Georgia’s first underground fiber optic cable network that will provide reliable and affordable internet service throughout the country, thus addressing the shortcomings of the existing infrastructure. The company’s Georgia Optical Network Project (GONET) is the only network in Georgia that provides backup internet services and GPS mapping of the network system. In June 2009 Delta Comm Ltd was a recipient of mezzanine debt from SEAF’s Georgia Regional Development Fund. This financing allowed the company to rapidly develop GONET, moving through the research and planning stages and initiate construction of the cable all within the first year of investment.65
63 Source: http://www.economy.ge/uploads/meniu_publikaciebi/foreign/Economic_Outlook_ENG‐_2012.pdf 64 Source: OECD Eastern Partner Countries SME Policy Index 2012 65 Source: http://seaf.com/index.php?option=com_content&view=article&id=137&catid=29&Itemid=335&lang=en‐GB

EIB: PRIVATE SECTOR FINANCING IN THE EASTERN PARTNERSHIP COUNTRIES AND THE ROLE OF RISK‐BEARING INSTRUMENTS
Country Report: Georgia Page 20
4.6 Demand for finance
4.6.1 Overview
In general, banks and other financial sector players report that SMEs demand loans, with very little demand for non‐loan products, such as leases, factoring or risk capital. The main driver of low demand for non‐loan products may be more a reflection of a lack of understanding or awareness of these products than a lack of need. BoG in particular reports that small enterprises exhibit the highest demand for bank credit, over micro and medium enterprises.
4.6.2 Estimate of demand
Total demand for MSME loans is estimated at EUR 1.9 billion, which is equivalent to 15.9% of 2012 GDP and 47.5% of the outstanding loans of all financial institutions in Georgia at year‐end 2012. The calculation is made as follows: Calculation of demand for loans from MSMEs
Step in Calculation Value Source
A. Number of MSMEs 48,100 GeoStat
B. Average loan size demanded (EUR) 63,844 BFC survey of local lenders
C. % of enterprises needing a loan 61.7% World Bank Enterprise Surveys66
D. Total demand (EUR million) 1,894.7 = A * B * C
The demand estimate is only intended to give a general idea of the level of demand. The methodology of the calculation is simplistic and is based on a number of assumptions. The following points should be kept in mind:
The number of small and medium enterprises is based on Q1 2013 data provided by GeoStat. The data includes microenterprises, whereas the World Bank data is specifically for SMEs.
Since there is no available survey data on the loan size demanded from small and medium enterprises, the average loan size disbursed was used as a proxy for loan size demanded. The average loan sizes disbursed to small and medium enterprises are based on a survey of six commercial banks that provided detailed quantitative information on their MSME portfolios. The average disbursed loan size may somewhat underestimate the average demanded loan size, to the extent that financial institutions may be overly conservative in setting loan amounts.
Each bank uses a different definition of small and medium enterprises, which reduces the accuracy of the estimate.
The World Bank surveys were conducted from late 2008 to early 2009, and thus may not accurately reflect current demand conditions.
There is no reliable data which could be used to estimate the demand for non‐loan products, such as risk capital, leases and LCs.
4.6.3 By type of SME
The following table, taken from the World Bank Enterprise Survey conducted from late 2008 to early 2009, presents two indicators of demand for funding – the proportion of respondents not needing a loan and the proportion identifying access to financing as a main constraint – broken down by sector, enterprise size, and region.
66 The World Bank surveys report the % of enterprises not needing a loan, from which the percent of enterprises needing a loan is inferred as 100% minus the % not needing a loan.

EIB: PRIVATE SECTOR FINANCING IN THE EASTERN PARTNERSHIP COUNTRIES AND THE ROLE OF RISK‐BEARING INSTRUMENTS
Country Report: Georgia Page 21
Demand indicators by enterprise characteristics, based on World Bank Enterprise Survey
% not needing loan % identifying access to financing as a main
constraint
By sector:
Manufacturing 27.8 42.6
Retail 30.2 46.8
Other services 46.8 26.8
By enterprise size:
Small (5‐19 employees) 38.5 43.7
Medium (20‐99 employees) 44.4 19.8
Large (100+ employees) 14.4 31.5
By region:
Tbilisi 47.6 24.6
Kakheti 51.6 24.1
Shida Kartli 21.5 56.5
Imereti 22.0 64.9
Kvemo Kartli 21.3 43.9
Mmtskheta‐Mtianeti 70.7 12.9 Source: World Bank Enterprise Survey (2009)
Sector: Demand has followed the government’s priority sectors, to some extent. For instance, the construction sector had enormous demand for credit and other financial products, such as performance guarantees, under the Saakashvili administration given the focus on infrastructure projects during this time. More than any other sector, the retail sector identified access to finance as a main constraint. Going forward, growth in demand is expected to come from the agriculture and energy sectors. Banks expect to see continued demand from other sectors in which SMEs operate, namely trade & services and tourism. Size: Small enterprises identified access to finance as a main constraint, more than medium or large enterprises. Medium enterprises were the least in need of a loan, followed by small enterprises, both of which likely rely more heavily on their own internal funding for financing needs compared to large businesses. Region: Businesses in Tbilisi reported the highest proportion not needing a loan, perhaps because a higher proportion of them already have loans. Likewise, more enterprises in most regions outside of Tbilisi saw financing as a major constraint, as compared to those in Tbilisi. As the agriculture sector is developed, an increasing share of demand will come from rural areas. In addition, while branch penetration is relatively high on a per person basis (18.5 commercial bank branches per 100,000 people), banks, especially, still lack outreach to rural areas, a gap that MFIs are starting to fill. With 46.8%67 of the population and 54.8%68 of businesses in rural areas, there is likely still unmet demand in rural areas.
4.6.4 By instrument
Loans: Loans are by far the preferred source of funding for SMEs in Georgia, as they are the most familiar and also the most readily available. Interest rates on commercial bank loans are high, although not prohibitively high, with an average interest rate of about 14.5% on SME loans. On 67 As of January 1, 2013. Source: GeoStat 68 As of 2011, Source: Entrepreneurship in Georgia Report, 2012 (GeoStat)

EIB: PRIVATE SECTOR FINANCING IN THE EASTERN PARTNERSHIP COUNTRIES AND THE ROLE OF RISK‐BEARING INSTRUMENTS
Country Report: Georgia Page 22
average there is a 2% interest rate difference between USD and GEL denominated loans. For this reason, SMEs tend to take out USD‐denominated loans, despite having to also incur currency risk, as their revenues are very often in local currency with the exception of a small set of exporters. Banks admit, however, that if GEL denominated loans were available at lower rates, there would be more demand for such loans. Interest rates on loans from MFIs are higher than from banks, at 21% on average for SMEs and up to 36% for microenterprises. Leases: Demand for leases is much lower than demand for loans, and in most cases an SME will opt for a loan instead of a lease, for many reasons including greater familiarity with a loan product and also a lack of strong regulatory incentives to take out a lease, as discussed earlier. This may change as borrowers become more aware of leasing products available to them. In addition, as of a May 2012 report, leasing companies were requiring a 20% down payment on leased items, thus discouraging demand.69 With so few leasing companies operating in Georgia, there may not be enough competition among them to generate improved terms. Going forward, more competition leading to better terms would help to increase demand. Sectors with the most demand for leases include the medical sector, transportation, agriculture, construction and restaurants. Guarantees/letters of credit: Demand for guarantees and letters of credit is low in general, with banks reporting very low volumes of such products to SMEs. The main constraint to demand is a perceived lack of need for LCs – businesses have been engaging in trade successfully without the use of documentary operations in the past, and thus see little need to experiment with different financing formats. As with leasing, lack of familiarity with the products is another key factor. Equity and quasi‐equity: Based on anecdotal evidence, demand for equity and quasi‐equity from SMEs is low in Georgia, although according to SEAF it has improved since 2006. As a result of the limited number of equity funding sources, many entrepreneurs are still unaware that risk capital is available for formal institutions.
69 Source: “Developing Leasing in Georgia,” USAID, May 23, 2012

EIB: PRIVATE SECTOR FINANCING IN THE EASTERN PARTNERSHIP COUNTRIES AND THE ROLE OF RISK‐BEARING INSTRUMENTS
Country Report: Georgia Page 23
5. SUPPLY ANALYSIS
Conclusion: Commercial banks supply the majority of financing to SMEs, with leasing companies committed to the sector but highly limited by lack of access to funds. Key findings:
Commercial banks provide an estimated 75% of all funding to SMEs, with most funding in the form of a line of credit or term loan
There are very few government‐sponsored SME financing initiatives, with the exception of the new agriculture fund. There are no guarantee funds providing guarantees directly to SMEs, so the establish of such a fund by an IFI could be beneficial.
Banks prefer to lend to small and medium enterprises over micro enterprises, and focus primarily on the trade & services sector
Funding for commercial banks is plentiful with the exception of long term local currency funding; leasing companies suffer from lack of funding in any currency
5.1 Number and type of intermediaries
Banks: Commercial banks are by far the foremost providers of credit to the SME sector. In general, financial institutions are ramping up their SME lending operations as a way to diversify their loan portfolio while still maintaining high asset quality, thus introducing healthy competition into the sector. Commercial banks interviewed reported a much lower NPL ratio on their MSME portfolios than on their total loan portfolio, partially due to the inherent diversification in lending to smaller entities. Seventeen of the 20 commercial banks claim to be involved in SME lending, with some more committed to the sector than others. Most banks engaged in SME lending have specialized SME loan officers and branches that specifically work with SME customers. The two largest banks, BoG and TBC, both have sizeable SME lending units that fall under the banks’ retail lending departments. Most banks are believed to be making some loans to informal SMEs. MFIs: MFIs, of which there are 63 in Georgia, are starting to move upmarket into the SME sector, although they are constrained by maximum loan size regulations. Therefore, they have more flexibility as they transform into banks, such as ProCredit and Constanta, while maintaining their strategic focus on non‐corporate borrowers. In general, a very small percentage of MFIs’ loan portfolios are to SMEs, based on interviews with the country’s largest MFIs. Leasing companies: SMEs are the target market for the leasing sector, with SMEs making up the vast majority of TBC Leasing’s client base, for instance. In fact, TBC Leasing aims to make up 30% of its client base with companies currently considered “unbankable” either because of low capital levels or lack of collateral. Regardless, overall supply remains low given that the leasing sector is underdeveloped (there are just 3 leasing companies) and there is a lack of awareness of leasing products among SMEs. Private equity / venture capital firms: The Caucasus Growth Fund is the only currently operational private equity fund offering true equity financing to SMEs. The Georgia Regional Development Fund is also active and offers primarily mezzanine and convertible debt products. Overall volume of risk capital is low, and some of the funding is directed towards relatively large enterprises.

EIB: PRIVATE SECTOR FINANCING IN THE EASTERN PARTNERSHIP COUNTRIES AND THE ROLE OF RISK‐BEARING INSTRUMENTS
Country Report: Georgia Page 24
Government Programs: State sponsored initiatives to support SMEs have been limited, such as the state led “Cheap Credit” program introduced in 2007 that provided up to GEL 80 million (EUR 36.7 million)70 in loans at preferential terms to SMEs over two years.71 The program was launched to foster job creation in rural areas, especially along the agriculture value chain, handicrafts and export oriented enterprises.72 Guarantee programs: There are currently no guarantee programs providing guarantees to MSMEs to obtain credit from local financial institutions. Georgian banks are quite interested in the possibility that such a program would be established in Georgia. Their biggest concern is the eligibility criteria for a guarantee fund, specifically the definition of “SME” and the types of business activities that would be covered. One major bank indicated that a 5% to 10% increase in SME loan disbursements could be possible through such a scheme.
5.2 Type of funding instruments
Loans: Loans make up the vast majority of SME funding. Loan products consists mostly of shorter term (<24 months) lines of credit for working capital, including some seasonal loans or loans with bullet repayments, or term loans with tenors up to 60 months, on average. In some cases banks will lend for up to seven years to SMEs for the purchase of real estate. Anecdotally banks report about 60% to 70% of their SME loan portfolios to be in USD, especially the longer term loans. Banks only lend in GEL on a short term basis to match their own funding. Most banks require real estate as collateral, with a coverage ratio of at least 100% of the loan, but usually higher and in some cases up to 185%. Often loans under EUR 7,500 are made without collateral. In general, banks are too risk averse to finance start‐ups. Leases: Leases represent a very small proportion of funding to SMEs, although this product has great growth potential. Finance charges on leases are 17% on average, higher than bank loans. In addition, maturities are for six months, on average, heavily restricted by the maturity of leasing companies’ funds. Letters of credit and trade finance guarantees: Commercial banks report very little supply of LCs and guarantees to SMEs, with noticeably higher volumes for guarantees than for LCs. According to the two largest banks’ audited financials, the nominal value of LCs and guarantees73 were equivalent to 3.5% and 14.4% of net loans, respectively, in 2012. Other: Besides term loans or lines of credit, commercial banks also offer a host of non‐loan products to SMEs, including LCs, plastic cards and bank guarantees. BoG is just starting to offer factoring but has seen very little demand for such a product. As stated earlier, leases are gaining popularity but still highly underutilized as a financial tool. Risk capital plays a very small role for SMEs given the lack of sources as well as lack of active demand.
5.3 Characteristics of funding recipients
Sector: MSME loans from commercial banks went primarily to the trade and services sectors, in accordance with the breakdown of registered SMEs by sector. In addition, at least 50% of bank loans are to SMEs in Tbilisi, although some future growth may come more from the regions with the new government agriculture fund.
70 Source: http://www.oecd.org/daf/psd/44183056.pdf 71 Source: OECD Eastern Partner Countries SME Policy Index 2012 72 Source: http://ec.europa.eu/world/enp/pdf/progress2009/sec09_513_en.pdf 73 “Guarantees” seem to be overwhelmingly made up of performance guarantees

EIB: PRIVATE SECTOR FINANCING IN THE EASTERN PARTNERSHIP COUNTRIES AND THE ROLE OF RISK‐BEARING INSTRUMENTS
Country Report: Georgia Page 25
Breakdown of loan portfolio by sector
Nine banks responding to BFC survey, proportion of MSME portfolio at Dec 31, 2012
Total business loans of commercial banks, January 1, 2013
Sector % Sector %
Trade 34.5 Trade 47.0
Services 23.3 Services 11.7
Manufacturing/production 11.9 Manufacturing/production 20.9
Agriculture 10.6 Agriculture 1.2
Other 19.8 Other 19.1
TOTAL 100.0 TOTAL 100.0Sources: BFC survey of six financial institutions, NBG
Size: In general, commercial banks are much more likely to finance SMEs than microenterprises. Within the SME sector, however, the largest banks display no apparent preference for medium sized enterprises over small, utilizing the banks’ internal definitions of “medium” and “small.” Based on a survey of six commercial banks, over 80% of their MSME loan portfolios were to SMEs, where 44.5% of MSME loans were to “medium” sized enterprises and 38.5% were to “small,” based on varying definitions of enterprise size. In general, SME loans are defined as loans less than GEL 1.0 million (EUR 457,000) and on average closer to GEL 200,000 (EUR 91,000). Given the very small size of the leasing sector, no exact figures are publicly available by region, sector and lessee size. Anecdotally, however, the leasing sector appears to have a less concentrated sectoral focus, given that lessees tend not to be in the trade sector but instead spread across agriculture, construction, transportation and light industry. While the majority of these businesses are still in or around Tbilisi, the leasing sector has some regional diversification because of its involvement with the agriculture sector, which operates more in the regions. There are only two private equity funds currently operational in Georgia, the GRDF and CGF, as discussed earlier. The GRDF targets SMEs outside of Tbilisi and those operating in tourism and agribusiness. The 14 portfolio companies are in a range of sectors, including concrete production, anchovy fishing, regional hotels, hazelnut production and processing, poultry breeding and telecommunications infrastructure.74 The CGF does not have as specific a focus, except that it will invest in larger companies than those receiving funding under GRDF.
5.4 Institutional and regulatory issues
There are very few regulatory issues constraining the availability of financing for SMEs. Previously banks were hesitant to lend to lend to SMEs that were not reporting 100% of their income because there were cases in which the SME got audited and the tax authority shut down the company’s operations for up to six months during the audit, resulting in lost income and inability to repay the loan. This does not appear to occur anymore. For MFIs, the maximum loan size of GEL 50,000 (EUR 22,900) effectively excludes MFIs from reaching all but the smallest SMEs. The prohibition on deposit‐taking also limits their ability to raise funds. For leasing companies, the regulatory environment has recently been liberalized, making the sector more attractive to both leasing companies and lessees alike. Further development of the business
74 Source: http://seaf.com/index.php?option=com_content&view=article&id=102&catid=30&Itemid=153&lang=en

EIB: PRIVATE SECTOR FINANCING IN THE EASTERN PARTNERSHIP COUNTRIES AND THE ROLE OF RISK‐BEARING INSTRUMENTS
Country Report: Georgia Page 26
environment, such as training of judges, legal representatives and attorneys, will help the sector continue to grow. Also, while the tax code has become easier to manage for both leasing companies and lessees, Civil and Tax Codes are still complicated and require careful tax planning on the parts of leasing companies.75 In addition, USAID’s Economic Prosperity Initiative project recommends that short of regulation, the NBG, through an ethics committee, implement a system of checks and balances on the leasing sector, to avoid systemic and reputational risk for the sector in the event of isolated bad practices by one player.76
5.5 Funding of intermediaries
Georgian commercial banks appear to be the darlings of the IFIs, with a plentitude of term loans, mostly in hard currency, for on lending to MSMEs. IFIs readily lend for up to five and in rare cases, for up to ten years, with the most common lenders being the EBRD, IFC, KfW, EIB and ADB. Likewise, Georgian MFIs are the darlings of several development‐oriented commercial players, which readily lend, often through multi‐investor funds at reasonable rates and for up to ten years. Such institutions include Oikocredit, Symbiotics, ResponsAbility, Incofin and Triple Jump. Interest rates for USD‐denominated funds from both IFIs are both fixed and variable, ranging from fixed rates as low as 2.4% (10 year loan) and up to 7‐8%, and variable rates of up to LIBOR+5.75%. In general there is very little availability of GEL‐denominated funding, with some international lenders offering it but at rather high prices from an observed low of 8.0% (DFI) up to 14.0% (local commercial bank). The NBG provides some GEL funding, as discussed in the Financial Sector Analysis section, but this funding is not specifically earmarked for the SME sector. Leasing companies are a different story, as discussed earlier, with great potential to serve the SME sector, constrained almost exclusively by their lack of access to funding, especially funding at reasonable prices. TBC Leasing and Georgian Leasing Company are restricted in their access to funds from their parent companies due to the NBG’s related party loan limitations. The main government programme for funding MSME loans is the Agriculture Development Fund (ADF). In line with President Ivanishvili’s pledge to prioritize the agriculture sector, he established the GEL 1.0 billion (EUR 450 million) fund, which is operational as of March 2013. The ADF is made up of three components, all of which extend subsidized loans to local FIs for on‐lending to the agriculture sector. The three components are identified based on the conditions to end borrowers as follows: 1) six month interest‐free commodity credit loans for small farmers for up to GEL 5,000 (EUR 2,250); 2) loans to medium and large farmers with a maximum interest rate of 8% for up to 24 months and from GEL 5,000 to 100,000 (EUR 2,250 to 45,150); and 3) USD‐denominated loans for agricultural industries of up to GEL 1.0 million (EUR 450,000) with a maximum interest rate of 3.0%. The first component operates through three commercial banks and two MFIs, while the second and third work through 11 commercial banks.
5.6 Supply estimate
Total supply of financing to the MSME sector is estimated at EUR 1.3 billion, or 10.7% of 2012 GDP, with most of that financing (an estimated 75%) coming from commercial bank loans. The remaining portion is made up of loans from MFIs, leases and risk capital, which is dominated by the GRDF. The calculation is made by:
1. Estimating the proportion of SME loans in the total loan portfolios of commercial banks, based on a survey of seven banks
75 Source: “Developing Leasing in Georgia,” USAID, May 23, 2012 76 Source: “Developing Leasing in Georgia,” USAID, May 23, 2012

EIB: PRIVATE SECTOR FINANCING IN THE EASTERN PARTNERSHIP COUNTRIES AND THE ROLE OF RISK‐BEARING INSTRUMENTS
Country Report: Georgia Page 27
2. Multiplying that proportion by the total outstanding loan portfolio of the banking sector 3. Including loans from all MFIs to capture the micro sector, in order to match the demand
episode77 4. Estimating the risk capital invested as of YE12 5. Estimating the leases extended to SMEs as of YE12
Estimate of MSME loan supply at YE 2012
Banks MFIs Total
A. MSME loans to total loans (%) 24.2 100.0
B. Total loans (EUR m) 4,001.5 237.6
C. MSME loan supply estimate (=A*B*C) (EUR m) 966.9 237.6 1,204.5
Total SME financing supply at YE 2012
EUR m
E. MSME loan supply estimate (from above) 1,204.5
F. Estimated risk capital 34.2
G. Estimated leases 45.0
H. SME finance supply estimate (=E+F+G) 1,283.7 Source: Bank surveys, audited financials of FIs, NBG, BFC estimates
This overall supply figure is likely overstated as it includes total commercial bank loans, when there are some smaller players that are not lending to SMEs. In addition, the estimate is arrived at by applying an average ratio of SME loans to gross loans of the commercial banking sector, but based on data collected from seven banks, all of which have been identified as particularly committed to the SME sector. This ratio (an estimated 24.2% of gross loans across the sector) is likely lower for other banks, with the exception of Constanta and ProCredit. Figures may also be skewed due to the lack of a nationally accepted definition of SMEs applied consistently across all financial institutions.
77 Demand is calculating using SME data from GeoStat that does not separate out microenterprises

EIB: PRIVATE SECTOR FINANCING IN THE EASTERN PARTNERSHIP COUNTRIES AND THE ROLE OF RISK‐BEARING INSTRUMENTS
Country Report: Georgia Page 28
6. GAPS IN PRIVATE SECTOR FINANCING
Conclusion: The most significant gaps in SME finance are for affordable long term local currency loans. Rural and agricultural clients also face greater financing constraints in comparison with urban, non‐agricultural enterprises. Key findings:
SMEs in rural areas, especially those engaged in agriculture, remain under‐banked
While several IFIs work with the SME sector, many of them are providing the same product: foreign currency denominated loans to financial institutions to be on‐lent to SMEs
6.1 Gaps by instrument
Despite demonstrated commitment to the SME sector by most financial sector players, there still exists a sizeable gap between supply and demand for financing to the sector. The most evident loan gaps are for affordable and/or long term local currency loans, especially at longer tenors, as commercial banks themselves do not have access to such funds to on‐lend. Based on rough estimates, the demand for loan financing from MSMEs is about EUR 1.9 billion, while the supply is EUR 1.2 billion. Despite the fact that commercial banks claim that there is little to no unmet demand for financing by SMEs, conservative lending practices may inadvertently create a gap. For instance, commercial banks require up to 185% collateral coverage on a loan, a prohibitively high ratio for many smaller businesses. Meanwhile, demand for leasing products and risk capital remains latent, as MSME players lack familiarity with these products and with the companies that provide them. Through public outreach, leasing companies may be able to generate additional demand. The consistent presence of risk capital providers is very low, and while the SEAF funds include some resources to educate SMEs on the importance of risk capital, the scope of outreach remains limited. The gap for other products, such as LCs and trade guarantees, is moderate, based on anecdotal information. It will likely increase as SMEs gain more access to export markets.
6.2 Gaps by type of SME
The largest gap appears to be for SMEs in rural areas, especially those in the agriculture sector. Theoretically this gap will start to close with the new agriculture fund established by the government. In addition, many companies may be considered “unbankable” if they do not have a sufficient amount of fixed assets as collateral, regardless of the entity’s cash flow position. Thus there may be a funding gap for enterprises with minimal fixed assets. Financial sector players generally cited a communication gap between themselves and SMEs, whereby SMEs are not properly able to present their company or their funding needs. For example, according to some interviewees, their financial statements are often not in order or they lack a clear business plan. This communication gap translates directly into unmet demand for financing.

EIB: PRIVATE SECTOR FINANCING IN THE EASTERN PARTNERSHIP COUNTRIES AND THE ROLE OF RISK‐BEARING INSTRUMENTS
Country Report: Georgia Page 29
6.3 Gaps in funding of intermediaries
As discussed earlier, commercial banks are only constrained by lack of access to long term local currency funds, especially at affordable prices. Otherwise, foreign currency funds are plentiful. Leasing companies, however, are constrained by lack of funds, with relatively low funding needs given current low market demand, to the point where they are overlooked by many large international financial institutions or commercial banks.
6.4 Potential and capability of IFIs to fill gaps
IFI support for the SME sector has primarily been through loans to financial institutions to be on‐lent to SMEs, with very little variation from this model. To date, all loans have been in foreign currency, despite the strong need for local currency funding. It is a common model to complement the IFIs’ investments with technical assistance to either financial institutions or SMEs themselves, often through partner financial institutions. European Bank for Reconstruction and Development (EBRD): The EBRD supports the SME sector primarily through term loans to financial institutions for on‐lending to SMEs. EBRD has no explicit definition of SMEs, but generally looks at companies with annual turnover of less than GEL 5.0 million (EUR 2.4 million), fewer than 100 employees and a loan size of less than USD 1.0 million (EUR 53,000). The EBRD also provides technical assistance to SMES through its multi‐country Enterprise Growth and Business Advisory Programs. Through the Enterprise Growth Program, the EBRD works at the senior management level of SMEs to make structural changes and develop new business skills to be competitive in market economies. Similarly, the Business Advisory Program provides consultants to work with MSMEs to enhance competitiveness, management, quality and strategic business planning. Going forward the EBRD plans to expand support to existing and new partner financial institutions. 78 About 50% of the EBRD’s EUR 611 million portfolio in Georgia is to the financial sector. EBRD has equity investments in TBC Bank, Bank Republic, and Basis Bank. International Finance Corporation (IFC): Like the EBRD, the IFC provides financing to the SME sector via partner financial institutions. Recent investments include loans to KorStandard Bank (USD 7.0 million loan), TBC Bank (up to USD 70.0 million) and BoG (up to USD 100.0 million of convertible and non‐convertible subordinated loans and senior loans) to be on‐lent to SMEs. The IFC also provides nonfinancial services to the sector through its Bank Advisory Program, which helps to improve banks’ risk management and SME banking capabilities. As of July 2013, the IFC was working through TBC Bank to support SMEs and close the gap between borrowers and banks. Future projects will be focused on development of the agriculture sector, in line with the new government’s priorities. IFC has equity investments in TBC Bank and FINCA Georgia. KfW: Again, KfW is working through commercial banks, providing term loans at subsidized interest rates to be on‐lent to SMEs, with the goal of promoting financial sector development. KfW previously had a EUR 10.0 million credit guarantee fund that provided a 90% guarantee on loans from international commercial banks to three local banks: BoG, TBC and Bank Republic. Under this guarantee all three banks accessed funds from Commerzbank, which were on‐lent to SMEs. There is some possibility of a similar follow‐on fund. Like with the IFC, KfW will start to focus more on promoting loans to the agriculture sector. United States Agency for International Development (USAID): USAID is a technical assistance provider, supporting the SME sector through its Economic Prosperity Initiative, a USD 40.0 million project designed to improve agriculture productivity and strengthen targeted non‐agriculture value
78 Source: EBRD website

EIB: PRIVATE SECTOR FINANCING IN THE EASTERN PARTNERSHIP COUNTRIES AND THE ROLE OF RISK‐BEARING INSTRUMENTS
Country Report: Georgia Page 30
chains. USAID also provided partial loan guarantees to two financial institutions, AG Leasing and Crystal (an MFI) to access funding at the wholesale level, and a loan portfolio guarantee to Bank Republic to partially guarantee loans primarily to the agriculture sector. Asian Development Bank: To date, the ADB has made loans to three commercial banks in Georgia, totaling USD 95.0 million (EUR 72.1), for on‐lending to SMEs. The most recent loan was extended to TBC Bank in January 2013 for a five years and USD 50.0 million (EUR 37.9 million), specifically for on‐lending to small enterprises in rural areas. Black Sea Trade and Development Bank: The BSTDB has made several loans to commercial banks in Georgia for on‐lending to SMEs, including loans to TBC Bank (USD 10.0 million, 3 years) and ProCredit Bank (USD 10.0 million, 3 years). GIZ: To improve business conditions for SMEs, GIZ is working to improve the business and investment climates, especially for SMEs, through its Private Sector Development Programme.

EIB: PRIVATE SECTOR FINANCING IN THE EASTERN PARTNERSHIP COUNTRIES AND THE ROLE OF RISK‐BEARING INSTRUMENTS
Country Report: Georgia Page 31
ANNEX 1: MACROECONOMIC INDICATORS
Indicator 2012 2011 2010 2009 2008
GDP (nominal, EUR billions) 12.0 11.3 8.8 7.4 8.1
Population (millions)79 4.5 4.5 4.5 4.4 4.4
GDP (nominal) per capita (EUR) 2,662.9 2,520.2 1,989.7 1,695.1 1,840.7
GDP (PPP) per capita (EUR) 4,487.2 4,249.4 3,821.5 3,319.7 3,480.2
Real GDP growth rate (%) 2.3 (3.8) 6.3 7.2 6.1
Inflation rate (%, CPI) ‐1.4 2.0 11.2 3.0 5.5
Exchange rate (EUR, end of period) 2.2 2.2 2.4 2.4 2.4
Change in exchange rate (%) 1.0 (8.0) (2.9) 2.3 1.4
Unemployment rate (official) 15.0 15.1 16.3 16.9 16.5
Poverty rate (WB, $1.25 per day) n/a n/a 5.8 n/a 4.6
Current account balance (% of GDP) (5.0) (6.4) (5.9) (6.2) (8.3)
Trade balance (% of GDP) (34.6) (33.4) (30.6) (31.6) (42.0)
Capital account balance (% of GDP) (2.0) (3.9) (2.8) (3.0) (6.0)
Net FDI (% of GDP) 5.8 2.7 2.2 2.2 4.9
Central bank reserves (% of GDP) 12.5 11.9 10.0 10.4 8.6
Public debt (% of GDP) n/a n/a n/a n/a n/a
Fiscal balance (% of GDP) n/a n/a n/a n/a n/a
Sectoral distribution of GDP (% of total) Sector/activity 2012 2011
Trade (Wholesale & Retail) 14.3 14.6
Public Administration 9.7 10.0
Transport & Communications 9.1 9.1
Manufacturing 9.0 8.6
Agriculture 7.2 7.6
Construction 6.3 5.8
Electricity, Gas & Water 2.4 2.6
Finance 2.4 2.2
Mining 0.9 0.9
Other 38.7 38.6
TOTAL 100.0 100.0
Source: GeoStat
79 Source: GeoStat. Figure represents population at the beginning of the following year.

EIB: PRIVATE SECTOR FINANCING IN THE EASTERN PARTNERSHIP COUNTRIES AND THE ROLE OF RISK‐BEARING INSTRUMENTS
Country Report: Georgia Page 32
ANNEX 2: FINANCIAL SECTOR INDICATORS
Banking sector indicators Indicator 2012 2011 2010 2009 2008
STRUCTURE OF THE BANKING SECTOR
Number of banks by type:
Foreign‐controlled commercial banks 18 16 15 17 14
Domestic commercial banks 1 3 4 2 6
Total banks 19 19 19 19 20
Number of state‐owned banks 0 0 0 0 0
Assets of SOBs to total bank assets (%) 0 0 0 0 0
5‐bank concentration ratio (%) 92.4 90.8 n/a n/a n/a
Bank branches per 100,000 population 18.5 15.8 14.4 14.4 15.6
FINANCIAL INDICATORS (EUR billions)
Total assets 6.1 5.3 4.0 3.4 3.5
Total gross loans 4.0 3.6 2.7 2.1 2.5
Total net loans 3.7 3.3 2.4 1.9 2.3
Total deposits 3.5 3.1 2.3 1.6 1.5
Total equity 1.0 0.9 0.7 0.6 0.7
Total regulatory capital 1.2 1.1 0.8 0.6 0.6
Total net profit 0.1 0.2 0.1 (0.0) (0.1)
FINANCIAL RATIOS (%)
Capital adequacy:
Tier 1 CAR 13.4 11.3 13.7 16.5 14.4
Total CAR 17.0 17.1 17.4 19.1 13.9
Equity to total assets 17.0 16.5 17.5 18.5 20.1
Liquidity:
Loans to deposits 114.2 114.7 114.1 131.3 168.0
Growth rate of deposits 13.4 22.9 38.9 10.7 11.0
Regulatory liquidity ratio n/a n/a n/a n/a n/a Liquid assets to total assets 27.3 21.3 19.6 18.3 20.2
Profitability:
Return on average assets 1.4 3.5 2.1 (0.8) (2.7)
Return on average equity 8.6 20.6 11.9 (4.1) (12.6)
Asset quality:
Growth rate of gross loan portfolio 12.8 23.6 20.7 (13.5) 30.6
Loans overdue 90 days 3.7 4.5 5.9 6.3 4.1
Others:
Growth rate of total assets 16.8 23.1 13.2 0.0 13.8
Bank assets to fin. sector assets (%)80 95.2 96.3 96.8 97.8 98.4
Microfinance sector indicators Indicator 2012 2011 2010 2009 2008
Number of MFIs 62 62 49 38 27
Total assets of MFIs (EUR millions) 311.1 205.4 131.7 76.5 58.0
Total gross loans of MFIs (EUR millions) 237.6 161.3 97.7 53.8 47.7
80 Estimate based on banks’ total assets to non‐bank financial institutions’ total assets

EIB: PRIVATE SECTOR FINANCING IN THE EASTERN PARTNERSHIP COUNTRIES AND THE ROLE OF RISK‐BEARING INSTRUMENTS
Country Report: Georgia Page 33
ANNEX 3: PRUDENTIAL RATIOS FOR BANKS
Ratio Criteria
Capital adequacy (as a % of risk‐weighted assets) Regulatory capital Tier 1 capital
≥ 12.0% ≥ 8.0%
Regulatory capital (in Georgian Lari) ≥ 12.0 million
Investments (as a % of shareholders’ equity) Equity investments Equity investments and net value of fixed assets
≤ 50.0% ≤ 70.0%
Credit risk concentration (as a % of regulatory capital) Lending to insiders
Individual Aggregate
Lending to non‐insiders
Single borrower Group of interrelated borrowers
Large loans Unsecured loans (as a % of loan portfolio)
≤ 5.0% ≤ 25.0% ≤ 15.0% ≤ 25.0% ≤ 200.0% ≤ 25.0%
Liquidity (as a % of liabilities) Liquid assets
≥ 30.0%
Total open foreign currency position (as a % of regulatory capital)
≤ 20.0%

EIB: PRIVATE SECTOR FINANCING IN THE EASTERN PARTNERSHIP COUNTRIES AND THE ROLE OF RISK‐BEARING INSTRUMENTS
Country Report: Georgia Page 34
ANNEX 4: KEY BANKING REGULATIONS
Category Brief description
Financial reporting standards
Under the Law on Activities of Commercial Banks, 81 banks are required to publish consolidated IFRS statements in addition to quarterly bank‐only accounts per NBG standards
Corporate governance standards
The Law on Activities of Commercial Banks lays out corporate governance standards, such as the general meeting of shareholders, supervisory council, directorate and audit committee
Ownership restrictions The Law on Activities of Commercial Banks places some restrictions on ownership, such as limits on the percent of shares held without NBG approval
Capital adequacy standards
As laid out in the Regulation on Supervision and Regulation of the Activities of Commercial Banks,82 capital adequacy requirements are bank‐only and consistent with the Basel I regime with a market risk charge, but are stricter than the Basel committee’s recommendations
Minimum capital requirements
The May 23, 2006 legal act, On Approving the Regulation on Defining Minimum Capital Requirements for Commercial Banks83 sets the minimum amount of regulatory capital at GEL 12.0 million (EUR 5.5 million)
Definition of NPL The Regulation on Assets Classification and the Creation and Use of Reserves for Losses by Commercial Banks defines non‐performing loans (NPL) as the sum of loans classified by the bank as watch, substandard, doubtful, and loss.84 The definitions are based on quantitative and qualitative criteria such as collateral coverage, borrower capitalization, and risk‐based judgment of the bank or NBG. As for the quantitative criteria, a loan is classified as “watch” as soon as it falls into arrears; however, the terms “overdue” or “past due” are reserved for loans in arrears for more than 30 days. The other NPL categories relate to this definition of “past due”, i.e. the number of days indicated as quantitative classification trigger needs to be added on top of the first 30 days past due. A partially secured or unsecured loan is classified as “substandard” after 30‐90 additional days; “doubtful” after 90‐150 days; and “loss” after more than 150 days. Fully secured loans have an additional 30 days before being classified as “substandard” or “doubtful”.
Loan classification and provisioning policy
The Regulation on Assets Classification and the Creation and Use of Reserves for Losses by Commercial Banks (December 2000) lays out loan classification standards85
81 Source: Law of Georgia on the Activities of Commercial Banks. http://www.nbg.ge/uploads/legalacts/nbglow/new/law_of_georgia_on_activities_of_commercial_bankseng.pdf 82 Source: NBG (last amendment in June 2007) Regulation on Supervision and Regulation of the Activities of Commercial Banks. http://www.nbg.ge/uploads/legalacts/supervision/nbg1.4.5.1regulation_of_the_activities_eng.pdf 83 Source: http://www.nbg.ge/uploads/legalacts/supervision/nbg1.4.4.2defining_minimum_capitaleng.pdf 84 Source: NBG (May 2006). Regulation on Transparency of Financial Condition, Art. 5.k. http://www.nbg.ge/uploads/legalacts/supervision/nbg1.4.4.2regulation_on_transparencyeng.pdf 85 http://www.nbg.ge/uploads/legalacts/supervision/nbg1.4.5.1regulation_on_assetseng.pdf

EIB: PRIVATE SECTOR FINANCING IN THE EASTERN PARTNERSHIP COUNTRIES AND THE ROLE OF RISK‐BEARING INSTRUMENTS
Country Report: Georgia Page 35
Deposit insurance None
Reserve requirements The Regulation on Assets Classification and the Creation and Use of Reserves for Losses by Commercial Banks (December 2000) lays out reserve requirements by loan classification. Under this legal act, all standard loans require a general provision of 2% of the unpaid portion of the loan, watch loans 10%, substandard 30%, doubtful 50% and loss 100%
Related party transactions
The Law on Activities of Commercial Banks states the NBG’s prudential norms, limiting related party transactions.

EIB: PRIVATE SECTOR FINANCING IN THE EASTERN PARTNERSHIP COUNTRIES AND THE ROLE OF RISK‐BEARING INSTRUMENTS
Country Report: Georgia Page 36
ANNEX 5: LIST OF LARGEST FINANCIAL INSTITUTIONS
List of largest banks
Name Ownership
Total assets(EUR millions, Dec. 2012)
1 Bank of Georgia Bank of Georgia Holdings (99.6%), listed on the London Stock Exchange
2,624.1
2 TBC Bank IFC (20%), EBRD (20%), TBC Holdings (20%), DEG (12%), JP Morgan Chase (5%), FMO (5%), other individual and institutional investors (18%)
1,786.8
3 ProCredit Bank ProCredit Holding AG (100%)86 482.4
4 Liberty Bank Liberty Holdings Georgia (72.4%), individuals and institutional investors (27.6%), listed on Georgian
Stock Exchange
384.4
5 Bank Republic Societe Generale Group (93.6%), EBRD (6.4%) 369.4
6 VTB Georgia VTB Bank (Russia) (96.3%), Other (3.7%) 249.8
7 Cartu Bank Cartu Group (100%), which is in turn owned by a variety of holding companies87
191.3
8 PrivatBank PJSC Commercial Bank PrivatBank (Ukraine) (62.6%), Unimain Holdings (32.4%), bank
management (5%)
174.6
9 KorStandard Bank Sheikh Nahayan Mabarak Al Nahayan (45%), Sheikh Hamdan Bin Zayed Al Nehayan (20%), Sheikh
Mohammed Butti Al Hamed (15%), Sheikh Mansoor Bin Sultan Al Nehayan (15%), LTD Investment
Trading Group (5%)
165.2
10 Bank Constanta TBC Bank (84.6%) 112.0
11 BasisBank Xinjiang Hualing Industry & Trade (Group) Co Ltd of China (93.5%), EBRD (3.3%), one individual (3.3%)
92.4
12 Progress Bank LTD Kala Capital (78.3%), Bidzina Ivanishvili (21.7%) 9.5
List of top MFIs
Name Ownership
Total assets (EUR millions, Dec. 2012)
1 CREDO VisionFund Caucasus LLC88 (100%) 82.7
2 FINCA FINCA International (66.3%), IFC (15.0%), KfW (7.2%), FMO (6.7%), other institutional investors
(4.8%)
45.6
3 Crystal Crystal Fund (founding NGO), DWM, Individual shareholders89
12.4
86 ProCredit Holdings is owned by a variety of IFIs and DFIs, with IPC GmbH holding the largest share (17.7%) 87 See Annex 6 for updated information 88 Ultimately controlled by World Vision International 89 Percentage holdings were not available

EIB: PRIVATE SECTOR FINANCING IN THE EASTERN PARTNERSHIP COUNTRIES AND THE ROLE OF RISK‐BEARING INSTRUMENTS
Country Report: Georgia Page 37
ANNEX 6: PROSPECTS OF THE LARGE ENTERPRISE SECTOR
There were 3,063 active large enterprises operating in Georgia as of Q1 2013, making up 6.0% of total active registered companies, a figure which has remained mostly unchanged over the past five years. At the same point in time, they made up 82.6% of total turnover and 59.1% of employed persons. They also made up 78.2% of value added as of YE 2011. A high 68.9% of all large enterprises were based in Tbilisi as of Q1 2013, also unchanged over the past five years. Of the total large enterprises, 37.8% were involved in the “wholesale and retail trade” sector, another 11.7% in “real estate, renting and business activities” and 9.8% in manufacturing. As a percent of total enterprises, large companies had the largest share in the electricity, gas and water supply sector, accounting for 38.1% of active businesses. Most banks in Georgia are involved in corporate lending to some extent, especially the two largest banks, with corporate lending making up around half of their loan portfolios. The remainder of their loan portfolios is comprised of consumer loans, mortgages, loans to SMEs and pawn shop loans. Anecdotally, those involved in corporate lending are seeking to increase their corporate loan portfolio, seeing little inherent risk to the sector. Interest rates for corporate loans are between 10% and 14%. Products for corporate clients include various credit products, such as credit lines, standard loans and overdraft facilities as well as documentary operations, bank guarantees, factoring, leasing and insurance products. Sectors particularly served by the corporate sector include construction, services, real estate, oil & gas, telecommunications and energy. Some IFIs, such as the IFC and EBRD, are starting to make their own investments in the corporate sector, with a specific focus on the power sector. In 2011 the IFC signed the agreement to make an equity investment of USD 110 million (EUR 80.0 million) in a hydro renewable energy plant in southwest Georgia.90 The EBRD recently made a sovereign‐backed loan of EUR 25.2 million to Georgian State Electrosystem, the state‐owned electricity transmission company. In the Georgian
90 http://www.ifc.org/wps/wcm/connect/corp_ext_content/ifc_external_corporate_site/ifc+projects+database/projects/disclosed+projects/georgia_33435


03/2014 © E IB GraphicTeam
Contacts
Economics Department3 (+352) 43 79 - 861475 (+352) 43 79 - 67799
European Investment Bank98 -100, boulevard Konrad AdenauerL-2950 Luxembourg3 (+352) 43 79 - 15 (+352) 43 77 04www.eib.org


