Georgia State Government FY2016 Workforce Report July 1, 2015 – June 30, 2016 Department of Administrative Services Human Resources Administration Division 200 Piedmont Avenue, West Tower Suite 500 T: 1-877-318-2722 or 404-656-2705 [email protected]
Information in this report provides a snapshot of the State’s workforce for Fiscal Year 2016. The first
section containing Tables 1-6 provides a basic overview of all state entities, all branches of government.
The remainder of the report focuses on Executive Branch entities only. All data excludes Georgia World
Congress Center, Board of Regents and higher educational entities, and is further limited to entities
utilizing TeamWorks, the State’s enterprise HRIS.
Top 4 Takeaways
Staffing. The staffing model of many state entities continues to shift from hiring full-time, benefit-
eligible employees, to alternative types of employment arrangements. The full-time, benefit-eligible
employee count declined year-over-year to 66,669, just over 1,000 employees, while total state
headcount increased. An additional 16 percent of staffing was with contingent employees, and another
2 percent or 1,200 workers assigned by temporary staffing firms. Tables 5 and 6 detail staffing for the
Executive Branch as a whole and by employer, respectively.
Turnover. The state’s general turnover rate increased slightly year-over-year from 19.4 to 19.9 percent.
Correctional Officer jobs at the Department of Corrections, (DOC) and the Department of Juvenile Justice
(DJJ) agencies remain the predominant driver; however, Table 27 reflects that a number of state entities
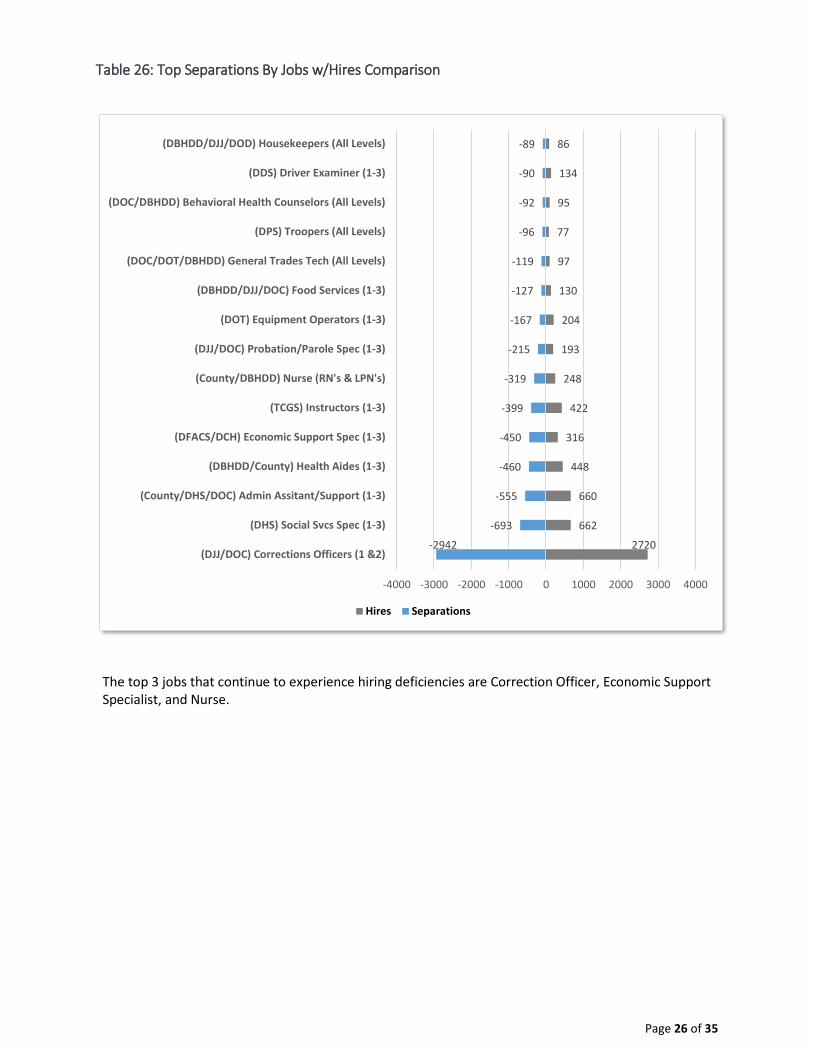
experienced turnover rates that exceeded the state’s general turnover rate of 19.9 percent. Table 26
demonstrates that the top five jobs that experienced a hiring “churn” included: Correctional Officers at
DOC and DJJ; Health Aides at the Department of Behavioral Health and Developmental Disabilities
(DBHDD); and Economic Support Specialists, Protect and Placement Specialists, and Social Services
Specialists at the Department of Human Services (DHS). While agencies with these and other jobs
experienced revolving turnover and hiring activities, DHS had a high number of vacancies in the
Economic Support Specialist and Protect and Placement Specialist jobs at the time of the data snapshot
for this report. Probation and Parole Officer jobs also experienced high vacancies, but these jobs were
not highlighted due to continued staffing of the new Department of Community
Services agency.
Retention. The state began tracking a retention rate for Executive Branch entities this past year to
determine how soon after hire employees quit. Recent benchmark data for the U.S. workforce found
that employees stayed in their jobs for at least 3 years after hire, with older employees staying for 10
years.1 Table 20 details retention rates by employer for a comparison against this benchmark. By
contrast, one of every three hires leaves state employment within 12 months of hire. While eight
smaller state entities retained 100% of their hires the first year, the following three large state entities
fell far below the state’s general one-year retention rate of 69 percent: DBHDD; DOC; DJJ.
Retirements. The number of year-over-year retirements declined slightly from 10.3 percent to 9.4
percent. Table 1 shows that just over 10 percent of the state’s workforce remains eligible to retire
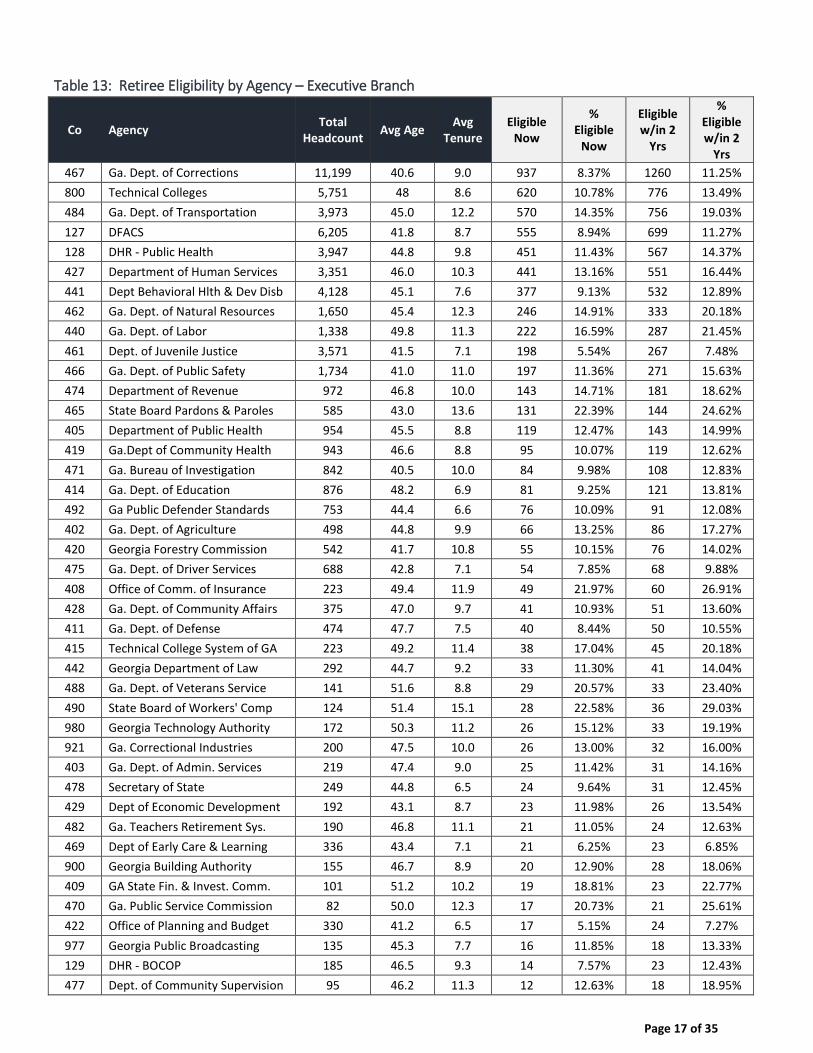
immediately. Table 13 tracks retirement eligibility of the Executive Branch workforce by employer, and
shows that seven Executive Branch entities are particularly vulnerable to immediate experience drain
and within the next five years. Workers’ Board of Compensation; Georgia Student Finance; and the
Office of Commissioner of Insurance are particularly vulnerable with more than 20 percent of their
employees eligible for retirement today, climbing to 30 percent eligible for retirement within the next
five years.
1 “Employee Tenure in 2014.” Bureau of Labor Statistics press release, September 18, 2014.
Page 3 of 35
Top 3 Areas of Focus
1. Retention Strategies. Considering the state’s high turnover rate and retirement eligibility data, building the future workforce must include immediate focus on retention strategies as more employment options become available. Georgia, for instance, added 140,000 jobs to the economy over the past year. To be effective, however, retention strategies must be aligned with the turnover problem identified in individual agencies. Table 22 shows that nearly 70% percent of the turnover experienced by Executive Branch entities is due to voluntary resignation, yet the reason employees leave state government remains largely unsupported by data. Agencies continue to document departures as unspecified resignations rather than make use of the more specific termination codes available. This HR transaction practice limits an employer’s ability to develop a focused, data-supported retention strategy. An alternative approach to identifying the reasons employees quit is to conduct and analyze exit interview surveys. This technique has not been widely adopted across the state and would require manual data collection and aggregation.
The Department of Administrative Services will remain focused on standardizing data input behaviors and has developed other strategies aimed at improving the state’s retention rate from 69 percent to 75 percent by 2020. Some of these other strategies include continued refinement of career paths and labor market data for certain occupations to enable informed hiring and promotion decisions; improved communications about benefit options; improved functionality and processes for the performance management program, to include refined competencies for agencies to incorporate when hiring, promoting, and developing managers or leaders; partnerships to provide training delivery options to agencies for management or leadership development; and continued training related to the recruitment benefits of using the state’s applicant tracking system. Data related to jobs posted using the applicant tracking system this past year shows that agencies optimally utilizing competency-based screening questions in TeamGeorgiaCareers.gov experienced a job retention rate of 86 percent at year one after hire compared to the state’s general retention rate of 69% at year one. Hiring right to begin with is an effective retention strategy.
2. Cost Management. In addition to the need to develop focused, data-supported retention
strategies, there are number of local and federal changes that will create personnel cost- management challenges for employers.
The Fair Labor Standards Act was amended this year to increase the salary threshold at which
employers may exempt workers from overtime requirements. The salary threshold will rise
from $23,600 annually to $47,476 annually. Barring successful legal challenges, employers have
until December 1, 2016, to comply with the amended law. DOAS has advised HR leaders
statewide to reclassify approximately 14,000 positions, and to begin change management
related to certain workplace practices, timekeeping, and monitoring of work hours to avoid
unintentional overtime pay for these newly classified employees. The DOC, DHS, DJJ, DBHDD,
and local counties of Public Health are most notably impacted.
The City of Clarkston in Dekalb County increased the minimum wage to $15 per hour earlier this
year. State employers with work locations in the geographical area or who otherwise recruit
from the County will be challenged to compete for and retain talent in this area for jobs
requiring comparable skills and paying less than $31,000 annually.
Page 4 of 35
The Affordable Care Act, which requires employers with 50 or more full-time or full-time
equivalent employees to provide healthcare to at least 95 percent of their workforce this year,
creates higher financial risks for employers. These risks are specifically related to the more than
11,000 contingent employees in state positions, as well as the additional 1,226 workers
assigned to state employers by staffing firms. DOAS has taken several steps to assist state
employers in managing this risk, including: preparing HR leaders across the state; transitioning
temporary staffing from the procurement function to the centralized HR within the DOAS;
centralizing IRS reporting requirements; and working with numerous staffing firms to manage
the state’s risk exposure contractually. IRS penalties for non-compliance will continue to
increase year-over-year. Penalties for noncompliance in the 2016 calendar year increased to
$2,160.00 for each full-time worker and $3,240.00 for each employee that purchases
healthcare from the federal exchange and receives a tax premium. Estimates for the 2017 plan
year are $2,260.00 and $3,390.00, respectively. While these risks will be managed centrally,
employers must properly classify employees, rehires, and contractors and actively monitor
working hours, to include certain types of paid leave, in real time to also manage the risk
locally.
3. Knowledge Transfer / Succession Planning. Employers with high turnover and either a large
numbers of potential retirees, or potential retirees in single-incumbent jobs critical to their mission must act now to build their future workforce. While rehiring retirees is a talent pipeline strategy, it is not a sustainable or long-term strategy and may further aggravate retention issues as employees look to move up. The simplest step to ensure business continuity is to implement knowledge transfer techniques such as documenting processes, contacts, file locations, and other workflow information. Employers with mission critical management or leadership roles should identify high-potential employees and work to retain them. One effective retention method is to ensure high-potentials know their next career opportunity and the technical or soft skills they will need to develop in order to be competitive for that move. These individuals should have a documented development plan as part of their performance review plan that details focused learning assignments, aligns them with mentors, or assigns competency-based training aligned with the kind of managers and leaders the agency wishes to create.
Table of Contents
ENTERPRISE
Table 1: Workforce Comparison – All Branches ....................................................................... 6
Table 2: Workforce Breakdown by Branch of Government........................................................ 7
Table 3: 10 Year Headcount By Fiscal Year ............................................................................... 7
Table 4: Turnover Trend By Fiscal Year ................................................................................... 8
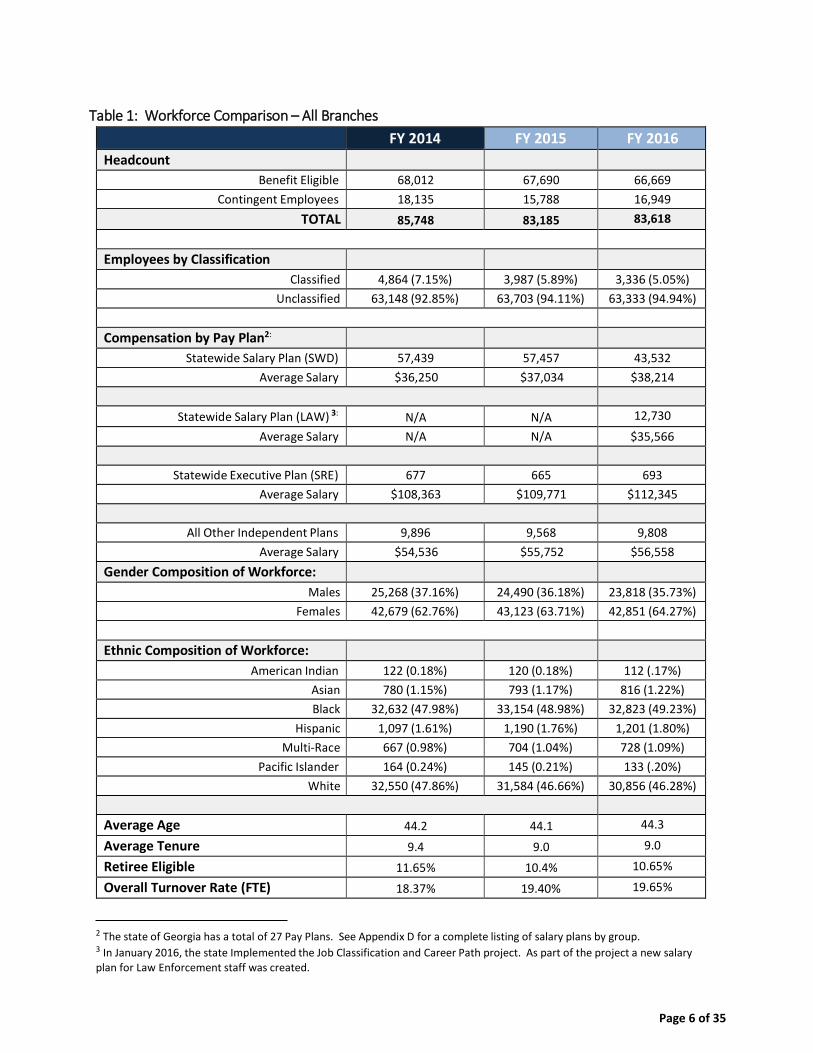
White 32,550 (47.86%) 31,584 (46.66%) 30,856 (46.28%)
Average Age 44.2 44.1 44.3
Average Tenure 9.4 9.0 9.0
Retiree Eligible 11.65% 10.4% 10.65%
Overall Turnover Rate (FTE) 18.37% 19.40% 19.65%
2 The state of Georgia has a total of 27 Pay Plans. See Appendix D for a complete listing of salary plans by group. 3 In January 2016, the state Implemented the Job Classification and Career Path project. As part of the project a new salary plan for Law Enforcement staff was created.
Page 7 of 35
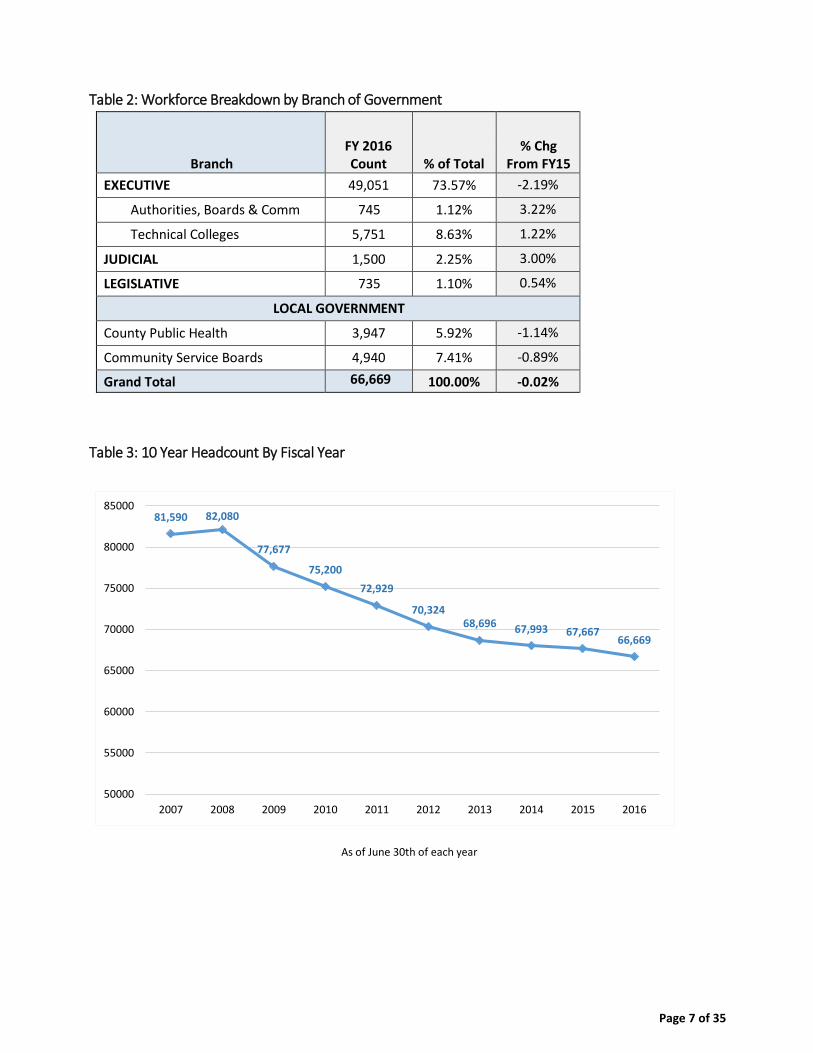
Table 2: Workforce Breakdown by Branch of Government
Branch
FY 2016 Count
% of Total
% Chg From FY15
EXECUTIVE 49,051 73.57% -2.19%
Authorities, Boards & Comm 745 1.12% 3.22%
Technical Colleges 5,751 8.63% 1.22%
JUDICIAL 1,500 2.25% 3.00%
LEGISLATIVE 735 1.10% 0.54%
LOCAL GOVERNMENT
County Public Health 3,947 5.92% -1.14%
Community Service Boards 4,940 7.41% -0.89%
Grand Total 66,669 100.00% -0.02%
Table 3: 10 Year Headcount By Fiscal Year
As of June 30th of each year
81,590 82,080
77,677
75,200
72,929
70,32468,696 67,993 67,667
66,669
50000
55000
60000
65000
70000
75000
80000
85000
2007 2008 2009 2010 2011 2012 2013 2014 2015 2016
Page 8 of 35
Table 4: Turnover Trend By Fiscal Year
15.60%
16.43%
17.88%
18.37%
19.40%
19.97%
15.00%
16.00%
17.00%
18.00%
19.00%
20.00%
21.00%
FY11 FY12 FY13 FY14 FY15 FY16
Executive Branch
Georgia State Government
Page 10 of 35
Table 5: Employment Category
The state’s staffing model continues to shift with just over 80 percent of staffing now full-
time, benefit-eligible employees. Sixteen percent of the state’s workforce is contingent4
who can take many forms including seasonal workers, interns and/or student workers,
rehired retirees, or casual on-call employees. These workers are usually paid on an hourly
basis and may have periods during the fiscal year in which no hours are worked. The
working hours of these individuals appears to be tightly monitored below 30 hours a week.
The Human Resources Administration Division of the Department of Administrative Services
began centrally managing temporary staffing in January 2016. For FY2016, Executive
Branch agencies added an additional 1,226 workers assigned by staffing firms, 906 of which
worked 30+ hours a week.
4 Temporary workforce numbers are comprised of employees who were active as of 6/30/2016 in the state of Georgia
PeopleSoft Payroll system. This count does not include DFACs or PH Districts who utilize separate payroll systems.
Benefit Eligible, 59,494, 82%
Contingent State, 11,895,
16%
Non-State Contingent Staff,
1,226, 2%
Benefit Eligible
Contingent State
Non-State Contingent Staff
Less than 1% of contingent
state employees may be
eligible for health care
coverage based on working
an average of 30+ hours per
week
Page 11 of 35
Table 6: Executive Branch Workforce By Entity
CO Entity FTE
Total
Contingent State
Employees FY16 Total
Contingent State
Workforce %
FY15 - 16 Variance
128* County Public Health * 3,947 176 4,123 4.27% (676)
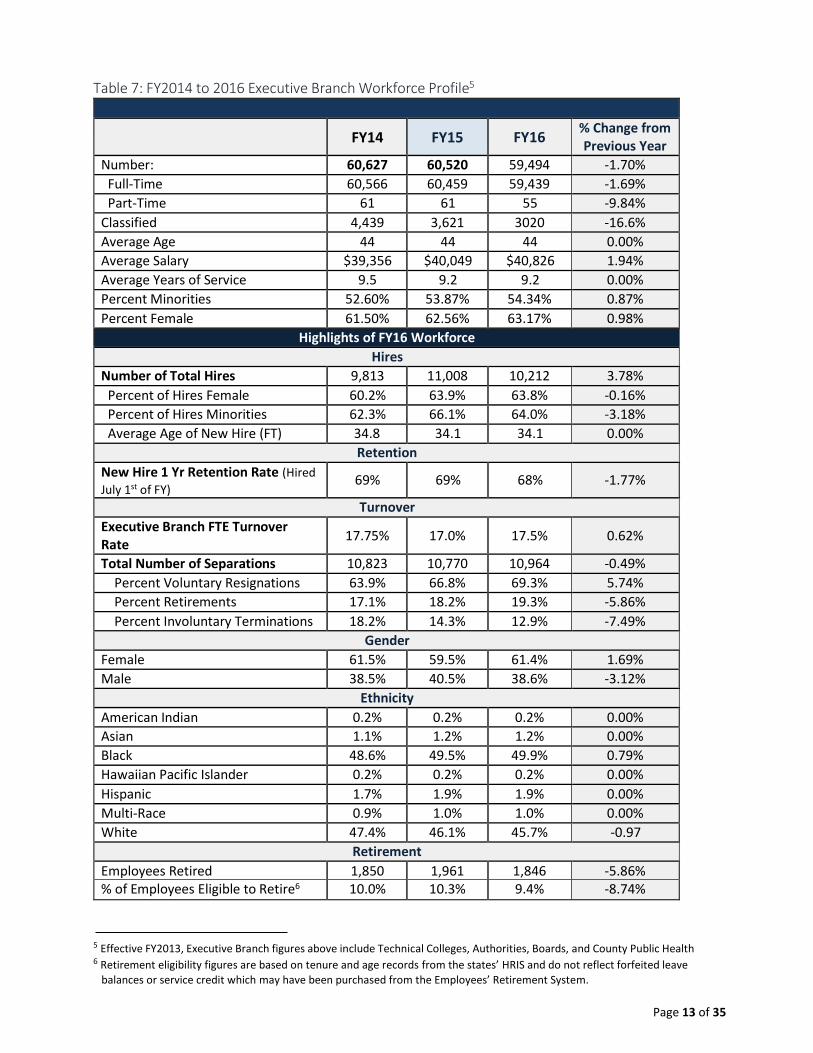
Employees Retired 1,850 1,961 1,846 -5.86% % of Employees Eligible to Retire6 10.0% 10.3% 9.4% -8.74%
5 Effective FY2013, Executive Branch figures above include Technical Colleges, Authorities, Boards, and County Public Health 6 Retirement eligibility figures are based on tenure and age records from the states’ HRIS and do not reflect forfeited leave
balances or service credit which may have been purchased from the Employees’ Retirement System.
Page 14 of 35
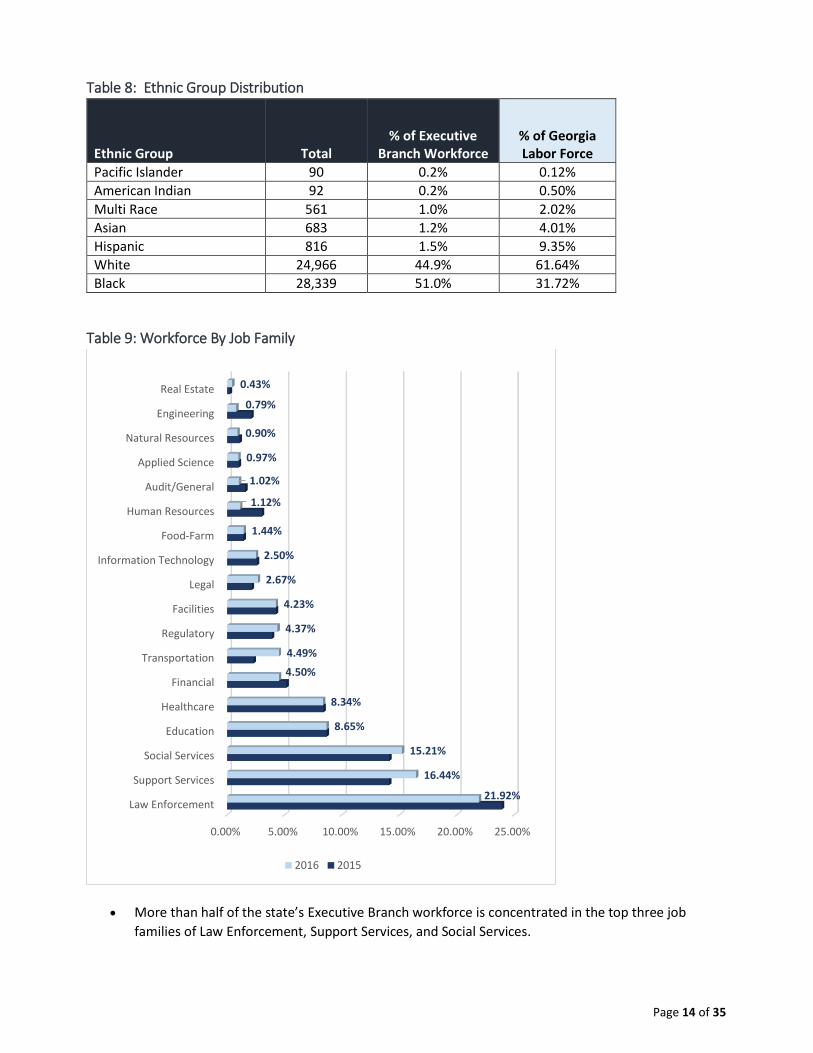
Table 8: Ethnic Group Distribution
Ethnic Group Total % of Executive
Branch Workforce % of Georgia Labor Force
Pacific Islander 90 0.2% 0.12%
American Indian 92 0.2% 0.50%
Multi Race 561 1.0% 2.02%
Asian 683 1.2% 4.01%
Hispanic 816 1.5% 9.35%
White 24,966 44.9% 61.64%
Black 28,339 51.0% 31.72%
Table 9: Workforce By Job Family
More than half of the state’s Executive Branch workforce is concentrated in the top three job
families of Law Enforcement, Support Services, and Social Services.
480 GA Soil & Water Conservation 33 44.0 5.9 0 0.00% 0 0.00%
976 GA Regional Trans Authority 34 43.8 4.4 0 0.00% 0 0.00%
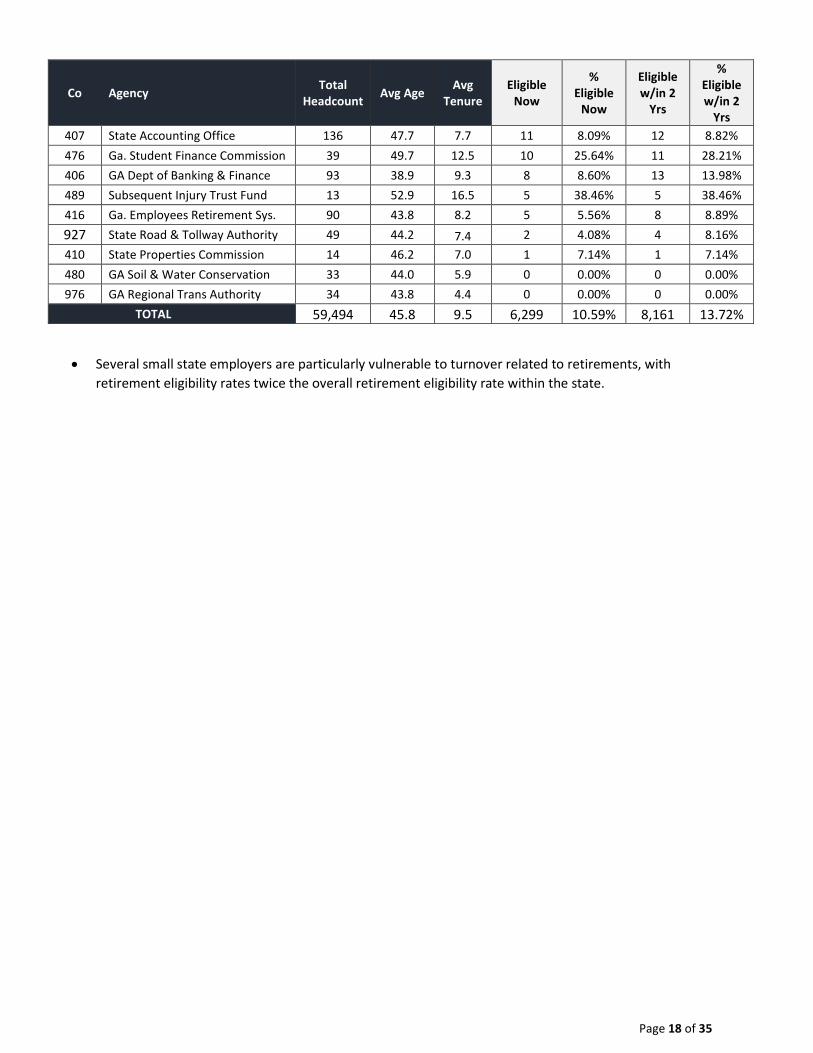
TOTAL 59,494 45.8 9.5 6,299 10.59% 8,161 13.72%
Several small state employers are particularly vulnerable to turnover related to retirements, with
retirement eligibility rates twice the overall retirement eligibility rate within the state.
Page 19 of 35
Table 14: Workforce By Generations
The State of Georgia has six (6) generations currently in the workforce. There is 1 Traditionalist (born before 1925) and 2 Generation Z’s working for the State, not graphed.
Table 15: Years of Service Distribution
High turnover and steady retirements leaves one in three Executive Branch employees with less than
three years of tenure. Agencies must focus on retention to deliver a consistent customer service
Voluntary Terminations continue to climb. Focus needed on retention.
10,060
10,890
11,129
10,823 10,770
11,073
9,400
9,600
9,800
10,000
10,200
10,400
10,600
10,800
11,000
11,200
11,400
FY11 FY12 FY13 FY14 FY15 FY16
Separations
6038 6224 64926919 7189
7670
2220 24052834
1972 1961 1875
1,6892,154
1,698 1,8501,535
1,432
113 107 105 82 85 960
1000
2000
3000
4000
5000
6000
7000
8000
9000
FY11 FY12 FY13 FY14 FY15 FY16
Separations By Category
Voluntary Retirement Involuntary Other
Page 32 of 35
Employees tenure at retirement has been trending downward for six straight years.
5.9 4.9 4 4.1 3.8 3.8
25 24.3 23.4 22.7 22.6 21.8
6.6 6.75.4 5.5 4.5 4.3
14.413.4
11.9 13.111 11.2
0
10
20
30
40
50
60
FY11 FY12 FY13 FY14 FY15 FY16
Average Tenure at Separation
Voluntary Retirement Involuntary Other
Page 33 of 35
Exhibit C: Separations Major Category Descriptions
Action Reason Description Short Desc Category
OTHER TER DEA Death Death Other TER KLD Killed in Line of Duty KilledDuty Other
INVOLUNTARY
TER ATT Attendance Attendance Involuntary TER CON Misconduct Misconduct Involuntary TER DIS Dismissal Dismissal Involuntary TER DRG Drug Testing Drug Test Involuntary TER INS Insubordination Insubordin Involuntary TER MIS Misstatement on Application Misstatemt Involuntary TER NPR No Position Return From Leave Con Leave Involuntary TER RIF Reduction in Force RIF Involuntary TER RLS Release Release Involuntary TER TAR Tardiness Tardiness Involuntary TER UNS Unsatisfactory Performance Unsat Perf Involuntary TER VIO Violation of Rules Violation Involuntary
RETIREMENT TER RTM Retirement Retirement Retirement
VOLUNTARY
TER CHI Child/House Care Child/Hse Voluntary
TER EES Dissatisfied w/Fellow Employee Employees Voluntary
TER FAM Family Reasons Family Rsn Voluntary
TER FOR Forfeiture of Position Forfeit Voluntary
TER HEA Health Reasons Health Voluntary
TER HRS Dissatisfied with Hours Hours Voluntary
TER ILL Illness in Family Illness Voluntary
TER LOC Dissatisfied with Location Location Voluntary
TER LVE Failure to Return from Leave Leave Voluntary
TER MAR Marriage Marriage Voluntary
TER MUT Mutual Consent Mut Consnt Voluntary
TER PAY Dissatisfied with Pay Pay Voluntary
TER PER Personal Reasons Personal Voluntary
TER PLE Paid Leave Exhausted Lv Exhaust Voluntary
TER POL Dissatisfied w/Comp. Policies Comp Polic Voluntary
TER PRE Presumptive Resignation Presume Voluntary
TER PRM Dissatisfied w/Promotion Opps Promo Opps Voluntary
TER PSE Private Sector Employment PriSectEmp Voluntary
TER PTD Partial/Total Disability Pt/Tot Dis Voluntary
TER REF Refused Transfer Refus Xfer Voluntary
TER REL Relocation Relocation Voluntary
TER RES Resignation Resignatn Voluntary
TER RTS Return to School School Voluntary
TER SUP Dissatisfied with Supervision Supervisn Voluntary
TER TRA Transportation Problems Transportn Voluntary
TER TYP Dissatisfied w/Type of Work Work Type Voluntary
TER WOR Dissatisfied w/Work Conditions Work Conds Voluntary