Presented by: Steve Cavanaugh, PE Principal in Charge, Georgia Water Loss Program Member IWA, Water Loss Specialist Group Member, Georgia Water Loss Control Committee Outreach Chair, AWWA Water Loss Control Committee Co-author: Jason Bodwell Georgia Environmental Finance Authority Georgia Statewide Water Loss Program
Transcript
Presented by:
Steve Cavanaugh, PEPrincipal in Charge, Georgia Water Loss Program
Member IWA, Water Loss Specialist Group
Member, Georgia Water Loss Control Committee
Outreach Chair, AWWA Water Loss Control Committee
Co-author:
Jason BodwellGeorgia Environmental Finance Authority
Georgia Statewide Water Loss Program
M R S
Audience Participation !
3
Auditing
Requirement
Drivers
Technical
AssistanceValidation
Planned Use of
Audits
Training
Timeline
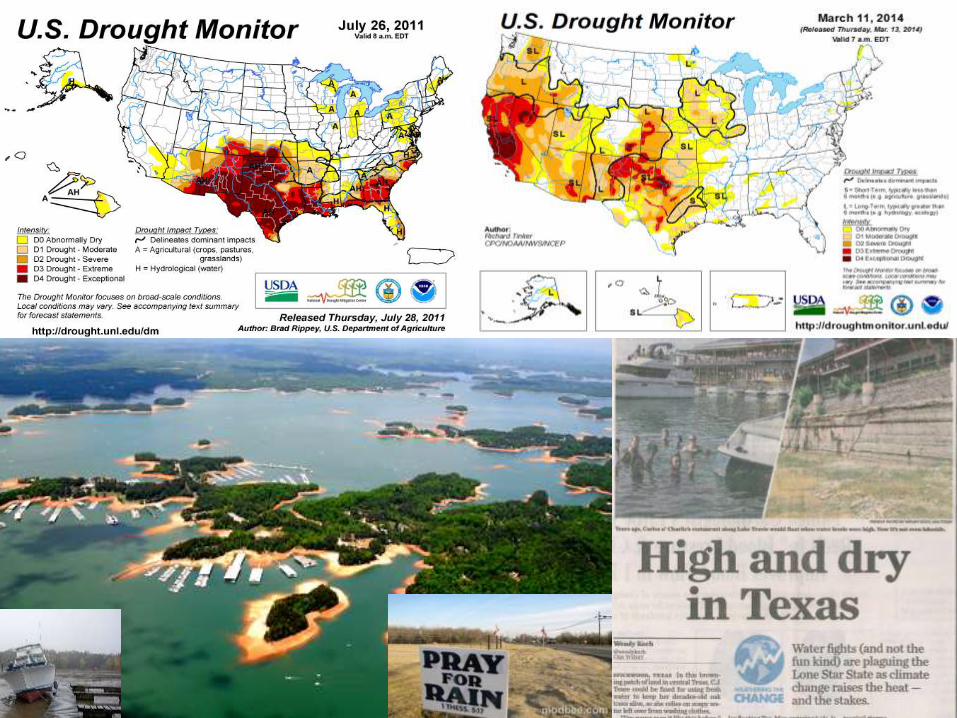
2008-2010
Severe Drought in Georgia…
Water Stewardship Act of 2010
requires annual water loss
audits
March 2012
Large water systems submit
first AWWA water loss audit
2012-13
State hires experts to
provide free 10-month training to small utilities
on water auditing; small systems submit their first audits
(Phase 1)
Early 2013
State commissions
3rd party validation for
all audits (large and small systems)
Late 2013 & 2014
State provides free technical assistance to small utilities for water loss
Systematic data handling errors: 4 5.000 MG/Yr 0.25% MG/Yr
Apparent Losses: 15.071 MG/Yr
Real Losses (Current Annual Real Losses or CARL)
Real Losses = Water Losses - Apparent Losses: 49.617 MG/Yr
WATER LOSSES: 64.688 MG/Yr
NON-REVENUE WATER
NON-REVENUE WATER: 75.000 MG/Yr
= Water Losses + Unbilled Metered + Unbilled Unmetered
SYSTEM DATA
Length of mains: 7 100.0 miles
Number of active AND inactive service connections: 6 1,000
Service connection density: 10 conn./mile main
Yes
Average length of customer service line: ft
Average operating pressure: 6 60.0 psi
COST DATA
Total annual cost of operating water system: 5 $1,000,000 $/Year
Customer retail unit cost (applied to Apparent Losses): 7 $3.50
Variable production cost (applied to Real Losses): 7 $3,000.00 $/Million gallons
WATER AUDIT DATA VALIDITY SCORE:
PRIORITY AREAS FOR ATTENTION:
1: Volume from own sources
2: Customer metering inaccuracies
3: Total annual cost of operating water system
Based on the information provided, audit accuracy can be improved by addressing the following components:
$/1000 gallons (US)
100.000
<----------- Enter grading in column 'E' and 'J' ---------->
Unauthorized consumption volume entered is greater than the recommended default value
5.000
*** YOUR SCORE IS: 60 out of 100 ***
A weighted scale for the components of consumption and water loss is included in the calculation of the Water Audit Data Validity Score
100.000
3.000
25.000
Average length of customer service line has been set to zero and a data grading score of 10 has been applied
Are customer meters typically located at the curbstop or property line?
AWWA Free Water Audit Software:
Reporting Worksheet
Default option selected for Unbilled unmetered - a grading of 5 is applied but not displayed
1.000
2013 1/2013 - 12/2013
Northern San Leandro Combined Water Sewer Storm Utility District (0007900)
?
?
?
?
?
? Click to access definition
?
?
?
?
?
?
Please enter data in the white cells below. Where available, metered values should be used; if metered values are unavailable please estimate a value. Indicate your confidence in the accuracy of the input data by grading each component (n/a or 1-10) using the drop-down list to the left of the input cell. Hover the mouse over the cell to obtain a description of the grades
?
?
?
?
?
?
(length of service line, beyond the property boundary, that is the responsibility of the utility)
+ Use Customer Retail Unit Cost to value real losses
?
To select the correct data grading for each input, determine the highest grade where the utility meets or exceeds all criteria for that grade and all grades below it.
AWWA Free Water Audit Software
Water Audit Report for:
Reporting Year:
All volumes to be entered as: MILLION GALLONS (US) PER YEAR
Master Meter Error Adjustments
WATER SUPPLIED Pcnt: Value:
Volume from own sources: 5 1,000.000 MG/Yr 1 MG/Yr
Water imported: MG/Yr MG/Yr
Water exported: 1 100.000 MG/Yr 9 MG/Yr
Enter negative % or value for under-registration
WATER SUPPLIED: 825.000 MG/Yr Enter positive % or value for over-registration.
Systematic data handling errors: 4 5.000 MG/Yr 0.25% MG/Yr
Apparent Losses: 15.071 MG/Yr
Real Losses (Current Annual Real Losses or CARL)
Real Losses = Water Losses - Apparent Losses: 49.617 MG/Yr
WATER LOSSES: 64.688 MG/Yr
NON-REVENUE WATER
NON-REVENUE WATER: 75.000 MG/Yr
= Water Losses + Unbilled Metered + Unbilled Unmetered
SYSTEM DATA
Length of mains: 7 100.0 miles
Number of active AND inactive service connections: 6 1,000
Service connection density: 10 conn./mile main
Yes
Average length of customer service line: ft
Average operating pressure: 6 60.0 psi
COST DATA
Total annual cost of operating water system: 5 $1,000,000 $/Year
Customer retail unit cost (applied to Apparent Losses): 7 $3.50
Variable production cost (applied to Real Losses): 7 $3,000.00 $/Million gallons
WATER AUDIT DATA VALIDITY SCORE:
PRIORITY AREAS FOR ATTENTION:
1: Volume from own sources
2: Customer metering inaccuracies
3: Total annual cost of operating water system
Based on the information provided, audit accuracy can be improved by addressing the following components:
$/1000 gallons (US)
100.000
<----------- Enter grading in column 'E' and 'J' ---------->
Unauthorized consumption volume entered is greater than the recommended default value
5.000
*** YOUR SCORE IS: 60 out of 100 ***
A weighted scale for the components of consumption and water loss is included in the calculation of the Water Audit Data Validity Score
100.000
3.000
25.000
Average length of customer service line has been set to zero and a data grading score of 10 has been applied
Are customer meters typically located at the curbstop or property line?
AWWA Free Water Audit Software:
Reporting Worksheet
Default option selected for Unbilled unmetered - a grading of 5 is applied but not displayed
1.000
2013 1/2013 - 12/2013
Northern San Leandro Combined Water Sewer Storm Utility District (0007900)
?
?
?
?
?
? Click to access definition
?
?
?
?
?
?
Please enter data in the white cells below. Where available, metered values should be used; if metered values are unavailable please estimate a value. Indicate your confidence in the accuracy of the input data by grading each component (n/a or 1-10) using the drop-down list to the left of the input cell. Hover the mouse over the cell to obtain a description of the grades
?
?
?
?
?
?
(length of service line, beyond the property boundary, that is the responsibility of the utility)
+ Use Customer Retail Unit Cost to value real losses
?
To select the correct data grading for each input, determine the highest grade where the utility meets or exceeds all criteria for that grade and all grades below it.
Defaults provided
Free
awwa.org/waterlosscontrol
Industry Standard
(M36)
~10 Volume Inputs
~7 System Data Inputs
Auditing
Requirement
Drivers
Technical
AssistanceValidation
Planned Use of
Audits
Training
25
Small System Water Loss Audit Training – Phase I
26
Water Audit Training –Phase 1 Program Overview
Kickoff Webinar& Workshop Round 1:
Fundamentals
Homework Step 1:
Practice Audit
Workshop Round 2:
Reinforce & Next Steps
Homework Step 2:
Launch Data Protocols &
Monthly Team Meetings
Workshop Round 3:
Reinforcement & Continuous Improvement
Homework Step 3:
Final Validation
with Trainers:
Program Completion
Submittal of Validated
2012 Audit
JUN
2012
JULY
2012
AUG
2012
SEPT - DEC
2012
JAN - FEB
2013
FEB
2013
MARCH
2013
Utility Feedback: Discoveries
“Massive amounts of “unbilled” usage”
“Found accounts being metered and billed in different units (gallons vs. CCF)”
“Water meters are our cash registers and our cash registers need to be functioning properly”
“Discovered production numbers were significantly off, even though they were “calibrating” the production meters”
Utility Feedback: Some of the Biggest Surprises
“Amount of money we do not collect”
“Impact of water loss on finances”
“Apparent vs Real Loss - didn't realize how much could be lost through faulty meters.”
“The more money/water will find, the less we may need to borrow for capital projects”
“Performing the audit was easier than we originally thought.”
Utility Feedback: Common Themes
“We should have been doing this all along”
“We got it over time”
Auditing
Requirement
Drivers
Technical
AssistanceValidation
Planned Use of
Audits
Training
31
Critical Importance of ValidationCalifornia
Texas
Georgia:
Database of 230 Utilities Number of Audits (est)
Erroneous Units 15
Negative Water Supplied 4
Negative Water Loss 6
>100% Water Loss 3
ILI <0.5 30
2,046
34%
130
35%
230
25%
32
Critical Importance of Validation
• Quality control for input errors
• Verification of data grading
• Uniform adherence to grading matrix definitions
• Consistent definitions and calculations
33
Validated Audit Results
>200 Validated
Water Loss Audits
Auditing
Requirement
Drivers
Technical
AssistanceValidation
Planned Use of
Audits
Training
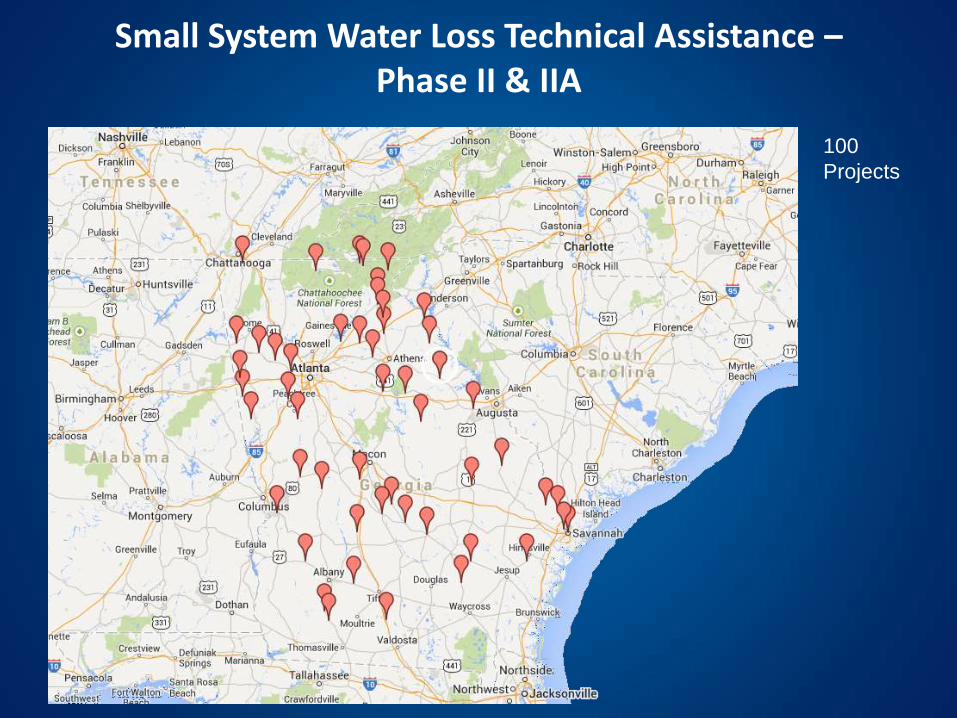
Small System Water Loss Technical Assistance –Phase II & IIA
100
Projects
Small Water Systems Technical Assistance –Leak Detection
Utility
#
Utility Total
Miles of
Main in
the
system
Actual
Miles
Surveyed
# of
Leaks
Found
Total
Estimated
Leak Water
Loss (gpm)
Leak Type
1 Butler 44 30 3 21 fire hydrant
2 Byron 50 30 2 4 valve; service (svc) connection
3 Cochran 62 29 2 7 fire hydrant
4 Vienna 77 25 2 7 fire hydrant; valve
5 McRae 43 28 1 3 fire hydrant
6 Sylvester 76 30 6 28 fire hydrant; svc connection; main
7 Adel 74 30 4 14 fire hydrant; svc connection
8 Swainsboro 96 30 10 42 fire hydrant; svc connection; main
9 Rincon 65 30 3 10 fire hydrant; svc connection; main
10 Walthourville 30 27 1 3 fire hydrant
11 Savannah 54 22 2 4 fire hydrant; svc connection
Total: 671 311 36 143
Utility
#
Utility Total
Miles of
Main in
the
system
Actual
Miles
Surveyed
# of
Leaks
Found
Total
Estimated
Leak Water
Loss (gpm)
Leak Type
1 Blue Ridge 100 30 3 21 main; svc connection; meter