35
Georgian Banking Sector Overview 2017 1st Quarter Results June, 2017

Georgian Banking Sector Overview
2017 1st Quarter Results
June, 2017
2© 2017 KPMG Georgia LLC, a company incorporated under the Laws of Georgia, a member firm of the KPMG network of
independent member firms affiliated with KPMG International Cooperative (“KPMG International”), a Swiss entity. All rights
reserved.
Contents
Page
Basis of Preparation
2
At a Glance 3
Sector Highlights 4
General Highlights 5
Bank Profiles 6
Appendix 1: Shareholding Structure & General Information 23
Appendix 2: Sector Insights 26
Appendix 3: Key Financial Indicators 28
Appendix 4: Bank Contact Details 32
Glossary of Terms 34

Basis of Preparation
This report summarizes and analyzes the financial results of the
17 commercial banks of Georgia for the 1st quarter of 2017, as
well as provides some insights into the recent developments in
the sector.
The financial information has been obtained from the published
interim reports for the 1st quarter of 2017. The banks are listed
in the alphabetical order throughout the publication. We have
used simple headline numbers in our analysis unless stated
otherwise; each bank has its own way of reporting performance
and this has proved to be the most consistent method of
presenting their results.
All the key ratios are calculated based on the obtained data
unless stated otherwise.
The general information, such as the number of branches,
employee headcount, etc., are mainly taken from the Notes to
the Financial Statements prepared by the banks. The official
websites of the banks serve as the only alternative source,
however they are not always properly updated. Due to this, the
figures presented may not necessarily be as of 31st March
2017. There may be figures more up to date or of an earlier date
depending on the latest available information published by the
banks.
The main source of news is the official websites of the banks
and the National Bank of Georgia, as well as the official press
releases published by various news agencies.
© 2017 KPMG Georgia LLC, a company incorporated under the Laws of Georgia, a member firm of the KPMG network of
independent member firms affiliated with KPMG International Cooperative (“KPMG International”), a Swiss entity. All rights
reserved.
4© 2017 KPMG Georgia LLC, a company incorporated under the Laws of Georgia, a member firm of the KPMG network of
independent member firms affiliated with KPMG International Cooperative (“KPMG International”), a Swiss entity. All rights
reserved.
At a Glance
Key Financial Indicators of the Georgian Banking Sector (in million GEL)*
* The difference between the table and other information provided in the report might be caused by the different bases of preparation of financial
information by the National Bank of Georgia.
** The indicators of the financial position are as of the last day of the corresponding period
*** The change for the financial performance indicators is for the periods of the first 3 months of the years
**** The figure does not contain bank deposits
***** The total income consists of interest income and fee and commission income
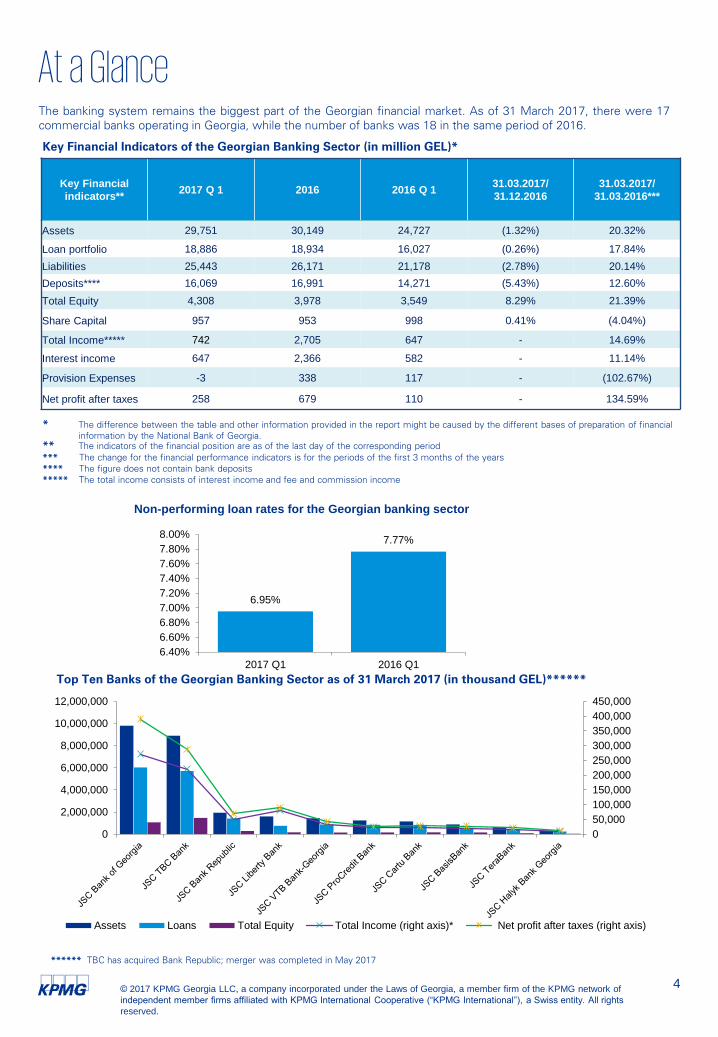
The banking system remains the biggest part of the Georgian financial market. As of 31 March 2017, there were 17
commercial banks operating in Georgia, while the number of banks was 18 in the same period of 2016.
Key Financial
indicators**2017 Q 1 2016 2016 Q 1
31.03.2017/
31.12.2016
31.03.2017/
31.03.2016***
Assets 29,751 30,149 24,727 (1.32%) 20.32%
Loan portfolio 18,886 18,934 16,027 (0.26%) 17.84%
Liabilities 25,443 26,171 21,178 (2.78%) 20.14%
Deposits**** 16,069 16,991 14,271 (5.43%) 12.60%
Total Equity 4,308 3,978 3,549 8.29% 21.39%
Share Capital 957 953 998 0.41% (4.04%)
Total Income***** 742 2,705 647 - 14.69%
Interest income 647 2,366 582 - 11.14%
Provision Expenses -3 338 117 - (102.67%)
Net profit after taxes 258 679 110 - 134.59%
Top Ten Banks of the Georgian Banking Sector as of 31 March 2017 (in thousand GEL)******
****** TBC has acquired Bank Republic; merger was completed in May 2017
0
50,000
100,000
150,000
200,000
250,000
300,000
350,000
400,000
450,000
0
2,000,000
4,000,000
6,000,000
8,000,000
10,000,000
12,000,000
Assets Loans Total Equity Total Income (right axis)* Net profit after taxes (right axis)
6.95%
7.77%
6.40%
6.60%
6.80%
7.00%
7.20%
7.40%
7.60%
7.80%
8.00%
2017 Q1 2016 Q1
Non-performing loan rates for the Georgian banking sector

5© 2017 KPMG Georgia LLC, a company incorporated under the Laws of Georgia, a member firm of the KPMG network of
independent member firms affiliated with KPMG International Cooperative (“KPMG International”), a Swiss entity. All rights
reserved.
General highlights▪ On January 17 de-dollarization program was implemented together by Government and National
Bank. Individuals who had real estate bank loans in foreign currency had a chance to convert it
into national currency. Following this, loans of $75 million were converted to GEL by the end of
March.
▪ At the end of February Government decided to return Finance Sector Supervision functions to
National Bank of Georgia (NBG).
▪ In March, 2017 Georgian government with support of World Bank has approved legislative
amendments for introduction of deposits obligatory insurance system. The law is planned to be
adopted this year and will come into force on January 1, 2018.
▪ In March NBG issued a banking license to JSC Credo Bank, which has been operating on
Georgian market since 2007 as a microfinance organization.
▪ In March Netherlands Development Finance Company (FMO) has sold its own shares in TBC
Holding. Institutional investors of UK, USA and Europe have bought the shares under
accelerated deal managed by Barclays and Renaissance Capital.
▪ By the end of March the accounts of Bank Republic clients had been tied to TBC Bank and Bank
Republic cards were replaced by TBC Bank cards. Merger has successfully finished in May.
▪ In March Minimum Capital Requirement for banking license applicant was increased up to GEL
50 mln, in turn, for the banks licensed by NBG before coming into effect of official order,
supervisory capital should be not less than GEL 30 million (by December 31, 2017), not less
than GEL 40 million (by June 30, 2018), not less than GEL 50 million (by December 31, 2018).
To note, Silkroad bank, Finca bank and Ziraat bank will have to grow their capital by the end of
2018.
▪ On May 2 announcement was made that Turkey’s state-run Ziraat Bank will offer services in
neighboring Georgia under a new institution called JSC Ziraat Bank Georgia.
▪ On May 15 the official ceremony of signing declaration, concerning founding of Georgian
development bank was held in Beijing, China. The declaration was signed by Vice Prime
Minister, Dimitri Kumsishvili. The founders of the bank are largest Chinese corporations: „CEFC
China Energy Company Limited’’ and the company „Eurasian Invest LLC”.
▪ The Minimum Requirement Of Liquidity Coverage Ratio will be established for the Commercial
banks from September. The LCR ratio will be calculated as High Qualified Liquid Assets / Net
cash outflow (Net outflow represents difference between cash inflow and cash outflow over a
30-day stress period). The aim of the new limit is to ensure that banks have sufficient high
qualified liquid assets to survive the stress period.
Sources: Caucasus Business week
6© 2017 KPMG Georgia LLC, a company incorporated under the Laws of Georgia, a member firm of the KPMG network of
independent member firms affiliated with KPMG International Cooperative (“KPMG International”), a Swiss entity. All rights
reserved.
Loan portfolio/non-bank deposits
1.2
ROA3.04%
ROE21.3%
Loan portfolio/
assets63.5%
Loan loss reserve/
loans5.9%
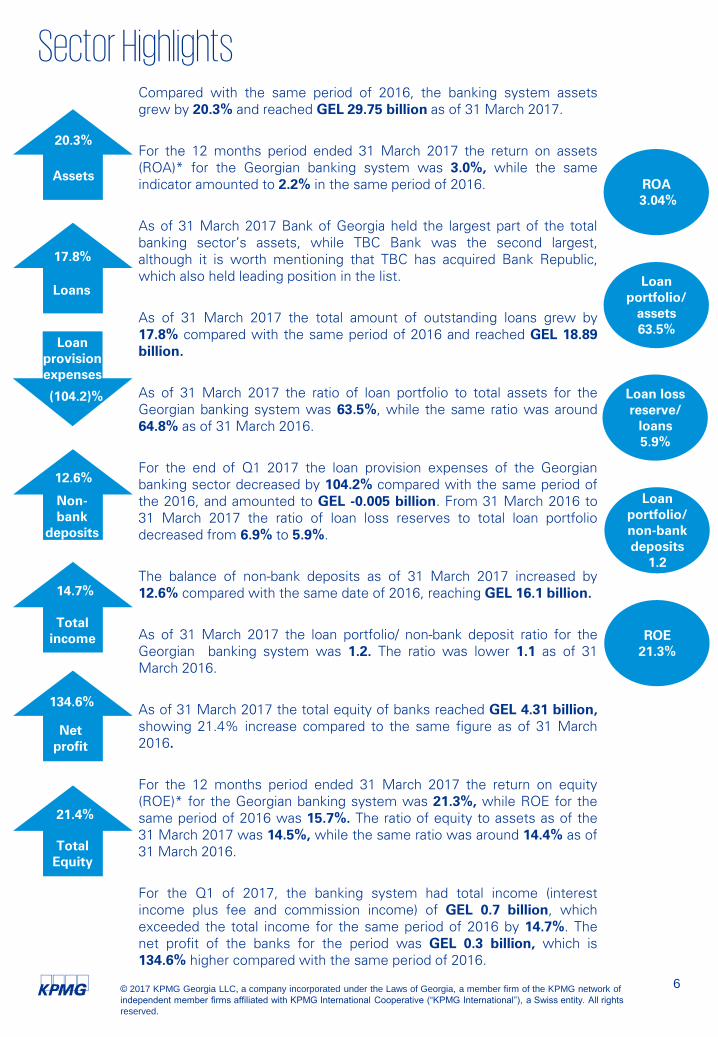
Sector HighlightsCompared with the same period of 2016, the banking system assets
grew by 20.3% and reached GEL 29.75 billion as of 31 March 2017.
For the 12 months period ended 31 March 2017 the return on assets
(ROA)* for the Georgian banking system was 3.0%, while the same
indicator amounted to 2.2% in the same period of 2016.
As of 31 March 2017 Bank of Georgia held the largest part of the total
banking sector’s assets, while TBC Bank was the second largest,
although it is worth mentioning that TBC has acquired Bank Republic,
which also held leading position in the list.
As of 31 March 2017 the total amount of outstanding loans grew by
17.8% compared with the same period of 2016 and reached GEL 18.89
billion.
As of 31 March 2017 the ratio of loan portfolio to total assets for the
Georgian banking system was 63.5%, while the same ratio was around
64.8% as of 31 March 2016.
For the end of Q1 2017 the loan provision expenses of the Georgian
banking sector decreased by 104.2% compared with the same period of
the 2016, and amounted to GEL -0.005 billion. From 31 March 2016 to
31 March 2017 the ratio of loan loss reserves to total loan portfolio
decreased from 6.9% to 5.9%.
The balance of non-bank deposits as of 31 March 2017 increased by
12.6% compared with the same date of 2016, reaching GEL 16.1 billion.
As of 31 March 2017 the loan portfolio/ non-bank deposit ratio for the
Georgian banking system was 1.2. The ratio was lower 1.1 as of 31
March 2016.
As of 31 March 2017 the total equity of banks reached GEL 4.31 billion,
showing 21.4% increase compared to the same figure as of 31 March
2016.
For the 12 months period ended 31 March 2017 the return on equity
(ROE)* for the Georgian banking system was 21.3%, while ROE for the
same period of 2016 was 15.7%. The ratio of equity to assets as of the
31 March 2017 was 14.5%, while the same ratio was around 14.4% as of
31 March 2016.
For the Q1 of 2017, the banking system had total income (interest
income plus fee and commission income) of GEL 0.7 billion, which
exceeded the total income for the same period of 2016 by 14.7%. The
net profit of the banks for the period was GEL 0.3 billion, which is
134.6% higher compared with the same period of 2016.
20.3%
Assets
17.8%
Loans
12.6%
Non-bank
deposits
Total income
14.7%
134.6%
Net profit
(104.2)%
Loan provision expenses
Total Equity
21.4%

7© 2017 KPMG Georgia LLC, a company incorporated under the Laws of Georgia, a member firm of the KPMG network of
independent member firms affiliated with KPMG International Cooperative (“KPMG International”), a Swiss entity. All rights
reserved.
Amount , GEL, thousands Change**
2017 Q 1*** 2016*** 2016 Q 1*** Share in total
sector, %Rank
31.03.2017/ 31.03.2017/
31.12.2016 31.03.2016
Assets 9,811,766 10,765,807 8,292,994 32.98% 1 (8.86%) 18.31%
Loan Portfolio 6,051,035 6,629,042 5,181,875 32.04% 1 (8.72%) 16.77%
Liabilities 8,722,012 9,499,861 7,375,674 34.28% 1 (8.19%) 18.25%
Deposits 5,280,789 5,773,512 4,736,351 32.86% 2 (8.53%) 11.49%
Total Equity 1,089,754 1,265,946 917,320 25.30% 2 (13.92%) 18.80%
Share Capital 26,053 27,821 26,659 2.72% 11 (6.35%) (2.27%)
Total
Income****271,878 1,076,428 231,261 36.65% 1 17.56%
Interest
Income231,330 908,042 198,256 35.74% 1 16.68%
Net Profit/ loss
after Taxes118,359 289,094 26,753 45.91% 1 342.42%
Bank ProfilesBank of GeorgiaKey Financial Indicators*
Key RatiosRankings
1st
rank by the assets
1st
rank by the loan portfolio
1st
rank by the liabilities
2nd
rank by the deposits
2nd
rank by the equity
1st
rank by the net profit after tax
1st
rank by the total income
1st
rank by the interest income
11th
rank by the share capital
January February March
* The indicators of the financial position are as of the last day of the corresponding period.
** The change for the financial performance indicators is for the periods of the first 3 months of the years
*** The audited financial statements of the bank is the source of the 2016 year end information, while 2016 Q1 and 2017 Q1 results are based on the NBG data
**** The total income consists of interest income and fee and commission income
Key Indicators of Financial Performance,
GEL, thousands
Key Indicators of Financial Position,
GEL, thousands
11.11%
22.81%
15.25%
9.47%
5.36%
4.77%
43.82%
8.21%
0.00% 20.00% 40.00% 60.00% 80.00% 100.00%
Equity to Assets
Liquidity
Capital Adequacy
Tier 1
Net Interest Margin
ROA
ROE
Non PerformingLoans/Total Loans
0
2,000,000
4,000,000
6,000,000
8,000,000
10,000,000
Assets LoanPortfolio
Liabilities Deposits TotalEquity
ShareCapital
As of 31.03.2017
As of 31.03.2016
0
50,000
100,000
150,000
200,000
250,000
300,000
Total Income Interest Income Net Profit/ loss afterTaxes
As of 31.03.2017
As of 31.03.2016

8© 2017 KPMG Georgia LLC, a company incorporated under the Laws of Georgia, a member firm of the KPMG network of
independent member firms affiliated with KPMG International Cooperative (“KPMG International”), a Swiss entity. All rights
reserved.
Bank Profiles (continued)Bank RepublicKey Financial Indicators*
Key RatiosRankings
Among the top ten banks by all financial indicators, except
share capital
January February March
* The indicators of the financial position are as of the last day of the corresponding period.
** The change for the financial performance indicators is for the periods of the first 3 months of the years
*** The audited financial statements of the bank is the source of the 2016 year end information, while 2016 Q1 and 2017 Q1 results are based on the NBG data
**** The total income consists of interest income and fee and commission income
Key Indicators of Financial Performance,
GEL, thousands
Key Indicators of Financial Position,
GEL, thousands
Amount , GEL, thousands Change**
2017 Q 1*** 2016*** 2016 Q 1*** Share in total
sector, %Rank
31.03.17/ 31.03.17/
31.12.16 31.03.16
Assets 1,945,332 2,058,677 1,654,097 6.54% 3 (5.51%) 17.61%
Loan Portfolio 1,428,590 1,447,571 1,219,492 7.56% 3 (1.31%) 17.15%
Liabilities 1,647,490 1,750,174 1,409,512 6.48% 3 (5.87%) 16.88%
Deposits 675,248 813,821 743,987 4.20% 5 (17.03%) (9.24%)
Total Equity 297,842 305,913 244,584 6.91% 3 (3.46%) 21.77%
Share Capital 76,031 76,031 76,031 7.94% 6 (0.00%) 0.00%
Total
Income****48,802 193,905 47,532 6.58% 4 2.67%
Interest
Income41,478 175,923 40,223 6.41% 4 3.12%
Net Profit/ loss
after Taxes21,650 65,057 13,113 8.40% 3 65.10%
15.31%
15.84%
13.96%
10.96%
4.77%
4.50%
29.91%
2.68%
0.00% 20.00% 40.00% 60.00% 80.00% 100.00%
Equity to Assets
Liquidity
Capital Adequacy
Tier 1
Net Interest Margin
ROA
ROE
Non PerformingLoans/Total Loans
0
500,000
1,000,000
1,500,000
2,000,000
2,500,000
3,000,000
Assets LoanPortfolio
Liabilities Deposits TotalEquity
ShareCapital
As of 31.03.2017
As of 31.03.2016
0
20,000
40,000
60,000
80,000
100,000
Total Income Interest Income Net Profit/ loss afterTaxes
As of 31.03.2017
As of 31.03.2016
9© 2017 KPMG Georgia LLC, a company incorporated under the Laws of Georgia, a member firm of the KPMG network of
independent member firms affiliated with KPMG International Cooperative (“KPMG International”), a Swiss entity. All rights
reserved.
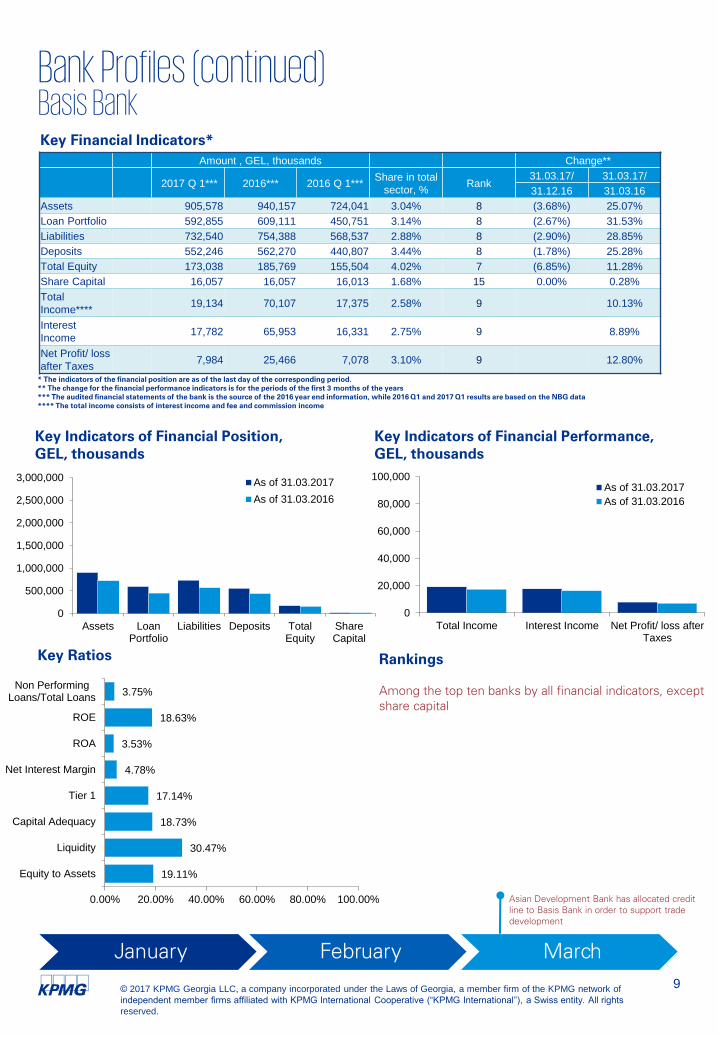
Bank Profiles (continued)Basis BankKey Financial Indicators*
Key RatiosRankings
Among the top ten banks by all financial indicators, except
share capital
January February March
* The indicators of the financial position are as of the last day of the corresponding period.
** The change for the financial performance indicators is for the periods of the first 3 months of the years
*** The audited financial statements of the bank is the source of the 2016 year end information, while 2016 Q1 and 2017 Q1 results are based on the NBG data
**** The total income consists of interest income and fee and commission income
Key Indicators of Financial Performance,
GEL, thousands
Key Indicators of Financial Position,
GEL, thousands
Amount , GEL, thousands Change**
2017 Q 1*** 2016*** 2016 Q 1*** Share in total
sector, %Rank
31.03.17/ 31.03.17/
31.12.16 31.03.16
Assets 905,578 940,157 724,041 3.04% 8 (3.68%) 25.07%
Loan Portfolio 592,855 609,111 450,751 3.14% 8 (2.67%) 31.53%
Liabilities 732,540 754,388 568,537 2.88% 8 (2.90%) 28.85%
Deposits 552,246 562,270 440,807 3.44% 8 (1.78%) 25.28%
Total Equity 173,038 185,769 155,504 4.02% 7 (6.85%) 11.28%
Share Capital 16,057 16,057 16,013 1.68% 15 0.00% 0.28%
Total
Income****19,134 70,107 17,375 2.58% 9 10.13%
Interest
Income17,782 65,953 16,331 2.75% 9 8.89%
Net Profit/ loss
after Taxes7,984 25,466 7,078 3.10% 9 12.80%
Asian Development Bank has allocated credit
line to Basis Bank in order to support trade
development
19.11%
30.47%
18.73%
17.14%
4.78%
3.53%
18.63%
3.75%
0.00% 20.00% 40.00% 60.00% 80.00% 100.00%
Equity to Assets
Liquidity
Capital Adequacy
Tier 1
Net Interest Margin
ROA
ROE
Non PerformingLoans/Total Loans
0
500,000
1,000,000
1,500,000
2,000,000
2,500,000
3,000,000
Assets LoanPortfolio
Liabilities Deposits TotalEquity
ShareCapital
As of 31.03.2017
As of 31.03.2016
0
20,000
40,000
60,000
80,000
100,000
Total Income Interest Income Net Profit/ loss afterTaxes
As of 31.03.2017
As of 31.03.2016

10© 2017 KPMG Georgia LLC, a company incorporated under the Laws of Georgia, a member firm of the KPMG network of
independent member firms affiliated with KPMG International Cooperative (“KPMG International”), a Swiss entity. All rights
reserved.
Amount , GEL, thousands Change**
2017 Q 1*** 2016*** 2016 Q 1*** Share in total
sector, %Rank
31.03.17/ 31.03.17/
31.12.16 31.03.16
Assets 1,179,169 1,420,363 1,205,163 3.96% 7 (1.14%) (2.16%)
Loan Portfolio 834,862 937,005 904,980 4.42% 6 1.24% (7.75%)
Liabilities 981,514 1,142,170 981,155 3.86% 7 7.11% 0.04%
Deposits 627,908 747,610 620,893 3.91% 7 5.01% 1.13%
Total Equity 197,655 278,193 224,008 4.59% 4 (28.49%) (11.76%)
Share Capital 114,430 114,430 114,430 11.95% 3 0.00% 0.00%
Total
Income****22,869 116,311 24,942 3.08% 7 (8.31%)
Interest
Income21,618 108,902 23,566 3.34% 7 (8.26%)
Net Profit/ loss
after Taxes5,394 75,252 6,342 2.09% 8 (14.95%)
Bank Profiles (continued)Cartu BankKey Financial Indicators*
Key RatiosRankings
January February March
* The indicators of the financial position are as of the last day of the corresponding period.
** The change for the financial performance indicators is for the periods of the first 3 months of the years
*** The audited financial statements of the bank is the source of the 2016 year end information, while 2016 Q1 and 2017 Q1 results are based on the NBG data
**** The total income consists of interest income and fee and commission income
Key Indicators of Financial Performance,
GEL, thousands
Key Indicators of Financial Position,
GEL, thousands
Rankings
3rd
rank by the Share Capital
4th
rank by the Total Equity
Among the top ten banks by all financial indicators, except
share capital
16.76%
28.96%
28.33%
14.43%
4.26%
1.77%
11.20%
29.29%
0.00% 20.00% 40.00% 60.00% 80.00% 100.00%
Equity to Assets
Liquidity
Capital Adequacy
Tier 1
Net Interest Margin
ROA
ROE
Non PerformingLoans/Total Loans
0
500,000
1,000,000
1,500,000
2,000,000
2,500,000
3,000,000
Assets LoanPortfolio
Liabilities Deposits TotalEquity
ShareCapital
As of 31.03.2017
As of 31.03.2016
0
20,000
40,000
60,000
80,000
100,000
Total Income Interest Income Net Profit/ lossafter Taxes
As of 31.03.2017As of 31.03.2016
11© 2017 KPMG Georgia LLC, a company incorporated under the Laws of Georgia, a member firm of the KPMG network of
independent member firms affiliated with KPMG International Cooperative (“KPMG International”), a Swiss entity. All rights
reserved.
Key Indicators of Financial Performance,
GEL, thousands
Amount , GEL, thousands Change**
2017 Q 1*** 2016*** 2016 Q 1*** Share in total
sector, %Rank
31.03.17/ 31.03.17/
31.12.16 31.03.16
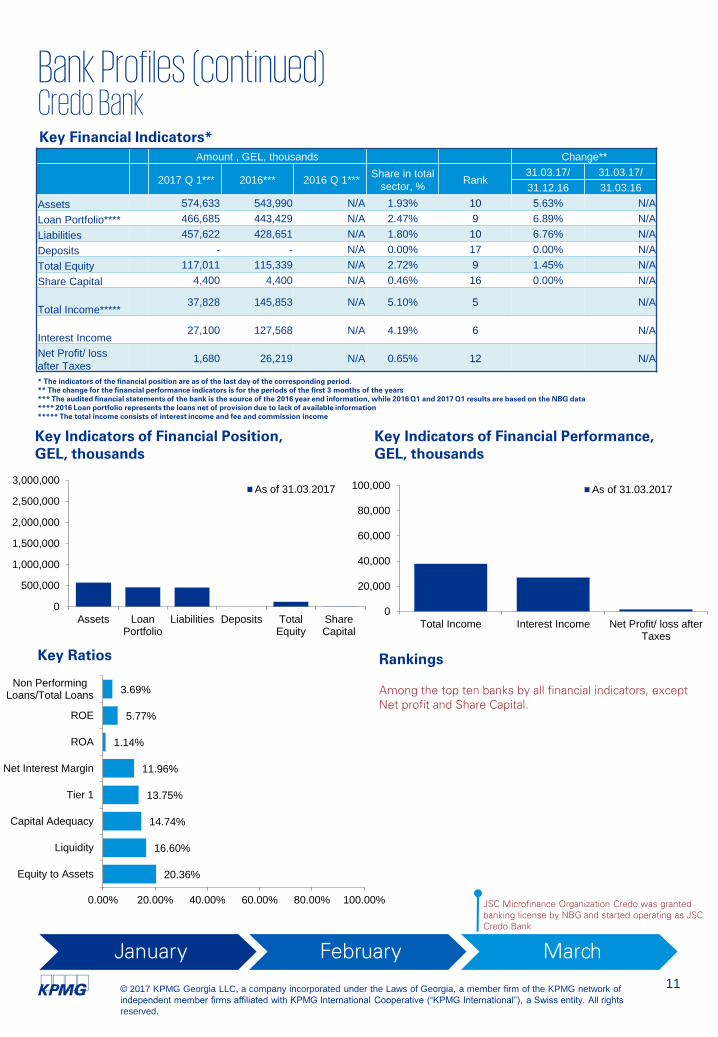
Assets 574,633 543,990 N/A 1.93% 10 5.63% N/A
Loan Portfolio**** 466,685 443,429 N/A 2.47% 9 6.89% N/A
Liabilities 457,622 428,651 N/A 1.80% 10 6.76% N/A
Deposits - - N/A 0.00% 17 0.00% N/A
Total Equity 117,011 115,339 N/A 2.72% 9 1.45% N/A
Share Capital 4,400 4,400 N/A 0.46% 16 0.00% N/A
Total Income*****37,828 145,853 N/A 5.10% 5 N/A
Interest Income27,100 127,568 N/A 4.19% 6 N/A
Net Profit/ loss
after Taxes1,680 26,219 N/A 0.65% 12 N/A
Bank Profiles (continued)Credo BankKey Financial Indicators*
Key RatiosRankings
Among the top ten banks by all financial indicators, except
Net profit and Share Capital.
January February March
* The indicators of the financial position are as of the last day of the corresponding period.
** The change for the financial performance indicators is for the periods of the first 3 months of the years
*** The audited financial statements of the bank is the source of the 2016 year end information, while 2016 Q1 and 2017 Q1 results are based on the NBG data
**** 2016 Loan portfolio represents the loans net of provision due to lack of available information
***** The total income consists of interest income and fee and commission income
Key Indicators of Financial Position,
GEL, thousands
20.36%
16.60%
14.74%
13.75%
11.96%
1.14%
5.77%
3.69%
0.00% 20.00% 40.00% 60.00% 80.00% 100.00%
Equity to Assets
Liquidity
Capital Adequacy
Tier 1
Net Interest Margin
ROA
ROE
Non PerformingLoans/Total Loans
0
500,000
1,000,000
1,500,000
2,000,000
2,500,000
3,000,000
Assets LoanPortfolio
Liabilities Deposits TotalEquity
ShareCapital
As of 31.03.2017
0
20,000
40,000
60,000
80,000
100,000
Total Income Interest Income Net Profit/ loss afterTaxes
As of 31.03.2017
JSC Microfinance Organization Credo was granted
banking license by NBG and started operating as JSC
Credo Bank
12© 2017 KPMG Georgia LLC, a company incorporated under the Laws of Georgia, a member firm of the KPMG network of
independent member firms affiliated with KPMG International Cooperative (“KPMG International”), a Swiss entity. All rights
reserved.
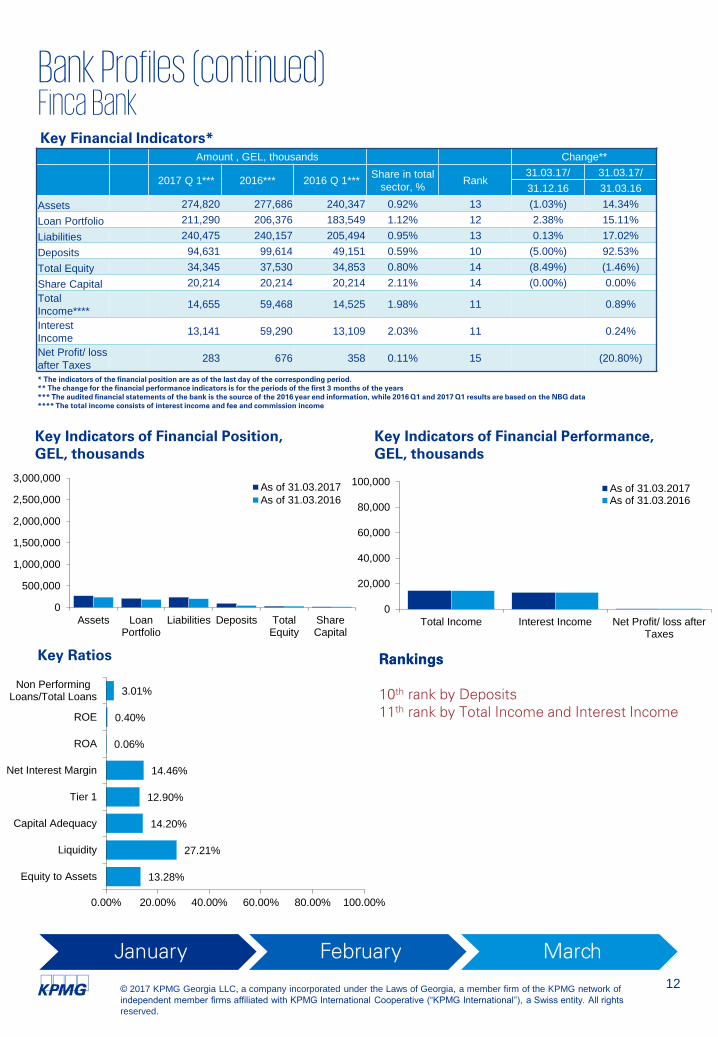
13.28%
27.21%
14.20%
12.90%
14.46%
0.06%
0.40%
3.01%
0.00% 20.00% 40.00% 60.00% 80.00% 100.00%
Equity to Assets
Liquidity
Capital Adequacy
Tier 1
Net Interest Margin
ROA
ROE
Non PerformingLoans/Total Loans
Amount , GEL, thousands Change**
2017 Q 1*** 2016*** 2016 Q 1*** Share in total
sector, %Rank
31.03.17/ 31.03.17/
31.12.16 31.03.16
Assets 274,820 277,686 240,347 0.92% 13 (1.03%) 14.34%
Loan Portfolio 211,290 206,376 183,549 1.12% 12 2.38% 15.11%
Liabilities 240,475 240,157 205,494 0.95% 13 0.13% 17.02%
Deposits 94,631 99,614 49,151 0.59% 10 (5.00%) 92.53%
Total Equity 34,345 37,530 34,853 0.80% 14 (8.49%) (1.46%)
Share Capital 20,214 20,214 20,214 2.11% 14 (0.00%) 0.00%
Total
Income****14,655 59,468 14,525 1.98% 11 0.89%
Interest
Income13,141 59,290 13,109 2.03% 11 0.24%
Net Profit/ loss
after Taxes283 676 358 0.11% 15 (20.80%)
Bank Profiles (continued)Finca BankKey Financial Indicators*
Key RatiosRankings
January February March
* The indicators of the financial position are as of the last day of the corresponding period.
** The change for the financial performance indicators is for the periods of the first 3 months of the years
*** The audited financial statements of the bank is the source of the 2016 year end information, while 2016 Q1 and 2017 Q1 results are based on the NBG data
**** The total income consists of interest income and fee and commission income
Key Indicators of Financial Performance,
GEL, thousands
Key Indicators of Financial Position,
GEL, thousands
Rankings
10th
rank by Deposits
11th
rank by Total Income and Interest Income
0
500,000
1,000,000
1,500,000
2,000,000
2,500,000
3,000,000
Assets LoanPortfolio
Liabilities Deposits TotalEquity
ShareCapital
As of 31.03.2017
As of 31.03.2016
0
20,000
40,000
60,000
80,000
100,000
Total Income Interest Income Net Profit/ loss afterTaxes
As of 31.03.2017As of 31.03.2016
13© 2017 KPMG Georgia LLC, a company incorporated under the Laws of Georgia, a member firm of the KPMG network of
independent member firms affiliated with KPMG International Cooperative (“KPMG International”), a Swiss entity. All rights
reserved.
Amount , GEL, thousands Change**
2017 Q 1*** 2016*** 2016 Q 1*** Share in total
sector, %Rank
31.03.17/ 31.03.17/
31.12.16 31.03.16
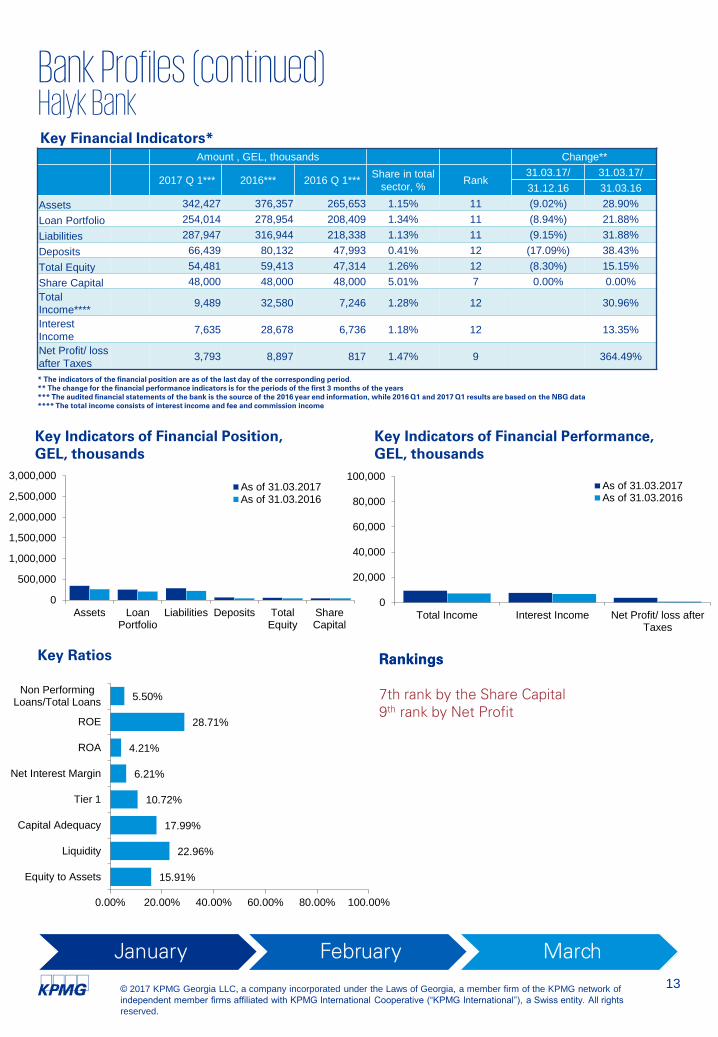
Assets 342,427 376,357 265,653 1.15% 11 (9.02%) 28.90%
Loan Portfolio 254,014 278,954 208,409 1.34% 11 (8.94%) 21.88%
Liabilities 287,947 316,944 218,338 1.13% 11 (9.15%) 31.88%
Deposits 66,439 80,132 47,993 0.41% 12 (17.09%) 38.43%
Total Equity 54,481 59,413 47,314 1.26% 12 (8.30%) 15.15%
Share Capital 48,000 48,000 48,000 5.01% 7 0.00% 0.00%
Total
Income****9,489 32,580 7,246 1.28% 12 30.96%
Interest
Income7,635 28,678 6,736 1.18% 12 13.35%
Net Profit/ loss
after Taxes3,793 8,897 817 1.47% 9 364.49%
Bank Profiles (continued)Halyk BankKey Financial Indicators*
Key RatiosRankings
January February March
* The indicators of the financial position are as of the last day of the corresponding period.
** The change for the financial performance indicators is for the periods of the first 3 months of the years
*** The audited financial statements of the bank is the source of the 2016 year end information, while 2016 Q1 and 2017 Q1 results are based on the NBG data
**** The total income consists of interest income and fee and commission income
Key Indicators of Financial Performance,
GEL, thousands
Key Indicators of Financial Position,
GEL, thousands
Rankings
7th rank by the Share Capital
9th
rank by Net Profit
15.91%
22.96%
17.99%
10.72%
6.21%
4.21%
28.71%
5.50%
0.00% 20.00% 40.00% 60.00% 80.00% 100.00%
Equity to Assets
Liquidity
Capital Adequacy
Tier 1
Net Interest Margin
ROA
ROE
Non PerformingLoans/Total Loans
0
500,000
1,000,000
1,500,000
2,000,000
2,500,000
3,000,000
Assets LoanPortfolio
Liabilities Deposits TotalEquity
ShareCapital
As of 31.03.2017As of 31.03.2016
0
20,000
40,000
60,000
80,000
100,000
Total Income Interest Income Net Profit/ loss afterTaxes
As of 31.03.2017As of 31.03.2016
14© 2017 KPMG Georgia LLC, a company incorporated under the Laws of Georgia, a member firm of the KPMG network of
independent member firms affiliated with KPMG International Cooperative (“KPMG International”), a Swiss entity. All rights
reserved.
Amount , GEL, thousands Change**
2017 Q 1*** 2016*** 2016 Q 1*** Share in total
sector, %Rank
31.03.17/ 31.03.17/
31.12.16 31.03.16
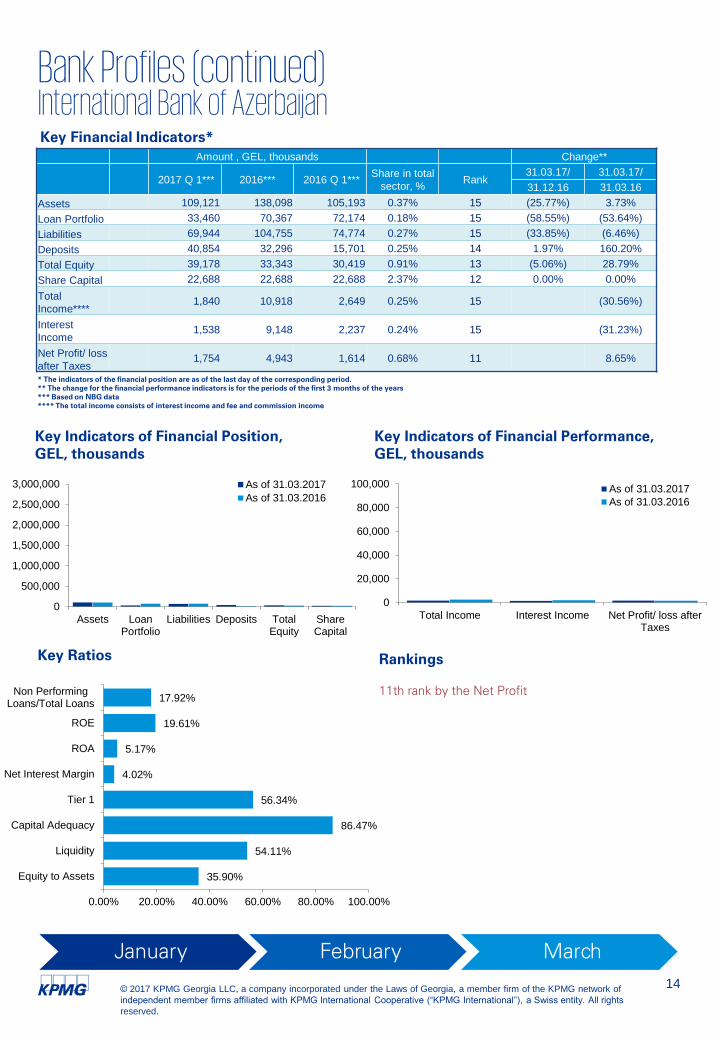
Assets 109,121 138,098 105,193 0.37% 15 (25.77%) 3.73%
Loan Portfolio 33,460 70,367 72,174 0.18% 15 (58.55%) (53.64%)
Liabilities 69,944 104,755 74,774 0.27% 15 (33.85%) (6.46%)
Deposits 40,854 32,296 15,701 0.25% 14 1.97% 160.20%
Total Equity 39,178 33,343 30,419 0.91% 13 (5.06%) 28.79%
Share Capital 22,688 22,688 22,688 2.37% 12 0.00% 0.00%
Total
Income****1,840 10,918 2,649 0.25% 15 (30.56%)
Interest
Income1,538 9,148 2,237 0.24% 15 (31.23%)
Net Profit/ loss
after Taxes1,754 4,943 1,614 0.68% 11 8.65%
Bank Profiles (continued)International Bank of AzerbaijanKey Financial Indicators*
Key RatiosRankings
11th rank by the Net Profit
January February March
* The indicators of the financial position are as of the last day of the corresponding period.
** The change for the financial performance indicators is for the periods of the first 3 months of the years
*** Based on NBG data
**** The total income consists of interest income and fee and commission income
Key Indicators of Financial Performance,
GEL, thousands
Key Indicators of Financial Position,
GEL, thousands
35.90%
54.11%
86.47%
56.34%
4.02%
5.17%
19.61%
17.92%
0.00% 20.00% 40.00% 60.00% 80.00% 100.00%
Equity to Assets
Liquidity
Capital Adequacy
Tier 1
Net Interest Margin
ROA
ROE
Non PerformingLoans/Total Loans
0
500,000
1,000,000
1,500,000
2,000,000
2,500,000
3,000,000
Assets LoanPortfolio
Liabilities Deposits TotalEquity
ShareCapital
As of 31.03.2017
As of 31.03.2016
0
20,000
40,000
60,000
80,000
100,000
Total Income Interest Income Net Profit/ loss afterTaxes
As of 31.03.2017
As of 31.03.2016
15© 2017 KPMG Georgia LLC, a company incorporated under the Laws of Georgia, a member firm of the KPMG network of
independent member firms affiliated with KPMG International Cooperative (“KPMG International”), a Swiss entity. All rights
reserved.
Amount , GEL, thousands Change**
2017 Q 1*** 2016*** 2016 Q 1*** Share in total
sector, %Rank
31.03.17/ 31.03.17/
31.12.16 31.03.16
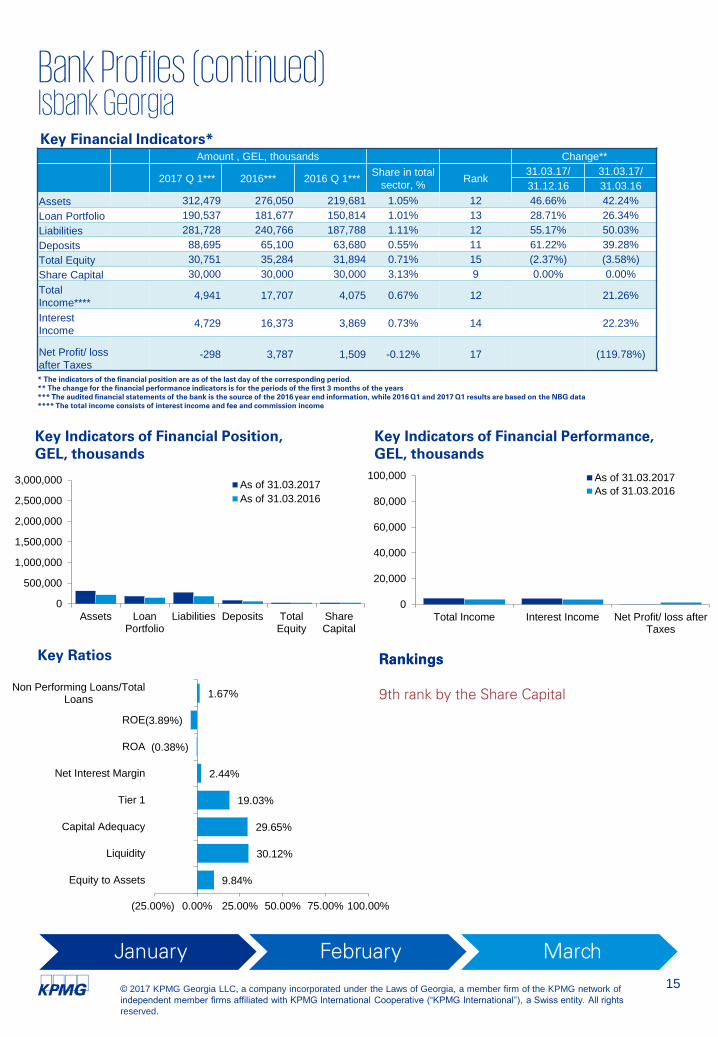
Assets 312,479 276,050 219,681 1.05% 12 46.66% 42.24%
Loan Portfolio 190,537 181,677 150,814 1.01% 13 28.71% 26.34%
Liabilities 281,728 240,766 187,788 1.11% 12 55.17% 50.03%
Deposits 88,695 65,100 63,680 0.55% 11 61.22% 39.28%
Total Equity 30,751 35,284 31,894 0.71% 15 (2.37%) (3.58%)
Share Capital 30,000 30,000 30,000 3.13% 9 0.00% 0.00%
Total
Income****4,941 17,707 4,075 0.67% 12 21.26%
Interest
Income4,729 16,373 3,869 0.73% 14 22.23%
Net Profit/ loss
after Taxes-298 3,787 1,509 -0.12% 17 (119.78%)
Bank Profiles (continued)Isbank GeorgiaKey Financial Indicators*
Key RatiosRankings
January February March
* The indicators of the financial position are as of the last day of the corresponding period.
** The change for the financial performance indicators is for the periods of the first 3 months of the years
*** The audited financial statements of the bank is the source of the 2016 year end information, while 2016 Q1 and 2017 Q1 results are based on the NBG data
**** The total income consists of interest income and fee and commission income
Key Indicators of Financial Performance,
GEL, thousands
Key Indicators of Financial Position,
GEL, thousands
Rankings
9th rank by the Share Capital
9.84%
30.12%
29.65%
19.03%
2.44%
(0.38%)
(3.89%)
1.67%
(25.00%) 0.00% 25.00% 50.00% 75.00% 100.00%
Equity to Assets
Liquidity
Capital Adequacy
Tier 1
Net Interest Margin
ROA
ROE
Non Performing Loans/TotalLoans
0
500,000
1,000,000
1,500,000
2,000,000
2,500,000
3,000,000
Assets LoanPortfolio
Liabilities Deposits TotalEquity
ShareCapital
As of 31.03.2017
As of 31.03.2016
0
20,000
40,000
60,000
80,000
100,000
Total Income Interest Income Net Profit/ loss afterTaxes
As of 31.03.2017
As of 31.03.2016

16© 2017 KPMG Georgia LLC, a company incorporated under the Laws of Georgia, a member firm of the KPMG network of
independent member firms affiliated with KPMG International Cooperative (“KPMG International”), a Swiss entity. All rights
reserved.
Amount , GEL, thousands Change**
2017 Q 1*** 2016*** 2016 Q 1*** Share in total
sector, %Rank
31.03.17/ 31.03.17/
31.12.16 31.03.16
Assets 1,613,923 1,613,085 1,531,461 5.42% 4 0.05% 5.38%
Loan Portfolio 774,692 704,564 711,394 4.10% 7 9.95% 8.90%
Liabilities 1,417,959 1,427,854 1,393,447 5.57% 4 (0.69%) 1.76%
Deposits 1,239,678 1,292,053 1,228,100 7.70% 3 (4.05%) 0.94%
Total Equity 195,964 185,231 156,362 4.55% 5 5.79% 25.33%
Share Capital 43,840 54,233 43,840 4.58% 8 (19.16%) 0.00%
Total
Income****80,701 297,746 70,314 7.93% 3 14.77%
Interest
Income61,665 270,146 57,605 9.19% 3 7.05%
Net Profit/ loss
after Taxes9,717 47,714 4,343 3.77% 5 123.76%
Bank Profiles (continued)Liberty BankKey Financial Indicators*
Key Ratios Rankings
January February March
* The indicators of the financial position are as of the last day of the corresponding period.
** The change for the financial performance indicators is for the periods of the first 3 months of the years
*** The audited financial statements of the bank is the source of the 2016 year end information, while 2016 Q1 and 2017 Q1 results are based on the NBG data
**** The total income consists of interest income and fee and commission income
Key Indicators of Financial Performance,
GEL, thousands
Key Indicators of Financial Position,
GEL, thousands
Rankings
Among the top ten banks by all financial indicators
0
500,000
1,000,000
1,500,000
2,000,000
2,500,000
3,000,000
Assets LoanPortfolio
Liabilities Deposits TotalEquity
ShareCapital
As of 31.03.2017
As of 31.03.2016
0
20,000
40,000
60,000
80,000
100,000
Total Income Interest Income Net Profit/ loss afterTaxes
As of 31.03.2017As of 31.03.2016
12.14%
44.67%
23.99%
15.25%
8.22%
2.36%
20.16%
10.29%
0.00% 20.00% 40.00% 60.00% 80.00% 100.00%
Equity to Assets
Liquidity
Capital Adequacy
Tier 1
Net Interest Margin
ROA
ROE
Non PerformingLoans/Total Loans
17© 2017 KPMG Georgia LLC, a company incorporated under the Laws of Georgia, a member firm of the KPMG network of
independent member firms affiliated with KPMG International Cooperative (“KPMG International”), a Swiss entity. All rights
reserved.
Key Indicators of Financial Performance,
GEL, thousands
Amount , GEL, thousands Change**
2017 Q 1*** 2016*** 2016 Q 1*** Share in total
sector, %Rank
31.03.17/ 31.03.17/
31.12.16 31.03.16
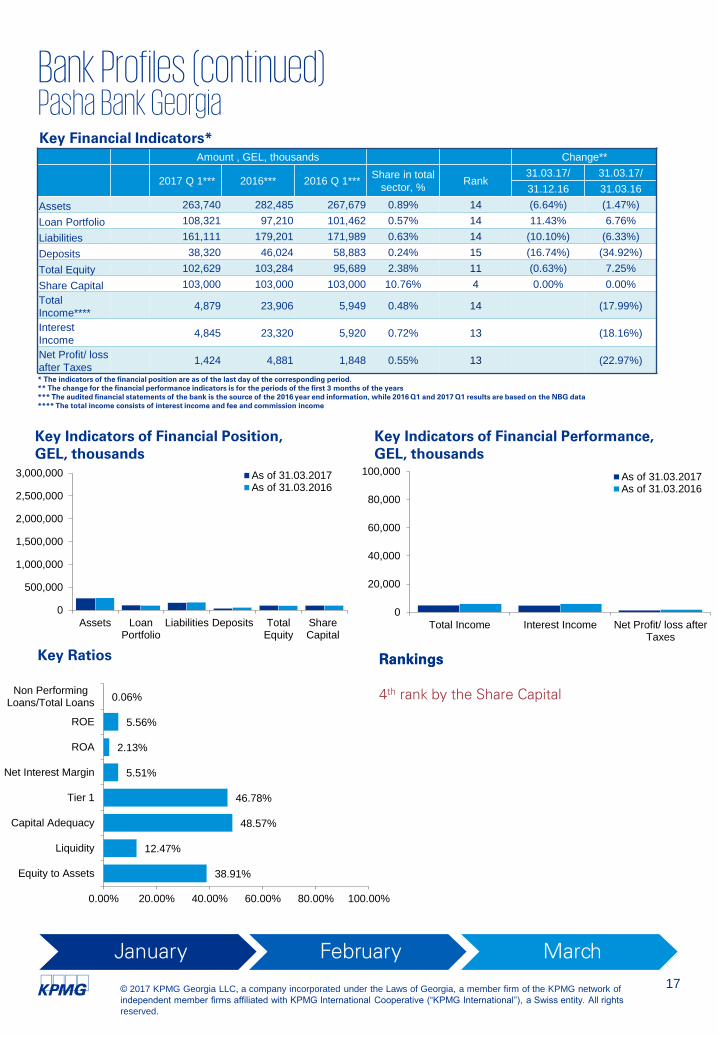
Assets 263,740 282,485 267,679 0.89% 14 (6.64%) (1.47%)
Loan Portfolio 108,321 97,210 101,462 0.57% 14 11.43% 6.76%
Liabilities 161,111 179,201 171,989 0.63% 14 (10.10%) (6.33%)
Deposits 38,320 46,024 58,883 0.24% 15 (16.74%) (34.92%)
Total Equity 102,629 103,284 95,689 2.38% 11 (0.63%) 7.25%
Share Capital 103,000 103,000 103,000 10.76% 4 0.00% 0.00%
Total
Income****4,879 23,906 5,949 0.48% 14 (17.99%)
Interest
Income4,845 23,320 5,920 0.72% 13 (18.16%)
Net Profit/ loss
after Taxes1,424 4,881 1,848 0.55% 13 (22.97%)
Bank Profiles (continued)Pasha Bank GeorgiaKey Financial Indicators*
Key RatiosRankings
January February March
* The indicators of the financial position are as of the last day of the corresponding period.
** The change for the financial performance indicators is for the periods of the first 3 months of the years
*** The audited financial statements of the bank is the source of the 2016 year end information, while 2016 Q1 and 2017 Q1 results are based on the NBG data
**** The total income consists of interest income and fee and commission income
Key Indicators of Financial Position,
GEL, thousands
Rankings
4th
rank by the Share Capital
0
500,000
1,000,000
1,500,000
2,000,000
2,500,000
3,000,000
Assets LoanPortfolio
Liabilities Deposits TotalEquity
ShareCapital
As of 31.03.2017As of 31.03.2016
0
20,000
40,000
60,000
80,000
100,000
Total Income Interest Income Net Profit/ loss afterTaxes
As of 31.03.2017As of 31.03.2016
38.91%
12.47%
48.57%
46.78%
5.51%
2.13%
5.56%
0.06%
0.00% 20.00% 40.00% 60.00% 80.00% 100.00%
Equity to Assets
Liquidity
Capital Adequacy
Tier 1
Net Interest Margin
ROA
ROE
Non PerformingLoans/Total Loans
18© 2017 KPMG Georgia LLC, a company incorporated under the Laws of Georgia, a member firm of the KPMG network of
independent member firms affiliated with KPMG International Cooperative (“KPMG International”), a Swiss entity. All rights
reserved.
Amount , GEL, thousands Change**
2017 Q 1*** 2016*** 2016 Q 1*** Share in total
sector, %Rank
31.03.17/ 31.03.17/
31.12.16 31.03.16
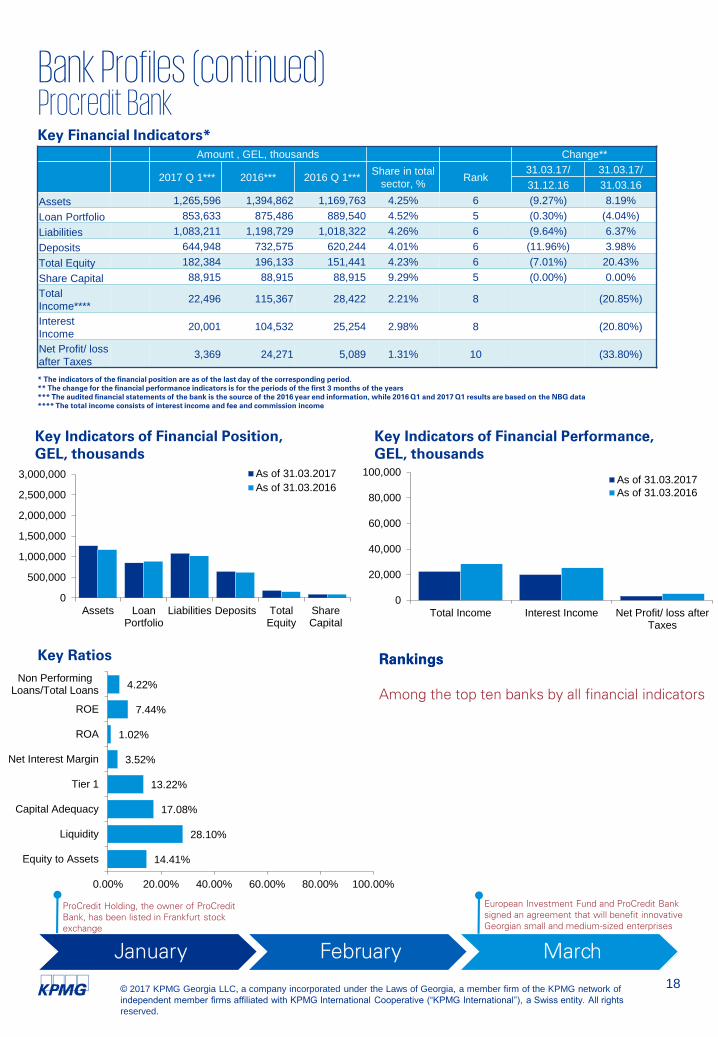
Assets 1,265,596 1,394,862 1,169,763 4.25% 6 (9.27%) 8.19%
Loan Portfolio 853,633 875,486 889,540 4.52% 5 (0.30%) (4.04%)
Liabilities 1,083,211 1,198,729 1,018,322 4.26% 6 (9.64%) 6.37%
Deposits 644,948 732,575 620,244 4.01% 6 (11.96%) 3.98%
Total Equity 182,384 196,133 151,441 4.23% 6 (7.01%) 20.43%
Share Capital 88,915 88,915 88,915 9.29% 5 (0.00%) 0.00%
Total
Income****22,496 115,367 28,422 2.21% 8 (20.85%)
Interest
Income20,001 104,532 25,254 2.98% 8 (20.80%)
Net Profit/ loss
after Taxes3,369 24,271 5,089 1.31% 10 (33.80%)
Bank Profiles (continued)Procredit BankKey Financial Indicators*
Key RatiosRankings
January February March
* The indicators of the financial position are as of the last day of the corresponding period.
** The change for the financial performance indicators is for the periods of the first 3 months of the years
*** The audited financial statements of the bank is the source of the 2016 year end information, while 2016 Q1 and 2017 Q1 results are based on the NBG data
**** The total income consists of interest income and fee and commission income
Key Indicators of Financial Performance,
GEL, thousands
Key Indicators of Financial Position,
GEL, thousands
Rankings
Among the top ten banks by all financial indicators
0
500,000
1,000,000
1,500,000
2,000,000
2,500,000
3,000,000
Assets LoanPortfolio
Liabilities Deposits TotalEquity
ShareCapital
As of 31.03.2017
As of 31.03.2016
0
20,000
40,000
60,000
80,000
100,000
Total Income Interest Income Net Profit/ loss afterTaxes
As of 31.03.2017
As of 31.03.2016
14.41%
28.10%
17.08%
13.22%
3.52%
1.02%
7.44%
4.22%
0.00% 20.00% 40.00% 60.00% 80.00% 100.00%
Equity to Assets
Liquidity
Capital Adequacy
Tier 1
Net Interest Margin
ROA
ROE
Non PerformingLoans/Total Loans
European Investment Fund and ProCredit Bank
signed an agreement that will benefit innovative
Georgian small and medium-sized enterprises
ProCredit Holding, the owner of ProCredit
Bank, has been listed in Frankfurt stock
exchange
19© 2017 KPMG Georgia LLC, a company incorporated under the Laws of Georgia, a member firm of the KPMG network of
independent member firms affiliated with KPMG International Cooperative (“KPMG International”), a Swiss entity. All rights
reserved.
Rankings
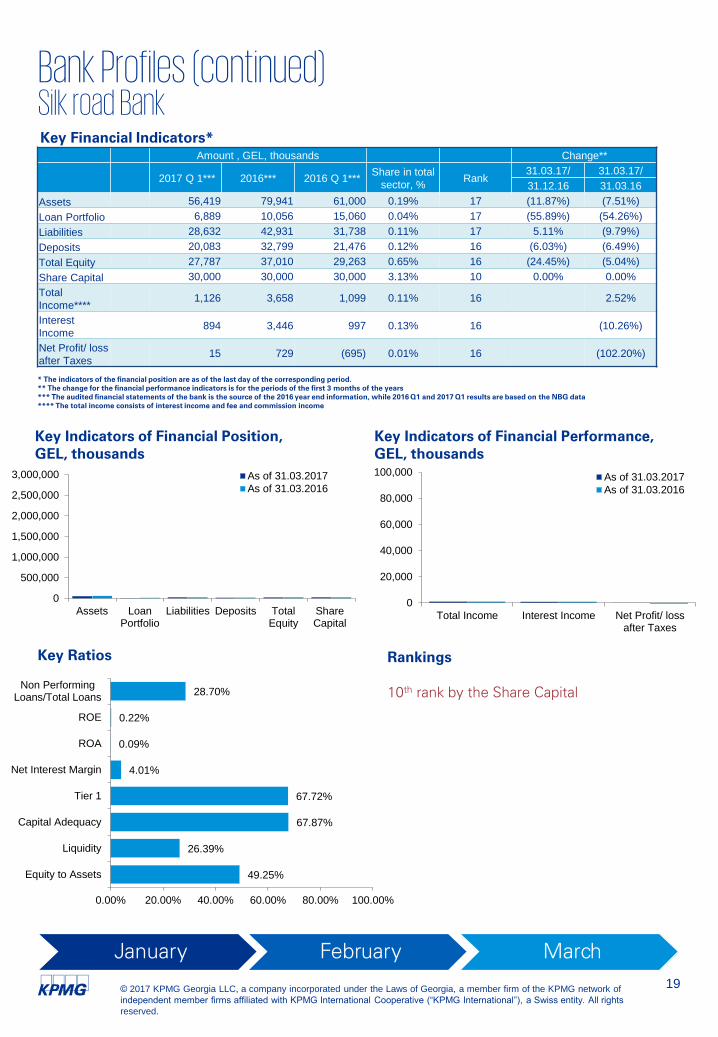
10th
rank by the Share Capital
Amount , GEL, thousands Change**
2017 Q 1*** 2016*** 2016 Q 1*** Share in total
sector, %Rank
31.03.17/ 31.03.17/
31.12.16 31.03.16
Assets 56,419 79,941 61,000 0.19% 17 (11.87%) (7.51%)
Loan Portfolio 6,889 10,056 15,060 0.04% 17 (55.89%) (54.26%)
Liabilities 28,632 42,931 31,738 0.11% 17 5.11% (9.79%)
Deposits 20,083 32,799 21,476 0.12% 16 (6.03%) (6.49%)
Total Equity 27,787 37,010 29,263 0.65% 16 (24.45%) (5.04%)
Share Capital 30,000 30,000 30,000 3.13% 10 0.00% 0.00%
Total
Income****1,126 3,658 1,099 0.11% 16 2.52%
Interest
Income894 3,446 997 0.13% 16 (10.26%)
Net Profit/ loss
after Taxes15 729 (695) 0.01% 16 (102.20%)
Bank Profiles (continued)Silk road BankKey Financial Indicators*
Key Ratios
January February March
* The indicators of the financial position are as of the last day of the corresponding period.
** The change for the financial performance indicators is for the periods of the first 3 months of the years
*** The audited financial statements of the bank is the source of the 2016 year end information, while 2016 Q1 and 2017 Q1 results are based on the NBG data
**** The total income consists of interest income and fee and commission income
Key Indicators of Financial Performance,
GEL, thousands
Key Indicators of Financial Position,
GEL, thousands
0
500,000
1,000,000
1,500,000
2,000,000
2,500,000
3,000,000
Assets LoanPortfolio
Liabilities Deposits TotalEquity
ShareCapital
As of 31.03.2017
As of 31.03.2016
0
20,000
40,000
60,000
80,000
100,000
Total Income Interest Income Net Profit/ lossafter Taxes
As of 31.03.2017
As of 31.03.2016
49.25%
26.39%
67.87%
67.72%
4.01%
0.09%
0.22%
28.70%
0.00% 20.00% 40.00% 60.00% 80.00% 100.00%
Equity to Assets
Liquidity
Capital Adequacy
Tier 1
Net Interest Margin
ROA
ROE
Non PerformingLoans/Total Loans

20© 2017 KPMG Georgia LLC, a company incorporated under the Laws of Georgia, a member firm of the KPMG network of
independent member firms affiliated with KPMG International Cooperative (“KPMG International”), a Swiss entity. All rights
reserved.
Amount , GEL, thousands Change**
2017 Q 1*** 2016*** 2016 Q 1*** Share in total
sector, %Rank
31.03.17/ 31.03.17/
31.12.16 31.03.16
Assets 8,899,743 10,761,759 6,365,523 29.91% 2 (17.30%) 39.81%
Loan Portfolio 5,717,023 7,358,725 4,495,146 30.27% 2 (22.31%) 27.18%
Liabilities 7,419,602 9,189,970 5,243,996 29.16% 2 (19.26%) 41.49%
Deposits 5,373,705 6,461,582 3,885,951 33.38% 1 (16.84%) 38.29%
Total Equity 1,480,141 1,571,789 1,121,527 34.36% 1 (5.83%) 31.98%
Share Capital 21,016 20,617 20,022 2.20% 13 1.93% 4.96%
Total
Income****221,063 909,212 188,512 21.71% 2 17.27%
Interest
Income174,730 766,410 157,172 26.03% 2 11.17%
Net Profit/ loss
after Taxes66,517 299,685 36,707 25.80% 2 81.21%
Bank Profiles (continued)TBCKey Financial Indicators*
Key Ratios
January February March
* The indicators of the financial position are as of the last day of the corresponding period.
** The change for the financial performance indicators is for the periods of the first 3 months of the years
*** The audited financial statements of the bank is the source of the 2016 year end information, while 2016 Q1 and 2017 Q1 results are based on the NBG data
**** The total income consists of interest income and fee and commission income
Key Indicators of Financial Performance,
GEL, thousands
Key Indicators of Financial Position,
GEL, thousands
Rankings
2nd
rank by the assets
2nd
rank by the loan portfolio
2nd
rank by the liabilities
1st
rank by the deposits
1st
rank by the equity
2nd
rank by the net profit after tax
2nd
rank by the total income
2nd
rank by the interest income
13th
rank by the share capital
TBC Bank appointed new Chief
Risk Officer David Chkonia
0
2,000,000
4,000,000
6,000,000
8,000,000
10,000,000
Assets LoanPortfolio
Liabilities Deposits TotalEquity
ShareCapital
As of 31.03.2017As of 31.03.2016
0
50,000
100,000
150,000
200,000
250,000
300,000
Total Income Interest Income Net Profit/ loss afterTaxes
As of 31.03.2017As of 31.03.2016
16.63%
17.55%
15.09%
14.04%
4.44%
2.96%
18.38%
4.09%
0.00% 20.00% 40.00% 60.00% 80.00% 100.00%
Equity to Assets
Liquidity
Capital Adequacy
Tier 1
Net Interest Margin
ROA
ROE
Non PerformingLoans/Total Loans
The Global Finance has named
TBC Bank as Georgia’s Best
Bank for the tenth time
21© 2017 KPMG Georgia LLC, a company incorporated under the Laws of Georgia, a member firm of the KPMG network of
independent member firms affiliated with KPMG International Cooperative (“KPMG International”), a Swiss entity. All rights
reserved.
Amount , GEL, thousands Change**
2017 Q 1*** 2016*** 2016 Q 1*** Share in total
sector, %Rank
31.03.17/ 31.03.17/
31.12.16 31.03.16
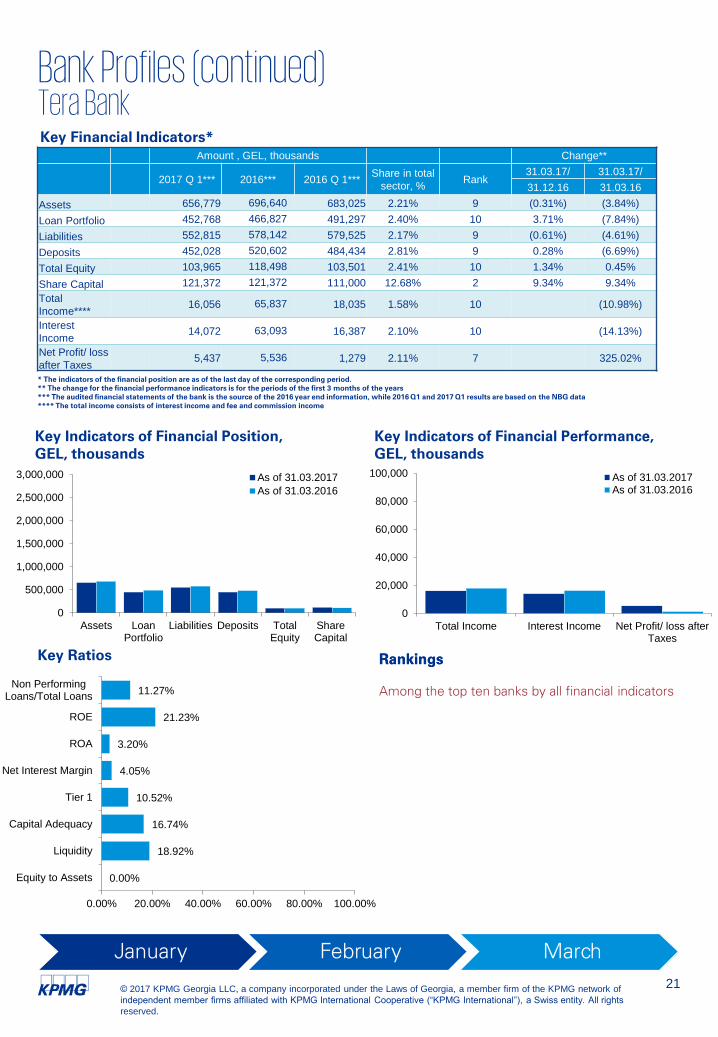
Assets 656,779 696,640 683,025 2.21% 9 (0.31%) (3.84%)
Loan Portfolio 452,768 466,827 491,297 2.40% 10 3.71% (7.84%)
Liabilities 552,815 578,142 579,525 2.17% 9 (0.61%) (4.61%)
Deposits 452,028 520,602 484,434 2.81% 9 0.28% (6.69%)
Total Equity 103,965 118,498 103,501 2.41% 10 1.34% 0.45%
Share Capital 121,372 121,372 111,000 12.68% 2 9.34% 9.34%
Total
Income****16,056 65,837 18,035 1.58% 10 (10.98%)
Interest
Income14,072 63,093 16,387 2.10% 10 (14.13%)
Net Profit/ loss
after Taxes5,437 5,536 1,279 2.11% 7 325.02%
Bank Profiles (continued)Tera BankKey Financial Indicators*
Key RatiosRankings
January February March
* The indicators of the financial position are as of the last day of the corresponding period.
** The change for the financial performance indicators is for the periods of the first 3 months of the years
*** The audited financial statements of the bank is the source of the 2016 year end information, while 2016 Q1 and 2017 Q1 results are based on the NBG data
**** The total income consists of interest income and fee and commission income
Key Indicators of Financial Performance,
GEL, thousands
Key Indicators of Financial Position,
GEL, thousands
Rankings
Among the top ten banks by all financial indicators
0
500,000
1,000,000
1,500,000
2,000,000
2,500,000
3,000,000
Assets LoanPortfolio
Liabilities Deposits TotalEquity
ShareCapital
As of 31.03.2017
As of 31.03.2016
0
20,000
40,000
60,000
80,000
100,000
Total Income Interest Income Net Profit/ loss afterTaxes
As of 31.03.2017As of 31.03.2016
0.00%
18.92%
16.74%
10.52%
4.05%
3.20%
21.23%
11.27%
0.00% 20.00% 40.00% 60.00% 80.00% 100.00%
Equity to Assets
Liquidity
Capital Adequacy
Tier 1
Net Interest Margin
ROA
ROE
Non PerformingLoans/Total Loans
22© 2017 KPMG Georgia LLC, a company incorporated under the Laws of Georgia, a member firm of the KPMG network of
independent member firms affiliated with KPMG International Cooperative (“KPMG International”), a Swiss entity. All rights
reserved.
Amount , GEL, thousands Change**
2017 Q 1*** 2016*** 2016 Q 1*** Share in total
sector, %Rank
31.03.17/ 31.03.17/
31.12.16 31.03.16
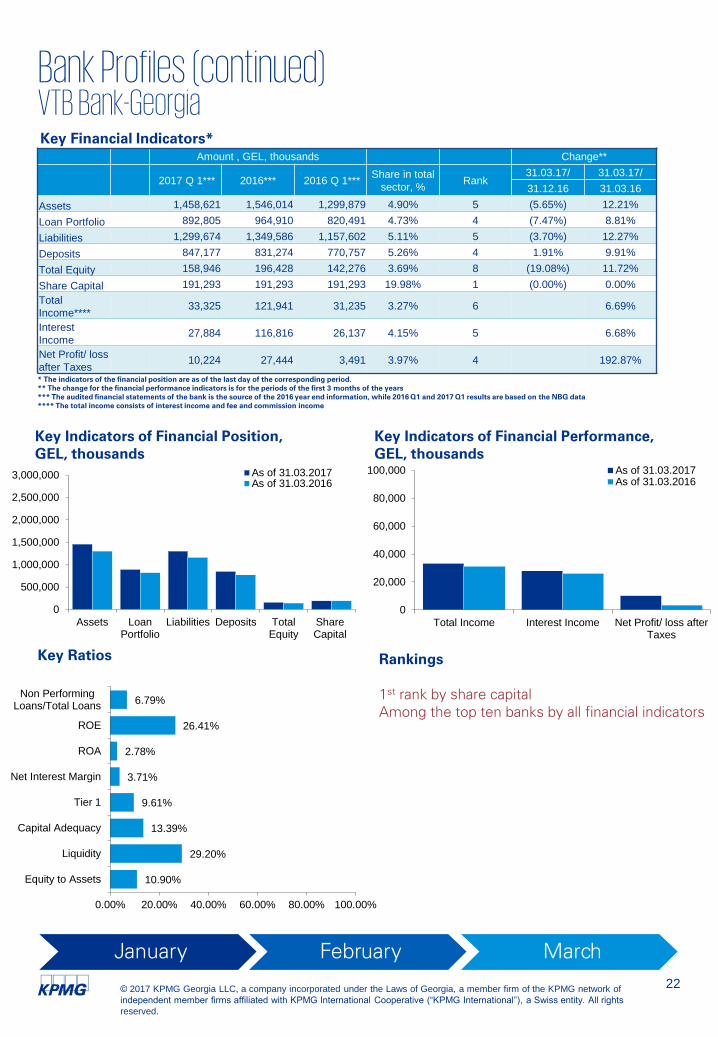
Assets 1,458,621 1,546,014 1,299,879 4.90% 5 (5.65%) 12.21%
Loan Portfolio 892,805 964,910 820,491 4.73% 4 (7.47%) 8.81%
Liabilities 1,299,674 1,349,586 1,157,602 5.11% 5 (3.70%) 12.27%
Deposits 847,177 831,274 770,757 5.26% 4 1.91% 9.91%
Total Equity 158,946 196,428 142,276 3.69% 8 (19.08%) 11.72%
Share Capital 191,293 191,293 191,293 19.98% 1 (0.00%) 0.00%
Total
Income****33,325 121,941 31,235 3.27% 6 6.69%
Interest
Income27,884 116,816 26,137 4.15% 5 6.68%
Net Profit/ loss
after Taxes10,224 27,444 3,491 3.97% 4 192.87%
Bank Profiles (continued)VTB Bank-GeorgiaKey Financial Indicators*
Key Ratios
January February March
* The indicators of the financial position are as of the last day of the corresponding period.
** The change for the financial performance indicators is for the periods of the first 3 months of the years
*** The audited financial statements of the bank is the source of the 2016 year end information, while 2016 Q1 and 2017 Q1 results are based on the NBG data
**** The total income consists of interest income and fee and commission income
Key Indicators of Financial Performance,
GEL, thousands
Key Indicators of Financial Position,
GEL, thousands
Rankings
1st
rank by share capital
Among the top ten banks by all financial indicators
0
500,000
1,000,000
1,500,000
2,000,000
2,500,000
3,000,000
Assets LoanPortfolio
Liabilities Deposits TotalEquity
ShareCapital
As of 31.03.2017As of 31.03.2016
0
20,000
40,000
60,000
80,000
100,000
Total Income Interest Income Net Profit/ loss afterTaxes
As of 31.03.2017As of 31.03.2016
10.90%
29.20%
13.39%
9.61%
3.71%
2.78%
26.41%
6.79%
0.00% 20.00% 40.00% 60.00% 80.00% 100.00%
Equity to Assets
Liquidity
Capital Adequacy
Tier 1
Net Interest Margin
ROA
ROE
Non PerformingLoans/Total Loans

23© 2017 KPMG Georgia LLC, a company incorporated under the Laws of Georgia, a member firm of the KPMG network of
independent member firms affiliated with KPMG International Cooperative (“KPMG International”), a Swiss entity. All rights
reserved.
Bank Profiles (continued)Ziraat Bankasi A.S. Tbilisi BranchKey Financial Indicators*
Key RatiosRankings
January February March
Key Indicators of Financial Performance,
GEL, thousands
Key Indicators of Financial Position,
GEL, thousands
Rankings
13th
rank by the Deposits
0
500,000
1,000,000
1,500,000
2,000,000
2,500,000
3,000,000
Assets LoanPortfolio
Liabilities Deposits TotalEquity
ShareCapital
As of 31.03.2017
As of 31.03.2016
0
20,000
40,000
60,000
80,000
100,000
Total Income Interest Income Net Profit/ loss afterTaxes
As of 31.03.2017As of 31.03.2016
27.31%
74.90%
48.07%
46.36%
4.01%
2.57%
8.82%
4.17%
0.00% 20.00% 40.00% 60.00% 80.00% 100.00%
Equity to Assets
Liquidity
Capital Adequacy
Tier 1
Net Interest Margin
ROA
ROE
Non PerformingLoans/Total Loans
* The indicators of the financial position are as of the last day of the corresponding period.
** The change for the financial performance indicators is for the periods of the first 3 months of the years
*** The audited financial statements of the bank is the source of the 2016 year end information, while 2016 Q1 and 2017 Q1 results are based on the NBG data
**** No share capital as it represents a branch
***** The total income consists of interest income and fee and commission income
Amount , GEL, thousands Change**
2017 Q 1*** 2016*** 2016 Q 1*** Share in total
sector, %Rank
31.03.17/ 31.03.17/
31.12.16 31.03.16
Assets 80,952 67,353 62,346 0.27% 16 26.37% 29.84%
Loan Portfolio 16,351 15,562 12,742 0.09% 16 19.56% 28.33%
Liabilities 58,841 45,700 42,250 0.23% 16 32.44% 39.27%
Deposits 57,975 45,058 38,848 0.36% 13 40.39% 49.23%
Total Equity 22,111 21,653 20,096 0.51% 17 12.64% 10.03%
Share Capital**** N/A N/A N/A N/A N/A N/A N/A
Total Income****1,084 4,252 1,062 0.11% 17 2.07%
Interest Income832 3,033 815 0.12% 17 2.07%
Net Profit/ loss
after Taxes483 2,028 474 0.19% 14 1.84%

24© 2017 KPMG Georgia LLC, a company incorporated under the Laws of Georgia, a member firm of the KPMG network of
independent member firms affiliated with KPMG International Cooperative (“KPMG International”), a Swiss entity. All rights
reserved.
Appendix 1 Shareholding Structure & General Information
JSC Halyk Bank Georgia
List of Shareholders owning 1% and
more of issued capital:
JSC Halyk Bank of Kazakhstan-100%
List of bank beneficiaries, direct or
indirect holders of 5% or more of
shares:
Timur Kulibayev 36.77%
Dinara Kulibayeva 36.77%
Branches and Service centers : 5
Staff: 150-200
JSC Basisbank
Shareholders owning 1% and more
of issued capital:
Xinjiang HuaLing Industry & Trade
(Group) Co LTD 92.30%
Zaiqi Mi 6.97%
List of bank beneficiaries, direct or
indirect holders of 5% or more of
shares:
Enhua Mi 92.22%
Zaiqi Mi 6.97%
Branches and Service centers : 21
Staff: 348 employees
JSC Bank Republic
List of Shareholders owning 1% and
more of issued capital:
TBC Bank – 100%
List of bank beneficiaries, direct or
indirect holders of 5% or more of
shares:
N/A
JSC Isbank Georgia
List of Shareholders owning 1% and
more of issued capital:
Turkey Is Bank 100.00%
List of bank beneficiaries, direct or
indirect holders of 5% or more of
shares:
Turkıye Is Bankası A,S, Employees
Pensıon Fund 40.15%
Turkey Republıcan People's Party
28.09%
Branches and Service centers : 2
Staff: 37
JSC FINCA Bank Georgia
List of Shareholders owning 1% and
more of issued capital:
FINCA Microfinance Coöperatief U.A.
(Netherlands) 100%
List of bank beneficiaries, direct or
indirect holders of 5% or more of
shares:
FINCA Microfinance Holding Company
LLC 100 Voting right of FINCA
Microfinance Coöperatief U.A.
FINCA International, Inc. (New York,
USA) 62.64%
IFC 14.38%
KfW 8.94%
FMO 7.31%
Branches and Service centers : 39
Staff: 701 employees
JSC International Bank of
Azerbaijan- Georgia
List of Shareholders owning 1% and
more of issued capital:
OJSC International Bank of Azerbaijan
75.00%
OJSC Azerbaijan Industry Bank 12.50%
Natia Chkhartishvili 6.25%
Mikheil Chkhartishvili 6.25%
List of bank beneficiaries, direct or
indirect holders of 5% or more of
shares:
State Committee of State Property of
Azerbaijan Republic 71.33%
Leyla Gozal Kurt 7.07%
Natia Chkhartishvili 6.25%
Mikheil Chkhartishvili 6.25%
Branches and Service centers : 1
Staff: 11-50
JSC Bank of Georgia
List of Shareholders owning 1% and
more of issued capital:
BGEO Group 99.51%
List of bank beneficiaries, direct or
indirect holders of 5% or more of
shares:
Harding Loevner Management LP
8.09%
Branches and Service centers: 273
Staff: 4693 employees
JSC CARTU BANK
List of Shareholders owning 1% and
more of issued capital:
Jsc Cartu Group 100%
List of bank beneficiaries, direct or
indirect holders of 5% or more of
shares:
Uta Ivanishvili 100%
Branches and Service centers : 9
Staff: 201- 500 employees
JSC Credo Bank
List of Shareholders owning 1% and more
of issued capital:
Access Microfinance Holding AG – 60.2%Triodos Custody B.V., Triodos Fair Share Fund– 9.9%Triodos SICAV II, Triodos Microfinance Fund – 9.9%responsAbility Participations AG – 9.34%responsAbility Management Company S.A., responsAbility Global Microfinance Fund (Luxembourg) – 8.79%responsAbility SICAV (Lux) -responsAbility SICAV (Lux) Microfinance Leaders Fund – 1.87%
List of bank beneficiaries, direct or
indirect holders of 5% or more of shares:
CDC Group PLC (UK) - 7.57%European Investment Bank (Luxembourg) - 7.57%nternational Finance Corporation (USA) -7.57%LFS Financial Systems GmbH (Germany) -10.22%Omidyar Tufts Microfinance Fund (USA) -9.83%Dr. Bernd Zattler (Germany) - 6.13%
Branches and Service centers: 62
Staff: 1749
The shareholding structure of the Georgian banks is diverse. There are both resident and non-
resident shareholders. Meanwhile, almost in all the Georgian banks non-resident shareholders are
presented.
The shareholding structure and information on branches and the staff for each bank is presented
below.
25© 2017 KPMG Georgia LLC, a company incorporated under the Laws of Georgia, a member firm of the KPMG network of
independent member firms affiliated with KPMG International Cooperative (“KPMG International”), a Swiss entity. All rights
reserved.
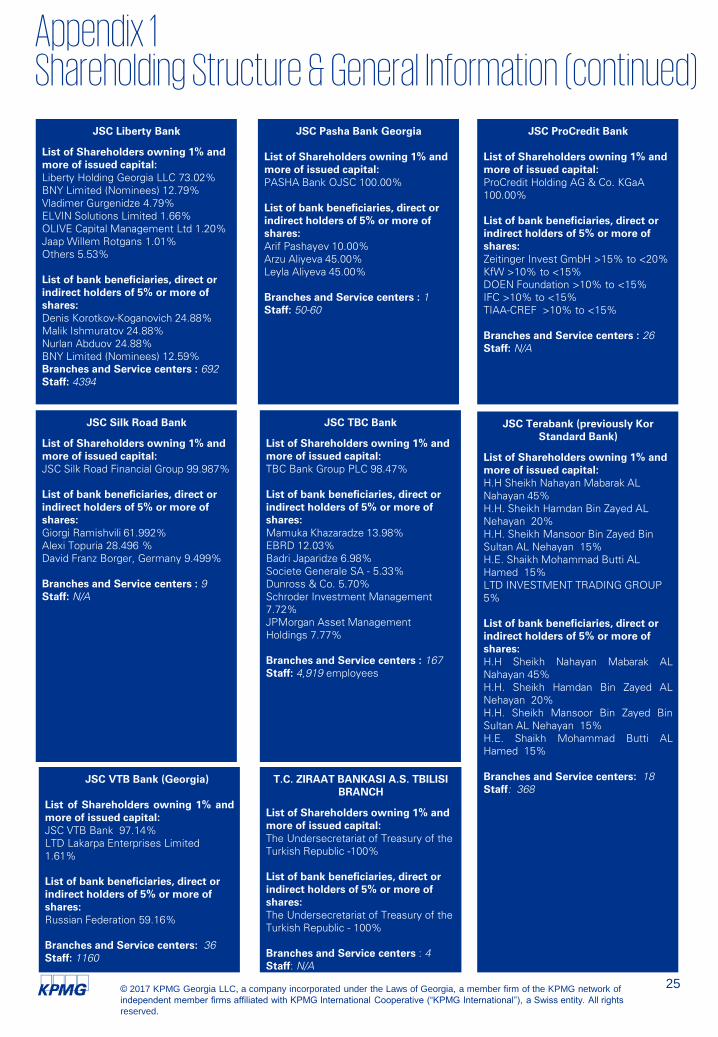
Appendix 1 Shareholding Structure & General Information (continued)
JSC ProCredit Bank
List of Shareholders owning 1% and
more of issued capital:
ProCredit Holding AG & Co. KGaA
100.00%
List of bank beneficiaries, direct or
indirect holders of 5% or more of
shares:
Zeitinger Invest GmbH >15% to <20%
KfW >10% to <15%
DOEN Foundation >10% to <15%
IFC >10% to <15%
TIAA-CREF >10% to <15%
Branches and Service centers : 26
Staff: N/A
JSC Pasha Bank Georgia
List of Shareholders owning 1% and
more of issued capital:
PASHA Bank OJSC 100.00%
List of bank beneficiaries, direct or
indirect holders of 5% or more of
shares:
Arif Pashayev 10.00%
Arzu Aliyeva 45.00%
Leyla Aliyeva 45.00%
Branches and Service centers : 1
Staff: 50-60
JSC Liberty Bank
List of Shareholders owning 1% and
more of issued capital:
Liberty Holding Georgia LLC 73.02%
BNY Limited (Nominees) 12.79%
Vladimer Gurgenidze 4.79%
ELVIN Solutions Limited 1.66%
OLIVE Capital Management Ltd 1.20%
Jaap Willem Rotgans 1.01%
Others 5.53%
List of bank beneficiaries, direct or
indirect holders of 5% or more of
shares:
Denis Korotkov-Koganovich 24.88%
Malik Ishmuratov 24.88%
Nurlan Abduov 24.88%
BNY Limited (Nominees) 12.59%
Branches and Service centers : 692
Staff: 4394
JSC Silk Road Bank
List of Shareholders owning 1% and
more of issued capital:
JSC Silk Road Financial Group 99.987%
List of bank beneficiaries, direct or
indirect holders of 5% or more of
shares:
Giorgi Ramishvili 61.992%
Alexi Topuria 28.496 %
David Franz Borger, Germany 9.499%
Branches and Service centers : 9
Staff: N/A
JSC TBC Bank
List of Shareholders owning 1% and
more of issued capital:
TBC Bank Group PLC 98.47%
List of bank beneficiaries, direct or
indirect holders of 5% or more of
shares:
Mamuka Khazaradze 13.98%
EBRD 12.03%
Badri Japaridze 6.98%
Societe Generale SA - 5.33%
Dunross & Co. 5.70%
Schroder Investment Management
7.72%
JPMorgan Asset Management
Holdings 7.77%
Branches and Service centers : 167
Staff: 4,919 employees
JSC Terabank (previously Kor
Standard Bank)
List of Shareholders owning 1% and
more of issued capital:
H.H Sheikh Nahayan Mabarak AL
Nahayan 45%
H.H. Sheikh Hamdan Bin Zayed AL
Nehayan 20%
H.H. Sheikh Mansoor Bin Zayed Bin
Sultan AL Nehayan 15%
H.E. Shaikh Mohammad Butti AL
Hamed 15%
LTD INVESTMENT TRADING GROUP
5%
List of bank beneficiaries, direct or
indirect holders of 5% or more of
shares:
H.H Sheikh Nahayan Mabarak AL
Nahayan 45%
H.H. Sheikh Hamdan Bin Zayed AL
Nehayan 20%
H.H. Sheikh Mansoor Bin Zayed Bin
Sultan AL Nehayan 15%
H.E. Shaikh Mohammad Butti AL
Hamed 15%
Branches and Service centers: 18
Staff: 368
JSC VTB Bank (Georgia)
List of Shareholders owning 1% and
more of issued capital:
JSC VTB Bank 97.14%
LTD Lakarpa Enterprises Limited
1.61%
List of bank beneficiaries, direct or
indirect holders of 5% or more of
shares:
Russian Federation 59.16%
Branches and Service centers: 36
Staff: 1160
T.C. ZIRAAT BANKASI A.S. TBILISI
BRANCH
List of Shareholders owning 1% and
more of issued capital:
The Undersecretariat of Treasury of the
Turkish Republic -100%
List of bank beneficiaries, direct or
indirect holders of 5% or more of
shares:
The Undersecretariat of Treasury of the
Turkish Republic - 100%
Branches and Service centers : 4
Staff: N/A

26© 2017 KPMG Georgia LLC, a company incorporated under the Laws of Georgia, a member firm of the KPMG network of
independent member firms affiliated with KPMG International Cooperative (“KPMG International”), a Swiss entity. All rights
reserved.
Appendix 2
Sector InsightsAssets
As of 31 March 2017 the assets grew in almost all the banks, and only four banks suffered decreases
as compared with the same period of 2016.
As of 31 March 2017 Bank of Georgia had the highest value of assets - about GEL 9.8 billion, which is
32.98% of the total assets of the banking sector. Silk Road Bank had the lowest level – GEL 0.056
billion (0.19% in total assets). It is worth mentioning that, as of 31 March 2017, the top two banks
(ranked by assets) held 62.89% of the assets of the banking system, while the top five banks held
79.76% of the total assets.
Loan portfolio
The total amount of loans issued at the end of the 1st
quarter of 2017 amounted to GEL 18.89 billion
(Q1 2016: GEL 16.03 billion). The major part of the loans was borrowed by households (53%), trade
(12%) and industry (11%), while education held only 1% of the total loans issued as of 31 March
2017.
As at 31 March 2017 the Herfindahl-Hirschman Index amounted to 2,135, which implies that the
Georgian banking sector is highly concentrated.
Structure of banks in Georgia by loan volume, Q1 2017
53%
2%
11%
5%
12%
3%
2% 3%
4%
0% 2%
3%Households
Agriculture, Forestry, Fishing
Industry
Construction
Trade
Hotels and Restaurants
Transport and Communications
Financial Intermediation
Transactions in Real Estates, Researches
Education
Health Care and Social Services
Other services
*Analysis is done based on Loans Net of Provision (NBG)
27© 2017 KPMG Georgia LLC, a company incorporated under the Laws of Georgia, a member firm of the KPMG network of
independent member firms affiliated with KPMG International Cooperative (“KPMG International”), a Swiss entity. All rights
reserved.
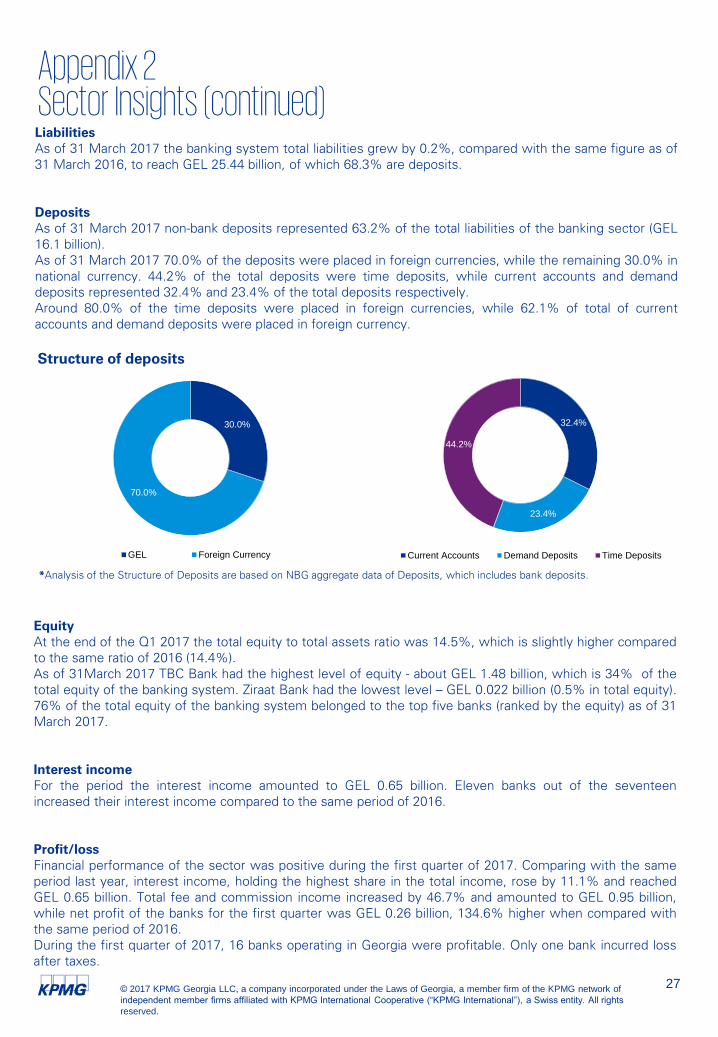
30.0%
70.0%
GEL Foreign Currency
*Analysis of the Structure of Deposits are based on NBG aggregate data of Deposits, which includes bank deposits.
Liabilities
As of 31 March 2017 the banking system total liabilities grew by 0.2%, compared with the same figure as of
31 March 2016, to reach GEL 25.44 billion, of which 68.3% are deposits.
Deposits
As of 31 March 2017 non-bank deposits represented 63.2% of the total liabilities of the banking sector (GEL
16.1 billion).
As of 31 March 2017 70.0% of the deposits were placed in foreign currencies, while the remaining 30.0% in
national currency. 44.2% of the total deposits were time deposits, while current accounts and demand
deposits represented 32.4% and 23.4% of the total deposits respectively.
Around 80.0% of the time deposits were placed in foreign currencies, while 62.1% of total of current
accounts and demand deposits were placed in foreign currency.
Appendix 2 Sector Insights (continued)
Structure of deposits
Equity
At the end of the Q1 2017 the total equity to total assets ratio was 14.5%, which is slightly higher compared
to the same ratio of 2016 (14.4%).
As of 31March 2017 TBC Bank had the highest level of equity - about GEL 1.48 billion, which is 34% of the
total equity of the banking system. Ziraat Bank had the lowest level – GEL 0.022 billion (0.5% in total equity).
76% of the total equity of the banking system belonged to the top five banks (ranked by the equity) as of 31
March 2017.
Interest income
For the period the interest income amounted to GEL 0.65 billion. Eleven banks out of the seventeen
increased their interest income compared to the same period of 2016.
Profit/loss
Financial performance of the sector was positive during the first quarter of 2017. Comparing with the same
period last year, interest income, holding the highest share in the total income, rose by 11.1% and reached
GEL 0.65 billion. Total fee and commission income increased by 46.7% and amounted to GEL 0.95 billion,
while net profit of the banks for the first quarter was GEL 0.26 billion, 134.6% higher when compared with
the same period of 2016.
During the first quarter of 2017, 16 banks operating in Georgia were profitable. Only one bank incurred loss
after taxes.
32.4%
23.4%
44.2%
Current Accounts Demand Deposits Time Deposits
28© 2017 KPMG Georgia LLC, a company incorporated under the Laws of Georgia, a member firm of the KPMG network of
independent member firms affiliated with KPMG International Cooperative (“KPMG International”), a Swiss entity. All rights
reserved.
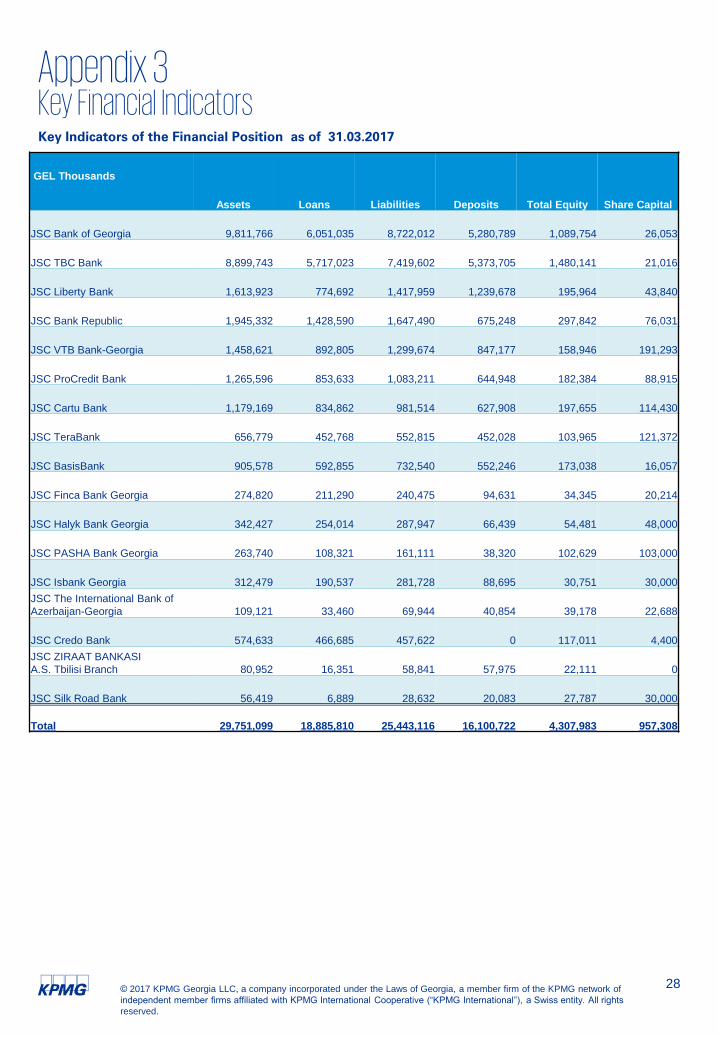
Appendix 3Key Financial IndicatorsKey Indicators of the Financial Position as of 31.03.2017
GEL Thousands
Assets Loans Liabilities Deposits Total Equity Share Capital
JSC Bank of Georgia 9,811,766 6,051,035 8,722,012 5,280,789 1,089,754 26,053
JSC TBC Bank 8,899,743 5,717,023 7,419,602 5,373,705 1,480,141 21,016
JSC Liberty Bank 1,613,923 774,692 1,417,959 1,239,678 195,964 43,840
JSC Bank Republic 1,945,332 1,428,590 1,647,490 675,248 297,842 76,031
JSC VTB Bank-Georgia 1,458,621 892,805 1,299,674 847,177 158,946 191,293
JSC ProCredit Bank 1,265,596 853,633 1,083,211 644,948 182,384 88,915
JSC Cartu Bank 1,179,169 834,862 981,514 627,908 197,655 114,430
JSC TeraBank 656,779 452,768 552,815 452,028 103,965 121,372
JSC BasisBank 905,578 592,855 732,540 552,246 173,038 16,057
JSC Finca Bank Georgia 274,820 211,290 240,475 94,631 34,345 20,214
JSC Halyk Bank Georgia 342,427 254,014 287,947 66,439 54,481 48,000
JSC PASHA Bank Georgia 263,740 108,321 161,111 38,320 102,629 103,000
JSC Isbank Georgia 312,479 190,537 281,728 88,695 30,751 30,000
JSC The International Bank of
Azerbaijan-Georgia 109,121 33,460 69,944 40,854 39,178 22,688
JSC Credo Bank 574,633 466,685 457,622 0 117,011 4,400
JSC ZIRAAT BANKASI
A.S. Tbilisi Branch 80,952 16,351 58,841 57,975 22,111 0
JSC Silk Road Bank 56,419 6,889 28,632 20,083 27,787 30,000
Total 29,751,099 18,885,810 25,443,116 16,100,722 4,307,983 957,308
29© 2017 KPMG Georgia LLC, a company incorporated under the Laws of Georgia, a member firm of the KPMG network of
independent member firms affiliated with KPMG International Cooperative (“KPMG International”), a Swiss entity. All rights
reserved.
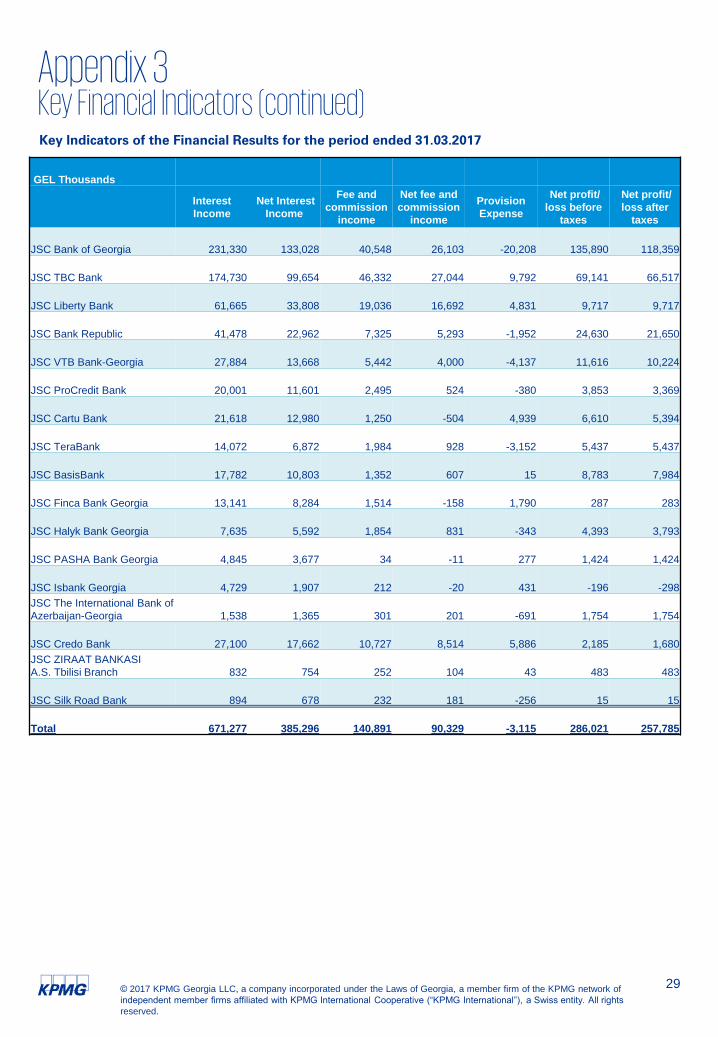
Appendix 3Key Financial Indicators (continued)Key Indicators of the Financial Results for the period ended 31.03.2017
GEL Thousands
Interest
Income
Net Interest
Income
Fee and
commission
income
Net fee and
commission
income
Provision
Expense
Net profit/
loss before
taxes
Net profit/
loss after
taxes
JSC Bank of Georgia 231,330 133,028 40,548 26,103 -20,208 135,890 118,359
JSC TBC Bank 174,730 99,654 46,332 27,044 9,792 69,141 66,517
JSC Liberty Bank 61,665 33,808 19,036 16,692 4,831 9,717 9,717
JSC Bank Republic 41,478 22,962 7,325 5,293 -1,952 24,630 21,650
JSC VTB Bank-Georgia 27,884 13,668 5,442 4,000 -4,137 11,616 10,224
JSC ProCredit Bank 20,001 11,601 2,495 524 -380 3,853 3,369
JSC Cartu Bank 21,618 12,980 1,250 -504 4,939 6,610 5,394
JSC TeraBank 14,072 6,872 1,984 928 -3,152 5,437 5,437
JSC BasisBank 17,782 10,803 1,352 607 15 8,783 7,984
JSC Finca Bank Georgia 13,141 8,284 1,514 -158 1,790 287 283
JSC Halyk Bank Georgia 7,635 5,592 1,854 831 -343 4,393 3,793
JSC PASHA Bank Georgia 4,845 3,677 34 -11 277 1,424 1,424
JSC Isbank Georgia 4,729 1,907 212 -20 431 -196 -298
JSC The International Bank of
Azerbaijan-Georgia 1,538 1,365 301 201 -691 1,754 1,754
JSC Credo Bank 27,100 17,662 10,727 8,514 5,886 2,185 1,680
JSC ZIRAAT BANKASI
A.S. Tbilisi Branch 832 754 252 104 43 483 483
JSC Silk Road Bank 894 678 232 181 -256 15 15
Total 671,277 385,296 140,891 90,329 -3,115 286,021 257,785

30© 2017 KPMG Georgia LLC, a company incorporated under the Laws of Georgia, a member firm of the KPMG network of
independent member firms affiliated with KPMG International Cooperative (“KPMG International”), a Swiss entity. All rights
reserved.
Appendix 3Key Financial Indicators (continued)Key Indicators of the Financial Position as of 31.03.2016
GEL Thousands
Assets Loans Liabilities Deposits Total Equity Share Capital
JSC Bank of Georgia 8,292,994 5,181,875 7,375,674 4,736,351 917,320 26,659
JSC TBC Bank 6,365,523 4,495,146 5,243,996 3,885,951 1,121,527 20,022
JSC Liberty Bank 1,531,461 711,394 1,393,447 1,228,100 156,362 43,840
JSC Bank Republic 1,654,097 1,219,492 1,409,512 743,987 244,584 76,031
JSC VTB Bank-Georgia 1,299,879 820,491 1,157,602 770,757 142,276 191,293
JSC ProCredit Bank 1,169,763 889,540 1,018,322 620,244 151,441 88,915
JSC Cartu Bank 1,205,163 904,980 981,155 620,893 224,008 114,430
JSC TeraBank 683,025 491,297 579,525 484,434 103,501 111,000
JSC BasisBank 724,041 450,751 568,537 440,807 155,504 16,013
JSC Finca Bank Georgia 240,347 183,549 205,494 49,151 34,853 20,214
JSC Halyk Bank Georgia 265,653 208,409 218,338 47,993 47,314 48,000
JSC PASHA Bank Georgia 267,679 101,462 171,989 58,883 95,689 103,000
JSC Isbank Georgia 219,681 150,814 187,788 63,680 31,894 30,000
JSC The International Bank of
Azerbaijan-Georgia 105,193 72,174 74,774 15,701 30,419 22,688
JSC ZIRAAT BANKASI
A.S. Tbilisi Branch 62,346 12,742 42,250 38,848 20,096 0
JSC Silk Road Bank 61,000 15,060 31,738 21,476 29,263 30,000
JSC Progress Bank* 243,087 89,186 228,120 135,529 14,967 17,475
JSC Capital Bank* 63,844 21,223 61,168 44,564 2,675 17,120
Total 24,454,775 16,019,586 20,949,428 14,007,348 3,523,695 976,699
* License For Banking Activity Cancelled during 2016
31© 2017 KPMG Georgia LLC, a company incorporated under the Laws of Georgia, a member firm of the KPMG network of
independent member firms affiliated with KPMG International Cooperative (“KPMG International”), a Swiss entity. All rights
reserved.
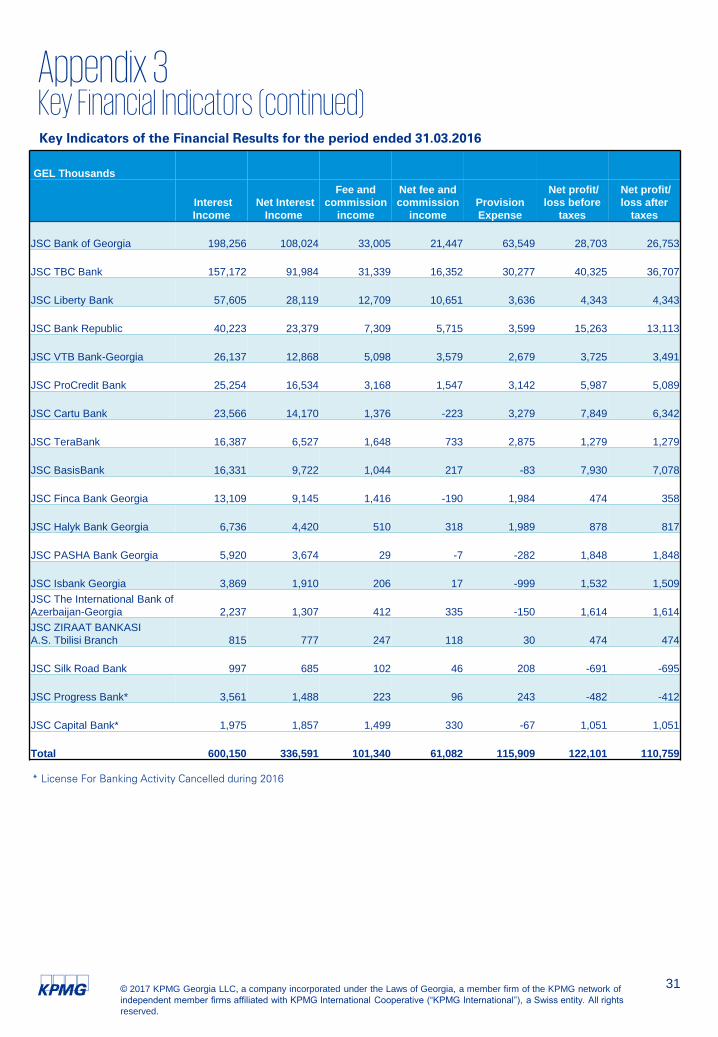
Appendix 3Key Financial Indicators (continued)Key Indicators of the Financial Results for the period ended 31.03.2016
GEL Thousands
Interest
Income
Net Interest
Income
Fee and
commission
income
Net fee and
commission
income
Provision
Expense
Net profit/
loss before
taxes
Net profit/
loss after
taxes
JSC Bank of Georgia 198,256 108,024 33,005 21,447 63,549 28,703 26,753
JSC TBC Bank 157,172 91,984 31,339 16,352 30,277 40,325 36,707
JSC Liberty Bank 57,605 28,119 12,709 10,651 3,636 4,343 4,343
JSC Bank Republic 40,223 23,379 7,309 5,715 3,599 15,263 13,113
JSC VTB Bank-Georgia 26,137 12,868 5,098 3,579 2,679 3,725 3,491
JSC ProCredit Bank 25,254 16,534 3,168 1,547 3,142 5,987 5,089
JSC Cartu Bank 23,566 14,170 1,376 -223 3,279 7,849 6,342
JSC TeraBank 16,387 6,527 1,648 733 2,875 1,279 1,279
JSC BasisBank 16,331 9,722 1,044 217 -83 7,930 7,078
JSC Finca Bank Georgia 13,109 9,145 1,416 -190 1,984 474 358
JSC Halyk Bank Georgia 6,736 4,420 510 318 1,989 878 817
JSC PASHA Bank Georgia 5,920 3,674 29 -7 -282 1,848 1,848
JSC Isbank Georgia 3,869 1,910 206 17 -999 1,532 1,509
JSC The International Bank of
Azerbaijan-Georgia 2,237 1,307 412 335 -150 1,614 1,614
JSC ZIRAAT BANKASI
A.S. Tbilisi Branch 815 777 247 118 30 474 474
JSC Silk Road Bank 997 685 102 46 208 -691 -695
JSC Progress Bank* 3,561 1,488 223 96 243 -482 -412
JSC Capital Bank* 1,975 1,857 1,499 330 -67 1,051 1,051
Total 600,150 336,591 101,340 61,082 115,909 122,101 110,759
* License For Banking Activity Cancelled during 2016
32© 2017 KPMG Georgia LLC, a company incorporated under the Laws of Georgia, a member firm of the KPMG network of
independent member firms affiliated with KPMG International Cooperative (“KPMG International”), a Swiss entity. All rights
reserved.
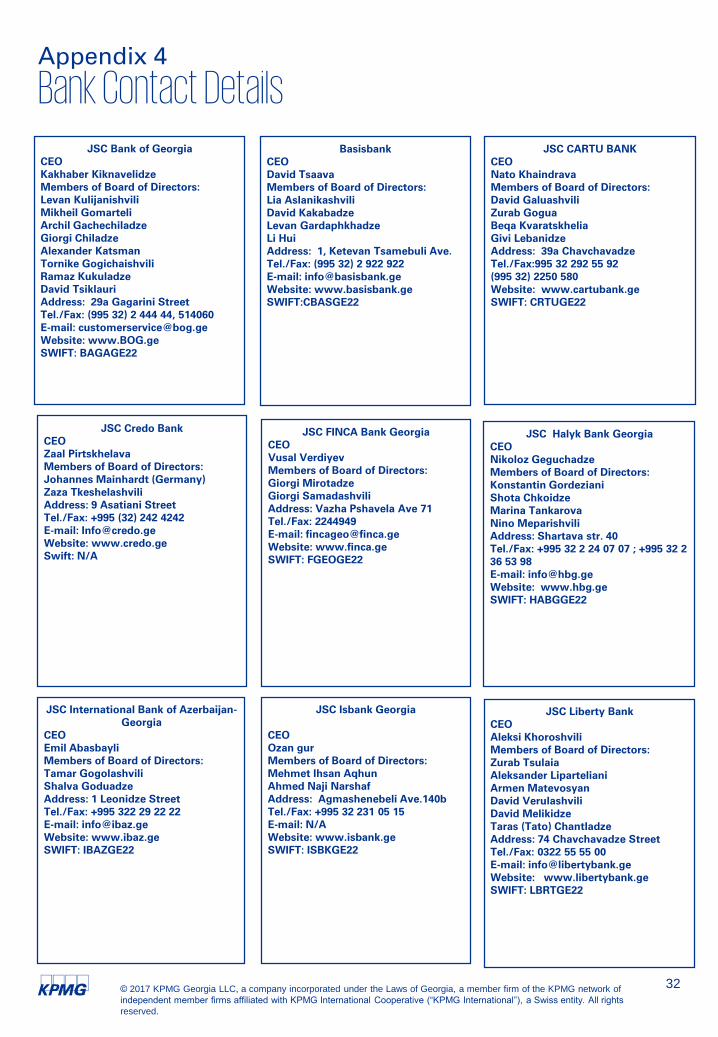
Appendix 4
Bank Contact Details
JSC Bank of Georgia
CEO
Kakhaber Kiknavelidze
Members of Board of Directors:
Levan Kulijanishvili
Mikheil Gomarteli
Archil Gachechiladze
Giorgi Chiladze
Alexander Katsman
Tornike Gogichaishvili
Ramaz Kukuladze
David Tsiklauri
Address: 29a Gagarini Street
Tel./Fax: (995 32) 2 444 44, 514060
E-mail: [email protected]
Website: www.BOG.ge
SWIFT: BAGAGE22
JSC Credo Bank
CEO
Zaal Pirtskhelava
Members of Board of Directors:
Johannes Mainhardt (Germany)
Zaza Tkeshelashvili
Address: 9 Asatiani Street
Tel./Fax: +995 (32) 242 4242
E-mail: [email protected]
Website: www.credo.ge
Swift: N/A
JSC CARTU BANK
CEO
Nato Khaindrava
Members of Board of Directors:
David Galuashvili
Zurab Gogua
Beqa Kvaratskhelia
Givi Lebanidze
Address: 39a Chavchavadze
Tel./Fax:995 32 292 55 92
(995 32) 2250 580
Website: www.cartubank.ge
SWIFT: CRTUGE22
JSC Liberty Bank
CEO
Aleksi Khoroshvili
Members of Board of Directors:
Zurab Tsulaia
Aleksander Liparteliani
Armen Matevosyan
David Verulashvili
David Melikidze
Taras (Tato) Chantladze
Address: 74 Chavchavadze Street
Tel./Fax: 0322 55 55 00
E-mail: [email protected]
Website: www.libertybank.ge
SWIFT: LBRTGE22
Basisbank
CEO
David Tsaava
Members of Board of Directors:
Lia Aslanikashvili
David Kakabadze
Levan Gardaphkhadze
Li Hui
Address: 1, Ketevan Tsamebuli Ave.
Tel./Fax: (995 32) 2 922 922
E-mail: [email protected]
Website: www.basisbank.ge
SWIFT:CBASGE22
JSC International Bank of Azerbaijan-
Georgia
CEO
Emil Abasbayli
Members of Board of Directors:
Tamar Gogolashvili
Shalva Goduadze
Address: 1 Leonidze Street
Tel./Fax: +995 322 29 22 22
E-mail: [email protected]
Website: www.ibaz.ge
SWIFT: IBAZGE22
JSC Halyk Bank Georgia
CEO
Nikoloz Geguchadze
Members of Board of Directors:
Konstantin Gordeziani
Shota Chkoidze
Marina Tankarova
Nino Meparishvili
Address: Shartava str. 40
Tel./Fax: +995 32 2 24 07 07 ; +995 32 2
36 53 98
E-mail: [email protected]
Website: www.hbg.ge
SWIFT: HABGGE22
JSC FINCA Bank Georgia
CEO
Vusal Verdiyev
Members of Board of Directors:
Giorgi Mirotadze
Giorgi Samadashvili
Address: Vazha Pshavela Ave 71
Tel./Fax: 2244949
E-mail: [email protected]
Website: www.finca.ge
SWIFT: FGEOGE22
JSC Isbank Georgia
CEO
Ozan gur
Members of Board of Directors:
Mehmet Ihsan Aqhun
Ahmed Naji Narshaf
Address: Agmashenebeli Ave.140b
Tel./Fax: +995 32 231 05 15
E-mail: N/A
Website: www.isbank.ge
SWIFT: ISBKGE22
33© 2017 KPMG Georgia LLC, a company incorporated under the Laws of Georgia, a member firm of the KPMG network of
independent member firms affiliated with KPMG International Cooperative (“KPMG International”), a Swiss entity. All rights
reserved.
Appendix 4
Bank Contact Details (continued)
JSC ProCredit Bank
CEO
Ketevan Khuskivadze
Members of Board of Directors:
Alex Matua
Davit Gabelashvili
Natia Tkhilaishvili
Address: 21 Al. Kazbegi Ave
Tel./Fax: (+995 32) 220 2222 (+995 32)
220 2223
E-mail: [email protected]
Website: www.procreditbank.ge
SWIFT: MIBGGE22
JSC Pasha Bank Georgia
CEO
Shahin Mammadov
Members of Board of Directors:
Chingiz Abdullayev
George Japaridze
Address: 15 Rustaveli Avenue
Tel./Fax: +995 32 215 88 11 +995 32
215 88 22
E-mail: [email protected]
Website: www.pashabank.ge
SWIFT: PAHAGE22
JSC Silk Road Bank
CEO
Alexander Dzneladze
Members of Board of Directors:
Natia Merabishvili
Adress: 2 Saarbrucken Square
Tel./Fax: ( +995 32 ) 224 22 42
( +995 32) 224 22 22
E-mail: [email protected]
Website: www.silkroadbank.ge
SWIFT: DISNGE22
JSC TBC bank
CEO
Vakhtang Butskhrikidze
Members of Board of Directors:
Paata Ghadzadze
Vano Baliashvili
Nino Masurashvili
Giorgi Tkhelidze
Giorgi Shagidze
David Chkonia
Nikoloz Kurdiani
Address: Marjanishvili Street 7
Tel./Fax: +(995 32) 227 27 27
E-mail: [email protected]
Website: www.tbcbank.ge
SWIFT: TBCBGE22
JSC Terabank (previously Kor
Standard Bank)
CEO
Thea Lortkipanidze
Members of Board of Directors:
Vakhtang Khutsishili
Zurab Azarashvili
Temur Abuladze
Sophia Jugeli
Address: 3. K.Tsamebuli Av.,0103
Tel. : +995 32 2 55 00 00
E-mail: [email protected]
Website: www.terabank.ge
SWIFT: TEBAGE2222
T.C. ZIRAAT BANKASI A.S. TBILISI
BRANCH
CEO
Mehmet Ucar
Members of Board of Directors
BOGACHAN SEFIK KARAMURSEL
HALUK CENGIZ
MURAT YILDIRIM
Address: Aghmashenebeli Ave. No:
61, Tbilisi, Georgia
Tel./Fax: (00 995 32) 294 37 04
294 37 14
E-mail: [email protected]
Website: www.ziraatbank.com
SWIFT: TCZBGE22
JSC VTB Bank (Georgia)
CEO
Archil Kontselidze
Members of Board of Directors:
Mamuka Menteshashvili
Niko Chkhetiani
Valerian Gabunia
Vladimer Robakidze
Irakli Dolidze
Address: 14, G. Chanturia St., 0108
Tbilisi, Georgia
Tel: (995 32) 224 24 24
Fax: (995 32) 293 32 91
E-mail: [email protected]
Website: www.vtb.ge
SWIFT: UGEBGE22

34© 2017 KPMG Georgia LLC, a company incorporated under the Laws of Georgia, a member firm of the KPMG network of
independent member firms affiliated with KPMG International Cooperative (“KPMG International”), a Swiss entity. All rights
reserved.
Glossary of Terms
Herfindahl-Hirschman Index
Calculated by squaring the market share of each firm competing in the market and then summing
the resulting numbers. Index below 1,000 indicates an unconcentrated index; index between 1,000
and 1,800 indicates moderate concentration; index above 1,800 indicates high concentration.
Equity to assets
Calculated as the total equity divided by the total assets.
Return on Assets
The ratio of annualized net profit to average annual assets.
Return on Equity
The ratio of annualized net profit to average annual share capital.
Net Interest Margin
The ratio of annualized net interest income to annual average assets.
Tier 1 Ratio
The ratio of Tier 1 Capital of the bank defined according to the rule set by NBG to risk weighted
assets. Required minimum by the National Bank of Georgia – 7.2%.
Capital Adequacy Ratio
The ratio of regulatory Capital of the bank defined according to the rule set by NBG to risk
weighted assets. Required minimum by the National Bank of Georgia – 10.8%
Liquidity Ratio
Calculated as the liquid assets divided by the total assets.
Andrew Coxshall
Managing Partner
KPMG in Georgia
T + 995 32 295-07-19
Irina Gevorgyan
Director
Head of Advisory
T + 995 32 295-07-19
Contacts
The contacts at KPMG in connection
with this report are:
© 2017 KPMG Georgia LLC, a company incorporated under the Laws of
Georgia, a member firm of the KPMG network of independent member
firms affiliated with KPMG International Cooperative (“KPMG
International”), a Swiss entity. All rights reserved.
The KPMG name and logo are registered trademarks or trademarks of
KPMG International.
The information contained herein is of a general nature and is not
intended to address the circumstances of any particular individual or
entity. Although we endeavor to provide accurate and timely
information, there can be no guarantee that such information is
accurate as of the date it is received or that it will continue to be
accurate in the future. No one should act on such information without
appropriate professional advice after a thorough examination of the
particular situation.


