239
April 2015 Georgian National Investment Agency Chemical Sector Research
April 2015
Georgian National Investment Agency
Chemical Sector Research
Group 24.1Production of Main Chemicals

© 2015 KPMG Georgia LLC, a company incorporated under the Laws of Georgia, a member firm of the KPMG network of independent member firms affiliated with KPMG International Cooperative (“KPMG International”), a Swiss entity.
All rights reserved. 3
This report was commissioned by the LEPL “Georgian National Investment Agency” www.investingeorgia.org
DISCLAIMER
Our findings, observations and/or recommendations are those that we could reasonably derive from the procedures or scope of services performed. The specific procedures performed were agreed with Georgian National Investment Agency (the Client) and were performed by us as set forth in the Report.
Our work was carried out solely based on the publicly available research data.
We have indicated within our Report the sources of the information presented and have satisfied ourselves, so far as possible, that the information presented in our Report is consistent with other information which was made available to us inthe course of our work in accordance with the terms of the Contract. We have not, however, sought to establish the reliability of the sources by reference to other evidence.
All recommendations, provided to you with/in this Report that refer to the future have some limitations in the sense that they are based on the assumptions valid on the issuance date. These assumptions could change with time, after the date of this Report issuance, and so could lose their value.
References to 'KPMG Analysis' in this Report indicate only that we have (where specified) undertaken certain analytical activities on the underlying data to arrive at the information presented; we do not accept responsibility for the underlying data.

© 2015 KPMG Georgia LLC, a company incorporated under the Laws of Georgia, a member firm of the KPMG network of independent member firms affiliated with KPMG International Cooperative (“KPMG International”), a Swiss entity.
All rights reserved. 4
This report was commissioned by the LEPL “Georgian National Investment Agency” www.investingeorgia.org
Table of Contents
Abbreviations 5Glossary of terms 6Industrial gases 7Pigments and other coloring matter 62Mineral Fertilizer and nitrogen compounds 102Other basic organic chemicals 155
© 2015 KPMG Georgia LLC, a company incorporated under the Laws of Georgia, a member firm of the KPMG network of independent member firms affiliated with KPMG International Cooperative (“KPMG International”), a Swiss entity.
All rights reserved. 5
This report was commissioned by the LEPL “Georgian National Investment Agency” www.investingeorgia.org
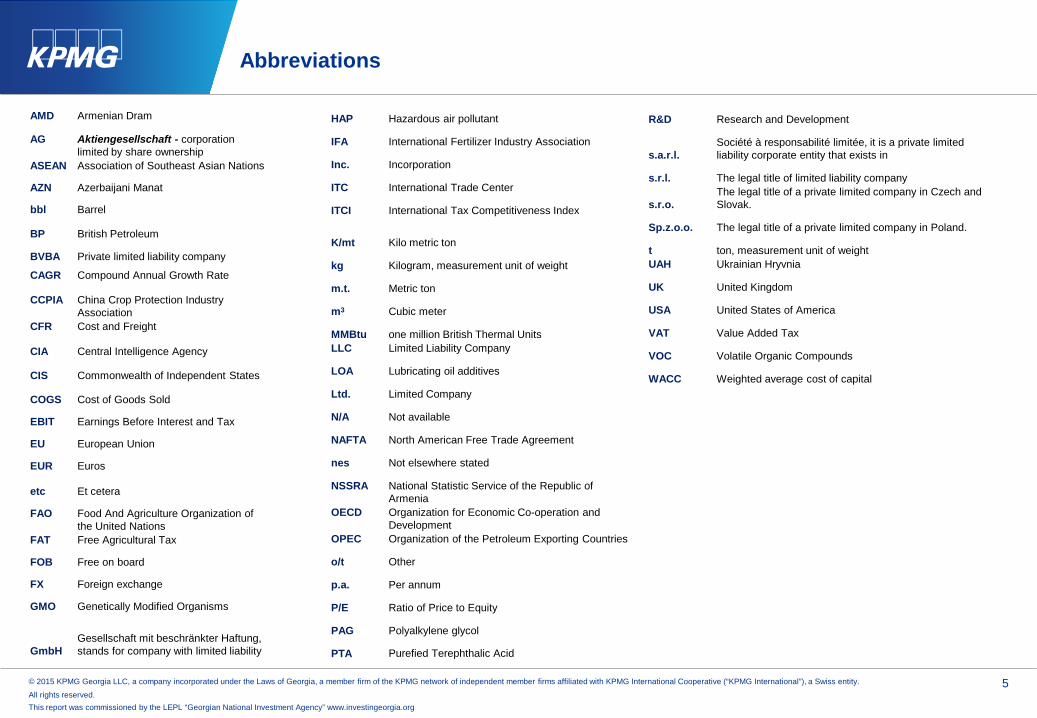
Abbreviations
AMD Armenian Dram
AG Aktiengesellschaft - corporation limited by share ownership
ASEAN Association of Southeast Asian Nations
AZN Azerbaijani Manat
bbl Barrel
BP British Petroleum
BVBA Private limited liability company
CAGR Compound Annual Growth Rate
CCPIA China Crop Protection Industry Association
CFR Cost and Freight
CIA Central Intelligence Agency
CIS Commonwealth of Independent States
COGS Cost of Goods Sold
EBIT Earnings Before Interest and Tax
EU European Union
EUR Euros
etc Et cetera
FAO Food And Agriculture Organization of the United Nations
FAT Free Agricultural Tax
FOB Free on board
FX Foreign exchange
GMO Genetically Modified Organisms
GmbHGesellschaft mit beschränkter Haftung, stands for company with limited liability
HAP Hazardous air pollutant
IFA International Fertilizer Industry Association
Inc. Incorporation
ITC International Trade Center
ITCI International Tax Competitiveness Index
K/mt Kilo metric ton
kg Kilogram, measurement unit of weight
m.t. Metric ton
m3 Cubic meter
MMBtu one million British Thermal UnitsLLC Limited Liability Company
LOA Lubricating oil additives
Ltd. Limited Company
N/A Not available
NAFTA North American Free Trade Agreement
nes Not elsewhere stated
NSSRA National Statistic Service of the Republic of Armenia
OECD Organization for Economic Co-operation and Development
OPEC Organization of the Petroleum Exporting Countries
o/t Other
p.a. Per annum
P/E Ratio of Price to Equity
PAG Polyalkylene glycol
PTA Purefied Terephthalic Acid
R&D Research and Development
s.a.r.l.Société à responsabilité limitée, it is a private limited liability corporate entity that exists in
s.r.l. The legal title of limited liability company
s.r.o.The legal title of a private limited company in Czech and Slovak.
Sp.z.o.o. The legal title of a private limited company in Poland.
t ton, measurement unit of weightUAH Ukrainian Hryvnia
UK United Kingdom
USA United States of America
VAT Value Added Tax
VOC Volatile Organic Compounds
WACC Weighted average cost of capital
© 2015 KPMG Georgia LLC, a company incorporated under the Laws of Georgia, a member firm of the KPMG network of independent member firms affiliated with KPMG International Cooperative (“KPMG International”), a Swiss entity.
All rights reserved. 6
This report was commissioned by the LEPL “Georgian National Investment Agency” www.investingeorgia.org
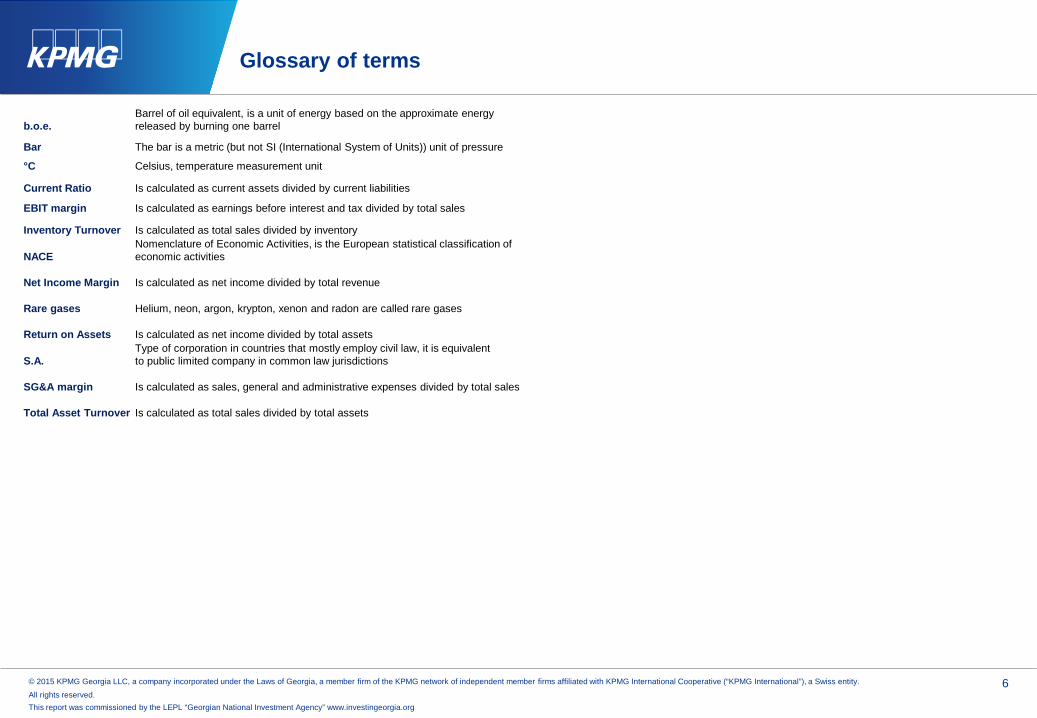
Glossary of terms
b.o.e.Barrel of oil equivalent, is a unit of energy based on the approximate energy released by burning one barrel
Bar The bar is a metric (but not SI (International System of Units)) unit of pressure
°C Celsius, temperature measurement unit
Current Ratio Is calculated as current assets divided by current liabilities
EBIT margin Is calculated as earnings before interest and tax divided by total sales
Inventory Turnover Is calculated as total sales divided by inventory
NACENomenclature of Economic Activities, is the European statistical classification of economic activities
Net Income Margin Is calculated as net income divided by total revenue
Rare gases Helium, neon, argon, krypton, xenon and radon are called rare gases
Return on Assets Is calculated as net income divided by total assets
S.A.Type of corporation in countries that mostly employ civil law, it is equivalent to public limited company in common law jurisdictions
SG&A margin Is calculated as sales, general and administrative expenses divided by total sales
Total Asset Turnover Is calculated as total sales divided by total assets
Industrial Gases

© 2015 KPMG Georgia LLC, a company incorporated under the Laws of Georgia, a member firm of the KPMG network of independent member firms affiliated with KPMG International Cooperative (“KPMG International”), a Swiss entity.
All rights reserved. 8
This report was commissioned by the LEPL “Georgian National Investment Agency” www.investingeorgia.org
Industrial gasesMapping – Georgian Classifier via Generally used classifiers
In Georgian National Classifier SEK 001-2004 Sub Group 24.11 includes the following sections
Industrial gases
Elementary gases
- Argon- Chlorine- Fluorine- Helium- Hydrogen- Krypton- Neon- Nitrogen- Oxygen- Radon- Xenon
- Carbon dioxide- Helium- Krypton- Neon- Nitrogen- Radon- Xenon
Inorganic compounds; liquid air; compressed air; amalgams o/t of precious metals*
Generally used classification
Classification of Industrial gases under research
Industrial gases are used in various industries including health care, automotive, manufacturing, semiconductor, food andbeverages, chemical, electricity and metal industries.
Liquid and compressed
air
Cooling agent (refrigerant),
acetylene
Industrial gas mixtures Inert gases Safety
(insulating) gases
Fluorinated, brominated or iodinated derivatives of acyclic hydrocarbons,Unsaturated acyclic hydrocarbons
1. Mixtures of industrial gases presented in the report2. industrial gases obtained as co-products or by-products of other operations, such as;- Anhydrous ammonia- Ethylene- Ethylene oxide- Hydrogen fluoride- Hydrogen chloride- Trimethylamine- Methylamine- Sulphur dioxide - Nitrous oxide
- Ammonia- Argon- Carbon dioxide- Chlorine- Nitrogen- Nitrous oxide- Neon- Helium- Hydrogen
Note: Due to classification of available data, the inorganic compounds, amalgams, which are not industrial gases, are also included in the research, but the trade share of the whole group in the trade of industrial gases is less than 1%

© 2015 KPMG Georgia LLC, a company incorporated under the Laws of Georgia, a member firm of the KPMG network of independent member firms affiliated with KPMG International Cooperative (“KPMG International”), a Swiss entity.
All rights reserved. 9
This report was commissioned by the LEPL “Georgian National Investment Agency” www.investingeorgia.org
Industrial gasesMapping – Georgian Classifier via Generally used classifiers (continued)
Our analysis has been performed based on the general classifier and as per the above mapping. Our analysis includes allthe mentioned industrial gases. The selected industrial gases are widely consumed worldwide and are produced by themajor big four companies (Linde, Air Liquide, Praxair and Air products) of the sector. Due to the chemical properties of thecorresponding gas, the same gas may be included in more than one group of the Georgian classifier, for instance radon isboth an elementary gas and an inert gas.
Due to the data representation differences (for acetylene, liquid and compressed air and nitrous oxide, the data is availableonly for chemical groups including those gases, not per individual type) the report classifies the mentioned industrial gasesinto two groups
1. Main industrial gases, which include
Anhydrous ammonia
Rare gases (excl. argon), which includes
helium, neon, krypton, radon and xenon
Argon
Oxygen
Nitrogen
Oxirane (ethylene oxide)
Ethylene
Sulphur dioxide
Chlorine
Hydrogen
Hydrogen fluoride
(hydrofluoric acid)
Methylamine, di- or trimethylamine and their salts*
Carbon dioxide
Hydrogen chloride
(hydrochloric acid)
Note: In the classification used the methylamine and di-or trimethylamine salts are also included in the group, however salts are not considered as industrial gases

© 2015 KPMG Georgia LLC, a company incorporated under the Laws of Georgia, a member firm of the KPMG network of independent member firms affiliated with KPMG International Cooperative (“KPMG International”), a Swiss entity.
All rights reserved. 10
This report was commissioned by the LEPL “Georgian National Investment Agency” www.investingeorgia.org
Industrial gasesMapping – Georgian Classifier via Generally used classifiers (continued)
Unsaturated acyclic hydrocarbons, which includes acetylene
Fluorine; bromine, which includes fluorine
Fluorinated, brominated or iodinated derivatives of acyclic hydrocarbons
Inorganic compounds nes; liquid air; compressed air; amalgams o/t of precious metals, which includes liquid andcompressed air
Inorganic oxygen compounds of non-metals nes, which includes nitrous oxide
While using the term “industrial gases” it is considered that the data for both groups are included in the analyses.
2. Basic chemicals including industrial gases, which include

© 2015 KPMG Georgia LLC, a company incorporated under the Laws of Georgia, a member firm of the KPMG network of independent member firms affiliated with KPMG International Cooperative (“KPMG International”), a Swiss entity.
All rights reserved. 11
This report was commissioned by the LEPL “Georgian National Investment Agency” www.investingeorgia.org
The industry is highly dominated by the global gas big four companies which account for approximately 71% of the industry’s global market
Industrial gasesGeneral overview
Due to their chemical properties, such as reactivity, inertness, and coldness, industrial gases are widely used in process industries such as Oil and Gas, Chemicals, Power, Mining, Metals, Pharmaceuticals, Food, Electronics, and Aerospace.
The industrial gas industry is highly consolidated with only four major players that have global reach. In 2013 combined, Linde, Air Liquide, Praxair and Air Products comprise around an estimated 71% of the global industrial gas market. For the same date the cumulative sales of the big four companies of the sector totaled to USD 61 billion, thus the total market size of the industrial gases can be estimated to be equal to around USD 85.9 billion.
It is estimated that the total market size of the big four companies will reach to USD 71 billion in 2016, growing by the CAGR equal to 5.6% in the period of 2010-2016. In 2013 Air Liquide lost 0.66% of its market share while Linde increased its market share by 0.36% thus becoming the leader of the big four by its market size, exceeding the Air Liquide’s market size by 9.4%. For the period of 2010-2013 Linde was the only company among the big four companies that had a stable growth of its market share, while all the big four companies have estimated stable growth of their market size for the periodof 2014-2016.
14,541 15,579
17,266 18,820 18,888
20,024 21,355
15,241 16,336
17,318 17,204 17,695 18,521
19,457
11,431 12,715 12,683 13,475 14,120
15,300 16,639
10,199 11,393 10,684 11,503 11,996 12,708
13,663
9.0%
3.4%
5.3%
2.8%
6.1%
6.9%
0%
1%
2%
3%
4%
5%
6%
7%
8%
9%
10%
-
5,000
10,000
15,000
20,000
25,000
2010 2011 2012 2013 2014E 2015E 2016E
Annual sales of big four companies, USD million
Linde Air Liquide Praxair Air products Growth rate of the total salesSource: Jefferies, company dataNote: FX rate used 1 EUR = 1.13 USD
Estimated values

© 2015 KPMG Georgia LLC, a company incorporated under the Laws of Georgia, a member firm of the KPMG network of independent member firms affiliated with KPMG International Cooperative (“KPMG International”), a Swiss entity.
All rights reserved. 12
This report was commissioned by the LEPL “Georgian National Investment Agency” www.investingeorgia.org
In 2014 the emerging markets accounted for 34% of the global industrial gas market
Industrial gasesMarket overview
Source: Societe Generale, Cross Asset Research, 25 September 2014
Source: Capital IQ
Key ratios for industrial gas industryAs of 26 January 2015Net Income Margin % 4.4%Total Asset Turnover 0.6xCurrent Ratio 1.4xInventory turnover 9.5xAverage Days Sales Outstanding 68.7Total Debt/Equity 61.3%Total liabilities/Total Assets 50.1%Net Income, 2 Year Growth % (1.0%)Gross Profit, 1 Year Growth % 1.3%Cash from Operations, 1 Year Growth % 4.8%
Source: Societe Generale, Cross Asset Research, 25 September 2014
According to the Societe Generale cross assetresearch, most end markets of the industrial gases arequite cyclical, nevertheless the industrial gas majors arenot widely influenced by the pricing cycles of theircustomers due to the signed pricing contracts.
The industry has become increasingly global, as growth in emerging markets has been around twice the rate of that in major western markets.
According to the Synopsis of Chemicals report dated 25 September 2014, in 2014 the emerging markets accounted for the following shares in the corresponding big four companies’ market sizes; Air Liquide (22%),Linde (36%), Air products (38%), Praxair (38%). For the same date the emerging markets accounted for the 34% of the global market size of the industrial gas sector.
10%
10%
3%
5%
7%
11%26%
28%
Geographic breakdown of the market, 2013
Developing Asia
China
C/E Europe
Africa/ME/Other
S/C America
Japan
W. Europe
US/Canada
25%
1%
13%
10%9%
13%
8%
13%
8%
Global gases industry by end-market (%), 2013
Manufacturing
Glass
Metals
Healthcare
Food and beverages
Energy
Electronics
Chemicals
Other
© 2015 KPMG Georgia LLC, a company incorporated under the Laws of Georgia, a member firm of the KPMG network of independent member firms affiliated with KPMG International Cooperative (“KPMG International”), a Swiss entity.
All rights reserved. 13
This report was commissioned by the LEPL “Georgian National Investment Agency” www.investingeorgia.org
4,876,488 7,495,148 10,812,527 11,465,141 10,517,929
4,786,390 6,512,314
8,179,967 8,371,632 8,986,748
819,427 930,195 942,008 1,024,234
1,117,152 444,447
617,121 829,930 822,221 766,416 449,314
544,435 606,716 564,143 620,578 2,057,033
2,017,557 2,529,798 2,467,047 2,238,404 34.9%
31.9%
3.4%
(1.9%)
-5%
0%
5%
10%
15%
20%
25%
30%
35%
40%
0%
10%
20%
30%
40%
50%
60%
70%
80%
90%
100%
2009 2010 2011 2012 2013
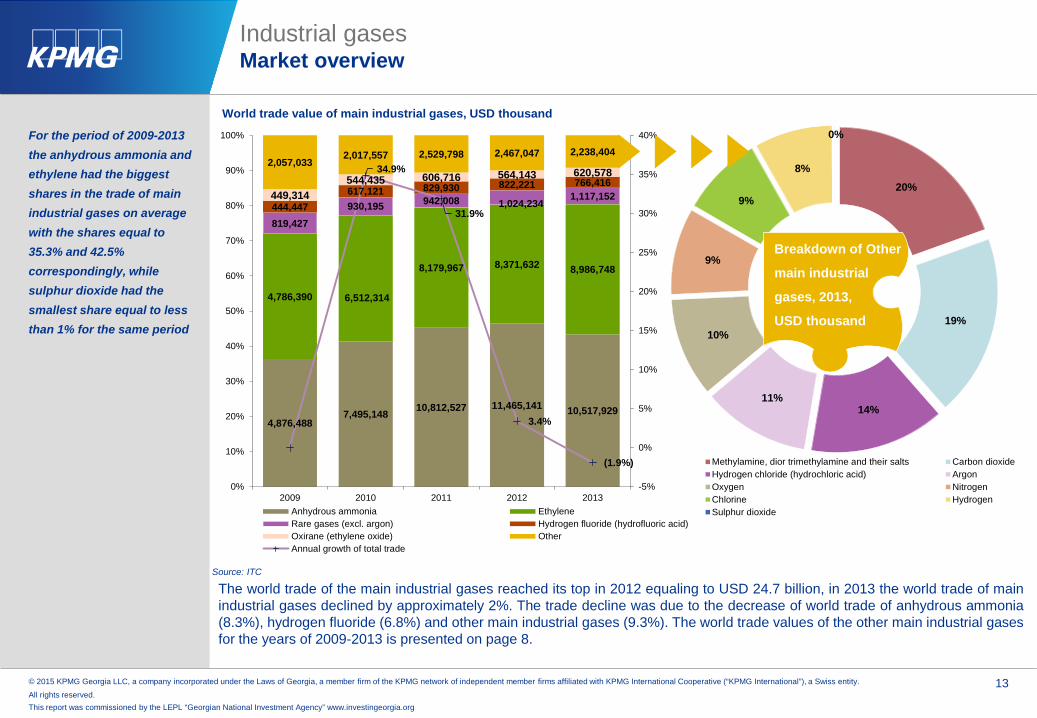
World trade value of main industrial gases, USD thousand
Anhydrous ammonia EthyleneRare gases (excl. argon) Hydrogen fluoride (hydrofluoric acid)Oxirane (ethylene oxide) OtherAnnual growth of total trade
20%
19%
14%11%
10%
9%
9%
8%
0%
Methylamine, dior trimethylamine and their salts Carbon dioxideHydrogen chloride (hydrochloric acid) ArgonOxygen NitrogenChlorine HydrogenSulphur dioxide
For the period of 2009-2013 the anhydrous ammonia and ethylene had the biggest shares in the trade of main industrial gases on average with the shares equal to 35.3% and 42.5% correspondingly, while sulphur dioxide had the smallest share equal to less than 1% for the same period
Industrial gasesMarket overview
Source: ITC
The world trade of the main industrial gases reached its top in 2012 equaling to USD 24.7 billion, in 2013 the world trade of mainindustrial gases declined by approximately 2%. The trade decline was due to the decrease of world trade of anhydrous ammonia(8.3%), hydrogen fluoride (6.8%) and other main industrial gases (9.3%). The world trade values of the other main industrial gasesfor the years of 2009-2013 is presented on page 8.
Breakdown of Other
main industrial
gases, 2013,
USD thousand
© 2015 KPMG Georgia LLC, a company incorporated under the Laws of Georgia, a member firm of the KPMG network of independent member firms affiliated with KPMG International Cooperative (“KPMG International”), a Swiss entity.
All rights reserved. 14
This report was commissioned by the LEPL “Georgian National Investment Agency” www.investingeorgia.org
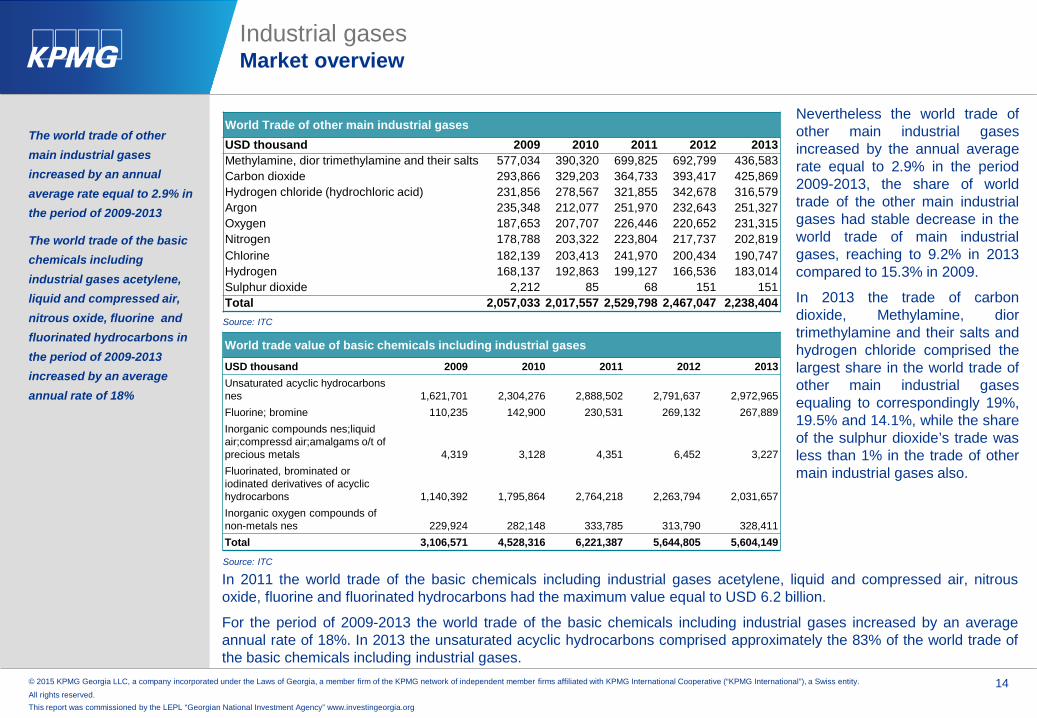
The world trade of other main industrial gases increased by an annual average rate equal to 2.9% in the period of 2009-2013
The world trade of the basic chemicals including industrial gases acetylene, liquid and compressed air, nitrous oxide, fluorine and fluorinated hydrocarbons in the period of 2009-2013 increased by an average annual rate of 18%
Industrial gasesMarket overview
Source: ITC
Nevertheless the world trade ofother main industrial gasesincreased by the annual averagerate equal to 2.9% in the period2009-2013, the share of worldtrade of the other main industrialgases had stable decrease in theworld trade of main industrialgases, reaching to 9.2% in 2013compared to 15.3% in 2009.
In 2013 the trade of carbondioxide, Methylamine, diortrimethylamine and their salts andhydrogen chloride comprised thelargest share in the world trade ofother main industrial gasesequaling to correspondingly 19%,19.5% and 14.1%, while the shareof the sulphur dioxide’s trade wasless than 1% in the trade of othermain industrial gases also.
World Trade of other main industrial gasesUSD thousand 2009 2010 2011 2012 2013Methylamine, dior trimethylamine and their salts 577,034 390,320 699,825 692,799 436,583Carbon dioxide 293,866 329,203 364,733 393,417 425,869Hydrogen chloride (hydrochloric acid) 231,856 278,567 321,855 342,678 316,579Argon 235,348 212,077 251,970 232,643 251,327Oxygen 187,653 207,707 226,446 220,652 231,315Nitrogen 178,788 203,322 223,804 217,737 202,819Chlorine 182,139 203,413 241,970 200,434 190,747Hydrogen 168,137 192,863 199,127 166,536 183,014Sulphur dioxide 2,212 85 68 151 151Total 2,057,033 2,017,557 2,529,798 2,467,047 2,238,404
Source: ITC
In 2011 the world trade of the basic chemicals including industrial gases acetylene, liquid and compressed air, nitrousoxide, fluorine and fluorinated hydrocarbons had the maximum value equal to USD 6.2 billion.
For the period of 2009-2013 the world trade of the basic chemicals including industrial gases increased by an averageannual rate of 18%. In 2013 the unsaturated acyclic hydrocarbons comprised approximately the 83% of the world trade ofthe basic chemicals including industrial gases.
World trade value of basic chemicals including industrial gases
USD thousand 2009 2010 2011 2012 2013Unsaturated acyclic hydrocarbons nes 1,621,701 2,304,276 2,888,502 2,791,637 2,972,965Fluorine; bromine 110,235 142,900 230,531 269,132 267,889Inorganic compounds nes;liquidair;compressd air;amalgams o/t of precious metals 4,319 3,128 4,351 6,452 3,227Fluorinated, brominated or iodinated derivatives of acyclic hydrocarbons 1,140,392 1,795,864 2,764,218 2,263,794 2,031,657Inorganic oxygen compounds of non-metals nes 229,924 282,148 333,785 313,790 328,411Total 3,106,571 4,528,316 6,221,387 5,644,805 5,604,149

© 2015 KPMG Georgia LLC, a company incorporated under the Laws of Georgia, a member firm of the KPMG network of independent member firms affiliated with KPMG International Cooperative (“KPMG International”), a Swiss entity.
All rights reserved. 15
This report was commissioned by the LEPL “Georgian National Investment Agency” www.investingeorgia.org
For the period of 2009-2013 Armenia, Georgia and Azerbaijan had insignificant shares in the regional export of both main industrial gases and basic chemicals including industrial gases
Industrial gasesMarket overview
Source: ITC Source: ITC
Source: ITC Source: ITC
The main importing countries of the main industrial gases in the region in 2013 were Turkey, Ukraine and Russiacomprising correspondingly 74%, 18.8% and 5.6% of the region import in 2013. In 2013 Russia was the main importingcountry of the basic chemicals including industrial gases in the region with the regional share of 88%
The exporting countries of the main industrial gases in the region in 2013 were Russia, Ukraine and Turkey comprising70.1%, 27.9% and 2.1% of the region export in 2013 respectively.
In 2013 Russia, Turkey and Ukraine were the main exporting countries of the basic chemicals including industrial gases inthe region with the regional shares of 70.9%, 21.4% and 7.4% correspondingly. Georgia had a share of export equal to0.3%.
Regional Import value of main industrial gases
USD thousand 2009 2010 2011 2012 2013Russia 13,897 12,214 18,468 24,910 28,353Ukraine 28,262 21,903 23,961 19,717 95,490Georgia 743 1,010 897 1,491 2,338Armenia 830 667 904 1,123 914Turkey 246,794 350,712 475,596 400,732 375,715Azerbaijan 1,532 2,297 4,762 4,181 4,921Total 292,058 388,803 524,588 452,154 507,731
Regional export value of main industrial gases
USD thousand 2009 2010 2011 2012 2013Russia 707,783 803,556 1,661,871 1,564,896 1,649,853Ukraine 117,383 406,500 633,815 668,917 656,263Georgia 234 425 642 513 333Armenia 8 1 13 - -Turkey 20,576 26,101 85,526 108,683 48,515Azerbaijan 35 25 - 4 -Total 846,019 1,236,608 2,381,867 2,343,013 2,354,964
Regional Import value of basic chemicals including industrial gases
USD thousand 2009 2010 2011 2012 2013Russia 20,520 39,980 51,595 56,197 52,754Ukraine 1,167 2,092 10,601 7,574 6,370Georgia 176 400 789 1,032 383Armenia 33 45 182 258 105Turkey 15,405 25,193 44,721 31,395 31,022Azerbaijan 69 55 416 164 293Total 37,370 67,765 108,304 96,620 90,927
Regional export value of basic chemicals including industrial gases
USD thousand 2009 2010 2011 2012 2013Russia 16,076 12,783 12,173 10,867 14,086Ukraine 1,259 3,005 2,860 1,638 1,472Georgia 23 1 - - 55Armenia 7 - 5 6 3Turkey 1,102 3,046 4,469 2,695 4,260Azerbaijan - - - - -Total 18,467 18,835 19,507 15,206 19,876

© 2015 KPMG Georgia LLC, a company incorporated under the Laws of Georgia, a member firm of the KPMG network of independent member firms affiliated with KPMG International Cooperative (“KPMG International”), a Swiss entity.
All rights reserved. 16
This report was commissioned by the LEPL “Georgian National Investment Agency” www.investingeorgia.org
55,48953,951
57,830
60,913
64,600
(2.8%)
7.2% 5.3% 6.1%
(4.0%)
(2.0%)
-
2.0%
4.0%
6.0%
8.0%
48,000
50,000
52,000
54,000
56,000
58,000
60,000
62,000
64,000
66,000
2008 2009 2010 2011 2012
Global consumption of industrial gases, USD million
global consumption volume growth rate
39%
32%
24%
5%
Global consumption of industrial gases by geography segmentation USD million, 2012
Asia-Pacific
Europe
Americas
Middle East & Africa
The compound annual growth rate of consumption in the period 2012–2017 is predicted to be 8%
Industrial gasesMarket overview
Source: Marketline Industry Profile, 2013Source: Marketline Industry Profile, 2013
The global industrial gases market has produced stable and good growth in recent years, after covering from contractionthat occurred in 2009. The market is expected to continue this trend through to the end of the forecast period in 2017.
In 2012 (the latest available data at the date of conducting research) Asia-Pacific accounted for 39.2% (USD 25.3 billion),Europe accounted for 31.6% (USD 20.4 billion), Americas accounted for 24% (USD 15.8 billion) and Middle East andAfrica accounted for 5% (USD 3.1 billion) of the global industrial gases consumption.
The global industrial gases consumption grew by 6.1% in 2012 to reach a value of USD 64,600 million.

© 2015 KPMG Georgia LLC, a company incorporated under the Laws of Georgia, a member firm of the KPMG network of independent member firms affiliated with KPMG International Cooperative (“KPMG International”), a Swiss entity.
All rights reserved. 17
This report was commissioned by the LEPL “Georgian National Investment Agency” www.investingeorgia.org
81,464
88,246
95,1138.3%
7.8%
7.5%7.6%7.7%7.8%7.9%8.0%8.1%8.2%8.3%8.4%
70,000
75,000
80,000
85,000
90,000
95,000
100,000
2015 2016 2017
Global consumption forecast of industrial gases, 2015-2017, USD million
global consumption forecast growth rate
In 2017 the global consumption of industrial gases will increase by 47.2% compared to 2012
Industrial gasesMarket overview
Source: Marketline Industry Profile, 2013
Main consuming countries for industrial gases areBelgium, Germany and France.
Below are presented the annual productionvolumes of the main industrial gases whichcomprise the 90.8% in the world trade of the mainindustrial gases. The annual production volume isalso presented which is presented in the basicchemicals including industrial gases and isincluded in the group called fluorine, bromine.The total trade of the fluorine bromine and themain industrial gases presented below comprisethe 80% of the total world trade of industrialgases.
In 2017, the global consumption of industrialgases is forecasted to have a value of USD95,113.1 million, an increase of 47.2% since2012.
Ammonia: Ammonia is being increasingly made in countries which have low cost sources of natural gas and coal(China and Russia account for ca 40%). The largest plants produce about 3000 tones a day and there are plans tobuild plants that produce 4000-5000 tones a day, which would mean that the total world output could be managed with100 such units. The annual world production volumes of ammonia is equal to 140 million tones, from which Europeaccounts for 16 million tones, North America 15 million tones, US 8 million tones, Asia 74 million tones, Russia 12.5million tones and Middle east 13 million tones.
Chlorine: The annual world production of chlorine is equal to 56 million tones, from which Europe accounts for 16million tones and North America 11 million tones.
Fluorine: The annual world production of fluorine is equal to 20 thousand tones, from which Europe accounts for 9thousand tones.
Hydrogen: The annual world production of hydrogen is equal to 50 million tones.

© 2015 KPMG Georgia LLC, a company incorporated under the Laws of Georgia, a member firm of the KPMG network of independent member firms affiliated with KPMG International Cooperative (“KPMG International”), a Swiss entity.
All rights reserved. 18
This report was commissioned by the LEPL “Georgian National Investment Agency” www.investingeorgia.org
The global annual production volume for industrial gases can be estimated to equal 310 million tones
Industrial gasesMarket overview
Hydrogen fluoride: The annual world production volumes of hydrogen fluoride is equal to 1 million tones, from whichEurope accounts for 240 thousand tones.
Rare gases: The annual world production of rare gases is equal to 704,510 tones, from which helium accounts for 4500tones, neon 1 tone, argon 700,000 tones, krypton 8 tones and xenon 0.6 tone.
Given that the world trade of the above mentioned industrial gases comprise the 80% of the world trade of industrialgases, the global annual production volume for industrial gases can be estimated to equal 310 million tones.
According to the big four companies’ (Linde, Air Liquide, Praxair and Air products) company reports for the period of2010-2013 the world production value of industrial gases comprised 19,929 USD million.
According to the Helvea Baader Bank Group Equity Research Sector Report, the industrial gases companies havecurrently only a capacity utilization of 75% and there is optimizing potential. Thus the world capacity of industrial gasproduction can be estimated to equal to 414 million tones with the production value of 26,572 USD million.

© 2015 KPMG Georgia LLC, a company incorporated under the Laws of Georgia, a member firm of the KPMG network of independent member firms affiliated with KPMG International Cooperative (“KPMG International”), a Swiss entity.
All rights reserved. 19
This report was commissioned by the LEPL “Georgian National Investment Agency” www.investingeorgia.org
Industrial gasesRaw materials
Raw major materials include:
Sulphuric acid
Ammonium nitrate
Nitrites; nitrates
Fluorspar
Sulphur
Potassium chloride
Calcium carbide
Methanol
Natural gas (liquefied and in gaseous state)
Magnesium chloride
Sodium Chloride,
Ethyl alcohol,
Hydroxylamine

© 2015 KPMG Georgia LLC, a company incorporated under the Laws of Georgia, a member firm of the KPMG network of independent member firms affiliated with KPMG International Cooperative (“KPMG International”), a Swiss entity.
All rights reserved. 20
This report was commissioned by the LEPL “Georgian National Investment Agency” www.investingeorgia.org
The industrial gas industry differs from many other industries because its raw materials are primarily extracted from the atmosphere.The approximate volume
percentages of the main ingredients of the dry air are as follows:
78.1% nitrogen,
20.9% oxygen,
0.9 % argon,
carbon dioxide, neon, helium, krypton, hydrogen and xenon account for less one 1% of the dry air
Industrial gasesProduction chain
Air separation as the production chain of nitrogen, oxygen and rare gases including argon
Air intake1
Preliminary purification
2
Air is a mixture of nitrogen and oxygen. This accountsfor 99 %. The remainder consists of argon, carbon dioxide and other rare gases. Oxygen, nitrogen, argon, as well as the raregases neon, xenon and krypton are obtained fromthe air by the method of low temperature rectification.
1
Before the air is separated into its gaseous components, unwanted ingredients must be removed. These are filtered out,chemically absorbed of surfaces or frozen out.
2
Compression3
The air that has been sucked in is compressed at apressure of around 6 bar. Heat is created as a result(this effect is familiar from the bicycle pump).
3
The compressed air is first cooled down to a temperatureof minus 180°C. As it expands in the separationcolumns, it cools down still further (reversed bicyclepump effect). As a result it liquefies to some extent(the temperature being lower than the boiling point).
Preliminary cooling
4
4
Cooling and separating
By means of the separation column, the air is separated into its components. This is a purely physical process, not involving any chemical reactions. The liquid mixture of products trickles down to meet the rising stream of gas. The liquid collects on the trays of the column, and is penetrated by the vapor bubbles from beneath. Here it is oxygen preeminently, with its higher boiling point (-183 degrees C), which condenses out of the stream of gas. The drops of liquid, on the other hand, give rise for preference to evaporating nitrogen, with its lower boiling point of -196°C.Gaseous nitrogen collects, in consequence, at the top of the separation column, while liquid oxygen collects at the bottom of the column. The oxygen at the bottom is vaporized, while nitrogen in liquid form is introduced at the top of the column. This process is continued as long as is required to reach the desired level of purity.
5
5
With a view to obtaining the rare gases, the separation column of the air separation unit is equipped with additional aggregates for raw argon, a neon/helium mixture and a krypton/xenon mixture. These mixtures must be purified still further. In a modern air separationunit with a production capacity of 45,000 cubic meters of oxygen per hour, 1700 cubic meters of argonper hour and 91 cubic meters of rare gases (neon, krypton and xenon) per hour can be recovered.Of these, 60 to 85 % can be obtained in the form of high purity gases.
Rare gas recovery6
Compression7
The gas products oxygen and nitrogen are fed into a pipeline network at a pressure of 40 bar.
7
Filling8
6
Liquid oxygen, nitrogen and argon are filled into cryogenic tanks or road tankers or compressed to 300 bar, vaporized and filled into steel cylinders.
8
Source: Messer report: This is how air separation works

© 2015 KPMG Georgia LLC, a company incorporated under the Laws of Georgia, a member firm of the KPMG network of independent member firms affiliated with KPMG International Cooperative (“KPMG International”), a Swiss entity.
All rights reserved. 21
This report was commissioned by the LEPL “Georgian National Investment Agency” www.investingeorgia.org
Natural gas
Production chain for main industrial gases not produced by air separation
Main raw materials, key ratios for 2013
Chemical operationsAdditional industrial gases (besides the ones obtained by air separation) are obtained as co-products or by-products of other operations. Depending on what kind of industrial gas is produced, the chemical operations may vary, such as electrolysis, liquefaction and stripping, steam reforming, combustion, oxidation, smelter operations, etc.
Industrial gases
Ammonia
AmmoniasP/E 27.5xReturn on Assets % 2.4%Gross Margin % 56.4%SG&A Margin % 49.2%EBIT Margin % 3.1%Net Income Margin % 1.7%
Chlorine
Alkalis And Chlorine*P/E 26.2xReturn on Assets % N/AGross Margin % 38.0%SG&A Margin % 17.5%EBIT Margin % 8.1%Net Income Margin % 5.8%
Ethyl alcohol, methanol
AlcoholP/E 10.2xReturn on Assets % 5.0%Gross Margin % 9.8%SG&A Margin % 2.7%EBIT Margin % 7.1%Net Income Margin % 5.9%
Nitrogen
NitrogenP/E 19.8xReturn on Assets % 5.1%Gross Margin % 36.8%SG&A Margin % 20.3%EBIT Margin % 10.5%Net Income Margin % 6.8%
Salts
SaltsP/E 19.1xReturn on Assets % 2%Gross Margin % 22.9%SG&A Margin % 15.8%EBIT Margin % 5.9%Net Income Margin % (0.2%)
Oxygen
OxygenP/E 19.8xReturn on Assets % 5.1%Gross Margin % 36.8%SG&A Margin % 20.3%EBIT Margin % 10.5%Net Income Margin % 6.8%
Industrial gasesProduction chain (continued)
Sulphur
SulphurP/E 5xReturn on Assets % 5.9%Gross Margin % 32.3%SG&A Margin % 17%EBIT Margin % 10%Net Income Margin % 5.8%
Crude petroleum and natural gas P/E 14.8xReturn on Assets % 3%Gross Margin % 7.7%SG&A Margin % 4.8%EBIT Margin % 2.6%Net Income Margin % 1.9%
Industrial gasesP/E 19.9xReturn on Assets % 5.2%Gross Margin % 25.1%SG&A Margin % 16%EBIT Margin % 6.7%Net Income Margin % 4.3%
Source: (1) Cap IQ(2) Linde: Gases and Applications
Note: * Ratios for alkalis and chlorine are provided for February 2015 (data for 2013 is not available)
According to the Morgan Stanley research variable costs are primarily energy-related, either for the electricity used in the separation of atmospheric gases, or the purchase of natural gas for hydrogen extraction. The core businesses are asset-intensive, so capex/depreciation is a real expense, and maintenance capex can run 3-5% of revenue. Transportation fleets for merchant and packaged gas networks are also a major component of expense.

© 2015 KPMG Georgia LLC, a company incorporated under the Laws of Georgia, a member firm of the KPMG network of independent member firms affiliated with KPMG International Cooperative (“KPMG International”), a Swiss entity.
All rights reserved. 22
This report was commissioned by the LEPL “Georgian National Investment Agency” www.investingeorgia.org
The main price drivers are:
Cost of raw materials (mainly natural gas and energy for fulfilling different chemical processes),
Transportation costs of the industrial gases
Labor costs
Industrial gasesPrice analysis
Prices, per unit of industrial gas, 2013
USD/ton Armenia Georgia Ukraine Turkey Azerbaijan Central Asia EURare gases (excl. argon) 61,500 29,231 43,494 49,476 38,625 11,826 24,376Carbon dioxide N/A 460 159 12,600 412 420 173Chlorine 1,088 764 271 611 941 685 265Ethylene N/A N/A 1,658 1,434 N/A N/A 1,463Hydrogen chloride (hydrochloric acid) 471 336 545 459 275 294 90Hydrogen fluoride (hydrofluoric acid) 1,500 N/A 1,504 1,296 N/A 4,373 1,980Methylamine, dior trimethylamine and their salts 1,500 N/A 2,570 1,251 N/A N/A 1,682Oxirane (ethylene oxide) N/A N/A 1,224 3,109 N/A 6,929 1,653Anhydrous ammonia 786 553 481 510 690 385 550Sulphur dioxide N/A N/A N/A N/A N/A N/A N/AHydrogen N/A N/A N/A N/A 2,880 2,350 1,709Oxygen 16,000 427 168 4,606 7,250 216 127Nitrogen N/A 31,000 134 25,000 1,588 459 N/AArgon 2,552 1,509 4,000 436 514 987 354Unsaturated acyclic hydrocarbons nes 18,000 2,000 2,134 7,000 7,000 2,600 1,750Fluorine; bromine N/A N/A N/A 39,667 N/A 885 1,807Inorganic compounds nes;liquidair;compressd air;amalgams o/t of precious metals N/A N/A N/A N/A N/A N/A N/AFluorinated, brominated or iodinated derivatives of acyclic hydrocarbons 11,500 4,246 5,107 4,633 6,483 6,130 5,810Inorganic oxygen compounds of non-metals nes 18,000 4,200 894 4,919 3,080 4,358 772Source: ITC

© 2015 KPMG Georgia LLC, a company incorporated under the Laws of Georgia, a member firm of the KPMG network of independent member firms affiliated with KPMG International Cooperative (“KPMG International”), a Swiss entity.
All rights reserved. 23
This report was commissioned by the LEPL “Georgian National Investment Agency” www.investingeorgia.org
Industrial gasesMarket overview – Top 20 Importer Countries
Global Top 20 Importer countries by value
EU (28 including Turkey)Top 20 Importer countries by value
CIS countries and Ukraine Import by value
Country Import Value (USD, thousands) Country Import Value
(USD, thousands) Country Import Value (USD, thousands)
1United States of
America 3,997,056 1 Belgium 3,178,043 1 Ukraine 95,4902 Belgium 3,178,043 2 Germany 1,439,535 2 Belarus 49,5793 China 2,602,501 3 France 1,002,580 3 Russian Federation 28,3534 Germany 1,439,535 4 Netherlands 692,951 4 Kazakhstan 21,5525 Korea, Republic of 1,130,318 5 Spain 653,562 5 Azerbaijan 4,9216 India 1,108,197 6 United Kingdom 578,547 6 Republic of Moldova 1,3947 France 1,002,580 7 Turkey 375,715 7 Armenia 9148 Indonesia 995,272 8 Italy 298,230 8 Kyrgyzstan 8669 Taipei, Chinese 859,544 9 Sweden 295,902 9 Uzbekistan 816
10 Netherlands 692,951 10 Finland 229,040 10 Tajikistan 72711 Spain 653,562 11 Czech Republic 130,95412 United Kingdom 578,547 12 Portugal 122,54313 Japan 431,628 13 Lithuania 95,27214 Morocco 406,339 14 Romania 92,22815 Turkey 375,715 15 Slovakia 72,59416 Thailand 366,337 16 Austria 66,30817 Italy 298,230 17 Denmark 49,31818 Sweden 295,902 18 Hungary 41,16919 Norway 285,753 19 Poland 38,35520 Finland 229,040 20 Ireland 18,243 Source: ITC
Note: In 2013 Georgian import of main industrial gases was USD 2,338 thousand.
Main Industrial gases, 2013

© 2015 KPMG Georgia LLC, a company incorporated under the Laws of Georgia, a member firm of the KPMG network of independent member firms affiliated with KPMG International Cooperative (“KPMG International”), a Swiss entity.
All rights reserved. 24
This report was commissioned by the LEPL “Georgian National Investment Agency” www.investingeorgia.org
Industrial gasesMarket overview – Top 20 Importer Countries
Global Top 20 Importer countries by value
EU (28 including Turkey)Top 20 Importer countries by value
CIS countries and Ukraine Import by value
Country Import Value (USD, thousands) Country Import Value
(USD, thousands) Country Import Value (USD, thousands)
1United States of
America 878,784 1 Belgium 679,010 1 Russian Federation 52,7542 Belgium 679,010 2 Netherlands 412,030 2 Ukraine 6,3703 Netherlands 412,030 3 France 327,732 3 Kazakhstan 3,9574 France 327,732 4 Germany 200,502 4 Belarus 3,3785 China 261,119 5 United Kingdom 184,363 5 Azerbaijan 2936 India 235,547 6 Italy 146,843 6 Uzbekistan 2797 Thailand 217,741 7 Spain 112,611 7 Republic of Moldova 1648 Canada 216,445 8 Austria 37,377 8 Armenia 1059 Korea, Republic of 208,311 9 Turkey 31,022 9 Kyrgyzstan 90
10 Germany 200,502 10 Czech Republic 23,832 10 Tajikistan 311 Japan 186,539 11 Poland 14,78212 United Kingdom 184,363 12 Sweden 14,01813 Italy 146,843 13 Hungary 13,65114 Singapore 144,877 14 Portugal 10,95215 Spain 112,611 15 Ireland 8,61316 Mexico 112,541 16 Finland 7,38017 Brazil 98,598 17 Slovakia 6,41118 Taipei, Chinese 95,643 18 Denmark 5,54219 Saudi Arabia 71,198 19 Greece 5,26520 Malaysia 67,847 20 Romania 4,036 Source: ITC
Note: In 2013 Georgian import of basic chemicals including main industrial gases was USD 383 thousand.
Basic chemicals including industrial gases, 2013

© 2015 KPMG Georgia LLC, a company incorporated under the Laws of Georgia, a member firm of the KPMG network of independent member firms affiliated with KPMG International Cooperative (“KPMG International”), a Swiss entity.
All rights reserved. 25
This report was commissioned by the LEPL “Georgian National Investment Agency” www.investingeorgia.org
Industrial gasesMarket overview – Top 20 Exporter Countries
Global Top 20 Exporter countries by value
EU (28 including Turkey)Top 20 Exporter countries by value
CIS countries and Ukraine Export by value
Country Export Value (USD, thousands) Country Export Value
(USD, thousands) Country Export Value (USD, thousands)
1 Trinidad and Tobago 2,347,886 1 Netherlands 1,895,802 1 Russian Federation 1,649,8532 Netherlands 1,895,802 2 United Kingdom 1,328,261 2 Ukraine 656,2633 Russian Federation 1,649,853 3 Germany 1,214,370 3 Kazakhstan 12,4234 Korea, Republic of 1,501,132 4 France 634,601 4 Uzbekistan 6,4275 United Kingdom 1,328,261 5 Belgium 532,628 5 Belarus 6306 Germany 1,214,370 6 Ireland 196,677 6 Kyrgyzstan 497 Japan 1,183,015 7 Italy 179,102 7 Tajikistan 198 Saudi Arabia 1,124,582 8 Poland 147,100 8 Republic of Moldova 189 Canada 1,107,889 9 Spain 145,246 9 Azerbaijan -
10United States of
America 809,934 10 Finland 128,700 Armenia -11 Ukraine 656,263 11 Portugal 122,72012 France 634,601 12 Czech Republic 77,86613 Belgium 532,628 13 Hungary 58,19414 Malaysia 407,261 14 Estonia 50,665
15United Arab
Emirates 395,454 15 Turkey 48,51516 Indonesia 377,119 16 Austria 41,53317 Australia 374,442 17 Sweden 38,24418 Algeria 329,650 18 Slovakia 13,06819 China 322,961 19 Romania 11,781
20Iran (Islamic Republic of) 282,583 20 Slovenia 8,811
Source: ITC
Note: In 2013 Georgian export of main industrial gases was USD 333 thousand.
Main Industrial gases, 2013

© 2015 KPMG Georgia LLC, a company incorporated under the Laws of Georgia, a member firm of the KPMG network of independent member firms affiliated with KPMG International Cooperative (“KPMG International”), a Swiss entity.
All rights reserved. 26
This report was commissioned by the LEPL “Georgian National Investment Agency” www.investingeorgia.org
Industrial gasesMarket overview – Top 20 Exporter Countries
Global Top 20 Exporter countries by value
EU (28 including Turkey)Top 20 Exporter countries by value
CIS countries and Ukraine Export by value
Country Export Value (USD, thousands) Country Export Value
(USD, thousands) Country Export Value (USD, thousands)
1United States of America 1,216,971 1 Belgium 668,741 1 Russian Federation 14,086
2 China 722,224 2 United Kingdom 237,844 2 Ukraine 1,4723 Belgium 668,741 3 Netherlands 219,581 3 Belarus 5424 South Africa 431,874 4 France 156,522 4 Armenia 35 United Kingdom 237,844 5 Germany 111,397 5 Kyrgyzstan 26 Netherlands 219,581 6 Spain 85,845 6 Kazakhstan 27 Japan 211,113 7 Italy 39,292 7 Tajikistan 08 Canada 206,106 8 Austria 35,417 8 Republic of Moldova 09 France 156,522 9 Estonia 19,294 9 Azerbaijan 0
10 Saudi Arabia 144,706 10 Czech Republic 16,972 10 Uzbekistan 011 Israel 139,946 11 Hungary 14,82412 Brazil 133,652 12 Portugal 9,52113 Germany 111,397 13 Sweden 7,00014 Spain 85,845 14 Finland 6,734
15United Arab Emirates 79,210 15 Denmark 4,591
16 Singapore 71,946 16 Turkey 4,26017 Jordan 57,017 17 Poland 4,12218 Italy 39,292 18 Slovakia 3,91119 Taipei, Chinese 39,014 19 Slovenia 2,04320 Austria 35,417 20 Lithuania 1,407
Source: ITC
Basic chemicals including industrial gases, 2013
Note: In 2013 Georgian export of basic chemicals including main industrial gases was USD55 thousand.
© 2015 KPMG Georgia LLC, a company incorporated under the Laws of Georgia, a member firm of the KPMG network of independent member firms affiliated with KPMG International Cooperative (“KPMG International”), a Swiss entity.
All rights reserved. 27
This report was commissioned by the LEPL “Georgian National Investment Agency” www.investingeorgia.org
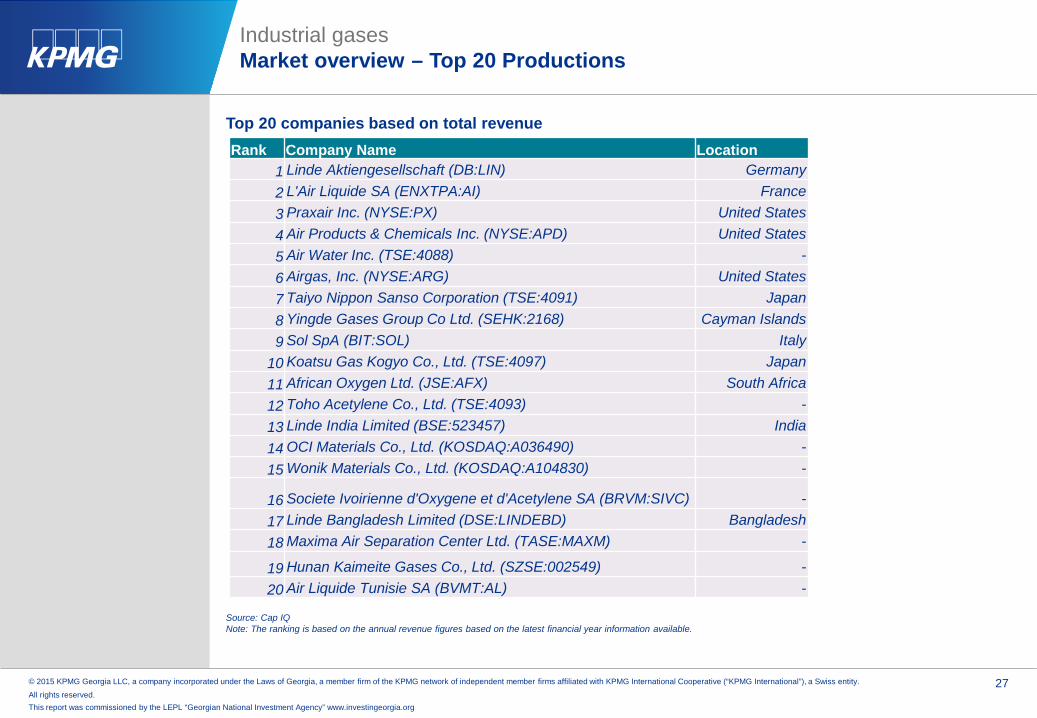
Industrial gasesMarket overview – Top 20 Productions
Top 20 companies based on total revenue Rank Company Name Location
1 Linde Aktiengesellschaft (DB:LIN) Germany2 L'Air Liquide SA (ENXTPA:AI) France3 Praxair Inc. (NYSE:PX) United States4 Air Products & Chemicals Inc. (NYSE:APD) United States5 Air Water Inc. (TSE:4088) -6 Airgas, Inc. (NYSE:ARG) United States7 Taiyo Nippon Sanso Corporation (TSE:4091) Japan8 Yingde Gases Group Co Ltd. (SEHK:2168) Cayman Islands9 Sol SpA (BIT:SOL) Italy
10 Koatsu Gas Kogyo Co., Ltd. (TSE:4097) Japan11 African Oxygen Ltd. (JSE:AFX) South Africa12 Toho Acetylene Co., Ltd. (TSE:4093) -13 Linde India Limited (BSE:523457) India14 OCI Materials Co., Ltd. (KOSDAQ:A036490) -15 Wonik Materials Co., Ltd. (KOSDAQ:A104830) -
16 Societe Ivoirienne d'Oxygene et d'Acetylene SA (BRVM:SIVC) -17 Linde Bangladesh Limited (DSE:LINDEBD) Bangladesh18 Maxima Air Separation Center Ltd. (TASE:MAXM) -
19 Hunan Kaimeite Gases Co., Ltd. (SZSE:002549) -20 Air Liquide Tunisie SA (BVMT:AL) -
Source: Cap IQNote: The ranking is based on the annual revenue figures based on the latest financial year information available.

© 2015 KPMG Georgia LLC, a company incorporated under the Laws of Georgia, a member firm of the KPMG network of independent member firms affiliated with KPMG International Cooperative (“KPMG International”), a Swiss entity.
All rights reserved. 28
This report was commissioned by the LEPL “Georgian National Investment Agency” www.investingeorgia.org
Industrial gasesMarket overview – Top 20 Importer companies
Top 20 anhydrous ammonia importer companies based on number of product or service categories traded Rank Company Name Location
1 Univar France2 Coger France3 Mash Traders United Arab Emirates4 Chemlink LLC United Arab Emirates5 Cadilhac Morocco6 Simar, S.A. Spain7 Produits Chimiques Maghreb Morocco8 CRISTIAN GRUP S.R.L. Romania9 Merck (Schweiz) AG Switzerland
10 Linegal Chemicals Sp. z o.o. Poland11 BRENNTAG S.R.L. Romania12 Compagnie de Produits Chimiques du Maroc Morocco13 Kresry NV Belgium14 Brenntag Nordic AS Norway15 Eltachem Maroc s.a.r.l. Morocco16 IMPAG AG Switzerland17 Baum-Lux Russian Federation18 Univar AB Sweden19 Univar Oy Finland20 Chemia-Lublin SA Przedsiebiorstwo Handlowe Poland
Source: ITCNote: The top companies are illustrated for those industrial gases which have considerable share in the world trade
© 2015 KPMG Georgia LLC, a company incorporated under the Laws of Georgia, a member firm of the KPMG network of independent member firms affiliated with KPMG International Cooperative (“KPMG International”), a Swiss entity.
All rights reserved. 29
This report was commissioned by the LEPL “Georgian National Investment Agency” www.investingeorgia.org
Industrial gasesMarket overview – Top 20 Importer companies
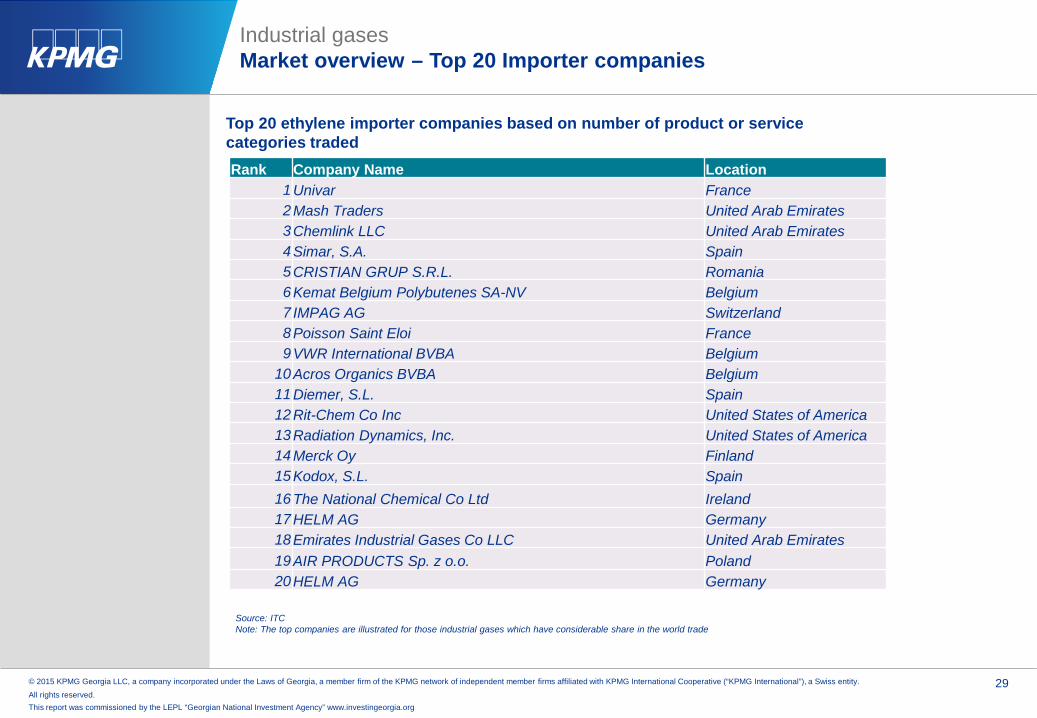
Top 20 ethylene importer companies based on number of product or service categories traded Rank Company Name Location
1 Univar France2 Mash Traders United Arab Emirates3 Chemlink LLC United Arab Emirates4 Simar, S.A. Spain5 CRISTIAN GRUP S.R.L. Romania6 Kemat Belgium Polybutenes SA-NV Belgium7 IMPAG AG Switzerland8 Poisson Saint Eloi France9 VWR International BVBA Belgium
10 Acros Organics BVBA Belgium11 Diemer, S.L. Spain12 Rit-Chem Co Inc United States of America13 Radiation Dynamics, Inc. United States of America14 Merck Oy Finland15 Kodox, S.L. Spain16 The National Chemical Co Ltd Ireland17 HELM AG Germany18 Emirates Industrial Gases Co LLC United Arab Emirates19 AIR PRODUCTS Sp. z o.o. Poland20 HELM AG Germany
Source: ITCNote: The top companies are illustrated for those industrial gases which have considerable share in the world trade
© 2015 KPMG Georgia LLC, a company incorporated under the Laws of Georgia, a member firm of the KPMG network of independent member firms affiliated with KPMG International Cooperative (“KPMG International”), a Swiss entity.
All rights reserved. 30
This report was commissioned by the LEPL “Georgian National Investment Agency” www.investingeorgia.org
Industrial gasesMarket overview – Top 20 Exporter companies
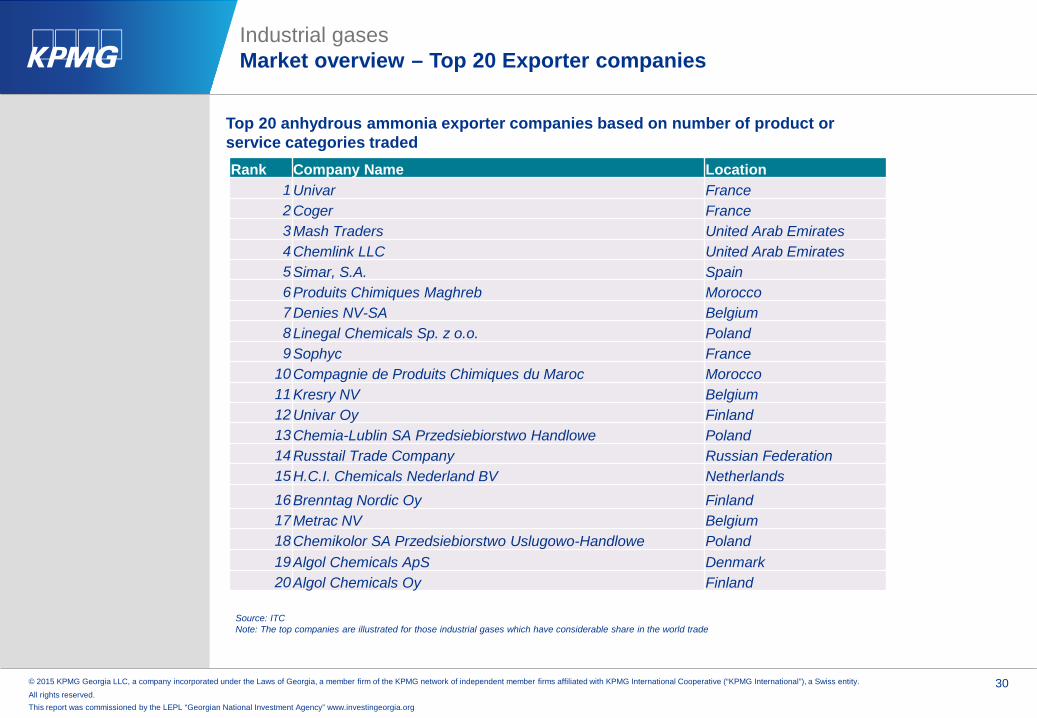
Top 20 anhydrous ammonia exporter companies based on number of product or service categories traded Rank Company Name Location
1 Univar France2 Coger France3 Mash Traders United Arab Emirates4 Chemlink LLC United Arab Emirates5 Simar, S.A. Spain6 Produits Chimiques Maghreb Morocco7 Denies NV-SA Belgium8 Linegal Chemicals Sp. z o.o. Poland9 Sophyc France
10 Compagnie de Produits Chimiques du Maroc Morocco11 Kresry NV Belgium12 Univar Oy Finland13 Chemia-Lublin SA Przedsiebiorstwo Handlowe Poland14 Russtail Trade Company Russian Federation15 H.C.I. Chemicals Nederland BV Netherlands16 Brenntag Nordic Oy Finland17 Metrac NV Belgium18 Chemikolor SA Przedsiebiorstwo Uslugowo-Handlowe Poland19 Algol Chemicals ApS Denmark20 Algol Chemicals Oy Finland
Source: ITCNote: The top companies are illustrated for those industrial gases which have considerable share in the world trade

© 2015 KPMG Georgia LLC, a company incorporated under the Laws of Georgia, a member firm of the KPMG network of independent member firms affiliated with KPMG International Cooperative (“KPMG International”), a Swiss entity.
All rights reserved. 31
This report was commissioned by the LEPL “Georgian National Investment Agency” www.investingeorgia.org
Industrial gasesMarket overview – Top 20 Exporter companies
Top 20 ethylene exporter companies based on number of product or service categories traded Rank Company Name Location
1 Univar France2 Mash Traders United Arab Emirates3 Chemlink LLC United Arab Emirates4 Simar, S.A. Spain5 Denies NV-SA Belgium6 DuPont Performance Elastomers, LLC United States of America7 Kemat Belgium Polybutenes SA-NV Belgium8 Dow Chemical Company United States of America9 Sophyc France
10 Anti-Seize Technology United States of America11 Dedert Corp. United States of America12 Dow Chemical Canada Inc. Canada13 Poisson Saint Eloi France14 VWR International BVBA Belgium15 Timminco Limited Canada16 ANGUS Chemical Co. United States of America17 Chemfil Canada Limited Canada18 Bio Chambers Incorporated Canada19 Acros Organics BVBA Belgium20 Methanex Corporation Canada
Source: ITCNote: The top companies are illustrated for those industrial gases which have considerable share in the world trade

© 2015 KPMG Georgia LLC, a company incorporated under the Laws of Georgia, a member firm of the KPMG network of independent member firms affiliated with KPMG International Cooperative (“KPMG International”), a Swiss entity.
All rights reserved. 32
This report was commissioned by the LEPL “Georgian National Investment Agency” www.investingeorgia.org
In 2014 Georgia was mainly importing industrial gases from Turkey (52%) and the import value was equal to USD 1 million. The mostly imported industrial gas in 2013 was anhydrous ammonia.
Industrial gasesGeorgia - industrial gas import
Source: ITC
Industrial gas import structure by product type in 2009-2013USD thousand 2009 2010 2011 2012 2013Rare gases (excl. argon) 98 178 36 131 296Carbon dioxide 10 34 64 138 295Chlorine 424 549 390 398 489Ethylene - - - - -Hydrogen chloride (hydrochloric acid) 158 188 250 106 125Hydrogen fluoride (hydrofluoric acid) - 3 7 2 5Methylamine, dior trimethylamine and their salts - - - - -Oxirane (ethylene oxide) - - - - -Anhydrous ammonia - - - 578 876Sulphur dioxide - - - - -Hydrogen - - 14 12 14Oxygen 4 1 8 36 41Nitrogen 12 17 7 10 31Argon 37 40 121 80 166Total 743 1,010 897 1,491 2,338Unsaturated acyclic hydrocarbons nes - - 1 3 2Fluorine; bromine - - - - -Inorganic compounds nes;liquidair;compressd air;amalgams o/tof precious metals - - - - -Fluorinated, brominated or iodinated derivatives of acyclic hydrocarbons 173 391 774 967 276Inorganic oxygen compounds of non-metals nes 3 9 14 62 105Total 176 400 789 1,032 383
Source: ITC
Source: ITC
1,010 897
1,491
2,338
1,711
400
789
1,032
383 300
-
500
1,000
1,500
2,000
2,500
2010 2011 2012 2013 2014
Import of industrial gases in 2009 - 2014, USD thousand
Import of main industrial gases Import of basic chemicals including industrial gases
52%
9%
1%
6%
2%1%
3%
5%
12%
2%7%
Industrial gas importer structure by countries, 2014
Turkey
United Arab Emirates
United Kingdom
Ukraine
Germany
Estonia
Russian Federation
India
Iran (Islamic Republic of)
Armenia
Other

© 2015 KPMG Georgia LLC, a company incorporated under the Laws of Georgia, a member firm of the KPMG network of independent member firms affiliated with KPMG International Cooperative (“KPMG International”), a Swiss entity.
All rights reserved. 33
This report was commissioned by the LEPL “Georgian National Investment Agency” www.investingeorgia.org
425
642
513
333395
1 - -55
-0
100
200
300
400
500
600
700
2010 2011 2012 2013 2014
Export of industrial gases in 2010 - 2014, USD thousand
Export of main industrial gases Export of basic chemicals including industrial gases
In 2013 the total export of industrial gases was equal to USD 388 thousand
In 2014 Georgia was mainly exporting industrial gases to Azerbaijan (88%) and the export value was equal to USD 353 thousand. The mostly exported industrial gas in 2013 was carbon dioxide
Industrial gasesGeorgia - industrial gas export
Source: ITC
Industrial gas export structure by product type in 2009-2013USD thousand 2009 2010 2011 2012 2013Rare gases (excl. argon) 5 - - - -Carbon dioxide 48 128 235 226 259Anhydrous ammonia 181 286 371 241 65Chlorine - 3 0 0 1Ethylene - - - - -Hydrogen chloride (hydrochloric acid) - 6 22 27 8Hydrogen fluoride (hydrofluoric acid) - - - - -Methylamine, dior trimethylamine and their salts - - - - -Oxirane (ethylene oxide) - - - - -Sulphur dioxide - - - - -Hydrogen - - - - -Oxygen - - 11 - -Nitrogen - 1 3 - -Argon - 1 - 19 -Total 234 425 642 513 333Unsaturated acyclic hydrocarbons nes - - - - -Fluorine; bromine - - - - -Inorganic compounds nes;liquid air;compressd air;amalgams o/t of precious metals - - - - -Fluorinated, brominated or iodinated derivatives of acyclic hydrocarbons - - - - 3Inorganic oxygen compounds of non-metals nes 23 1 - - 52Total 23 1 - - 55
88%
12%
Industrial gas export structure by countries, 2014
Azerbaijan Armenia
Source: ITC
Source: ITC

© 2015 KPMG Georgia LLC, a company incorporated under the Laws of Georgia, a member firm of the KPMG network of independent member firms affiliated with KPMG International Cooperative (“KPMG International”), a Swiss entity.
All rights reserved. 34
This report was commissioned by the LEPL “Georgian National Investment Agency” www.investingeorgia.org
In 2013 the total production of oxygen and carbon dioxide increased by 2.9%, while the total consumption of the same gases increased by 5.7% for the same period
Industrial gasesGeorgia - industrial gas production and consumption
Due to insignificant level of industrial gas production in Georgia, the National statistical office of Georgia does notprovide information regarding all the industrial gas production volumes and only data for the production volumes ofoxygen and carbon dioxide is available for the period of 2012-2014 September.
8,977 9,344
7,038
9,372 9,538
7,009
-
2,000
4,000
6,000
8,000
10,000
12,000
2012 2013 2014 January-September
Production of industrial gases, tons
Oxygen Carbon dioxide
9,167
9,536
8,452
9,096
7,800
8,000
8,200
8,400
8,600
8,800
9,000
9,200
9,400
9,600
9,800
2012 2013
Consumption of industrial gases, tons
Oxygen Carbon dioxide
Source: National statistical office of Georgia Source: National statistical office of Georgia, KPMG calculations

© 2015 KPMG Georgia LLC, a company incorporated under the Laws of Georgia, a member firm of the KPMG network of independent member firms affiliated with KPMG International Cooperative (“KPMG International”), a Swiss entity.
All rights reserved. 35
This report was commissioned by the LEPL “Georgian National Investment Agency” www.investingeorgia.org
In 2013 Armenia was mainly importing industrial gases from Iran (43%) and the import value was equal to USD 438 thousand. The mostly imported industrial gas in 2013 was chlorine.
Industrial gasesArmenia - industrial gas import
Source: ITC
Source: ITC
Source: ITC
Industrial gas import structure by product type in 2009-2013USD thousand 2009 2010 2011 2012 2013Rare gases (excl. argon) 30 82 32 70 123Carbon dioxide 3 32 26 11 7Chlorine 279 286 312 367 285Ethylene - - - 4 -Hydrogen chloride (hydrochloric acid) 57 69 208 201 168Hydrogen fluoride (hydrofluoric acid) 16 2 4 8 6Methylamine, dior trimethylamine and their salts 3 2 - - 3Oxirane (ethylene oxide) 9 8 - 5 4Anhydrous ammonia 60 48 163 197 33Sulphur dioxide - - - - -Hydrogen - 1 1 - -Oxygen 5 5 23 88 16Nitrogen 5 2 27 4 1Argon 363 130 108 168 268Total 830 667 904 1,123 914Unsaturated acyclic hydrocarbons nes 16 5 19 102 18Fluorine; bromine - - - - -Inorganic compounds nes;liquid air;compressd air;amalgams o/t of precious metals - - - - -Fluorinated, brominated or iodinated derivatives of acyclic hydrocarbons 13 26 132 52 69Inorganic oxygen compounds of non-metals nes 4 14 31 104 18Total 33 45 182 258 105
830
667
904
1,123
914
33 45
182258
105
0
200
400
600
800
1000
1200
2009 2010 2011 2012 2013
Import of industrial gases in 2009 - 2013, USD thousand
Import of main industrial gases Import of basic chemicals including industrial gases
4%4%
9%
6%
18%
43%
3%
4%
9%
Industrial gas importer structure by countries, 2013
Poland
United Arab Emirates
Ukraine
Russian Federation
Germany
Iran (Islamic Republic of)
Georgia
Turkey
Other
© 2015 KPMG Georgia LLC, a company incorporated under the Laws of Georgia, a member firm of the KPMG network of independent member firms affiliated with KPMG International Cooperative (“KPMG International”), a Swiss entity.
All rights reserved. 36
This report was commissioned by the LEPL “Georgian National Investment Agency” www.investingeorgia.org
Industrial gasesArmenia - industrial gas export
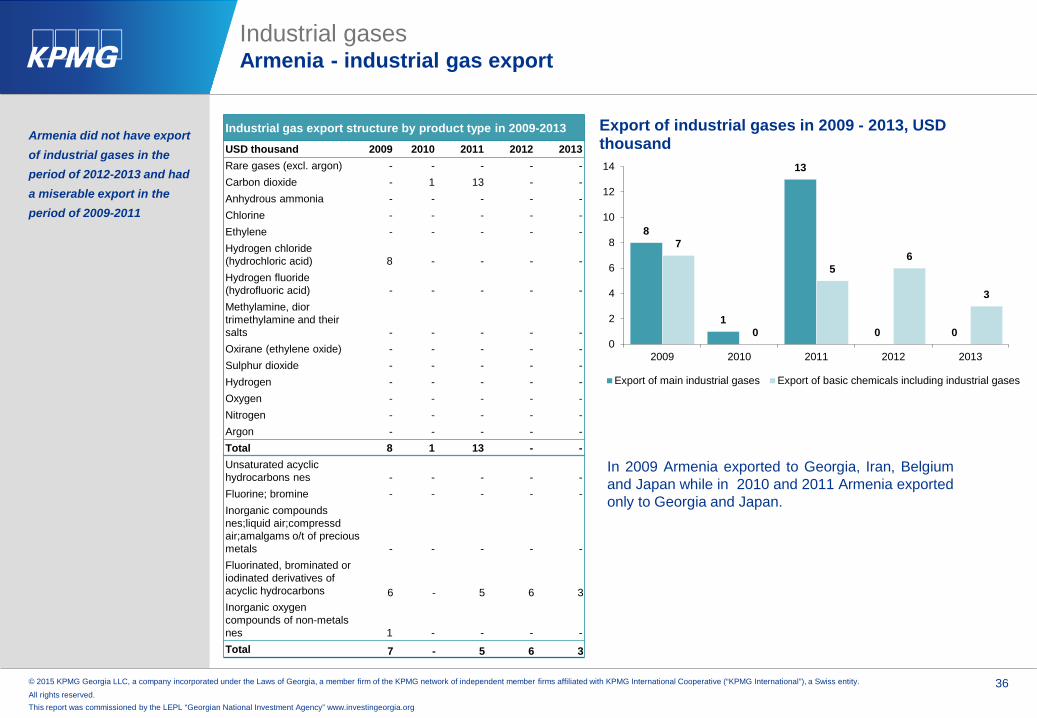
Industrial gas export structure by product type in 2009-2013USD thousand 2009 2010 2011 2012 2013Rare gases (excl. argon) - - - - -Carbon dioxide - 1 13 - -Anhydrous ammonia - - - - -Chlorine - - - - -Ethylene - - - - -Hydrogen chloride (hydrochloric acid) 8 - - - -Hydrogen fluoride (hydrofluoric acid) - - - - -Methylamine, dior trimethylamine and their salts - - - - -Oxirane (ethylene oxide) - - - - -Sulphur dioxide - - - - -Hydrogen - - - - -Oxygen - - - - -Nitrogen - - - - -Argon - - - - -Total 8 1 13 - -Unsaturated acyclic hydrocarbons nes - - - - -Fluorine; bromine - - - - -Inorganic compounds nes;liquid air;compressd air;amalgams o/t of precious metals - - - - -Fluorinated, brominated or iodinated derivatives of acyclic hydrocarbons 6 - 5 6 3Inorganic oxygen compounds of non-metals nes 1 - - - -Total 7 - 5 6 3
Armenia did not have export of industrial gases in the period of 2012-2013 and had a miserable export in the period of 2009-2011
In 2009 Armenia exported to Georgia, Iran, Belgiumand Japan while in 2010 and 2011 Armenia exportedonly to Georgia and Japan.
8
1
13
0 0
7
0
5 6
3
0
2
4
6
8
10
12
14
2009 2010 2011 2012 2013
Export of industrial gases in 2009 - 2013, USD thousand
Export of main industrial gases Export of basic chemicals including industrial gases
© 2015 KPMG Georgia LLC, a company incorporated under the Laws of Georgia, a member firm of the KPMG network of independent member firms affiliated with KPMG International Cooperative (“KPMG International”), a Swiss entity.
All rights reserved. 37
This report was commissioned by the LEPL “Georgian National Investment Agency” www.investingeorgia.org
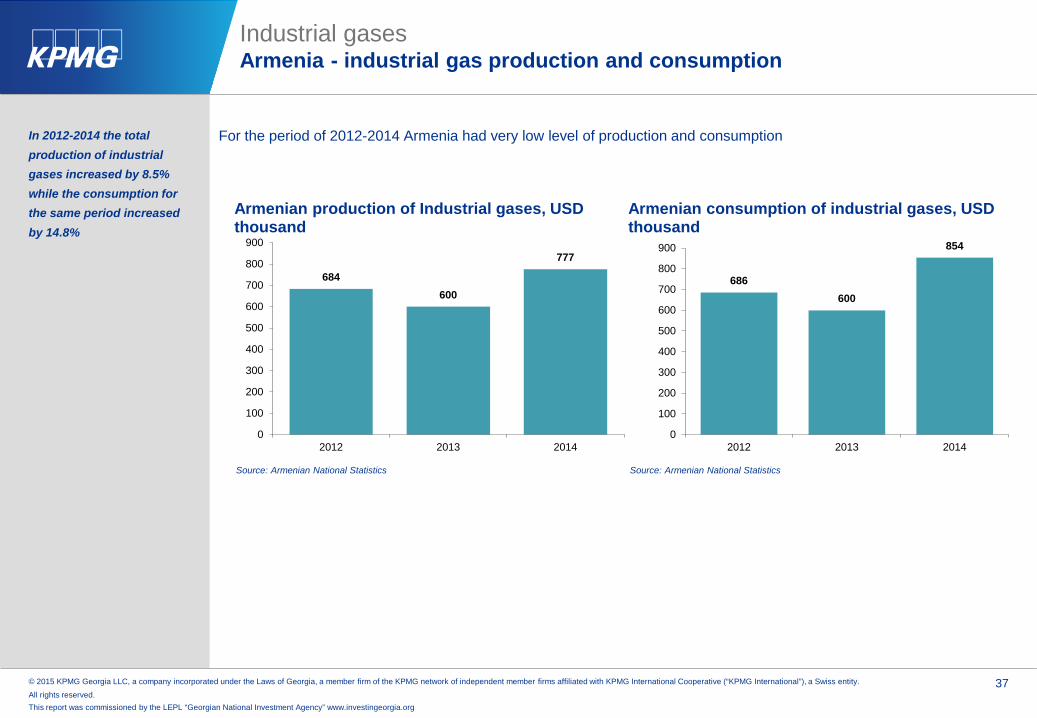
In 2012-2014 the total production of industrial gases increased by 8.5% while the consumption for the same period increased by 14.8%
Industrial gasesArmenia - industrial gas production and consumption
For the period of 2012-2014 Armenia had very low level of production and consumption
Source: Armenian National Statistics Source: Armenian National Statistics
684600
777
0
100
200
300
400
500
600
700
800
900
2012 2013 2014
Armenian production of Industrial gases, USD thousand
686600
854
0
100
200
300
400
500
600
700
800
900
2012 2013 2014
Armenian consumption of industrial gases, USD thousand
© 2015 KPMG Georgia LLC, a company incorporated under the Laws of Georgia, a member firm of the KPMG network of independent member firms affiliated with KPMG International Cooperative (“KPMG International”), a Swiss entity.
All rights reserved. 38
This report was commissioned by the LEPL “Georgian National Investment Agency” www.investingeorgia.org
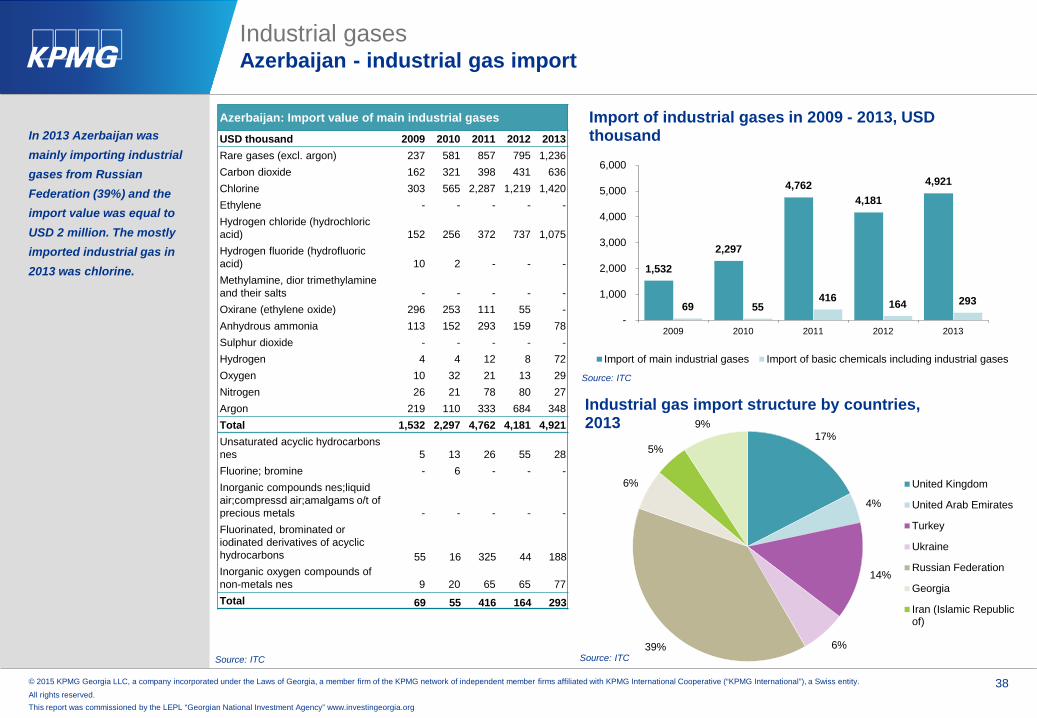
In 2013 Azerbaijan was mainly importing industrial gases from Russian Federation (39%) and the import value was equal to USD 2 million. The mostly imported industrial gas in 2013 was chlorine.
Industrial gasesAzerbaijan - industrial gas import
Source: ITC
1,532
2,297
4,762 4,181
4,921
69 55 416 164 293
-
1,000
2,000
3,000
4,000
5,000
6,000
2009 2010 2011 2012 2013
Import of industrial gases in 2009 - 2013, USD thousand
Import of main industrial gases Import of basic chemicals including industrial gases
Source: ITC
Source: ITC
Azerbaijan: Import value of main industrial gases
USD thousand 2009 2010 2011 2012 2013Rare gases (excl. argon) 237 581 857 795 1,236Carbon dioxide 162 321 398 431 636Chlorine 303 565 2,287 1,219 1,420Ethylene - - - - -Hydrogen chloride (hydrochloric acid) 152 256 372 737 1,075Hydrogen fluoride (hydrofluoric acid) 10 2 - - -Methylamine, dior trimethylamine and their salts - - - - -Oxirane (ethylene oxide) 296 253 111 55 -Anhydrous ammonia 113 152 293 159 78Sulphur dioxide - - - - -Hydrogen 4 4 12 8 72Oxygen 10 32 21 13 29Nitrogen 26 21 78 80 27Argon 219 110 333 684 348Total 1,532 2,297 4,762 4,181 4,921Unsaturated acyclic hydrocarbons nes 5 13 26 55 28Fluorine; bromine - 6 - - -Inorganic compounds nes;liquid air;compressd air;amalgams o/t of precious metals - - - - -Fluorinated, brominated or iodinated derivatives of acyclic hydrocarbons 55 16 325 44 188Inorganic oxygen compounds of non-metals nes 9 20 65 65 77Total 69 55 416 164 293
17%
4%
14%
6%39%
6%
5%
9%
Industrial gas import structure by countries, 2013
United Kingdom
United Arab Emirates
Turkey
Ukraine
Russian Federation
Georgia
Iran (Islamic Republicof)

© 2015 KPMG Georgia LLC, a company incorporated under the Laws of Georgia, a member firm of the KPMG network of independent member firms affiliated with KPMG International Cooperative (“KPMG International”), a Swiss entity.
All rights reserved. 39
This report was commissioned by the LEPL “Georgian National Investment Agency” www.investingeorgia.org
In 2013 Azerbaijan didn’t export industrial gases
Industrial gasesAzerbaijan - industrial gas export
Source: ITC
Industrial gas export structure by product type in 2009-2013USD thousand 2009 2010 2011 2012 2013Rare gases (excl. argon) - 25 - - -Carbon dioxide 1 - - - -Anhydrous ammonia - - - - -Chlorine 28 - - - -Ethylene - - - - -Hydrogen chloride (hydrochloric acid) - - - - -Hydrogen fluoride (hydrofluoric acid) - - - - -Methylamine, dior trimethylamine and their salts - - - - -Oxirane (ethylene oxide) - - - - -Sulphur dioxide - - - - -Hydrogen - - - - -Oxygen - - - - -Nitrogen 6 - - 4 -Argon - - - - -Total 35 25 - 4 -Unsaturated acyclic hydrocarbons nes - - - - -Fluorine; bromine - - - - -Inorganic compounds nes;liquid air;compressd air;amalgams o/t of precious metals - - - - -Fluorinated, brominated or iodinated derivatives of acyclic hydrocarbons - - - - -Inorganic oxygen compounds of non-metals nes - - - - -Total - - - - -
35
25
0
4
00
5
10
15
20
25
30
35
40
2009 2010 2011 2012 2013
Export of main industrial gases, 2009-2013, USD thousand
Source: ITC
For the period of 2009-2013 Azerbaijan didn’t exportbasic chemicals including industrial gases.
In 2009 Azerbaijan exported only to Georgia, in 2010the country exported to France while in 2012Azerbaijan exported to United Kingdom.

© 2015 KPMG Georgia LLC, a company incorporated under the Laws of Georgia, a member firm of the KPMG network of independent member firms affiliated with KPMG International Cooperative (“KPMG International”), a Swiss entity.
All rights reserved. 40
This report was commissioned by the LEPL “Georgian National Investment Agency” www.investingeorgia.org
In 2013 the production of industrial gases was 122 thousand tons
Industrial gasesAzerbaijan - industrial gas production and consumption
Source: State Statistical Committee of the Republic of Azerbaijan
The State Statistical Committee ofAzerbaijan provides information onproduction volumes of nitrogen, oxygen,liquid air, compressed air, chlorine,hydrogen chloride and ethylene. Both theimport and the export of ethylene is equalto zero, so the country’s consumption ofethylene is equal to the productionvolumes. For the period of 2009-2013 thetotal consumption of industrial gases(including ethylene) grew on overage by56%.
Nitrogen Oxygen Liquid air,compressed air Chlorine Hydrogen chloride Ethylene
2009 17,365 3,934 6,017 3,946 3,300 -2010 19,736 1,985 6,064 2,658 3,300 55,0082011 25,385 3,417 7,939 5,630 4,200 77,5752012 24,175 17,080 7 87 100 69,1572013 21,422 13,744 8,591 - - 78,469
- 10,000 20,000 30,000 40,000 50,000 60,000 70,000 80,000 90,000
Production of Industrial gases, 2009-2013, ton
2009
2010
2011
2012
2013
17,365 19,737 25,589 24,280 21,439
3,934 1,987
3,423
17,082 13,748 5,367 4,315 11,304
1,332 1,509 3,468 3,991 5,452 2,562 3,902
0%10%20%30%40%50%60%70%80%90%
100%
2009 2010 2011 2012 2013
Consumption of Industrial gases, 2009-2013, ton
Nitrogen Oxygen Chlorine Hydrogen chloride
Source: State Statistical Committee of the Republic of Azerbaijan, KPMG calculationsNote (2) liquid air, compressed air had different grouping in data sources, thus are not included in the consumption calculations
© 2015 KPMG Georgia LLC, a company incorporated under the Laws of Georgia, a member firm of the KPMG network of independent member firms affiliated with KPMG International Cooperative (“KPMG International”), a Swiss entity.
All rights reserved. 41
This report was commissioned by the LEPL “Georgian National Investment Agency” www.investingeorgia.org
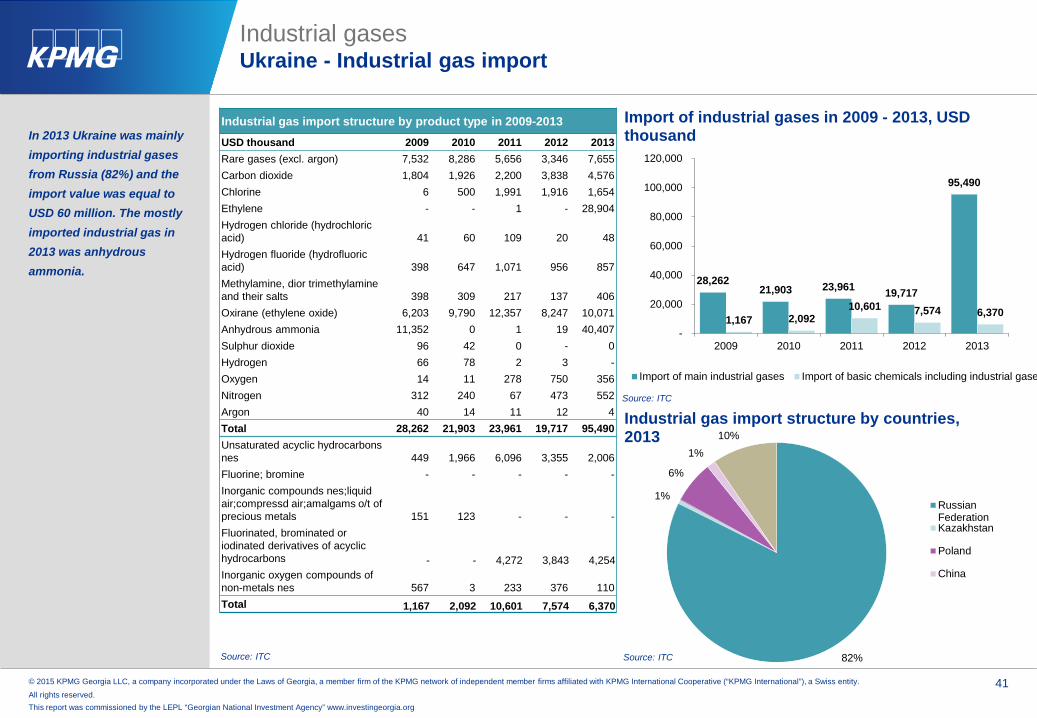
In 2013 Ukraine was mainly importing industrial gases from Russia (82%) and the import value was equal to USD 60 million. The mostly imported industrial gas in 2013 was anhydrous ammonia.
Industrial gasesUkraine - Industrial gas import
Source: ITC
Industrial gas import structure by product type in 2009-2013USD thousand 2009 2010 2011 2012 2013Rare gases (excl. argon) 7,532 8,286 5,656 3,346 7,655Carbon dioxide 1,804 1,926 2,200 3,838 4,576Chlorine 6 500 1,991 1,916 1,654Ethylene - - 1 - 28,904Hydrogen chloride (hydrochloric acid) 41 60 109 20 48Hydrogen fluoride (hydrofluoric acid) 398 647 1,071 956 857Methylamine, dior trimethylamine and their salts 398 309 217 137 406Oxirane (ethylene oxide) 6,203 9,790 12,357 8,247 10,071Anhydrous ammonia 11,352 0 1 19 40,407Sulphur dioxide 96 42 0 - 0Hydrogen 66 78 2 3 -Oxygen 14 11 278 750 356Nitrogen 312 240 67 473 552Argon 40 14 11 12 4Total 28,262 21,903 23,961 19,717 95,490Unsaturated acyclic hydrocarbons nes 449 1,966 6,096 3,355 2,006Fluorine; bromine - - - - -Inorganic compounds nes;liquid air;compressd air;amalgams o/t of precious metals 151 123 - - -Fluorinated, brominated or iodinated derivatives of acyclic hydrocarbons - - 4,272 3,843 4,254Inorganic oxygen compounds of non-metals nes 567 3 233 376 110Total 1,167 2,092 10,601 7,574 6,370
Source: ITC
Source: ITC
28,262 21,903 23,961 19,717
95,490
1,167 2,092 10,601 7,574 6,370
-
20,000
40,000
60,000
80,000
100,000
120,000
2009 2010 2011 2012 2013
Import of industrial gases in 2009 - 2013, USD thousand
Import of main industrial gases Import of basic chemicals including industrial gase
82%
1%
6%
1%10%
Industrial gas import structure by countries, 2013
RussianFederationKazakhstan
Poland
China
© 2015 KPMG Georgia LLC, a company incorporated under the Laws of Georgia, a member firm of the KPMG network of independent member firms affiliated with KPMG International Cooperative (“KPMG International”), a Swiss entity.
All rights reserved. 42
This report was commissioned by the LEPL “Georgian National Investment Agency” www.investingeorgia.org
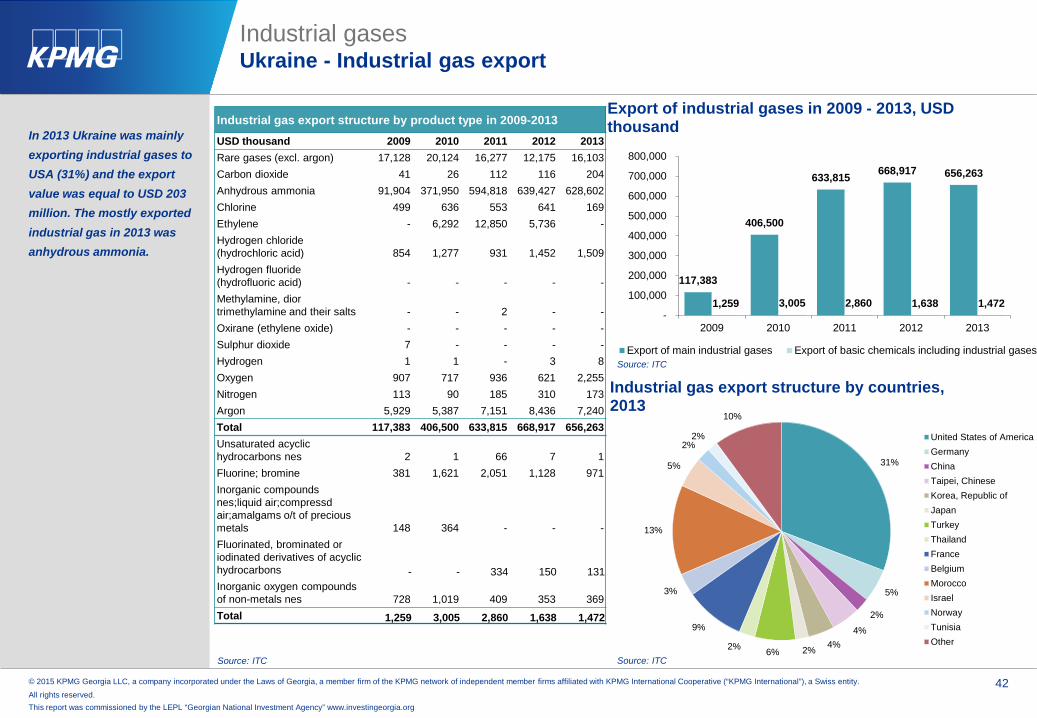
In 2013 Ukraine was mainly exporting industrial gases to USA (31%) and the export value was equal to USD 203 million. The mostly exported industrial gas in 2013 was anhydrous ammonia.
Industrial gasesUkraine - Industrial gas export
Source: ITC
Industrial gas export structure by product type in 2009-2013USD thousand 2009 2010 2011 2012 2013Rare gases (excl. argon) 17,128 20,124 16,277 12,175 16,103Carbon dioxide 41 26 112 116 204Anhydrous ammonia 91,904 371,950 594,818 639,427 628,602Chlorine 499 636 553 641 169Ethylene - 6,292 12,850 5,736 -Hydrogen chloride (hydrochloric acid) 854 1,277 931 1,452 1,509Hydrogen fluoride (hydrofluoric acid) - - - - -Methylamine, dior trimethylamine and their salts - - 2 - -Oxirane (ethylene oxide) - - - - -Sulphur dioxide 7 - - - -Hydrogen 1 1 - 3 8Oxygen 907 717 936 621 2,255Nitrogen 113 90 185 310 173Argon 5,929 5,387 7,151 8,436 7,240Total 117,383 406,500 633,815 668,917 656,263Unsaturated acyclic hydrocarbons nes 2 1 66 7 1Fluorine; bromine 381 1,621 2,051 1,128 971Inorganic compounds nes;liquid air;compressd air;amalgams o/t of precious metals 148 364 - - -Fluorinated, brominated or iodinated derivatives of acyclic hydrocarbons - - 334 150 131Inorganic oxygen compounds of non-metals nes 728 1,019 409 353 369Total 1,259 3,005 2,860 1,638 1,472
Source: ITC
Source: ITC
117,383
406,500
633,815 668,917 656,263
1,259 3,005 2,860 1,638 1,472 -
100,000
200,000
300,000
400,000
500,000
600,000
700,000
800,000
2009 2010 2011 2012 2013
Export of industrial gases in 2009 - 2013, USD thousand
Export of main industrial gases Export of basic chemicals including industrial gases
31%
5%
2%
4%4%2%6%2%
9%
3%
13%
5%
2%2%
10%
Industrial gas export structure by countries, 2013
United States of AmericaGermanyChinaTaipei, ChineseKorea, Republic ofJapanTurkeyThailandFranceBelgiumMoroccoIsraelNorwayTunisiaOther
© 2015 KPMG Georgia LLC, a company incorporated under the Laws of Georgia, a member firm of the KPMG network of independent member firms affiliated with KPMG International Cooperative (“KPMG International”), a Swiss entity.
All rights reserved. 43
This report was commissioned by the LEPL “Georgian National Investment Agency” www.investingeorgia.org
1,757 4,229 169,734
637,536 649,315
2,269,411
-
500,000
1,000,000
1,500,000
2,000,000
2,500,000
Argon, ton Hydrogen, ton Nitrogen, ton Oxygen, ton Carbon dioxide, ton AnhydrousAmmonia ton
Consumption of Industrial gases, 2013
46,015 795 127 166,044
644,751 621,381
493 58,400
3,479,920
-
500,000
1,000,000
1,500,000
2,000,000
2,500,000
3,000,000
3,500,000
4,000,000
Argon, ton Rare gases(excluding
argon), thsd.m³
Hydrogen,ton
Nitrogen, ton Oxygen, ton Carbondioxide, ton
Inorganicoxygen
compounds,ton
Liquid air;compressed
air, ton
AnhydrousAmmonia ton
Production of Industrial gases, 2013
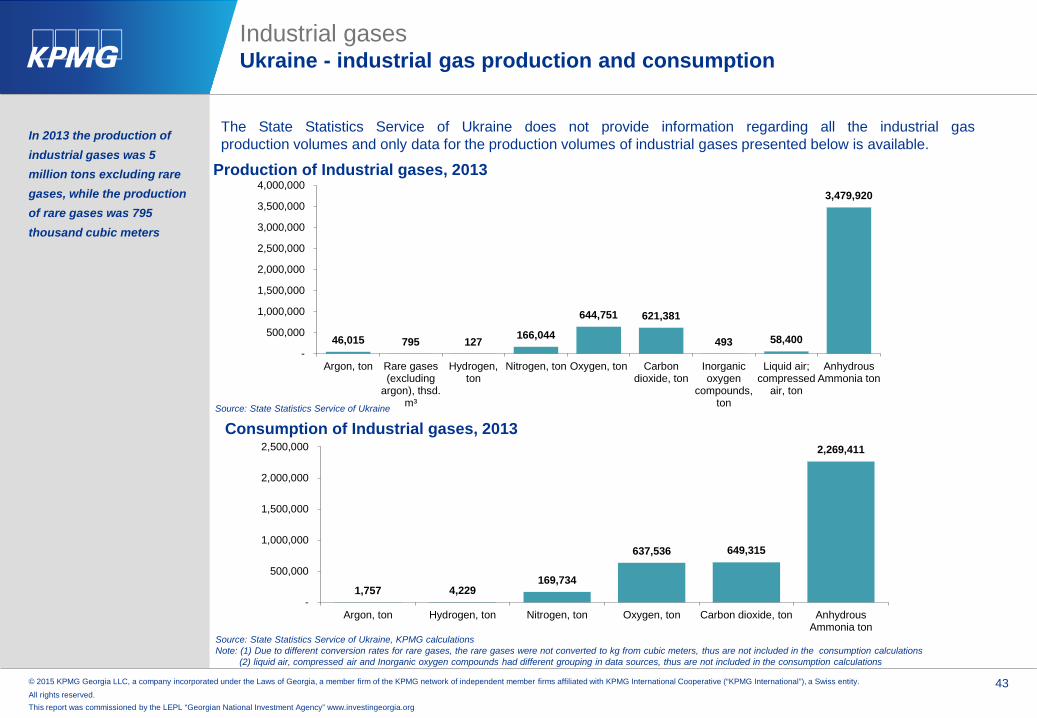
In 2013 the production of industrial gases was 5 million tons excluding rare gases, while the production of rare gases was 795 thousand cubic meters
Industrial gasesUkraine - industrial gas production and consumption
Source: State Statistics Service of Ukraine
The State Statistics Service of Ukraine does not provide information regarding all the industrial gasproduction volumes and only data for the production volumes of industrial gases presented below is available.
Source: State Statistics Service of Ukraine, KPMG calculationsNote: (1) Due to different conversion rates for rare gases, the rare gases were not converted to kg from cubic meters, thus are not included in the consumption calculations
(2) liquid air, compressed air and Inorganic oxygen compounds had different grouping in data sources, thus are not included in the consumption calculations
© 2015 KPMG Georgia LLC, a company incorporated under the Laws of Georgia, a member firm of the KPMG network of independent member firms affiliated with KPMG International Cooperative (“KPMG International”), a Swiss entity.
All rights reserved. 44
This report was commissioned by the LEPL “Georgian National Investment Agency” www.investingeorgia.org
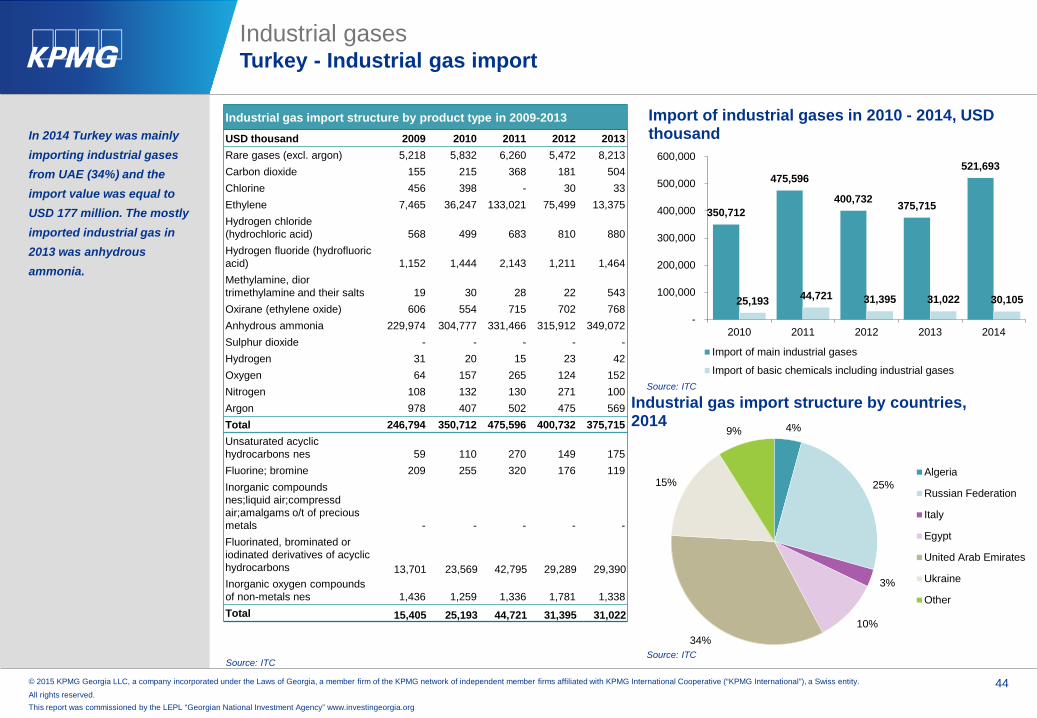
In 2014 Turkey was mainly importing industrial gases from UAE (34%) and the import value was equal to USD 177 million. The mostly imported industrial gas in 2013 was anhydrous ammonia.
Industrial gasesTurkey - Industrial gas import
Source: ITC
Industrial gas import structure by product type in 2009-2013USD thousand 2009 2010 2011 2012 2013Rare gases (excl. argon) 5,218 5,832 6,260 5,472 8,213Carbon dioxide 155 215 368 181 504Chlorine 456 398 - 30 33Ethylene 7,465 36,247 133,021 75,499 13,375Hydrogen chloride (hydrochloric acid) 568 499 683 810 880Hydrogen fluoride (hydrofluoric acid) 1,152 1,444 2,143 1,211 1,464Methylamine, dior trimethylamine and their salts 19 30 28 22 543Oxirane (ethylene oxide) 606 554 715 702 768Anhydrous ammonia 229,974 304,777 331,466 315,912 349,072Sulphur dioxide - - - - -Hydrogen 31 20 15 23 42Oxygen 64 157 265 124 152Nitrogen 108 132 130 271 100Argon 978 407 502 475 569Total 246,794 350,712 475,596 400,732 375,715Unsaturated acyclic hydrocarbons nes 59 110 270 149 175Fluorine; bromine 209 255 320 176 119Inorganic compounds nes;liquid air;compressd air;amalgams o/t of precious metals - - - - -Fluorinated, brominated or iodinated derivatives of acyclic hydrocarbons 13,701 23,569 42,795 29,289 29,390 Inorganic oxygen compounds of non-metals nes 1,436 1,259 1,336 1,781 1,338Total 15,405 25,193 44,721 31,395 31,022
Source: ITC
350,712
475,596
400,732 375,715
521,693
25,193 44,721 31,395 31,022 30,105
-
100,000
200,000
300,000
400,000
500,000
600,000
2010 2011 2012 2013 2014
Import of industrial gases in 2010 - 2014, USD thousand
Import of main industrial gases
Import of basic chemicals including industrial gases
Source: ITC
4%
25%
3%
10%34%
15%
9%
Industrial gas import structure by countries, 2014
Algeria
Russian Federation
Italy
Egypt
United Arab Emirates
Ukraine
Other

© 2015 KPMG Georgia LLC, a company incorporated under the Laws of Georgia, a member firm of the KPMG network of independent member firms affiliated with KPMG International Cooperative (“KPMG International”), a Swiss entity.
All rights reserved. 45
This report was commissioned by the LEPL “Georgian National Investment Agency” www.investingeorgia.org
In 2014 Turkey was mainly exporting industrial gases to France (22%) and the export value was equal to USD 27.5 million. The mostly exported industrial gas in 2013 was anhydrous ammonia.
Industrial gasesTurkey - Industrial gas export
Industrial gas export structure by product type in 2009-2013USD thousand 2009 2010 2011 2012 2013Rare gases (excl. argon) 203 494 292 418 525Carbon dioxide 6,641 7,125 6,907 5,616 5,299Anhydrous ammonia 1,035 738 35,794 81,803 32,534Chlorine 844 721 920 859 1776Ethylene 6,195 10,120 34,640 11,589 -Hydrogen chloride (hydrochloric acid) 403 463 561 518 622Hydrogen fluoride (hydrofluoric acid) 4 10 18 4 2Methylamine, dior trimethylamine and their salts 2,726 3,649 4,054 4,237 4,439Oxirane (ethylene oxide) 166 41 83 145 181Sulphur dioxide - - - - -Hydrogen 3 3 1 63 57Oxygen 598 840 938 829 985Nitrogen 892 876 397 515 610Argon 866 1,021 921 2,087 1,485Total 20,576 26,101 85,526 108,683 48,515Unsaturated acyclic hydrocarbons nes 261 1,673 2,950 1,529 2,738Fluorine; bromine - 2 8 3 -Inorganic compounds nes;liquid air;compressd air;amalgams o/t of precious metals - - - - -Fluorinated, brominated or iodinated derivatives of acyclic hydrocarbons 774 1,306 1,458 1,021 1,346 Inorganic oxygen compounds of non-metals nes 67 65 53 142 176Total 328 1,740 3,011 1,674 2,914
Source: ITC Source: ITC
Source: ITC
Source: ITC
26,101
85,526
108,683
48,515
121,508
3,046 4,469 2,695 4,260 4,517 -
20,000
40,000
60,000
80,000
100,000
120,000
140,000
2010 2011 2012 2013 2014
Export of industrial gases in 2010 - 2014, USD thousand
Export of main industrial gasesExport of basic chemicals including industrial gases
1% 7%1%
22%
9%
5%1%2%4%
17%
9%
5%
3%
4%
6%5%
Industrial gas export structure by countries, 2014
AzerbaijanIraqFree ZonesFranceGermanyIsraelSyrian Arab RepublicLebanonEgyptJordanChinaIndiaUnited KingdomNetherlandsMoroccoOther

© 2015 KPMG Georgia LLC, a company incorporated under the Laws of Georgia, a member firm of the KPMG network of independent member firms affiliated with KPMG International Cooperative (“KPMG International”), a Swiss entity.
All rights reserved. 46
This report was commissioned by the LEPL “Georgian National Investment Agency” www.investingeorgia.org
For the period of 2010-2014 both the total production volume and total consumption of argon and oxygen increased by 9.3% on average
Industrial gasesTurkey - industrial gas production and consumption
The Turkish Statistical Institute provides information on production volumes of nitrogen, hydrogen, argon and oxygen. Asthere are two producers of the nitrogen in Turkey, the Turkish Statistical Institute for confidentiality purposes does notprovide information regarding the production volumes. According to the Turkish Statistical Institute, the production volumeof hydrogen is minor so the volume is not published.
Source: Turkish Statistical Institute
Production of industrial gases
Cubic meters 2010 2011 2012 2013 2014Argon 12,765,812 16,619,540 17,701,354 20,933,989 25,371,890Oxygen 1,478,724,573 1,674,588,507 1,845,891,229 2,026,186,856 2,101,315,258
Consumption of industrial gases
cubic meters 2010 2011 2012 2013 2014Argon 12,594,098 16,405,296 17,075,205 20,583,461 27,021,345 Oxygen 1,446,681,182 1,638,962,437 1,807,333,304 1,983,497,319 2,051,243,853
Source: Turkish Statistical Institute

© 2015 KPMG Georgia LLC, a company incorporated under the Laws of Georgia, a member firm of the KPMG network of independent member firms affiliated with KPMG International Cooperative (“KPMG International”), a Swiss entity.
All rights reserved. 47
This report was commissioned by the LEPL “Georgian National Investment Agency” www.investingeorgia.org
In 2013 the main importer among the Central Asian countries was Kazakhstan (86%), which had exporting value equal to USD 25.5 million. The mostly imported industrial gas in 2013 was hydrogen chloride.
Industrial gasesCentral Asia - Industrial gas import
Source: ITC
Industrial gas import structure by product type in 2009-2013USD thousand 2009 2010 2011 2012 2013Rare gases (excl. argon) 824 1,055 1,167 1,962 2,034Carbon dioxide 620 689 1,376 2,218 2,368Chlorine 2,537 1,721 2,414 2,321 525Ethylene - - - - -Hydrogen chloride (hydrochloric acid) 5,316 4,100 8,942 8,186 8,118Hydrogen fluoride (hydrofluoric acid) 301 212 285 253 223Methylamine, dior trimethylamine and their salts - - 90 2 15Oxirane (ethylene oxide) 36 18 103 176 97Anhydrous ammonia 1,805 2,562 5,144 7,057 8,096Sulphur dioxide - - - - -Hydrogen 71 161 136 179 94Oxygen 224 198 512 883 386Nitrogen 455 522 1,096 816 924Argon 2,682 1,283 1,647 2,004 1,950Total 14,871 12,521 22,912 26,057 24,830Unsaturated acyclic hydrocarbons nes 159 283 293 377 169Fluorine; bromine 1 3 12 3 116Inorganic compounds nes;liquid air;compressd air;amalgams o/t of precious metals 75 235 - - -Fluorinated, brominated or iodinated derivatives of acyclic hydrocarbons
331 1,039 1,612 2,630 3,537
Inorganic oxygen compounds of non-metals nes 270 3,883 11,151 3,756 985Total 836 5,443 13,068 6,766 4,807
Source: ITC
Source: ITC
14,871 12,521
22,912 26,057 24,830
836
5,443
13,068
6,766 4,807
-
5,000
10,000
15,000
20,000
25,000
30,000
2009 2010 2011 2012 2013
Import of industrial gases in 2009 - 2013, USD thousand
Import of main industrial gases Import of basic chemicals including industrial gases
86%
3%4%
2% 5%
Central Asia industrial gas importer countries structure, 2013
Kazakhstan
Kyrgyzstan
Uzbekistan
Tajikistan
Turkmenistan
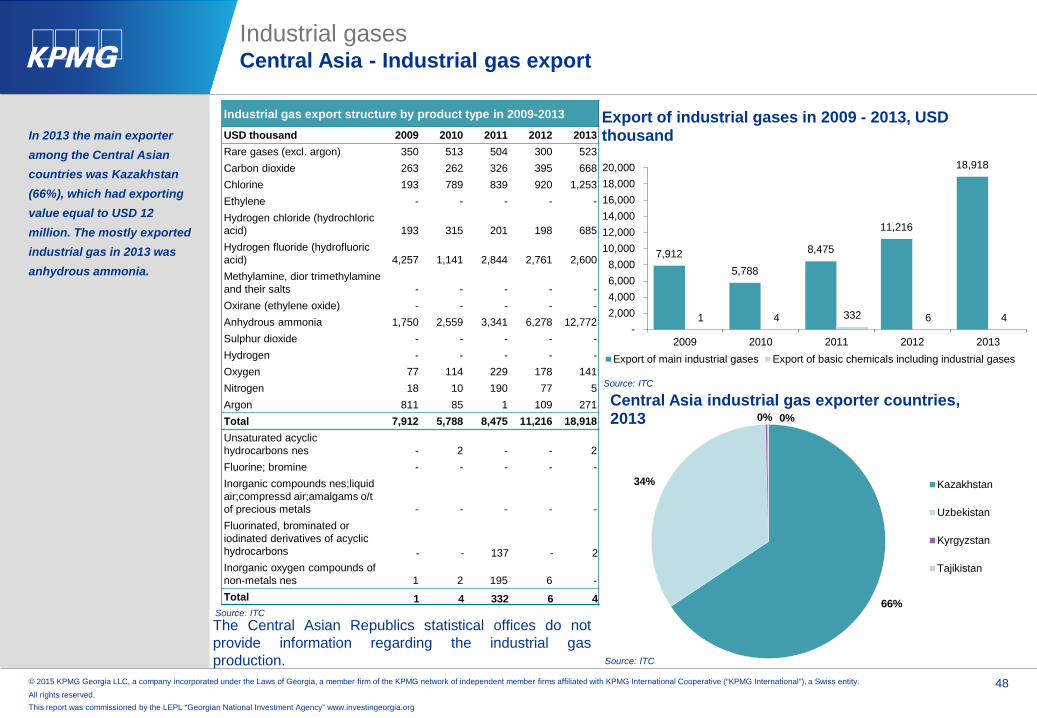
© 2015 KPMG Georgia LLC, a company incorporated under the Laws of Georgia, a member firm of the KPMG network of independent member firms affiliated with KPMG International Cooperative (“KPMG International”), a Swiss entity.
All rights reserved. 48
This report was commissioned by the LEPL “Georgian National Investment Agency” www.investingeorgia.org
Industrial gas export structure by product type in 2009-2013USD thousand 2009 2010 2011 2012 2013Rare gases (excl. argon) 350 513 504 300 523Carbon dioxide 263 262 326 395 668Chlorine 193 789 839 920 1,253Ethylene - - - - -Hydrogen chloride (hydrochloric acid) 193 315 201 198 685Hydrogen fluoride (hydrofluoric acid) 4,257 1,141 2,844 2,761 2,600Methylamine, dior trimethylamine and their salts - - - - -Oxirane (ethylene oxide) - - - - -Anhydrous ammonia 1,750 2,559 3,341 6,278 12,772Sulphur dioxide - - - - -Hydrogen - - - - -Oxygen 77 114 229 178 141Nitrogen 18 10 190 77 5Argon 811 85 1 109 271Total 7,912 5,788 8,475 11,216 18,918Unsaturated acyclic hydrocarbons nes - 2 - - 2Fluorine; bromine - - - - -Inorganic compounds nes;liquid air;compressd air;amalgams o/t of precious metals - - - - -Fluorinated, brominated or iodinated derivatives of acyclic hydrocarbons - - 137 - 2 Inorganic oxygen compounds of non-metals nes 1 2 195 6 -Total 1 4 332 6 4
In 2013 the main exporter among the Central Asian countries was Kazakhstan (66%), which had exporting value equal to USD 12 million. The mostly exported industrial gas in 2013 was anhydrous ammonia.
Industrial gasesCentral Asia - Industrial gas export
Source: ITCThe Central Asian Republics statistical offices do notprovide information regarding the industrial gasproduction.
66%
34%
0% 0%Central Asia industrial gas exporter countries, 2013
Kazakhstan
Uzbekistan
Kyrgyzstan
Tajikistan
Source: ITC
Source: ITC
7,912 5,788
8,475
11,216
18,918
1 4 332 6 4 -
2,0004,0006,0008,000
10,00012,00014,00016,00018,00020,000
2009 2010 2011 2012 2013
Export of industrial gases in 2009 - 2013, USD thousand
Export of main industrial gases Export of basic chemicals including industrial gases

© 2015 KPMG Georgia LLC, a company incorporated under the Laws of Georgia, a member firm of the KPMG network of independent member firms affiliated with KPMG International Cooperative (“KPMG International”), a Swiss entity.
All rights reserved. 49
This report was commissioned by the LEPL “Georgian National Investment Agency” www.investingeorgia.org
Industrial gas import structure by product type in 2009-2013USD thousand 2009 2010 2011 2012 2013Rare gases (excl. argon) 328,054 371,099 416,888 464,125 471,490Carbon dioxide 151,994 167,357 182,251 169,355 198,535Chlorine 35,782 47,829 55,444 46,548 43,482Ethylene 2,631,333 3,563,020 4,430,449 4,362,488 4,769,568Hydrogen chloride (hydrochloric acid) 114,999 124,524 130,054 113,068 120,932Hydrogen fluoride (hydrofluoric acid) 100,519 110,381 138,765 148,627 152,565Methylamine, dior trimethylamine and their salts 465,364 251,165 533,604 508,171 251,166Oxirane (ethylene oxide) 410,279 496,888 547,433 503,279 558,040Anhydrous ammonia 1,184,827 1,603,257 2,274,282 2,196,544 2,097,464Sulphur dioxide - - - - -Hydrogen 118,218 137,526 139,056 111,049 119,870Oxygen 122,424 132,222 145,469 126,031 143,097Nitrogen 102,690 115,772 142,331 91,461 124,581Argon 113,127 101,916 128,839 100,566 113,443Total 5,879,610 7,222,956 9,264,865 8,941,312 9,164,233Unsaturated acyclic hydrocarbons nes 762,419 983,573 1,194,734 1,087,576 1,291,581Fluorine; bromine 67,295 55,347 92,787 91,624 88,057Inorganic compounds nes;liquid air;compressd air;amalgams o/t of precious metals - - - - -Fluorinated, brominated or iodinated derivatives of acyclic hydrocarbons
520,661 797,540 1,135,133 860,796 752,339
Inorganic oxygen compounds of non-metals nes 73,591 89,804 100,640 92,555 98,140Total 1,423,966 1,926,264 2,523,294 2,132,551 2,230,117
In 2013 the main importer among the EU countries was Belgium (34%), which had importing value equal to USD 3.9 billion. The mostly imported industrial gas in 2013 was ethylene.
Industrial gasesEU - Industrial gas import
Source: ITC
Source: ITC
Source: ITC
5,879,610
7,222,956
9,264,865 8,941,312 9,164,233
1,423,966 1,926,264
2,523,294 2,132,551 2,230,117
-1,000,0002,000,0003,000,0004,000,0005,000,0006,000,0007,000,0008,000,0009,000,000
10,000,000
2009 2010 2011 2012 2013
Import of industrial gases in 2009 - 2013, USD thousand
Import of main industrial gasesImport of basic chemicals including industrial gases
34%
11%14%
7%
2%1%1%1%3%
10%
4%
7%1%1% 3%
EU industrial gas importer countries structure, 2013
BelgiumFranceGermanySpainFinlandLithuaniaPortugalCzech RepublicSwedenNetherlandsItalyUnited KingdomAustriaRomaniaOther

© 2015 KPMG Georgia LLC, a company incorporated under the Laws of Georgia, a member firm of the KPMG network of independent member firms affiliated with KPMG International Cooperative (“KPMG International”), a Swiss entity.
All rights reserved. 50
This report was commissioned by the LEPL “Georgian National Investment Agency” www.investingeorgia.org
In 2013 the main exporter among the EU countries was Netherlands (25%), which had exporting value equal to USD 2.1 billion. The mostly exported industrial gas in 2013 was ethylene.
Industrial gasesEU - Industrial gas export
Source: ITC
Source: ITC
Source: ITC
Industrial gas export structure by product type in 2009-2013USD thousand 2009 2010 2011 2012 2013Rare gases (excl. argon) 194,506 220,504 226,235 267,687 308,736Carbon dioxide 141,769 164,221 171,604 144,782 157,011Chlorine 33,114 48,338 58,327 51,117 41,339Ethylene 2,125,788 3,189,767 3,757,324 3,939,415 4,012,549Hydrogen chloride (hydrochloric acid) 112,646 124,149 120,270 109,707 120,645Hydrogen fluoride (hydrofluoric acid) 93,434 135,647 162,031 169,439 184,324Methylamine, diortrimethylamine and their salts 188,547 87,627 195,956 233,971 195,861Oxirane (ethylene oxide) 333,198 418,784 477,464 456,293 497,924Anhydrous ammonia 442,555 563,195 807,645 867,208 815,846Sulphur dioxide - - - - -Hydrogen 131,166 143,049 151,071 39,324 118,009Oxygen 133,576 140,411 149,697 130,029 155,775Nitrogen 100,601 117,038 114,620 107,300 129,312Argon 113,135 119,137 133,068 104,097 123,176Total 4,144,035 5,471,867 6,525,312 6,620,369 6,860,507Unsaturated acyclic hydrocarbons nes 339,186 417,882 702,923 650,228 795,124Fluorine; bromine 32,281 27,849 59,967 50,207 54,293Inorganic compounds nes;liquid air;compressd air;amalgams o/t of precious metals - - - - -Fluorinated, brominated or iodinated derivatives of acyclic hydrocarbons
372,253 586,481 727,031 674,991 610,819
Inorganic oxygen compounds of non-metals nes 102,997 129,671 165,869 154,444 188,496Total 846,717 1,161,883 1,655,790 1,529,870 1,648,732
4,144,035
5,471,867
6,525,312 6,620,369 6,860,507
846,717 1,161,883 1,655,790 1,529,870 1,648,732
-
1,000,000
2,000,000
3,000,000
4,000,000
5,000,000
6,000,000
7,000,000
8,000,000
2009 2010 2011 2012 2013
Export of industrial gases in 2009 - 2013, USD thousand
Export of main industrial gasesExport of basic chemicals including industrial gases
25%
16%
18%
2%3%
14%
9%
1%1%2%
3%2% 4%Industrial gas export structure by countries, 2013
NetherlandsGermanyUnited KingdomPolandSpainBelgiumFranceCzech RepublicPortugalIrelandItalyFinlandOther
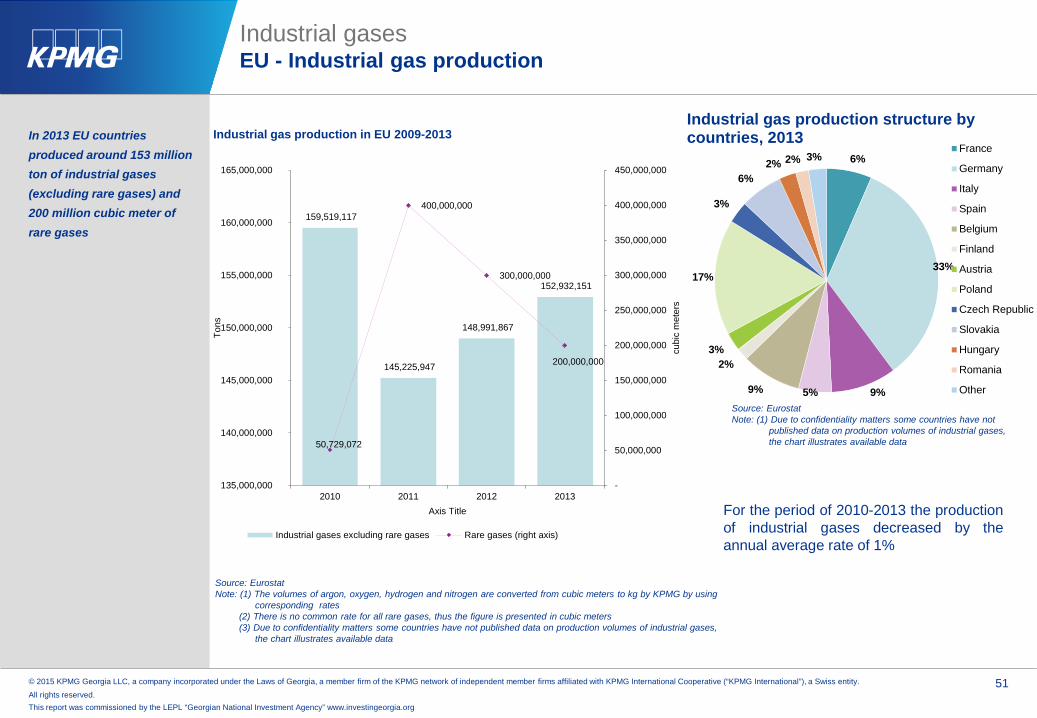
© 2015 KPMG Georgia LLC, a company incorporated under the Laws of Georgia, a member firm of the KPMG network of independent member firms affiliated with KPMG International Cooperative (“KPMG International”), a Swiss entity.
All rights reserved. 51
This report was commissioned by the LEPL “Georgian National Investment Agency” www.investingeorgia.org
Industrial gasesEU - Industrial gas production
Source: EurostatNote: (1) The volumes of argon, oxygen, hydrogen and nitrogen are converted from cubic meters to kg by KPMG by using
corresponding rates(2) There is no common rate for all rare gases, thus the figure is presented in cubic meters(3) Due to confidentiality matters some countries have not published data on production volumes of industrial gases,
the chart illustrates available data
In 2013 EU countries produced around 153 million ton of industrial gases (excluding rare gases) and 200 million cubic meter of rare gases
6%
33%
9%5%9%
2%3%
17%
3%
6%2% 2% 3%
Industrial gas production structure by countries, 2013
France
Germany
Italy
Spain
Belgium
Finland
Austria
Poland
Czech Republic
Slovakia
Hungary
Romania
Other
Source: EurostatNote: (1) Due to confidentiality matters some countries have not
published data on production volumes of industrial gases, the chart illustrates available data
For the period of 2010-2013 the productionof industrial gases decreased by theannual average rate of 1%
159,519,117
145,225,947
148,991,867
152,932,151
50,729,072
400,000,000
300,000,000
200,000,000
-
50,000,000
100,000,000
150,000,000
200,000,000
250,000,000
300,000,000
350,000,000
400,000,000
450,000,000
135,000,000
140,000,000
145,000,000
150,000,000
155,000,000
160,000,000
165,000,000
2010 2011 2012 2013
cubi
c m
eter
s
Tons
Axis Title
Industrial gas production in EU 2009-2013
Industrial gases excluding rare gases Rare gases (right axis)

© 2015 KPMG Georgia LLC, a company incorporated under the Laws of Georgia, a member firm of the KPMG network of independent member firms affiliated with KPMG International Cooperative (“KPMG International”), a Swiss entity.
All rights reserved. 52
This report was commissioned by the LEPL “Georgian National Investment Agency” www.investingeorgia.org
Industrial gasesEU - Industrial gas production and consumption
Source: Eurostat, KPMG calculationsNote: (1) The volumes of argon, oxygen, hydrogen and nitrogen are converted from cubic meters to kg by KPMG by using
corresponding rates(2) Due to confidentiality matters some countries have not published data on production volumes of industrial gases,
the chart illustrates available data(3) Due to different conversion rates for rare gases, the rare gases were not converted to kg from cubic meters, thus re not included in the consumption calculations
The consumption of industrial gases in the period of 2010-2013 has declined in EU countries by the average annual rate of 1.6%.
Industrial gas production structure by type, 2013TonsAnhydrous ammonia 11,037,518 Methylamine, dior trimethylamine and their salts 384,769Carbon dioxide 6,855,176 Oxirane (ethylene oxide) 1,990,974Chlorine 7,969,132 Sulphur dioxide 494,944Ethylene 16,096,333 Unsaturated acyclic hydrocarbons 2,768,778Iodine; fluorine; bromine 5,000 Argon 1,425,010Hydrogen chloride 4,693,809 Hydrogen 1,639,409Hydrogen fluoride 484,831 Nitrogen 28,167,058Inorganic oxygen compounds of non metals 4,643,385 Oxygen 45,962,529Liquid air; compressed air 18,313,496 Rare gases (cubic meters) 200,000,000
Source: EurostatNote: (1) Due to confidentiality matters some countries have not published data on production volumes of industrial gases, the table illustrates available data
In 2013 EU mainlyproduced (excluding raregases) oxygen with theproduction value equal toapproximately 46 millionton.
In 2013 the main producingcountries of industrial gaseswere Germany and Poland.
164,354,967
150,115,353 150,883,566
155,827,642
140,000,000
145,000,000
150,000,000
155,000,000
160,000,000
165,000,000
170,000,000
2010 2011 2012 2013
EU consumption of industrial gases (excluding rare gases), tons

© 2015 KPMG Georgia LLC, a company incorporated under the Laws of Georgia, a member firm of the KPMG network of independent member firms affiliated with KPMG International Cooperative (“KPMG International”), a Swiss entity.
All rights reserved. 53
This report was commissioned by the LEPL “Georgian National Investment Agency” www.investingeorgia.org
Industrial gasesProject pipeline
Technology company The Linde Group is set to build a new air separation unit in the eastern German townof Eisenhüttenstadt, near Frankfurt an der Oder. Around EUR 85 million will be channelled into the plant,which will supply the ArcelorMittal Eisenhüttenstadt steelworks with oxygen and nitrogen. Linde Gascompany LiGaPro will operate the plant once it goes on stream, currently planned for 2017.
The technology company The Linde Group and Finnish refining company Neste Oil have agreed on a long-term on-site hydrogen supply contract. According to the agreement, Linde will build a new hydrogenproduction unit for Neste Oil's Porvoo refinery near Helsinki, Finland. The total investment value from Lindeand Neste Oil amounts to approximately EUR 100 million. Linde’s Engineering Division will build the turn-key plant while Linde’s North European subsidiary AGA will be responsible for the operation of the new unitthat is planned to come on stream in 2016.

© 2015 KPMG Georgia LLC, a company incorporated under the Laws of Georgia, a member firm of the KPMG network of independent member firms affiliated with KPMG International Cooperative (“KPMG International”), a Swiss entity.
All rights reserved. 54
This report was commissioned by the LEPL “Georgian National Investment Agency” www.investingeorgia.org
Among the selected countries Turkmenistan and Kazakhstan have the largest reserves of natural gas
Natural gas is a raw material for a number of chemical industries including production of fertilizers, industrial gases and organicchemicals.
According to CIA World Factbook the EU 28 total reserves of natural gas is estimated to be 1,994 billion cubic meters which isapproximately 1% of world estimated reserves (194,900 billion cubic meters, 2013 estimates).
According to the 2013 estimates Turkmenistan has the largest reserve of natural gas among the Central Asian countries (17,500 billioncubic meters).
According to BP statistical review among the selected counties the largest producers of natural gas in 2013 were Netherlands,Turkmenistan and Uzbekistan.
2008 2009 2010 2011 2012 2013Netherlands 66.6 62.7 70.5 64.2 63.9 68.7Turkmenistan 66.1 36.4 42.4 59.5 62.3 62.3Uzbekistan 62.2 60 59.6 57 56.9 55.2United Kingdom 69.6 59.7 57.1 45.2 38.9 36.5Ukraine 19 19.3 18.5 18.7 18.6 19.3Kazakhstan 16.9 16.4 15.9 17.5 18.4 18.5Azerbaijan 14.8 14.8 15.1 14.8 15.6 16.2Romania 11.4 11.3 10.9 10.9 10.9 11Germany 13 12.2 10.6 10 9 8.2Italy 8.5 7.3 7.7 7.7 7.9 7.1Denmark 10.1 8.4 8.2 6.6 5.8 4.8Poland 4.1 4.1 4.1 4.3 4.3 4.2
Country Reserves (million cubic meters)
EU 28Netherlands 1,230,000 United Kingdom 246,000 Germany 125,000 Romania 105,500 Total EU 28 1,993,563
Central AsiaTurkmenistan 17,500,000 Kazakhstan 2,407,000 Uzbekistan 1,841,000 Kyrgyzstan 5,663 Tajikistan 5,663 Total Central Asia 21,759,326
Other countriesGeorgia 8,495Turkey 6,173 Ukraine 1,104,000 Source: CIA World Factbook
Proved Natural Gas ReservesProduction of Natural Gas (billion cubic meters)
Source: BP Statistical Review of World Energy June 2014
Industrial gasesRaw materials in the selected Region/Countries - Natural gas
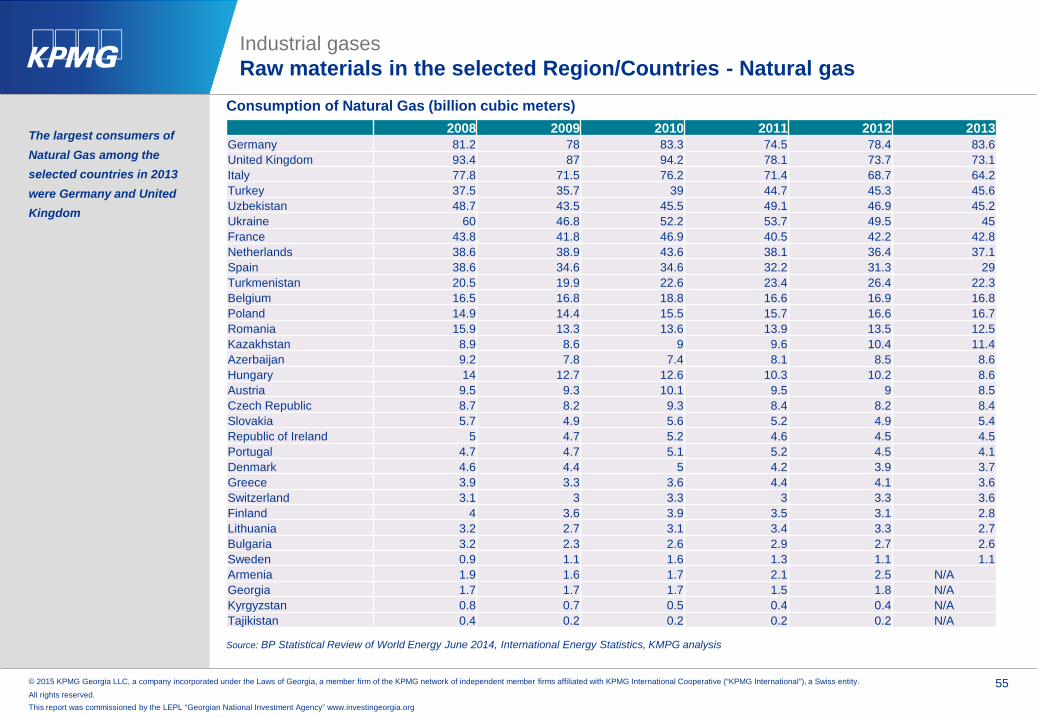
© 2015 KPMG Georgia LLC, a company incorporated under the Laws of Georgia, a member firm of the KPMG network of independent member firms affiliated with KPMG International Cooperative (“KPMG International”), a Swiss entity.
All rights reserved. 55
This report was commissioned by the LEPL “Georgian National Investment Agency” www.investingeorgia.org
The largest consumers of Natural Gas among the selected countries in 2013 were Germany and United Kingdom
2008 2009 2010 2011 2012 2013Germany 81.2 78 83.3 74.5 78.4 83.6United Kingdom 93.4 87 94.2 78.1 73.7 73.1Italy 77.8 71.5 76.2 71.4 68.7 64.2Turkey 37.5 35.7 39 44.7 45.3 45.6Uzbekistan 48.7 43.5 45.5 49.1 46.9 45.2Ukraine 60 46.8 52.2 53.7 49.5 45France 43.8 41.8 46.9 40.5 42.2 42.8Netherlands 38.6 38.9 43.6 38.1 36.4 37.1Spain 38.6 34.6 34.6 32.2 31.3 29Turkmenistan 20.5 19.9 22.6 23.4 26.4 22.3Belgium 16.5 16.8 18.8 16.6 16.9 16.8Poland 14.9 14.4 15.5 15.7 16.6 16.7Romania 15.9 13.3 13.6 13.9 13.5 12.5Kazakhstan 8.9 8.6 9 9.6 10.4 11.4Azerbaijan 9.2 7.8 7.4 8.1 8.5 8.6Hungary 14 12.7 12.6 10.3 10.2 8.6Austria 9.5 9.3 10.1 9.5 9 8.5Czech Republic 8.7 8.2 9.3 8.4 8.2 8.4Slovakia 5.7 4.9 5.6 5.2 4.9 5.4Republic of Ireland 5 4.7 5.2 4.6 4.5 4.5Portugal 4.7 4.7 5.1 5.2 4.5 4.1Denmark 4.6 4.4 5 4.2 3.9 3.7Greece 3.9 3.3 3.6 4.4 4.1 3.6Switzerland 3.1 3 3.3 3 3.3 3.6Finland 4 3.6 3.9 3.5 3.1 2.8Lithuania 3.2 2.7 3.1 3.4 3.3 2.7Bulgaria 3.2 2.3 2.6 2.9 2.7 2.6Sweden 0.9 1.1 1.6 1.3 1.1 1.1Armenia 1.9 1.6 1.7 2.1 2.5 N/AGeorgia 1.7 1.7 1.7 1.5 1.8 N/AKyrgyzstan 0.8 0.7 0.5 0.4 0.4 N/ATajikistan 0.4 0.2 0.2 0.2 0.2 N/A
Consumption of Natural Gas (billion cubic meters)
Source: BP Statistical Review of World Energy June 2014, International Energy Statistics, KMPG analysis
Industrial gasesRaw materials in the selected Region/Countries - Natural gas

© 2015 KPMG Georgia LLC, a company incorporated under the Laws of Georgia, a member firm of the KPMG network of independent member firms affiliated with KPMG International Cooperative (“KPMG International”), a Swiss entity.
All rights reserved. 56
This report was commissioned by the LEPL “Georgian National Investment Agency” www.investingeorgia.org
The largest exporters of Natural Gas in gaseous state among the selected countries in 2013 were Netherlands and Germany
The largest importers of Natural Gas in gaseous state among the selected countries in 2013 were Germany and Italy
Source: ITC
Value exported in 2013 (USD thousand)
Trade balance in 2013 (USD thousand)
Quantity exported in 2013
Quantity Unit
Unit value (USD/unit)
World 225,627,704 453,849,591 Tons 497 Netherlands 23,271,137 13,358,049 38,043,214 Tons 612Germany 14,059,268 -36,169,784 28,705,184 Tons 490Belgium 10,063,419 -7,075,332 20,174,584 Tons 499United Kingdom 3,373,790 -5,912,391 6,554,196 Tons 515France 2,202,720 -16,171,627 4,415,890 Tons 499Other EU 2,676,986 -40,762,913 4,352,180 Tons n/aTurkmenistan 9,000,705 9,000,705 18,711,500 Tons 481Kazakhstan 1,956,818 1,466,640 16,550,235 Tons 118Uzbekistan 1,166,014 1,166,014 3,762,509 Tons 310Azerbaijan 701,980 701,978 2,187,892 Tons 321Armenia 10,340 -561,426 40,223 Tons 257
Natural gas in (gaseous state) export and import, export and import unit value
Value imported in 2013 (USD thousand)
Trade balance in 2013 (USD thousand)
Quantity imported in 2013
Quantity Unit
Unit value (USD/unit)
World 229,527,999 412,705,190 Tons 556Germany 50,229,052 -36,169,784 98,087,015 Tons 512Italy 24,837,440 -24,706,141 40,625,550 Tons 611France 18,374,347 -16,171,627 30,481,122 Tons 603Belgium 17,138,751 -7,075,332 28,431,398 Tons 603Other EU 52,993,664 -23,803,050 83,544,964 Tons n/aUkraine 11,538,192 -11,538,192 18,909,096 Tons 610Armenia 571,766 -561,426 1,718,171 Tons 333Kazakhstan 490,178 1,466,640 3,915,784 Tons 125Georgia 288,392 -288,392 1,447,920 Tons 199Kyrgyzstan 64,158 -64,158 106,432 Tons 603
Industrial gasesRaw materials in the selected Region/Countries - Natural gas
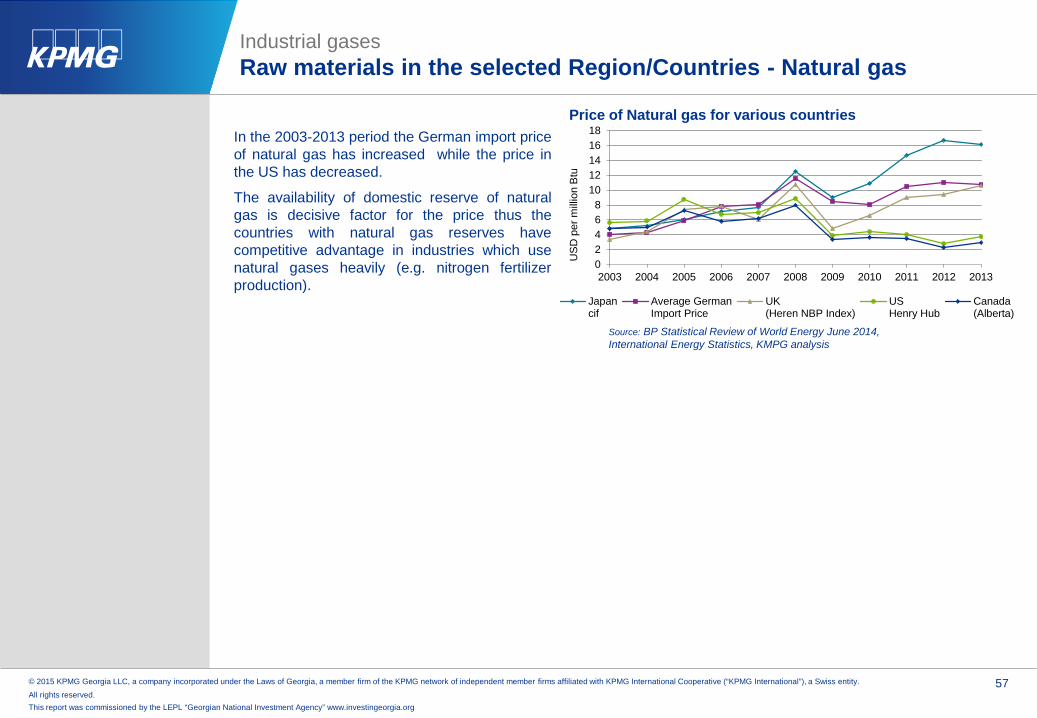
© 2015 KPMG Georgia LLC, a company incorporated under the Laws of Georgia, a member firm of the KPMG network of independent member firms affiliated with KPMG International Cooperative (“KPMG International”), a Swiss entity.
All rights reserved. 57
This report was commissioned by the LEPL “Georgian National Investment Agency” www.investingeorgia.org
02468
1012141618
2003 2004 2005 2006 2007 2008 2009 2010 2011 2012 2013
US
D p
er m
illio
n B
tu
Japancif
Average GermanImport Price
UK(Heren NBP Index)
USHenry Hub
Canada(Alberta)
Price of Natural gas for various countries
Source: BP Statistical Review of World Energy June 2014, International Energy Statistics, KMPG analysis
In the 2003-2013 period the German import priceof natural gas has increased while the price inthe US has decreased.
The availability of domestic reserve of naturalgas is decisive factor for the price thus thecountries with natural gas reserves havecompetitive advantage in industries which usenatural gases heavily (e.g. nitrogen fertilizerproduction).
Industrial gasesRaw materials in the selected Region/Countries - Natural gas

© 2015 KPMG Georgia LLC, a company incorporated under the Laws of Georgia, a member firm of the KPMG network of independent member firms affiliated with KPMG International Cooperative (“KPMG International”), a Swiss entity.
All rights reserved. 58
This report was commissioned by the LEPL “Georgian National Investment Agency” www.investingeorgia.org
In 2013 the world import of crude petroleum oil equaled to USD 1,618 billion.
Industrial gasesRaw materials in the selected Region/Countries - Crude oil
Source: ITC
Import of crude oilImporters Value imported in 2013 (USD thousand) Quantity imported in 2013 (Tons) Import price (USD)World 1,618,467,151 2,075,646,000 780Germany 74,284,138 91,388,708 813Netherlands 52,163,977 63,201,586 825Italy 46,462,095 57,467,112 808France 45,627,941 55,587,971 821Spain 45,308,060 58,583,900 773United Kingdom 40,091,970 49,032,430 818Belgium 28,484,159 36,137,415 788Poland 18,048,934 23,134,843 780Greece 16,052,194 19,193,103 836Sweden 12,706,028 15,915,994 798Other EU 63,581,773 78,668,902 N/AKazakhstan 2,839,859 7,497,985 379Ukraine 630,280 761,058 828Uzbekistan 250,368 299,435 836Tajikistan 115,054 137,629 836Kyrgyzstan 641 1,032 621Georgia 2 - -Turkmenistan 1 - -
Export of crude oilExporters Value exported in 2013 (USD thousand) Quantity exported in 2013 (Tons) Export price (USD)World 1,501,630,777 1,699,516,077 N/AUnited Kingdom 29,793,875 36,112,960 825Netherlands 7,042,431 8,886,727 792Denmark 4,915,203 6,000,228 819Belgium 2,119,677 2,342,062 905Italy 426,958 573,665 744Poland 334,011 402,667 829Greece 176,267 - N/AOther EU 362,834 486,348 N/AKazakhstan 55,221,442 68,158,350 810Azerbaijan 20,244,053 24,855,868 814Turkmenistan 72,552 86,701 837Kyrgyzstan 1,036 2,423 428Turkey 1 - -Source: ITC
Crude oil prices, 2013
Dubai USD/bbl 105.47Brent USD/bbl 108.66Nigerian Forcados USD/bbl 111.95West Texas Intermediate USD/bbl 97.99
According to the BP “StatisticalReview of World EnergyReport”, in 2013 the price ofcrude oil for the period of2009-2013 presented byDubai, Brent, NigerianForcados and West TexasIntermediate increased by theCAGR equal to 14.5%, 15.2%,15.3% and 12.2% respectively.
Source: BP Statistical Review of World Energy, June 2014

© 2015 KPMG Georgia LLC, a company incorporated under the Laws of Georgia, a member firm of the KPMG network of independent member firms affiliated with KPMG International Cooperative (“KPMG International”), a Swiss entity.
All rights reserved. 59
This report was commissioned by the LEPL “Georgian National Investment Agency” www.investingeorgia.org
35
51.119.9
109.417.3 5.6 238.3
0
50
100
150
200
250
300
Total NorthAmerica
Total S.and Cent.America
TotalEurope and
Eurasia
TotalMiddleEast
Total Africa Total AsiaPacific
Total World
Bill
ion
tone
s
World proved reserves of crude oil*In 2013 the value of total world proved oil reserves was equal to 238.3 billion tones, while the value of the total world refinery capacity was equal to 94,928 thousand barrels daily
In 2013 Venezuela had the biggest share in the total world proved oil reserves equal to 19.6% (46.6 billion tones), while US had the biggest share in the total world refinery capacity equal to 18.8% (17,818 thousand barrels daily)
According to the “OPEC Annual Statistical Bulletin” in2013 Ukraine had crude oil reserves equal to 395million barrels. According to the same bulletin in 2013Ukraine, Kazakhstan and Azerbaijan had refinerycapacities equal to 879.8 thousand barrels percalendar day, 345.1 thousand barrels per calendar dayand 399 thousand barrels per calendar dayrespectively.
According to the BP “Statistical Review of WorldEnergy Report”, in 2013 the oil reserves of RussianFederation comprised 63.8% (6,027 thousand barrelsdaily) of the total oil reserves of Europe and Eurasiaproved oil reserves while the refinery capacities ofRussian Federation comprised 63.8% (12.7 billiontones) of the total refinery capacities of Europe andEurasia refinery capacities.
Source: BP Statistical Review of World Energy, June 2014Note: * Proved reserves of crude oil - Generally taken to be those quantities that geological and engineering information indicates with reasonable certainty can be recovered in the future from known reservoirs under existing economic and operating conditions.
** Atmospheric distillation capacity on a calendar-day basis.
Europe and Eurasia proved reserves of crude oil*Billion tonesTotal EU 28 0.8Denmark 0.1Romania 0.1Italy 0.2United Kingdom 0.4Total Central Asial 4.1Turkmenistan 0.1Uzbekistan 0.1Kazakhstan 3.9Total Other countries 15.0Azerbaijan 1.0Other Europe and Eurasia 14.0Total Europe and Eurasia 19.9
Europe and Eurasia refinery capacities**Thousand barrelsTotal EU 28 12,335.0Belgium 810France 1,520Germany 2,061Greece 498Netherlands 1,274Spain 1,537Sweden 434Turkey 613Italy 2,062United Kingdom 1,526Total Other countries 11,551Other Europe and Eurasia 11,551Total Europe and Eurasia 23,886
21,389
6,029
23,887
8,822
3,517
31,284
94,928
0 20,000 40,000 60,000 80,000 100,000
Total North America
Total S. and Cent. America
Total Europe and Eurasia
Total Middle East
Total Africa
Total Asia Pacific
Total World
Thousand barrels daily
World refinery capacity**
Industrial gasesRaw materials in the selected Region/Countries - Crude oil

© 2015 KPMG Georgia LLC, a company incorporated under the Laws of Georgia, a member firm of the KPMG network of independent member firms affiliated with KPMG International Cooperative (“KPMG International”), a Swiss entity.
All rights reserved. 60
This report was commissioned by the LEPL “Georgian National Investment Agency” www.investingeorgia.org
781 374
835
1,329 419
392 4,130
0500
10001500200025003000350040004500
Total NorthAmerica
Total S.and Cent.America
TotalEurope
andEurasia
TotalMiddleEast
TotalAfrica
Total AsiaPacific
TotalWorld
Mill
ion
tone
s
World production of crude oil*In 2013 the value of total world production of crude oil was equal to 4,130 million tones, while the value of the total world consumption was equal to 4,185 million tones
In 2013 Saudi Arabia had the biggest share in the total world production of crude oil equal to 13.1% (542.3 million tones), while US had the biggest share in the total world consumption equal to 19.9% (831 million tones)
Source: BP Statistical Review of World Energy, June 2014Note: * Includes crude oil, tight oil, oil sands and NGLs (the liquid content of natural gas where this is recovered separately). Excludes liquid fuels from other sources such as biomass and derivatives of coal and natural gas.
** Inland demand plus international aviation and marine bunkers and refinery fuel and loss. Consumption of bio gasoline (such as ethanol), biodiesel and derivatives of coal and natural gas are also included.
Europe and Eurasia production of crude oil*Million tonesTotal EU 28 59Denmark 9Italy 6Romania 4United Kingdom 41Total Central Asial 98Kazakhstan 84Turkmenistan 11Uzbekistan 3Total Other countries 678Azerbaijan 43Other Europe and Eurasia 634Total Europe and Eurasia 835
1,024 312
879 385 171
1,415 4,185
-500
1,0001,5002,0002,5003,0003,5004,0004,500
TotalNorth
America
Total S.and Cent.America
TotalEurope
andEurasia
TotalMiddleEast
TotalAfrica
Total AsiaPacific
TotalWorld
Mill
ion
tone
s
World consumption of crude oil**
Europe and Eurasia consumption of crude oil**Million tonesTotal EU 28 589 Portugal 11Austria 13 Romania 9Belgium 31 Slovakia 4Bulgaria 4 Spain 59Czech Republic 9 Sweden 14Denmark 8 United Kingdom 70Finland 9 Total Central Asial 23France 80 Kazakhstan 14Germany 112 Turkmenistan 6Greece 14 Uzbekistan 3Hungary 6 Total Other countries 267Republic of Ireland 7 Azerbaijan 5Italy 62 Ukraine 12Lithuania 3 Turkey 33Netherlands 41 Other Europe and Eurasia 217Poland 24 Total Europe and Eurasia 879
According to the “OPEC Annual StatisticalBulletin” in 2013 Ukraine’s, France’s,Germany’s, Netherland’s and Turkey’sproduction values of crude oil were equal to43.7 thousand barrels daily, 16 thousandbarrels daily, 51.8 thousand barrels daily,21.6 thousand barrels daily and 46.2thousand barrels daily respectively.
According to the BP “Statistical Review ofWorld Energy Report”, in 2013 the oilproduction of Russian Federation comprised63.7% (531.4 million tones) of the total oilproduction of Europe and Eurasia oilproduction, while the consumption of RussianFederation comprised 17.4% (153.1 milliontones) of the total consumption of Europe andEurasia consumption.
Industrial gasesRaw materials in the selected Region/Countries - Crude oil

© 2015 KPMG Georgia LLC, a company incorporated under the Laws of Georgia, a member firm of the KPMG network of independent member firms affiliated with KPMG International Cooperative (“KPMG International”), a Swiss entity.
All rights reserved. 61
This report was commissioned by the LEPL “Georgian National Investment Agency” www.investingeorgia.org
Industrial gasesMain factors of successful functionality of the factory
Main factors Description
Buyer power Buyers in this sector are industrial companies with a large scale production such as energy companiesand metal working companies. Therefore losing one such buyer can have a negative influence on therevenues of the industrial gas market players. As industrial gases are essential for different types ofindustries, this weakens the buyers’ power and strengthens the industry players’ position. On the otherhand the buyers’ power is increased due to the fact that the industrial gases are commodities which aredifferentiated by the purity of the gases and the branding.
Raw materialsavailability (supplier power)
Industrial gas sector differs form other types of manufacturing mainly because industrial gases areextracted from the atmosphere. Various types of industrial gases can be produced in several ways forexample by chemical synthesis or natural gas/oil processing, but fraction distillation of air is a key sourceof industrial gases. Companies which can deliver such raw materials are few in a number, thusstrengthening the suppliers’ power. The industrial gas market players should also invest in the pipelinesand containers to transport the industrial gases, but due to the large number of transportationcompanies, the influence of this factor is not significant.
Production scale Industrial gases are sold in bulk and leading companies such as Linde, Praxair, Air Liquide and Air products are typically large, diversified, multinational companies that use a large scale of their production to reduce costs and enhance profitability, thus for being cost effective a large scale production (to achieve the economies of scale) is required.
Intellectual property
To keep up with the leading companies of the sector strong research and development capability is required (R&D). Therefore investments in the intellectual property is required.
Degree of regulation
There is a significant regulatory burden in the market. Large scale of environmental regulations, which are applied to the production, storage and transportation of industrial gases, are present. The sector is highly regulated in some countries.
Demand drivers The economic stimulus plans, which spurred many industrial and construction projects, greatly increased the demand for industrial gases. This momentum is expected to carry forward into forecasted period.
Other factors The market of industrial gases is highly concentrated and the leading companies of the industry accountfor about 71% of the market share. The industry is energy and labor intensive, as well as, it requires highcapital expenses.

Pigments and other coloring matter
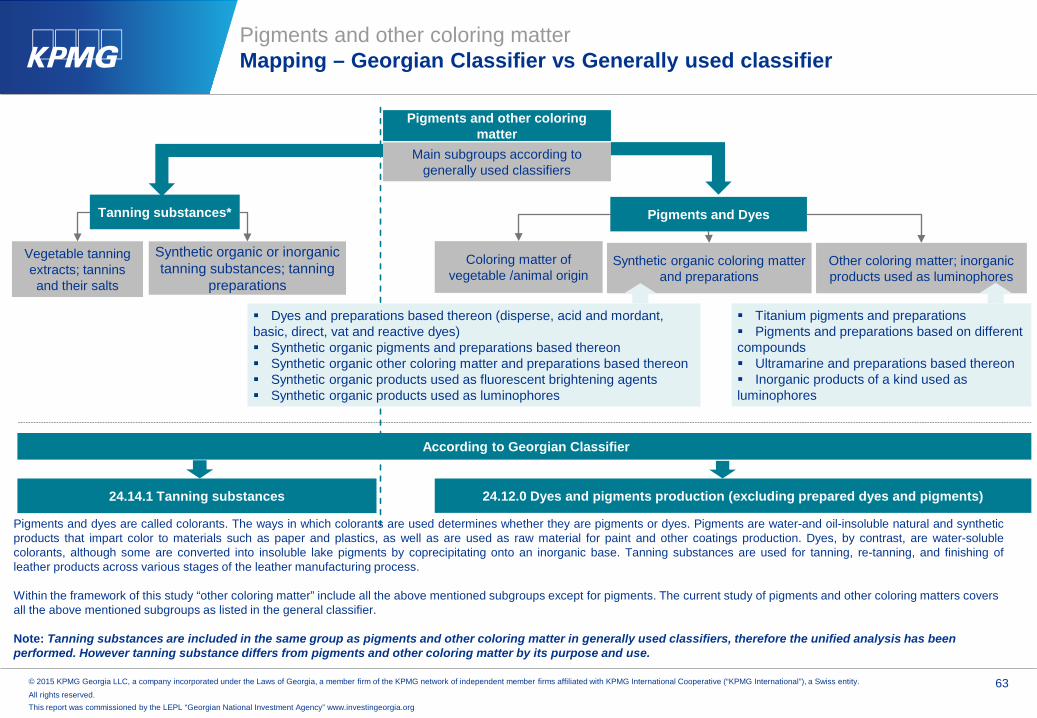
© 2015 KPMG Georgia LLC, a company incorporated under the Laws of Georgia, a member firm of the KPMG network of independent member firms affiliated with KPMG International Cooperative (“KPMG International”), a Swiss entity.
All rights reserved. 63
This report was commissioned by the LEPL “Georgian National Investment Agency” www.investingeorgia.org
Pigments and other coloring matterMapping – Georgian Classifier vs Generally used classifier
Main subgroups according to generally used classifiers
Pigments and other coloring matter
Tanning substances*
Vegetable tanning extracts; tannins and their salts
According to Georgian Classifier
Pigments and Dyes
Coloring matter of vegetable /animal origin
Synthetic organic coloring matter and preparations
Synthetic organic or inorganic tanning substances; tanning
preparations
Other coloring matter; inorganic products used as luminophores
24.12.0 Dyes and pigments production (excluding prepared dyes and pigments)24.14.1 Tanning substances
Dyes and preparations based thereon (disperse, acid and mordant,basic, direct, vat and reactive dyes) Synthetic organic pigments and preparations based thereon Synthetic organic other coloring matter and preparations based thereon Synthetic organic products used as fluorescent brightening agents Synthetic organic products used as luminophores
Titanium pigments and preparations Pigments and preparations based on different compounds Ultramarine and preparations based thereon Inorganic products of a kind used as luminophores
Pigments and dyes are called colorants. The ways in which colorants are used determines whether they are pigments or dyes. Pigments are water-and oil-insoluble natural and syntheticproducts that impart color to materials such as paper and plastics, as well as are used as raw material for paint and other coatings production. Dyes, by contrast, are water-solublecolorants, although some are converted into insoluble lake pigments by coprecipitating onto an inorganic base. Tanning substances are used for tanning, re-tanning, and finishing ofleather products across various stages of the leather manufacturing process.
Within the framework of this study “other coloring matter” include all the above mentioned subgroups except for pigments. The current study of pigments and other coloring matters covers all the above mentioned subgroups as listed in the general classifier.
Note: Tanning substances are included in the same group as pigments and other coloring matter in generally used classifiers, therefore the unified analysis has been performed. However tanning substance differs from pigments and other coloring matter by its purpose and use.
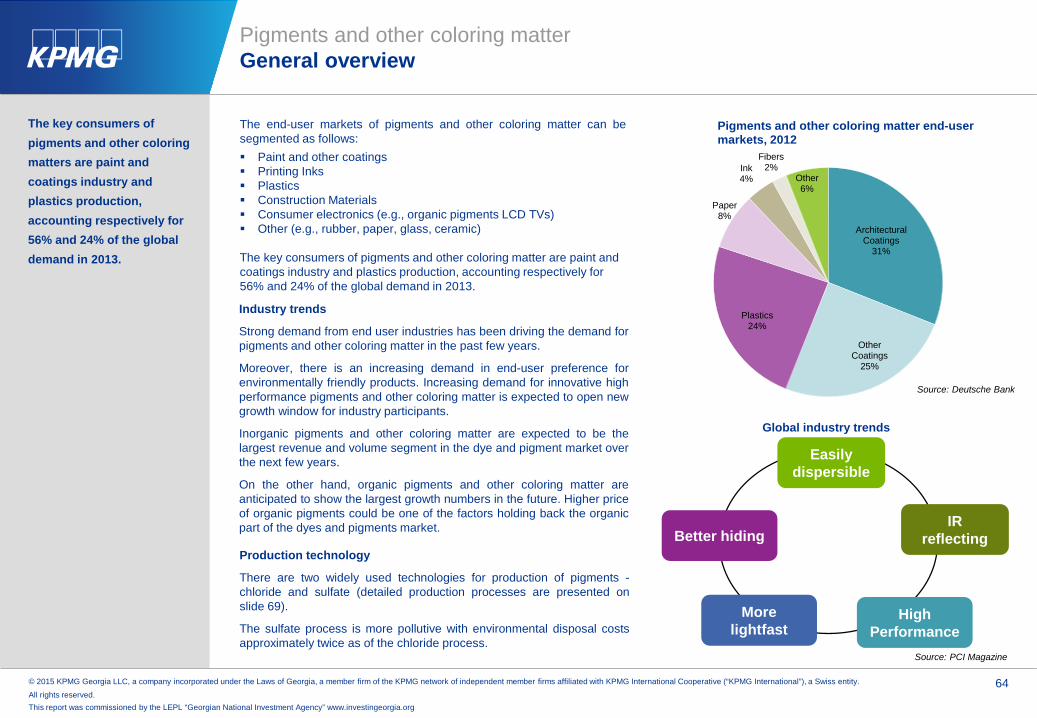
© 2015 KPMG Georgia LLC, a company incorporated under the Laws of Georgia, a member firm of the KPMG network of independent member firms affiliated with KPMG International Cooperative (“KPMG International”), a Swiss entity.
All rights reserved. 64
This report was commissioned by the LEPL “Georgian National Investment Agency” www.investingeorgia.org
The end-user markets of pigments and other coloring matter can besegmented as follows: Paint and other coatings Printing Inks Plastics Construction Materials Consumer electronics (e.g., organic pigments LCD TVs) Other (e.g., rubber, paper, glass, ceramic)
The key consumers of pigments and other coloring matter are paint and coatings industry and plastics production, accounting respectively for 56% and 24% of the global demand in 2013.
Pigments and other coloring matterGeneral overview
Easily dispersible
IR reflecting
High Performance
More lightfast
Better hiding
Source: PCI Magazine
Source: Deutsche Bank
Industry trends
Strong demand from end user industries has been driving the demand forpigments and other coloring matter in the past few years.
Moreover, there is an increasing demand in end-user preference forenvironmentally friendly products. Increasing demand for innovative highperformance pigments and other coloring matter is expected to open newgrowth window for industry participants.
Inorganic pigments and other coloring matter are expected to be thelargest revenue and volume segment in the dye and pigment market overthe next few years.
On the other hand, organic pigments and other coloring matter areanticipated to show the largest growth numbers in the future. Higher priceof organic pigments could be one of the factors holding back the organicpart of the dyes and pigments market.
Architectural Coatings
31%
Other Coatings
25%
Plastics24%
Paper8%
Ink4%
Fibers2%
Other6%
Pigments and other coloring matter end-user markets, 2012
Global industry trends
The key consumers of pigments and other coloring matters are paint and coatings industry and plastics production, accounting respectively for 56% and 24% of the global demand in 2013.
Production technology
There are two widely used technologies for production of pigments -chloride and sulfate (detailed production processes are presented onslide 69).
The sulfate process is more pollutive with environmental disposal costsapproximately twice as of the chloride process.

© 2015 KPMG Georgia LLC, a company incorporated under the Laws of Georgia, a member firm of the KPMG network of independent member firms affiliated with KPMG International Cooperative (“KPMG International”), a Swiss entity.
All rights reserved. 65
This report was commissioned by the LEPL “Georgian National Investment Agency” www.investingeorgia.org
2,514 2,853 2,848 2,403 2,478 2,425 2,497 2,669 2,687 2,785 2,884 3,014
2,203
3,060 3,2993,409 3,149 3,314 3,473
3,637 3,688 3,738 3,839 3,873
(3.9%)
25.4%
4.0%
(5.4%)
(3.2%)
2.0% 4.0%
5.6%
1.1% 2.3% 3.1% 2.4%
-10%
-5%
0%
5%
10%
15%
20%
25%
30%
0
1,000
2,000
3,000
4,000
5,000
6,000
7,000
8,000
2009 2010 2011 2012 2013 2014 2015 2016 2017 2018 2019 2020G
rowth rate, %Th
ousa
nd to
ns
World pigment production, 2009-2020
Chloride Pigment Sulfate Pigment Growth rate
Source: J.P. Morgan
The world pigment production comprised 5,627 thousand tons in 2013
The world pigment production capacity comprised 7,817 thousand tons in 2013
Pigment production utilization rate comprised 72% in 2013.
China is the major pigment producer in the world, with 36.4% of the world production and 39.8% of the world production capacity in 2013. According to J.P. Morgan estimates China will increase its shares, reaching 41.3% and 43.4% respectively in 2020.
Pigments and other coloring matterMarket overview
The world pigment production comprised 5,627 thousand tons in2013, out of which 3,149 thousand tons (56%) of sulfatepigments. According to J.P. Morgan forecast the world totalpigment production will reach to 6,887 thousand tons in 2020.
The world pigment production capacity comprised 7,817thousand tons in 2013, out of which 4,782 thousand tons (60%)of sulfate pigments. According to J.P. Morgan forecast the worldtotal pigment production capacity will reach to 8,577 thousandtons in 2020. The production technology split will change slightlyin favor of chloride technology.
Highest utilization rate in pigments production was registered in2010 – 88%, which gradually decreased reaching to 72% in2013. This fall can be mainly explained by the increase of rawmaterial prices. Chloride pigment production utilization rate ishigher compared to sulfate pigment. It is forecasted thatutilization rate will increase up to 80.3% in 2020.
forecast
3,055 3,055 3,055 3,055 3,115 3,165 3,275 3,525 3,525 3,525 3,525 3,525
3,181 3,6674,301 4,531 4,702 4,782 4,962 5,052 5,052 5,052 5,052 5,052
1.8%
7.8%
9.4%
3.1% 3.0%
1.7%
3.6% 4.1%
- - - --
1.0%
2.0%
3.0%
4.0%
5.0%
6.0%
7.0%
8.0%
9.0%
10.0%
0
1,000
2,000
3,000
4,000
5,000
6,000
7,000
8,000
9,000
10,000
2009 2010 2011 2012 2013 2014 2015 2016 2017 2018 2019 2020
Grow
th rate, %
Thou
sand
tons
World pigment production capacity, 2009-2020
Chloride Pigment Sulfate Pigment Growth rate Source: J.P. Morgan
forecast
60%65%70%75%80%85%90%95%
100%
2009 2010 2011 2012 2013 2014 2015 2016 2017 2018 2019 2020
Util
isat
ion
rate
, %
World pigment production utilisation, 2009-2020
Chloride Utilisation Sulfate Utilisation Total UtilisationSource: J.P. Morgan

© 2015 KPMG Georgia LLC, a company incorporated under the Laws of Georgia, a member firm of the KPMG network of independent member firms affiliated with KPMG International Cooperative (“KPMG International”), a Swiss entity.
All rights reserved. 66
This report was commissioned by the LEPL “Georgian National Investment Agency” www.investingeorgia.org
5,058 5,200 5,4444,628 5,091 5,508 5,783 6,072 6,258 6,450 6,650 6,857
2.8% 2.8% 4.7%
(15.0%)
10.0% 8.2%
5.0% 5.0% 3.1% 3.1% 3.1% 3.1%
-20%
-15%
-10%
-5%
0%
5%
10%
15%
0
1,000
2,000
3,000
4,000
5,000
6,000
7,000
8,000
2009 2010 2011 2012 2013 2014 2015 2016 2017 2018 2019 2020
Grow
th rate, %
Thou
sand
tons
World pigment consumption, 2009-2020
Consumption Growth rateSource: J.P. Morgan
The world consumption of pigments comprised 5,091 thousand tons in 2013
The Asia-Pacific region dominated in the pigments production with the share of 47.5% of the world production capacity in 2012
Pigments and other coloring matterMarket overview
646
1,554
220
150
616
755
19
25
316
60
2,778
0% 20% 40% 60% 80% 100%
Western Europe
North America
Middle East & Africa
Central Europe
Central & South America
Asia-Pacific
World production capacity regional and technology split (thousand tons), 2012
Chloride SulfateSource: Deutsche Bank
The world consumption of pigments comprised 5,091 thousand tonsin 2013, increasing by 10% compared to 2012. According to J.P.Morgan estimates the market consumption will reach to 6,857thousand tons in 2020.The highest supply-demand gap in the pigment market was registeredin 2012, comprising 1,184 thousand tons. It is estimated that the gapwill decrease during the upcoming years reaching to only 30 thousandtons in 2020.The Asia-Pacific region dominates in the pigments production withshare of 47.5% of the world production capacity in 2012. China is theleader in this region.The second largest region is North America, with share of 22%,followed by Western Europe, with share of about 20%. 55.4% of theworld production was based on the sulfate process.Asia-Pacific, Central Europe and Western Europe are mainly usingsulfate production technology, whereas Americas are using Chlorideproduction technologies.The main factors stipulating production in the mentioned regions are:Asia-Pacific region, particularly China - availability of low costworkforce and raw materials.North America and Western Europe – High level of R&Ddevelopments, innovative technologies, which bring to high qualityproducts production and availability of raw materials.Also the above mentioned regions are major pigments and othercoloring matter consumers due to developed industries like paint andvarnish production, textile, etc., which are the pigments and othercoloring matter end-user sectors.
forecast
0
1,000
2,000
3,000
4,000
5,000
6,000
7,000
8,000
2009 2010 2011 2012 2013 2014 2015 2016 2017 2018 2019 2020
Thou
sand
tons
Supply - demand gap, 2009-2020
Supply Demand Source: J.P. Morgan
1,184 thousand tons in 2012
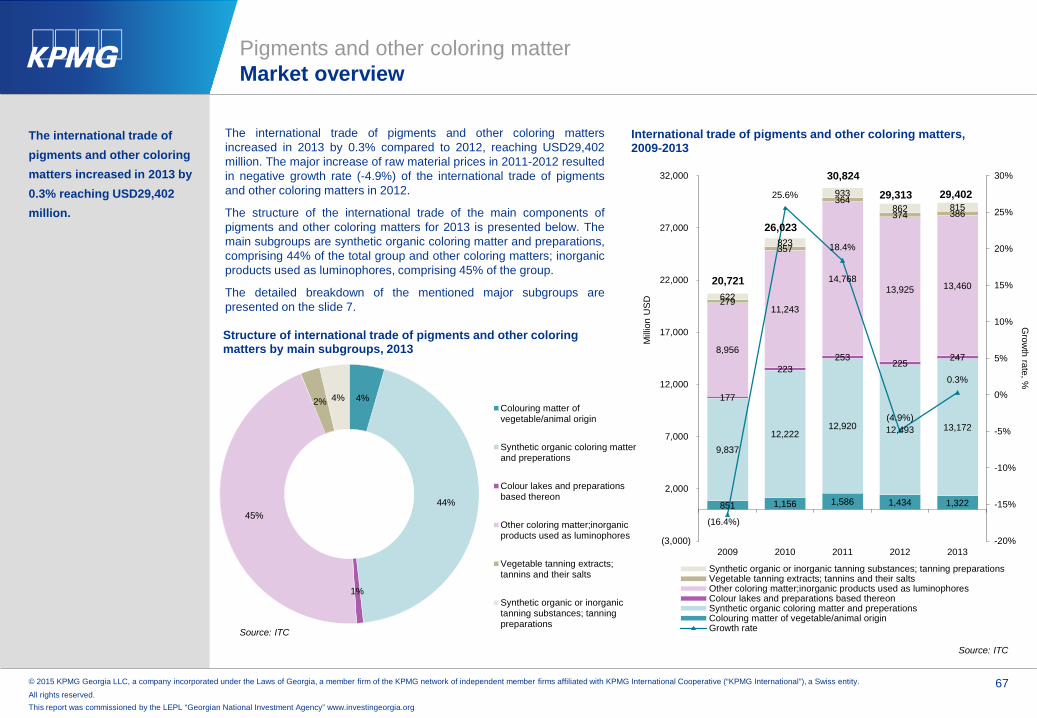
© 2015 KPMG Georgia LLC, a company incorporated under the Laws of Georgia, a member firm of the KPMG network of independent member firms affiliated with KPMG International Cooperative (“KPMG International”), a Swiss entity.
All rights reserved. 67
This report was commissioned by the LEPL “Georgian National Investment Agency” www.investingeorgia.org
851 1,156 1,586 1,434 1,322
9,837
12,222 12,920 12,493 13,172
177
223 253
225 247 8,956
11,243
14,768 13,925 13,460
279
357
364 374 386
622
823
933 862 815
(16.4%)
25.6%
18.4%
(4.9%)
0.3%
-20%
-15%
-10%
-5%
0%
5%
10%
15%
20%
25%
30%
(3,000)
2,000
7,000
12,000
17,000
22,000
27,000
32,000
2009 2010 2011 2012 2013
Grow
th rate, %
Mill
ion
US
D
International trade of pigments and other coloring matters, 2009-2013
Synthetic organic or inorganic tanning substances; tanning preparationsVegetable tanning extracts; tannins and their saltsOther coloring matter;inorganic products used as luminophoresColour lakes and preparations based thereonSynthetic organic coloring matter and preperationsColouring matter of vegetable/animal originGrowth rate
The international trade of pigments and other coloring matters increased in 2013 by 0.3% reaching USD29,402 million.
Pigments and other coloring matterMarket overview
Source: ITC
Source: ITC
The international trade of pigments and other coloring mattersincreased in 2013 by 0.3% compared to 2012, reaching USD29,402million. The major increase of raw material prices in 2011-2012 resultedin negative growth rate (-4.9%) of the international trade of pigmentsand other coloring matters in 2012.
The structure of the international trade of the main components ofpigments and other coloring matters for 2013 is presented below. Themain subgroups are synthetic organic coloring matter and preparations,comprising 44% of the total group and other coloring matters; inorganicproducts used as luminophores, comprising 45% of the group.
The detailed breakdown of the mentioned major subgroups arepresented on the slide 7.
20,721
26,023
30,824
29,313 29,402
4%
44%
1%
45%
2% 4%
Structure of international trade of pigments and other coloring matters by main subgroups, 2013
Colouring matter ofvegetable/animal origin
Synthetic organic coloring matterand preperations
Colour lakes and preparationsbased thereon
Other coloring matter;inorganicproducts used as luminophores
Vegetable tanning extracts;tannins and their salts
Synthetic organic or inorganictanning substances; tanningpreparations
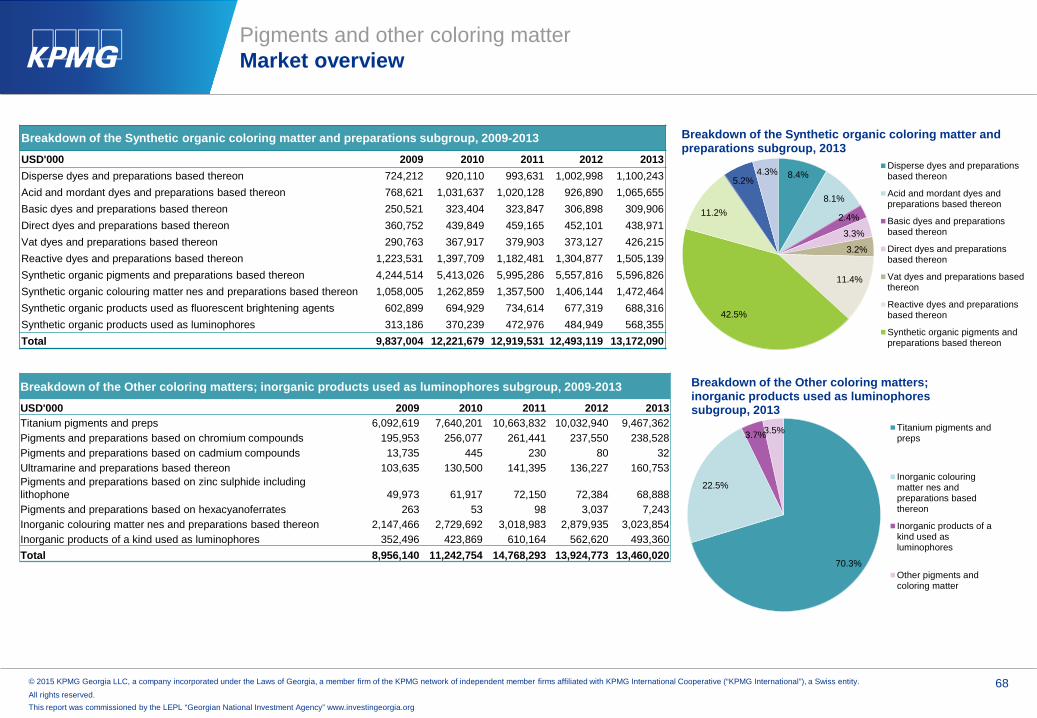
© 2015 KPMG Georgia LLC, a company incorporated under the Laws of Georgia, a member firm of the KPMG network of independent member firms affiliated with KPMG International Cooperative (“KPMG International”), a Swiss entity.
All rights reserved. 68
This report was commissioned by the LEPL “Georgian National Investment Agency” www.investingeorgia.org
Pigments and other coloring matterMarket overview
Breakdown of the Synthetic organic coloring matter and preparations subgroup, 2009-2013
USD'000 2009 2010 2011 2012 2013Disperse dyes and preparations based thereon 724,212 920,110 993,631 1,002,998 1,100,243Acid and mordant dyes and preparations based thereon 768,621 1,031,637 1,020,128 926,890 1,065,655Basic dyes and preparations based thereon 250,521 323,404 323,847 306,898 309,906Direct dyes and preparations based thereon 360,752 439,849 459,165 452,101 438,971Vat dyes and preparations based thereon 290,763 367,917 379,903 373,127 426,215Reactive dyes and preparations based thereon 1,223,531 1,397,709 1,182,481 1,304,877 1,505,139Synthetic organic pigments and preparations based thereon 4,244,514 5,413,026 5,995,286 5,557,816 5,596,826Synthetic organic colouring matter nes and preparations based thereon 1,058,005 1,262,859 1,357,500 1,406,144 1,472,464Synthetic organic products used as fluorescent brightening agents 602,899 694,929 734,614 677,319 688,316Synthetic organic products used as luminophores 313,186 370,239 472,976 484,949 568,355Total 9,837,004 12,221,679 12,919,531 12,493,119 13,172,090
8.4%
8.1%
2.4%
3.3%
3.2%
11.4%
42.5%
11.2%
5.2% 4.3%
Breakdown of the Synthetic organic coloring matter and preparations subgroup, 2013
Disperse dyes and preparationsbased thereon
Acid and mordant dyes andpreparations based thereon
Basic dyes and preparationsbased thereon
Direct dyes and preparationsbased thereon
Vat dyes and preparations basedthereon
Reactive dyes and preparationsbased thereon
Synthetic organic pigments andpreparations based thereon
Breakdown of the Other coloring matters; inorganic products used as luminophores subgroup, 2009-2013
USD'000 2009 2010 2011 2012 2013Titanium pigments and preps 6,092,619 7,640,201 10,663,832 10,032,940 9,467,362 Pigments and preparations based on chromium compounds 195,953 256,077 261,441 237,550 238,528 Pigments and preparations based on cadmium compounds 13,735 445 230 80 32 Ultramarine and preparations based thereon 103,635 130,500 141,395 136,227 160,753 Pigments and preparations based on zinc sulphide including lithophone 49,973 61,917 72,150 72,384 68,888 Pigments and preparations based on hexacyanoferrates 263 53 98 3,037 7,243 Inorganic colouring matter nes and preparations based thereon 2,147,466 2,729,692 3,018,983 2,879,935 3,023,854 Inorganic products of a kind used as luminophores 352,496 423,869 610,164 562,620 493,360 Total 8,956,140 11,242,754 14,768,293 13,924,773 13,460,020
70.3%
22.5%
3.7%3.5%
Breakdown of the Other coloring matters; inorganic products used as luminophores subgroup, 2013
Titanium pigments andpreps
Inorganic colouringmatter nes andpreparations basedthereon
Inorganic products of akind used asluminophores
Other pigments andcoloring matter

© 2015 KPMG Georgia LLC, a company incorporated under the Laws of Georgia, a member firm of the KPMG network of independent member firms affiliated with KPMG International Cooperative (“KPMG International”), a Swiss entity.
All rights reserved. 69
This report was commissioned by the LEPL “Georgian National Investment Agency” www.investingeorgia.org
Pigment offers opacity (fine particles scatter light), brightness, whiteness (due to particle size and purity) and extends the life of objects. It can be produced using either the sulfate or chloride process with two forms: Rutile (formed by either process) and Anatase (sulfate process only). Rutile is more durable with a higher refractory index and has complete ultra violet light absorption. The suitability of feedstocks for the sulfate or chloride process is largely determined by the particle size and the crystal structure.
The sulfate process
The chloride process
Two main processes are used for pigments production: Sulfate and Chloride
Pigments and other coloring matterProduction Chain
Titanium Ore /H2SO4 (recycled)
Solution Crystallization Precipitation Filtration &Washing Calcination TiO2 Pigment
Ferrous SulfateCrystals
Acid treatment
Titanium Ore / CI2 / Carbon
Chlorination Purification Oxidation TiO2 Slurry
Chlorides of metalsother than Titanium
Oxygen + fuel
Source: Deutsche Bank
Source: Deutsche Bank Note: For general production chain and profit distribution between market participants please refer also to slide Group 24.3 Paint, varnish and other coating production
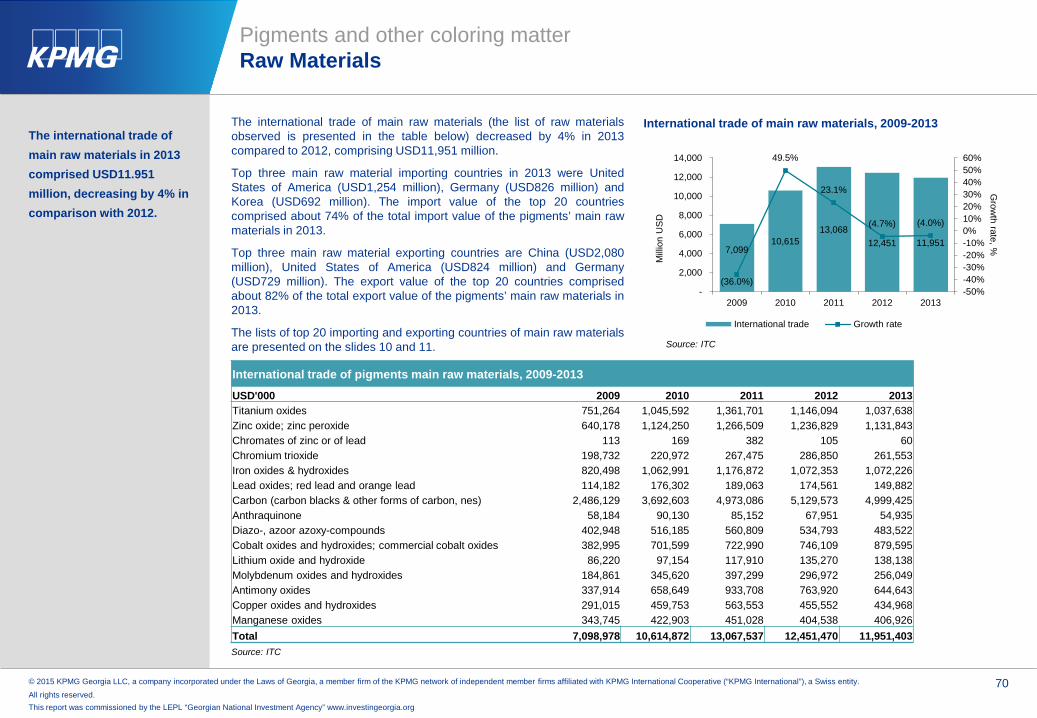
© 2015 KPMG Georgia LLC, a company incorporated under the Laws of Georgia, a member firm of the KPMG network of independent member firms affiliated with KPMG International Cooperative (“KPMG International”), a Swiss entity.
All rights reserved. 70
This report was commissioned by the LEPL “Georgian National Investment Agency” www.investingeorgia.org
The international trade of main raw materials (the list of raw materialsobserved is presented in the table below) decreased by 4% in 2013compared to 2012, comprising USD11,951 million.
Top three main raw material importing countries in 2013 were UnitedStates of America (USD1,254 million), Germany (USD826 million) andKorea (USD692 million). The import value of the top 20 countriescomprised about 74% of the total import value of the pigments’ main rawmaterials in 2013.
Top three main raw material exporting countries are China (USD2,080million), United States of America (USD824 million) and Germany(USD729 million). The export value of the top 20 countries comprisedabout 82% of the total export value of the pigments’ main raw materials in2013.
The lists of top 20 importing and exporting countries of main raw materialsare presented on the slides 10 and 11.
The international trade of main raw materials in 2013 comprised USD11.951 million, decreasing by 4% in comparison with 2012.
Pigments and other coloring matterRaw Materials
Source: ITC
Source: ITC
7,099 10,615
13,068 12,451 11,951
(36.0%)
49.5%
23.1%
(4.7%) (4.0%)
-50%-40%-30%-20%-10%0%10%20%30%40%50%60%
-
2,000
4,000
6,000
8,000
10,000
12,000
14,000
2009 2010 2011 2012 2013
Grow
th rate, %
Mill
ion
US
D
International trade of main raw materials, 2009-2013
International trade Growth rate
International trade of pigments main raw materials, 2009-2013
USD'000 2009 2010 2011 2012 2013Titanium oxides 751,264 1,045,592 1,361,701 1,146,094 1,037,638 Zinc oxide; zinc peroxide 640,178 1,124,250 1,266,509 1,236,829 1,131,843 Chromates of zinc or of lead 113 169 382 105 60 Chromium trioxide 198,732 220,972 267,475 286,850 261,553 Iron oxides & hydroxides 820,498 1,062,991 1,176,872 1,072,353 1,072,226 Lead oxides; red lead and orange lead 114,182 176,302 189,063 174,561 149,882 Carbon (carbon blacks & other forms of carbon, nes) 2,486,129 3,692,603 4,973,086 5,129,573 4,999,425 Anthraquinone 58,184 90,130 85,152 67,951 54,935 Diazo-, azoor azoxy-compounds 402,948 516,185 560,809 534,793 483,522 Cobalt oxides and hydroxides; commercial cobalt oxides 382,995 701,599 722,990 746,109 879,595 Lithium oxide and hydroxide 86,220 97,154 117,910 135,270 138,138 Molybdenum oxides and hydroxides 184,861 345,620 397,299 296,972 256,049 Antimony oxides 337,914 658,649 933,708 763,920 644,643 Copper oxides and hydroxides 291,015 459,753 563,553 455,552 434,968 Manganese oxides 343,745 422,903 451,028 404,538 406,926 Total 7,098,978 10,614,872 13,067,537 12,451,470 11,951,403

© 2015 KPMG Georgia LLC, a company incorporated under the Laws of Georgia, a member firm of the KPMG network of independent member firms affiliated with KPMG International Cooperative (“KPMG International”), a Swiss entity.
All rights reserved. 71
This report was commissioned by the LEPL “Georgian National Investment Agency” www.investingeorgia.org
Pigments and other coloring matter Raw Materials
Titanium and Titanium dioxide world sponge metal production and sponge and pigment capacity (m.t)
Sponge production Capacity 2014*2013 2014 (e) Sponge Pigment
United States W W** 24,000 1,470,000Australia 280,000Belgium 74,000Canada 100,000China (e) 105,000 110,000 114,000 2,000,000Finland 130,000France 125,000Germany 440,000Italy 80,000Japan(e) 42,000 25,000 310,000 310,000Kazakhstan(e) 12,000 9,000 27,000 1,000Mexico 130,000Russia(e) 44,000 42,000 46,500 20,000Spain 80,000Ukraine(e) 6,300 6,000 10,000 120,000United Kingdom 300,000Other countries 900,000World total (rounded)*** 5,209,000 5,192,000 279,000 6,560,000
Source: USGSNote: * Yearend operating capacity
** Withheld to avoid disclosing company proprietary data*** Excluding USA(e) - Estimated
Jan Feb Mar Apr May Jun Jul Aug Sep Oct Nov Dec2013 4,383 3,755 3,498 3,508 3,496 3,527 3,516 3,537 3,543 3,632 3,556 3,5812014 3,567 3,470 3,472 3,469 3,408 3,396 3,388 3,368 3,202 3,065 3,041 3,032
3,000
3,200
3,400
3,600
3,800
4,000
4,200
4,400
US
D
Titanium Dioxide (TiO2) price USD per m.t.
Source: J.P. MorganNote: The global blended price is composed of 24% of North America, 34% of EMEA, 5% of Latin America and 37% of Asia.
Titanium dioxide prices are considerably lower in 2014
compared to 2013, particularly in December 2014 the price
was 15.3% lower.
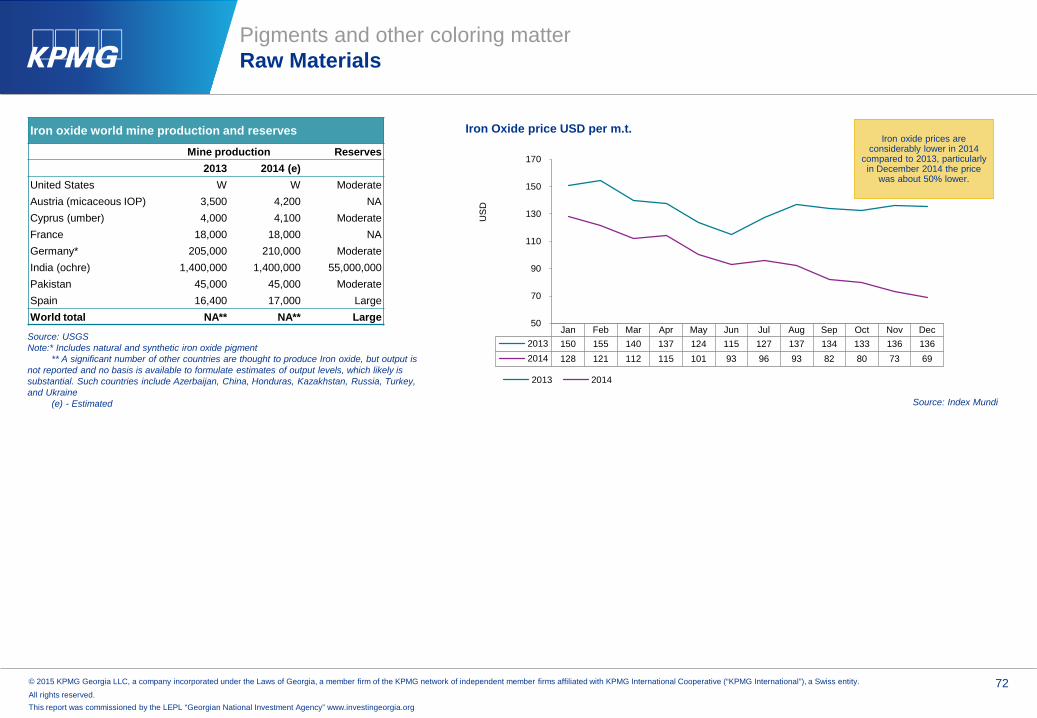
© 2015 KPMG Georgia LLC, a company incorporated under the Laws of Georgia, a member firm of the KPMG network of independent member firms affiliated with KPMG International Cooperative (“KPMG International”), a Swiss entity.
All rights reserved. 72
This report was commissioned by the LEPL “Georgian National Investment Agency” www.investingeorgia.org
Pigments and other coloring matterRaw Materials
Source: USGSNote:* Includes natural and synthetic iron oxide pigment
** A significant number of other countries are thought to produce Iron oxide, but output is not reported and no basis is available to formulate estimates of output levels, which likely is substantial. Such countries include Azerbaijan, China, Honduras, Kazakhstan, Russia, Turkey, and Ukraine
(e) - Estimated
Iron oxide world mine production and reserves
Mine production Reserves2013 2014 (e)
United States W W ModerateAustria (micaceous IOP) 3,500 4,200 NACyprus (umber) 4,000 4,100 ModerateFrance 18,000 18,000 NAGermany* 205,000 210,000 ModerateIndia (ochre) 1,400,000 1,400,000 55,000,000Pakistan 45,000 45,000 ModerateSpain 16,400 17,000 LargeWorld total NA** NA** Large
Source: Index Mundi
Jan Feb Mar Apr May Jun Jul Aug Sep Oct Nov Dec2013 150 155 140 137 124 115 127 137 134 133 136 1362014 128 121 112 115 101 93 96 93 82 80 73 69
50
70
90
110
130
150
170
US
D
Iron Oxide price USD per m.t.
2013 2014
Iron oxide prices are considerably lower in 2014
compared to 2013, particularly in December 2014 the price
was about 50% lower.
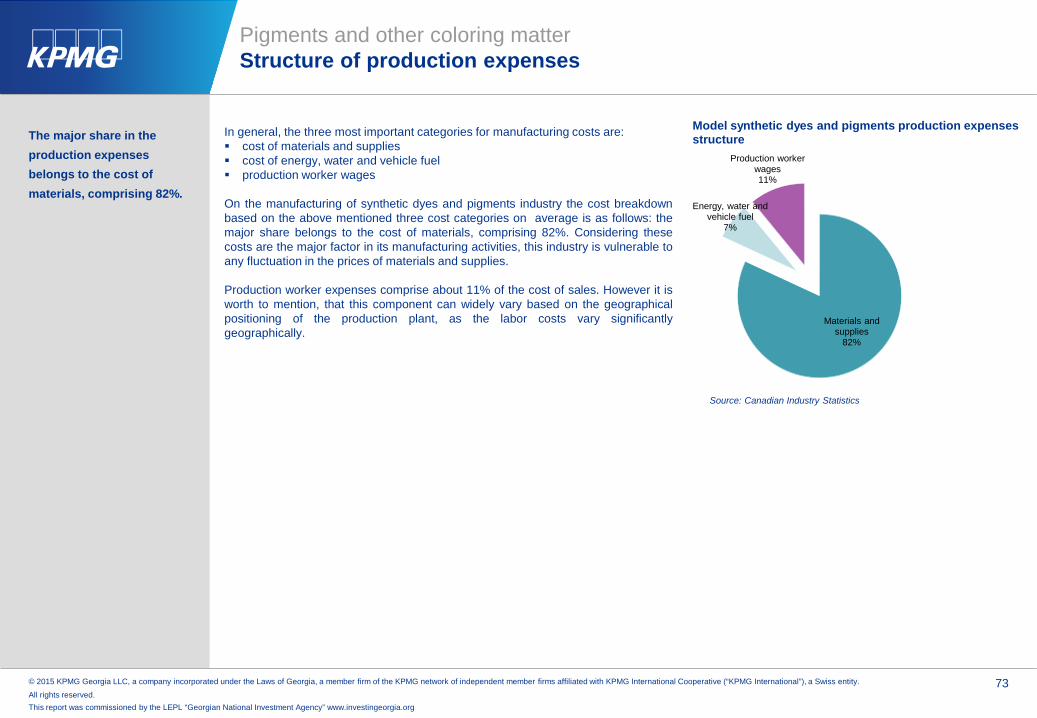
© 2015 KPMG Georgia LLC, a company incorporated under the Laws of Georgia, a member firm of the KPMG network of independent member firms affiliated with KPMG International Cooperative (“KPMG International”), a Swiss entity.
All rights reserved. 73
This report was commissioned by the LEPL “Georgian National Investment Agency” www.investingeorgia.org
The major share in the production expenses belongs to the cost of materials, comprising 82%.
Pigments and other coloring matterStructure of production expenses
In general, the three most important categories for manufacturing costs are: cost of materials and supplies cost of energy, water and vehicle fuel production worker wages
On the manufacturing of synthetic dyes and pigments industry the cost breakdownbased on the above mentioned three cost categories on average is as follows: themajor share belongs to the cost of materials, comprising 82%. Considering thesecosts are the major factor in its manufacturing activities, this industry is vulnerable toany fluctuation in the prices of materials and supplies.
Production worker expenses comprise about 11% of the cost of sales. However it isworth to mention, that this component can widely vary based on the geographicalpositioning of the production plant, as the labor costs vary significantlygeographically.
Materials and supplies
82%
Energy, water and vehicle fuel
7%
Production worker wages11%
Model synthetic dyes and pigments production expenses structure
Source: Canadian Industry Statistics

© 2015 KPMG Georgia LLC, a company incorporated under the Laws of Georgia, a member firm of the KPMG network of independent member firms affiliated with KPMG International Cooperative (“KPMG International”), a Swiss entity.
All rights reserved. 74
This report was commissioned by the LEPL “Georgian National Investment Agency” www.investingeorgia.org
Pigments and other coloring matterPrice Analysis
Source: ITC
Source: ITC
Source: ITC
Volume and price of consumption can be affected by many factors.The fundamental price drivers are supply, demand and price of rawmaterials. The price of the products is also dependent on theproduction technology and the types of raw materials used.
The main price drivers in pigments and other coloring matterproduction industry are: Cost of raw materials Labor cost Type of production technology used Transportation costs (both for raw materials and finished products)
The highest prices for the subject products were registered in EU28 countries, followed by the CIS region, which can be mainly explained by the quality of products imported.
The main price drivers in
pigments industry are: Cost
of raw materials; Type of
production technology used
and Transportation costs
(both for raw materials and
finished products).
The highest prices were
registered in EU28
countries, followed by the
CIS region
Average import price of main types of pigments in EU28 countries, 2009-2013 (USD/Tons)
2009 2010 2011 2012 2013Titanium pigments and preps, >80% titanium oxide 2,190 2,285 3,257 3,487 2,851 Titanium pigments and preps, <80% titanium oxide 3,429 3,565 4,272 4,128 3,859 Pigments and preparations based on zinc sulphide including lithophone 2,152 2,149 2,901 3,093 2,908 Synthetic organic pigments and preparations based thereon 8,560 8,508 9,614 9,019 10,017
Average import price of main types of pigments in the Central Asian Republics, 2009-2013 (USD/Tons)
2009 2010 2011 2012 2013Titanium pigments and preps, >80% titanium oxide 1,939 2,169 3,074 3,199 2,731 Titanium pigments and preps, <80% titanium oxide 2,916 3,325 2,618 3,001 3,109 Pigments and preparations based on zinc sulphide including lithophone 2,286 1,138 1,019 1,043 983 Synthetic organic pigments and preparations based thereon 6,736 8,722 8,548 9,354 7,113
Average import price of main types of pigments in the CIS region 2009-2013 (USD/Tons)
2009 2010 2011 2012 2013Titanium pigments and preps, >80% titanium oxide 1,888 2,095 2,853 3,078 2,600 Titanium pigments and preps, <80% titanium oxide 3,217 3,222 3,679 3,744 3,612 Pigments and preparations based on zinc sulphide including lithophone 1,865 1,649 1,874 2,051 1,813 Synthetic organic pigments and preparations based thereon 7,630 7,989 9,495 9,551 8,596
Source: ITC
Average import price of main types of pigments in Georgia, 2010-2014 (USD/Tons)
2010 2011 2012 2013 2014Titanium pigments and preps, >80% titanium oxide 2,331 2,555 3,648 3,522 3,103 Titanium pigments and preps, <80% titanium oxide 10,600 10,167 9,143 5,143 4,372 Pigments and preparations based on zinc sulphide including lithophone - 2,000 - 1,857 1,900 Synthetic organic pigments and preparations based thereon 10,222 6,594 20,754 5,621 8,323

© 2015 KPMG Georgia LLC, a company incorporated under the Laws of Georgia, a member firm of the KPMG network of independent member firms affiliated with KPMG International Cooperative (“KPMG International”), a Swiss entity.
All rights reserved. 75
This report was commissioned by the LEPL “Georgian National Investment Agency” www.investingeorgia.org
Pigments and other coloring matterTop 20 pigments and other coloring matter exporter countries
Source: ITC
Georgia import value of raw materials comprised USD297 thousand in 2013.
Top 20 pigments and other coloring matter exporter countries, 2013
World EU 28 and Turkey CIS
N CountryExport Value
(USD'000) N CountryExport Value
(USD'000) N CountryExport Value
(USD'000)1 China 4,112,080 1 Germany 3,706,695 1 Russian Federation 17,234 2 Germany 3,706,695 2 Belgium 1,992,476 2 Belarus 2,184 3 United States of America 3,114,843 3 United Kingdom 1,066,152 3 Armenia 36 4 India 2,221,626 4 Netherlands 809,661 4 Kazakhstan 86 5 Belgium 1,992,476 5 France 741,885 5 Republic of Moldova 124 6 United Kingdom 1,066,152 6 Spain 719,959 6 Kyrgyzstan 9 7 Japan 977,264 7 Italy 664,821 7 Azerbaijan 2 8 Netherlands 809,661 8 Finland 355,908 8 Uzbekistan -9 France 741,885 9 Denmark 286,976 9 Tajikistan -
10 Taipei, Chinese 724,868 10 Turkey 187,096 11 Spain 719,959 11 Slovenia 175,950 12 Italy 664,821 12 Czech Republic 166,800 13 Korea, Republic of 618,100 13 Sweden 125,718 14 Switzerland 590,037 14 Poland 107,933 15 Singapore 502,107 15 Austria 85,685 16 Australia 470,448 16 Greece 76,271 17 Canada 401,412 17 Ireland 68,801 18 Mexico 365,928 18 Luxembourg 65,348 19 Finland 355,908 19 Portugal 58,589 20 Ukraine 299,251 20 Hungary 43,669

© 2015 KPMG Georgia LLC, a company incorporated under the Laws of Georgia, a member firm of the KPMG network of independent member firms affiliated with KPMG International Cooperative (“KPMG International”), a Swiss entity.
All rights reserved. 76
This report was commissioned by the LEPL “Georgian National Investment Agency” www.investingeorgia.org
Pigments and other coloring matterTop 20 pigments and other coloring matter importer countries
Source: ITC
Georgia import value of main raw materials comprised USD2,627 thousand in 2013.
Top 20 pigments and other coloring matter importer countries, 2013
World EU 28 and Turkey CIS
N CountryExport Value
(USD'000) N CountryExport Value
(USD'000) N CountryExport Value
(USD'000)1 Germany 2,283,943 1 Germany 2,283,943 1 Russian Federation 489,503 2 United States of America 2,138,435 2 Italy 1,205,212 2 Belarus 68,674 3 China 1,886,364 3 France 1,076,297 3 Uzbekistan 38,198 4 Korea, Republic of 1,406,974 4 Turkey 1,054,562 4 Kazakhstan 25,692 5 Italy 1,205,212 5 Belgium 841,664 5 Azerbaijan 5,630 6 France 1,076,297 6 Netherlands 734,653 6 Republic of Moldova 3,921 7 Turkey 1,054,562 7 Spain 645,903 7 Kyrgyzstan 1,899 8 India 949,725 8 United Kingdom 647,312 8 Armenia 1,489 9 Japan 962,232 9 Poland 411,794 9 Tajikistan 1,437
10 Brazil 891,742 10 Sweden 278,230 11 Mexico 835,371 11 Denmark 224,681 12 Belgium 841,664 12 Portugal 194,591 13 Indonesia 746,431 13 Austria 213,401 14 Netherlands 734,653 14 Czech Republic 137,165 15 Thailand 700,543 15 Hungary 135,641 16 Spain 645,903 16 Finland 127,613 17 United Kingdom 647,312 17 Romania 94,225 18 Taipei, Chinese 642,894 18 Greece 89,216 19 Canada 563,306 19 Luxembourg 66,623 20 Russian Federation 489,503 20 Ireland 65,552

© 2015 KPMG Georgia LLC, a company incorporated under the Laws of Georgia, a member firm of the KPMG network of independent member firms affiliated with KPMG International Cooperative (“KPMG International”), a Swiss entity.
All rights reserved. 77
This report was commissioned by the LEPL “Georgian National Investment Agency” www.investingeorgia.org
Pigments and other coloring matterTop 20 producers
Source: Capital IQ1) Industry Classifications: Inorganic Dyes and Pigments (Primary) OR Organic Dyes And Pigments (Primary)2) The ranking is based on the annual revenue figures based on the latest financial year information available
Top 20 pigments and other coloring matter producing companies
Company1 DIC Corporation2 Clariant AG3 RPM International Inc.4 Toyo Ink SC Holdings Co., Ltd.5 Zhejiang Longsheng Group Co., Ltd.6 Valhi, Inc.7 Ferro Corporation8 Rockwood Holdings, Inc.9 Archroma Management LLC10 Eckart Pigment GmbH11 KRONOS TITAN GmbH12 Zhejiang Runtu Co., Ltd.13 Sumitomo Chemical Belgium14 Clariant (Brazil) S.A.15 INEOS Americas, LLC16 Tioxide Europe Ltd.17 Sun Chemical Ltd18 Hexcel Composites S.A.19 CAPAROL Farben Lacke Bautenschutz GmbH20 Nippon Pigment Co., Ltd. (TSE:4119)
World major pigment producing companies by production capacity as at 2013 are:
• Dupont – 18% (world production capacity)
• Cristal – 11%• Kronos – 9%• Huntsman – 9%• Tronox – 7%• Sachtleben – 5%
Source: Kronos annual report, 2013
For Top 20 importing and exporting companies please refer to the Group24.3 Paint, varnish and other coating

© 2015 KPMG Georgia LLC, a company incorporated under the Laws of Georgia, a member firm of the KPMG network of independent member firms affiliated with KPMG International Cooperative (“KPMG International”), a Swiss entity.
All rights reserved. 78
This report was commissioned by the LEPL “Georgian National Investment Agency” www.investingeorgia.org
In 2013 Georgia imported pigments and other coloring matter in the amount of USD3 million.
The major shares in the structure of product types belong to subgroups Other coloring matter; inorganic products used as luminophores and Synthetics organic coloring matter and preparations.
Pigments and other coloring matterGeorgia: Import value
Pigments and other coloring matter import value of Georgia increased by12.5% in 2014, comprising USD3 million. The highest level of import growthrate and import value was recorded in 2012, comprising 164.8% and USD7million respectively.
In 2013 Turkey accounted for 32% of the Georgian import of pigments andother coloring matter. The second largest country in the import structure isSlovenia, with 13% share, followed by Germany and Italy.
Other coloring matter; inorganic products used as luminophores subgroupcomprised 52% of the import structure of Georgia (the breakdown of thissubgroup is presented on the slide 7). The second largest share – 34%,belongs to Synthetics organic coloring matter and preparations subgroup.
Source: ITC
Source: ITCSource: ITC
1.7 2.7 7.0 2.6 3.0
14.8%
53.0%
164.8%
(62.7%)
12.5%
-100%
-50%
0%
50%
100%
150%
200%
0
1
2
3
4
5
6
7
8
2010 2011 2012 2013 2014
Grow
th rate, %Mill
ion
US
D
Pigments and other coloring matter import value, 2010-2014
Pigments and other coloring matter import value Growth rate
52%
34%
6%
5% 3%0%
Pigments and other coloring matter import structure by product type, 2014
Other coloring matter;inorganicproducts used as luminophores
Synthetic organic coloring matter& preparations
Synthetic organic or inorganictanning substances; tanningpreparationsVegetable tanning extracts;tannins & their salts
Colouring matter ofvegetable/animal origin
Colour lakes and preparationsbased thereon
32%
13%
10%
10%
7%
4%
4%
4%
3%3%
10%
Pigments and other coloring matter import structure by country, 2014
Turkey
Slovenia
Germany
Italy
Poland
United Kingdom
Russian Federation
Hungary
France
Ukraine
Other

© 2015 KPMG Georgia LLC, a company incorporated under the Laws of Georgia, a member firm of the KPMG network of independent member firms affiliated with KPMG International Cooperative (“KPMG International”), a Swiss entity.
All rights reserved. 79
This report was commissioned by the LEPL “Georgian National Investment Agency” www.investingeorgia.org
In 2013 Georgia exported pigments and other coloring matter in the amount of USD0.14 million.
The major share in the structure of product types belongs to the subgroup Other coloring matter; inorganic products used as luminophores.
Export value to Armenia was more than the half of the total export in 2013.
Pigments and other coloring matterGeorgia: Export value
Pigments and other coloring matter export value of Georgia decreased by52.9% in 2013, comprising USD0.14 million. The highest level of export valuerecorded in 2012, comprising USD0.3 million.In 2013 Armenia accounted for 54% of the Georgian export of pigments andother coloring matter. The second largest country in the export structure isIran, with 29% share, followed by Azerbaijan.Other coloring matter; inorganic products used as luminophores subgroupcomprised 73% of the export structure of Georgia (the breakdown of thissubgroup is presented on the slide 7). Major share in this subgroup belongs tothe Titanium pigments and preparations (>80% titanium oxide), whichcomprised USD0.059 million and Pigments and preparations based on zincsulphide including lithophone, comprising USD0.034 million in 2013.Due to minor levels of pigments production in Georgia, the National statisticaloffice of Georgia does not provide information regarding the pigmentsproduction volume separately in chemical production group.According to KPMG estimates the consumption level of pigments and othercoloring matter was nearly USD2.8 million in 2013*.Note: Calculations are based on the production, import and export data
Source: ITC
Source: ITCSource: ITC
0.01 0.15 0.05 0.30 0.14
-
2,416.7%
(65.6%)
471.2%
(52.9%)
-500%
0%
500%
1000%
1500%
2000%
2500%
3000%
0
0.05
0.1
0.15
0.2
0.25
0.3
0.35
2009 2010 2011 2012 2013
Grow
th rate, %Mill
ion
US
D
Pigments and other coloring matter export value, 2010-2014
Pigments and other coloring matter export value Growth rate
73%
27%
Pigments and other coloring matter export structure by product type, 2014
Other coloring matter;inorganicproducts used as luminophores
Synthetic organic coloringmatter & preparations
54%
29%
17%
Pigments and other coloring matter export structure by country, 2014
Armenia
Iran (Islamic Republic of)
Azerbaijan

© 2015 KPMG Georgia LLC, a company incorporated under the Laws of Georgia, a member firm of the KPMG network of independent member firms affiliated with KPMG International Cooperative (“KPMG International”), a Swiss entity.
All rights reserved. 80
This report was commissioned by the LEPL “Georgian National Investment Agency” www.investingeorgia.org
In 2013 Armenia imported pigments and other coloring matter in the amount of USD1.5 million.
The major shares in the structure of product types belong to subgroups Other coloring matter; inorganic products used as luminophores and Synthetics organic coloring matter and preparations.
In 2013 Turkey accounted for 28% of the Armenian import of pigments and other coloring matter.
Pigments and other coloring matterArmenia: Import value
Paints and other coloring matter import value of Armenia decreased by1.7% in 2013 compared to 2012, comprising USD1.5 million. Highest levelof import growth rate was recorded in 2010, comprising 89.3%. Majordecrease of import value in 2012 can be partly explained by instable rawmaterial prices in the sector.
In 2013 Turkey accounted for 28% of the Armenian import of pigments andother coloring matter. The second largest country in the import structure isChina, with 10% share, followed by Czech Republic and Germany.
Other coloring matter; inorganic products used as luminophores subgroupcomprised 57% of the import structure of Armenia (the breakdown of thissubgroup is presented on the slide 7). The second largest share – 29%,belongs to Synthetics organic coloring matter and preparations subgroup.
Source: ITC
Source: ITCSource: ITC
0.7 1.3 1.9 1.5 1.5(30.8%)
89.3%
45.2%
(21.1%)
(1.7%)
-40%
-20%
0%
20%
40%
60%
80%
100%
0
0.5
1
1.5
2
2.5
2009 2010 2011 2012 2013
Grow
th rate, %Mill
ion
US
D
Pigments and other coloring matter import value, 2009-2013
Pigments and other coloring matter import value Growth rate
57%29%
7%5% 2%
Pigments and other coloring matter import structure by product type, 2013
Other coloring matter;inorganicproducts used as luminophores
Synthetic organic coloring matter& preparations
Vegetable tanning extracts;tannins & their salts
Colouring matter ofvegetable/animal origin
Synthetic organic or inorganictanning substances; tanningpreps; enzy
28%
10%
8%8%
7%
6%
5%
5%
4%
3%
16%
Pigments and other coloring matter import structure by country, 2013
Turkey
China
Czech Republic
Germany
India
Belgium
Austria
Georgia
Italy
Iran (Islamic Republic of)
Other
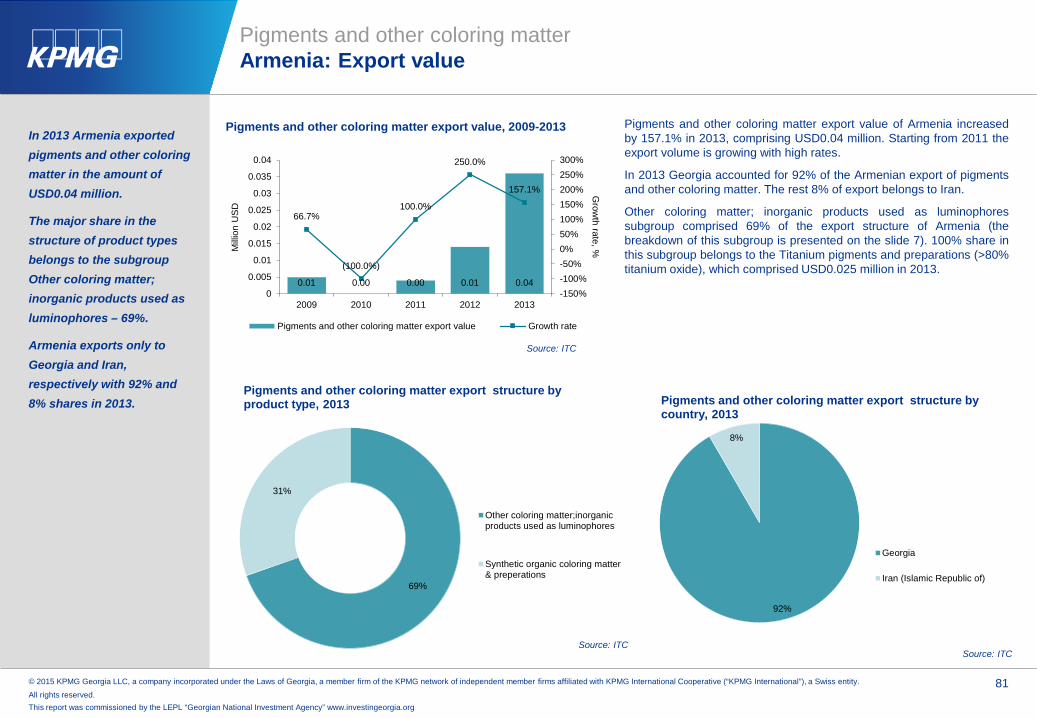
© 2015 KPMG Georgia LLC, a company incorporated under the Laws of Georgia, a member firm of the KPMG network of independent member firms affiliated with KPMG International Cooperative (“KPMG International”), a Swiss entity.
All rights reserved. 81
This report was commissioned by the LEPL “Georgian National Investment Agency” www.investingeorgia.org
In 2013 Armenia exported pigments and other coloring matter in the amount of USD0.04 million.
The major share in the structure of product types belongs to the subgroup Other coloring matter; inorganic products used as luminophores – 69%.
Armenia exports only to Georgia and Iran, respectively with 92% and 8% shares in 2013.
Pigments and other coloring matterArmenia: Export value
Pigments and other coloring matter export value of Armenia increasedby 157.1% in 2013, comprising USD0.04 million. Starting from 2011 theexport volume is growing with high rates.
In 2013 Georgia accounted for 92% of the Armenian export of pigmentsand other coloring matter. The rest 8% of export belongs to Iran.
Other coloring matter; inorganic products used as luminophoressubgroup comprised 69% of the export structure of Armenia (thebreakdown of this subgroup is presented on the slide 7). 100% share inthis subgroup belongs to the Titanium pigments and preparations (>80%titanium oxide), which comprised USD0.025 million in 2013.
Source: ITC
Source: ITCSource: ITC
0.01 0.00 0.00 0.01 0.04
66.7%
(100.0%)
100.0%
250.0%
157.1%
-150%-100%-50%0%50%100%150%200%250%300%
0
0.005
0.01
0.015
0.02
0.025
0.03
0.035
0.04
2009 2010 2011 2012 2013
Grow
th rate, %Mill
ion
US
D
Pigments and other coloring matter export value, 2009-2013
Pigments and other coloring matter export value Growth rate
69%
31%
Pigments and other coloring matter export structure by product type, 2013
Other coloring matter;inorganicproducts used as luminophores
Synthetic organic coloring matter& preperations
92%
8%
Pigments and other coloring matter export structure by country, 2013
Georgia
Iran (Islamic Republic of)

© 2015 KPMG Georgia LLC, a company incorporated under the Laws of Georgia, a member firm of the KPMG network of independent member firms affiliated with KPMG International Cooperative (“KPMG International”), a Swiss entity.
All rights reserved. 82
This report was commissioned by the LEPL “Georgian National Investment Agency” www.investingeorgia.org
28
10.1
19.1
9.4 (63.5%)
89.0%
(50.6%)
-80%-60%-40%-20%0%20%40%60%80%100%
0
5
10
15
20
25
30
2011 2012 2013 2014
Grow
th rate, %Thou
sand
US
D
Pigments and other coloring matter production 2011-2014
Production value Growth rate
Source: National statistical service of RA
In 2013 the production volume of Armenian paint, varnish and other coating industry decreased by 13.3%, comprising 9,408 tons.
Pigments and other coloring matterArmenia: Production
In 2014 the production value of Armenian pigments and other coloringmatter industry comprised USD9.4 thousand.
According to KPMG calculation* the Armenian pigments and other coloringmatter market consumption comprised about USD1,460 thousand in 2013.
Note: Calculations are based on the production, import and export data
.

© 2015 KPMG Georgia LLC, a company incorporated under the Laws of Georgia, a member firm of the KPMG network of independent member firms affiliated with KPMG International Cooperative (“KPMG International”), a Swiss entity.
All rights reserved. 83
This report was commissioned by the LEPL “Georgian National Investment Agency” www.investingeorgia.org
In 2013 Azerbaijan imported pigments and other coloring matter in the amount of USD5.6 million.
The major shares in the structure of product types belong to subgroups Other coloring matter; inorganic products used as luminophores and Synthetics organic coloring matter and preparations.
In 2013 Turkey accounted for 52% of the Azerbaijan import of pigments and other coloring matter.
Pigments and other coloring matterAzerbaijan: Import value
Paints and other coloring matter import value of Azerbaijan inreased by15.1% in 2013 compared to 2012, comprising USD5.6 million. Highestlevel of import growth rate was recorded in 2010, comprising 71.1% afterthe world economic crisis.
In 2013 Turkey accounted for 52% of the Azerbaijan import of pigmentsand other coloring matter. The second largest country in the importstructure is France, with 13% share.
Other coloring matter; inorganic products used as luminophores subgroupcomprised 72% of the import structure of Azerbaijan (the breakdown of thissubgroup is presented on the slide 7). The second largest share – 23%,belongs to Synthetics organic coloring matter and preparations subgroup.
Source: ITC
Source: ITCSource: ITC
1.9 3.2 4.3 4.9 5.6
(22.1%)
71.1%
34.5%
13.1% 15.1%
(40.0%)
(20.0%)
-
20.0%
40.0%
60.0%
80.0%
0
1
2
3
4
5
6
2009 2010 2011 2012 2013
Grow
th rate, %Mill
ion
US
D
Pigments and other coloring matter import value, 2009-2013
Pigments and other coloring matter import value Growth rate
72%
23%
3%2%
Pigments and other coloring matter import structure by product type, 2013
Other coloring matter;inorganicproducts used as luminophores
Synthetic organic coloring matter& preperations
Synthetic organic or inorganictanning substances; tanningpreps; enzyOther
52%
13%
6%
5%
4%
3%3%
3%3%
2%5% 1%
Pigments and other coloring matter import structure by country, 2013
TurkeyFranceIran (Islamic Republic of)United States of AmericaBelgiumChinaSaudi ArabiaItalyGermanyNorwayOtherKorea, Republic of

© 2015 KPMG Georgia LLC, a company incorporated under the Laws of Georgia, a member firm of the KPMG network of independent member firms affiliated with KPMG International Cooperative (“KPMG International”), a Swiss entity.
All rights reserved. 84
This report was commissioned by the LEPL “Georgian National Investment Agency” www.investingeorgia.org
0.007 0.005 0.000 0.000 0.002
(50.0%)(28.6%)
(100.0%)
-
100.0%
-150%
-100%
-50%
0%
50%
100%
150%
0
0.001
0.002
0.003
0.004
0.005
0.006
0.007
0.008
2009 2010 2011 2012 2013
Grow
th rate, %Mill
ion
US
D
Pigments and other coloring matter export value, 2009-2013
Pigments and other coloring matter export value Growth rate
In 2013 Azerbaijan exported pigments and other coloring matter in the amount of USD0.002 million.
Azerbaijan exports only to Georgia and Russia, respectively with 67% and 33% shares in 2013.
Pigments and other coloring matterAzerbaijan: Export value
Pigments and other coloring matter export value of Azerbaijancomprised USD0.002 million in 2013. During 2011-2012 have no exportin the subject sector.
Azerbaijan exports only Synthetic organic pigments and preparationsbased thereon from Synthetic organic coloring matter and preparationssubgroup.
Azerbaijan exports only to Georgia and Russia, respectively with 67%and 33% shares in 2013.
The state statistical committee of Azerbaijan provides informationregarding “paintwork materials”, without separating coatings andpigments, so, please refer to Group 2.4 Paint, varnish and other coatingfor paintwork materials production statistics.
According to USGS Azerbaijan has considerable amount of Iron oxideproduction, however the figures are not disclosed.Source: ITC
Source: ITC
67%
33%
Pigments and other coloring matter export structure by country, 2013
Georgia
Russian Federation
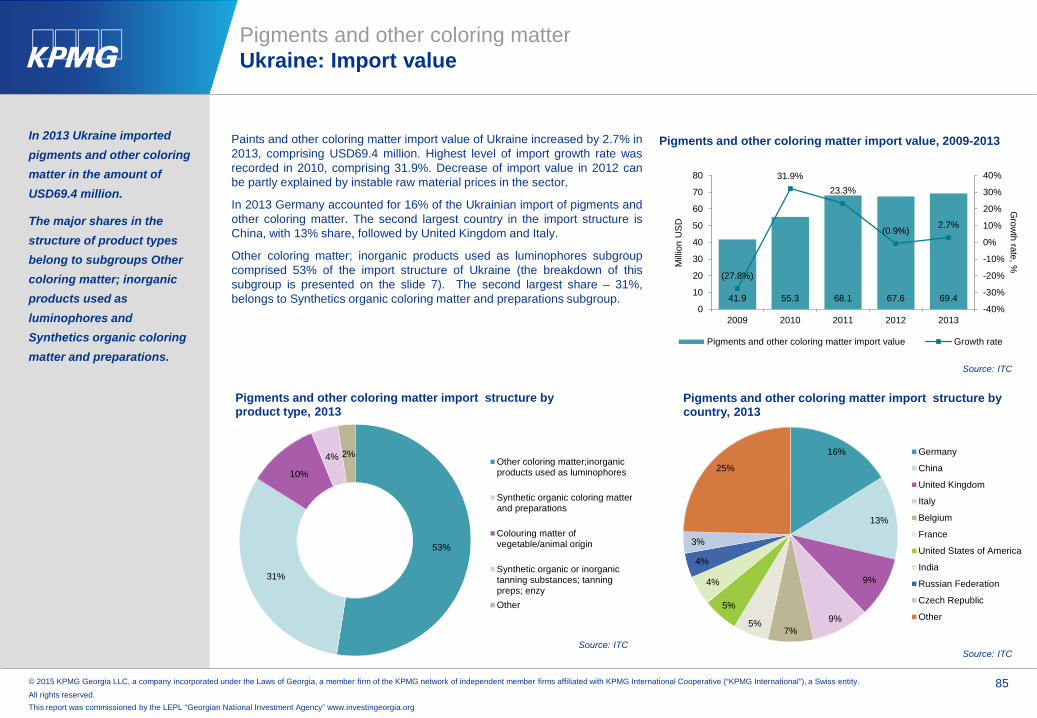
© 2015 KPMG Georgia LLC, a company incorporated under the Laws of Georgia, a member firm of the KPMG network of independent member firms affiliated with KPMG International Cooperative (“KPMG International”), a Swiss entity.
All rights reserved. 85
This report was commissioned by the LEPL “Georgian National Investment Agency” www.investingeorgia.org
In 2013 Ukraine imported pigments and other coloring matter in the amount of USD69.4 million.
The major shares in the structure of product types belong to subgroups Other coloring matter; inorganic products used as luminophores and Synthetics organic coloring matter and preparations.
Pigments and other coloring matterUkraine: Import value
Paints and other coloring matter import value of Ukraine increased by 2.7% in2013, comprising USD69.4 million. Highest level of import growth rate wasrecorded in 2010, comprising 31.9%. Decrease of import value in 2012 canbe partly explained by instable raw material prices in the sector.
In 2013 Germany accounted for 16% of the Ukrainian import of pigments andother coloring matter. The second largest country in the import structure isChina, with 13% share, followed by United Kingdom and Italy.
Other coloring matter; inorganic products used as luminophores subgroupcomprised 53% of the import structure of Ukraine (the breakdown of thissubgroup is presented on the slide 7). The second largest share – 31%,belongs to Synthetics organic coloring matter and preparations subgroup.
Source: ITC
Source: ITCSource: ITC
41.9 55.3 68.1 67.6 69.4
(27.8%)
31.9% 23.3%
(0.9%) 2.7%
-40%
-30%
-20%
-10%
0%
10%
20%
30%
40%
0
10
20
30
40
50
60
70
80
2009 2010 2011 2012 2013
Grow
th rate, %Mill
ion
US
D
Pigments and other coloring matter import value, 2009-2013
Pigments and other coloring matter import value Growth rate
53%
31%
10%
4% 2%
Pigments and other coloring matter import structure by product type, 2013
Other coloring matter;inorganicproducts used as luminophores
Synthetic organic coloring matterand preparations
Colouring matter ofvegetable/animal origin
Synthetic organic or inorganictanning substances; tanningpreps; enzyOther
16%
13%
9%
9%7%
5%
5%
4%
4%
3%
25%
Pigments and other coloring matter import structure by country, 2013
Germany
China
United Kingdom
Italy
Belgium
France
United States of America
India
Russian Federation
Czech Republic
Other

© 2015 KPMG Georgia LLC, a company incorporated under the Laws of Georgia, a member firm of the KPMG network of independent member firms affiliated with KPMG International Cooperative (“KPMG International”), a Swiss entity.
All rights reserved. 86
This report was commissioned by the LEPL “Georgian National Investment Agency” www.investingeorgia.org
In 2013 Ukraine exported pigments and other coloring matter in the amount of USD299.3 million.
The major share in the structure of product types belongs to the subgroup Other coloring matter; inorganic products used as luminophores.
Export value to Russia and Germany comprised 40% of the total export in 2013.
Pigments and other coloring matterUkraine: Export value
Pigments and other coloring matter export value of Ukraine decreasedby 8.7% in 2013, comprising USD299.3 million. The highest level ofexport growth rate and export value was recorded in 2011, comprising43.9% and USD331.5 million respectively.
In 2013 Russia accounted for 22% of the Ukrainian export of pigmentsand other coloring matter. The second largest country in the exportstructure is Germany, with 18% share, followed by Turkey and USA.
Other coloring matter; inorganic products used as luminophoressubgroup comprised 99% of the export structure of Ukraine (thebreakdown of this subgroup is presented on the slide 7). Major share inthis subgroup belongs to the Titanium pigments and preperations (>80%titanium oxide), which comprised USD285 million in 2013.
Ukraine exports nearly 80-90% of the pigments and other coloringmatter production, thus according to KPMG estimates the consumptionlevel comprised nearly USD144 million in 2013.Source: ITC
Source: ITCSource: ITC
99%
1%
Pigments and other coloring matter export structure by product type, 2013
Other coloringmatter;inorganic productsused as luminophores
Other
177.1 230.3 331.5 327.8 299.3(16.9%)
30.0%
43.9%
(1.1%)(8.7%)
(20.0%)
(10.0%)
-
10.0%
20.0%
30.0%
40.0%
50.0%
0
50
100
150
200
250
300
350
2009 2010 2011 2012 2013
Grow
th rate, %Mill
ion
US
D
Pigments and other coloring matter export value, 2009-2013
Pigments and other coloring matter import value Growth rate
22%
18%
12%8%
5%
4%
3%3%2%2%
21%
Pigments and other coloring matter export structure by country, 2013
Russian Federation
Germany
Turkey
United States of America
Italy
Korea, Republic of
Spain
France
Uzbekistan
Cyprus
Other

© 2015 KPMG Georgia LLC, a company incorporated under the Laws of Georgia, a member firm of the KPMG network of independent member firms affiliated with KPMG International Cooperative (“KPMG International”), a Swiss entity.
All rights reserved. 87
This report was commissioned by the LEPL “Georgian National Investment Agency” www.investingeorgia.org
Pigments and other coloring matterUkraine: Production
Source: State Statistics service of UkraineNote: * Data have been excluded to execute of Ukraine’s Law On State Statistics regarding confidentiality of information
Production volume of raw materials, pigments and othet coloring matter in Ukrain, 2013
N DesignationProduction volume
(m.t)Raw materials
1 Zinc oxide; zinc peroxide, t *
2Iron oxides and hydroxides; earth colours containing 70 % or more by weight of
combined iron evaluated as Fe2O3, kg 7,229
3Lithium oxide and hydroxide; vanadium oxides and hydroxides; nickel oxides and
hydroxides; germanium oxides and zirconium dioxide, kg *
4 Other inorganic bases; other metal oxides, hydroxides and peroxides, n.e.c., kg 47,062
Pigments and other coloring matter5 Disperse dyes and preparations based thereon, t 2,028 6 Other synthetic organic colouring matters, t 5,206 7 Synthetic organic products used as fluorescent brightening agents, t *8 Colour lakes; preparations based on colour lakes, t *
9Colouring matter of vegetable or animal origin and preparations based thereon
(including dyeing extracts) (excluding animal black), t *
10Pigments and preparations based on titanium dioxide containing ≥ 80 % by weight
of titanium dioxide, t TiO₂ *

© 2015 KPMG Georgia LLC, a company incorporated under the Laws of Georgia, a member firm of the KPMG network of independent member firms affiliated with KPMG International Cooperative (“KPMG International”), a Swiss entity.
All rights reserved. 88
This report was commissioned by the LEPL “Georgian National Investment Agency” www.investingeorgia.org
In 2013 Turkey imported pigments and other coloring matter in the amount of USD1,055 million.
The major shares in the structure of product types belong to subgroups Synthetic organic coloring matter and preparations and Other coloring matter, inorganic products used as luminophores.
Pigments and other coloring matterTurkey: Import value
Paints and other coloring matter import value of Turkey increased by 4.9%in 2013, comprising USD1,055 million. Highest level of import growth rateswere recorded in 2010 and 2011, comprising 24.2% and 25.8%respectively. The import value decreased in 2012 by 5.2%.
In 2013 China accounted for 18% of the Turkey import of pigments andother coloring matter. The second largest country in the import structure isIndia, with 15% share, followed by Germany and United States ofAmerica.
Synthetic organic coloring matter and preparations subgroup comprised52% of the import structure of Turkey. The second largest share – 42%,belongs to other coloring matter, inorganic products used as luminophores(the breakdown of this subgroups are presented on slide 7).
Source: ITC
Source: ITCSource: ITC
678.9 843.0 1,060.2 1,005.4 1,054.6(17.1%)
24.2% 25.8%
(5.2%)
4.9%
-20%-15%-10%-5%0%5%10%15%20%25%30%
0
200
400
600
800
1000
1200
2009 2010 2011 2012 2013
Grow
th rate, %Mill
ion
US
D
Pigments and other coloring matter import value, 2009-2013
Pigments and other coloring matter import value Growth rate
52%42%
4% 2%
Pigments and other coloring matter import structure by product type, 2013
Synthetic organic coloring matterand preparations
Other coloring matter; inorganicproducts used as luminophores
Synthetic organic or inorganictanning substances; tanningpreps; enzy
Other
18%
15%
14%
5%4%3%
3%3%
3%3%
29%
Pigments and other coloring matter import structure by country, 2013
China
India
Germany
United States of America
United Kingdom
Ukraine
Italy
Spain
Belgium
Netherlands
Other

© 2015 KPMG Georgia LLC, a company incorporated under the Laws of Georgia, a member firm of the KPMG network of independent member firms affiliated with KPMG International Cooperative (“KPMG International”), a Swiss entity.
All rights reserved. 89
This report was commissioned by the LEPL “Georgian National Investment Agency” www.investingeorgia.org
In 2013 Turkey exported pigments and other coloring matter in the amount of USD187.1 million.
The major share in the structure of product types belong to Synthetic organic or inorganic tanning substances.
Pigments and other coloring matterTurkey: Export value
Pigments and other coloring matter export value of Turkey increased by18% in 2013 compared to 2012, comprising USD187.1 million. Highestlevel of export growth rate was recorded in 2010, comprising 29%.
In 2013 China accounted for 13% of the Turkey export of pigments andother coloring matter. The second largest country in the export structureis Brazil, with 7% share. Overall there are no dominating countries in theexport structure of Turkey.
Synthetic organic or inorganic tanning substances subgroup comprised45% of the export structure of Turkey. Major share in this subgroupbelongs to the Inorganic tanning substances, which comprised USD82million in 2013. The second largest subgroup is the Synthetic organiccoloring matter and preparations subgroup (the breakdown of thissubgroup is presented on the slide 7), comprising 33%.
Source: ITC
Source: ITCSource: ITC
108.0 139.3 158.2 158.5 187.1
(8.6%)
29.0%
13.5%
0.2%
18.0%
-15%-10%-5%0%5%10%15%20%25%30%35%
020406080
100120140160180200
2009 2010 2011 2012 2013
Grow
th rate, %Mill
ion
US
D
Pigments and other coloring matter export value, 2009-2013
Pigments and other coloring matter export value Growth rate
Source: ITC
45%
33%
20%
2%
Pigments and other coloring matter export structure by product type, 2013
Synthetic organic or inorganictanning substances; tanningpreps; enzySynthetic organic coloring matterand preperations
Other coloring matter;inorganicproducts used as luminophores
Other
13%
7%
7%
7%
7%
7%6%3%
3%3%
37%
Pigments and other coloring matter export structure by country, 2013
China
Brazil
Free Zones
Russian Federation
Uzbekistan
Egypt
Iran (Islamic Republic of)
Korea, Republic of
Azerbaijan
Pakistan
Other

© 2015 KPMG Georgia LLC, a company incorporated under the Laws of Georgia, a member firm of the KPMG network of independent member firms affiliated with KPMG International Cooperative (“KPMG International”), a Swiss entity.
All rights reserved. 90
This report was commissioned by the LEPL “Georgian National Investment Agency” www.investingeorgia.org
Pigments and other coloring matterTurkey: Production
List of products produced by Turkey
Raw materials1 Chromium, manganese, lead and copper oxides and hydroxides
2Lithium oxide and hydroxide; vanadium oxides and hydroxides; nickel
oxides and hydroxides; germanium oxides and zirconium dioxide
3Other inorganic bases; other metal oxides, hydroxides and peroxides,
n.e.c.Pigments and other coloring matter
1 Disperse dyes and preparations based thereon2 Acid and mordant dyes and preparations based thereon3 Reactive dyes4 Sulphuric dyes5 Synthetic organic dyes; preparations based on synthetic organic dyes6 Colour lakes; preparations based on colour lakes
7Tanning extracts of vegetable origin; tannins and their salts, ethers, esters
and other derivatives
8Inorganic tanning substances; tanning preparations; enzymatic
preparations for pre-tanning
9Pigments and preparations based on titanium dioxide (excluding those
containing >= 80% by weight of titanium dioxide)
As there is one or maximum two producers of the pigments and othercoloring matters in Turkey, the Turkish statistical institute forconfidentiality purposes does not provide information regarding theproduction volumes.
Source: Turkish statistical institute

© 2015 KPMG Georgia LLC, a company incorporated under the Laws of Georgia, a member firm of the KPMG network of independent member firms affiliated with KPMG International Cooperative (“KPMG International”), a Swiss entity.
All rights reserved. 91
This report was commissioned by the LEPL “Georgian National Investment Agency” www.investingeorgia.org
In 2013 the import of pigments and other coloring matter by CentralAsian Republics increased by 24.2% and was USD71 million. Thehighest import growth rates were registered in 2010 and 2011,comprising 31.8% and 38.4% respectively.
In 2013 Uzbekistan was the biggest importer of pigments and othercoloring matter among Central Asian Republics, accounting for morethan half of the import value - 54%. Kazakhstan was the secondlargest importer with 36% of share.
Other coloring matter; inorganic products used as luminophoressubgroup accounted 49% of the import of pigments and othercoloring matter in the Central Asian Republics, followed by Syntheticorganic coloring matter and preparations subgroup with 40% share.
`
In 2013 Central Asian Republics imported USD71 million of pigments and other coloring matter.
Uzbekistan was the largest importer in 2013 with 54% share.
Pigments and other coloring matterCentral Asian Republics: Import value
Source: ITC
33 44
61 57 71
(4.2%)
31.8%
38.4%
(6.3%)
24.2%
-10%-5%0%5%10%15%20%25%30%35%40%45%
-
10
20
30
40
50
60
70
80
2009 2010 2011 2012 2013
Grow
th rate, %
Mill
ion
US
D
Pigments and other coloring matter import value in Central Asian Republics, 2009-2013
Pigments and other coloring matter export value Growth rate
54%36%
5%3% 2%
Pigments and other coloring matter importer countries in Central Asian Republics, 2013
Uzbekistan
Kazakhstan
Turkmenistan
Kyrgyzstan
Tajikistan
Source: ITC
49%
40%
8%3%
Central Asian Republics pigments and other coloring matter import structure by product type, 2013
Other coloring matter;inorganicproducts used as luminophores
Synthetic organic coloring matter& preperations
Colouring matter ofvegetable/animal origin
Other
Source: ITC

© 2015 KPMG Georgia LLC, a company incorporated under the Laws of Georgia, a member firm of the KPMG network of independent member firms affiliated with KPMG International Cooperative (“KPMG International”), a Swiss entity.
All rights reserved. 92
This report was commissioned by the LEPL “Georgian National Investment Agency” www.investingeorgia.org
In 2013 the export of pigments and other coloring matter by Central AsianRepublics decreased by 31.1% and was USD0.12 million. The highestexport level was registered in 2009, comprising USD0.3 million.
In 2013 Kazakhstan was the biggest exporter of pigments and othercoloring matter among Central Asian Republics, accounting for 75% of theexport value.
Synthetic organic coloring matter and preparations subgroup accounted55% of the export of pigments and other coloring matter in the CentralAsian Republics, followed by Other coloring matter; inorganic productsused as luminophores subgroup with 43% share.
The Central Asian Republics statistical offices do not provide informationregarding the pigments and other coloring matter production.
According to USGS Kazakhstan has capacity of Titanium oxide and Ironoxide production, however the figures are not disclosed.
In 2013 Central Asian Republics exported USD0.12 million of pigments and other coloring matter.
Kazakhstan was the largest exporter in 2013 with 75% share.
Pigments and other coloring matterCentral Asian Republics: Export value
Source: ITC
0.30
0.13 0.17 0.17 0.12
(39.6%)
(55.0%)
29.9%
(4.0%)
(31.1%)
-60%-50%-40%-30%-20%-10%0%10%20%30%40%
-
0.05
0.10
0.15
0.20
0.25
0.30
0.35
2009 2010 2011 2012 2013
Grow
th rate, %
Mill
ion
US
D
Pigments and other coloring matter import value in Central Asian Republics, 2009-2013
Pigments and other coloring matter export value Growth rate
75%
17%
8%
Pigments and other coloring matter exporter countries in Central Asian Republics, 2013
Kazakhstan
Turkmenistan
Kyrgyzstan
Source: ITC
55%
43%
2%
Central Asian Republics pigments and other coloring matter export structure by product type, 2013
Synthetic organic coloring matter& preperations
Other coloring matter;inorganicproducts used as luminophores
Colour lakes and preparationsbased thereon
Source: ITC

© 2015 KPMG Georgia LLC, a company incorporated under the Laws of Georgia, a member firm of the KPMG network of independent member firms affiliated with KPMG International Cooperative (“KPMG International”), a Swiss entity.
All rights reserved. 93
This report was commissioned by the LEPL “Georgian National Investment Agency” www.investingeorgia.org
In 2013 the import of pigments and other coloring matter by EUcountries (EU 28) increased by 2.5% and was USD9,682million. The highest import level was registered in 2011,comprising USD10,808 million.
In 2013 Germany was the biggest importer of pigments andother coloring matter among EU countries accounting for 24% oftotal import. Italy was the second largest importer among EUcountries with 12% of share followed by France and Belgiumwith 11% and 9% respectively.
Other coloring matter; inorganic products used as luminophoressubgroup accounted about 47% of the import structure ofpigments and other coloring matter in the EU, followed bySynthetic organic coloring matter and preparations subgroup,with 43% share.
In 2013 EU countries imported around USD9,682 million of pigments and other coloring matter.
Germany was the largest importer in 2013 among EU countries with 24% share.
Pigments and other coloring matterEU: Import value
47%
43%
6%4%
EU28 pigments and other coloring matter import structure by product type, 2013
Other coloringmatter;inorganic productsused as luminophoresSynthetic organic coloringmatter & preperations
Colouring matter ofvegetable/animal origin
Other
Source: ITC
7,522 8,747
10,808 9,449 9,682
(20.7%)
16.3%
23.6%
(12.6%)
2.5%
-25%-20%-15%-10%-5%0%5%10%15%20%25%30%
-
2,000
4,000
6,000
8,000
10,000
12,000
2009 2010 2011 2012 2013
Grow
th rate, %
Mill
ion
US
D
Pigments and other coloring matter import value in EU28, 2009-2013
Pigments and other coloring matter export value Growth rate
Source: ITC
24%
12%
11%
9%
7%
7%
7%
4%
3%2%
14%
Top 10 pigments and other coloring matter importer countries in EU28, 2013
Germany
Italy
France
Belgium
Netherlands
United Kingdom
Spain
Poland
Sweden
Denmark
Other
Source: ITC
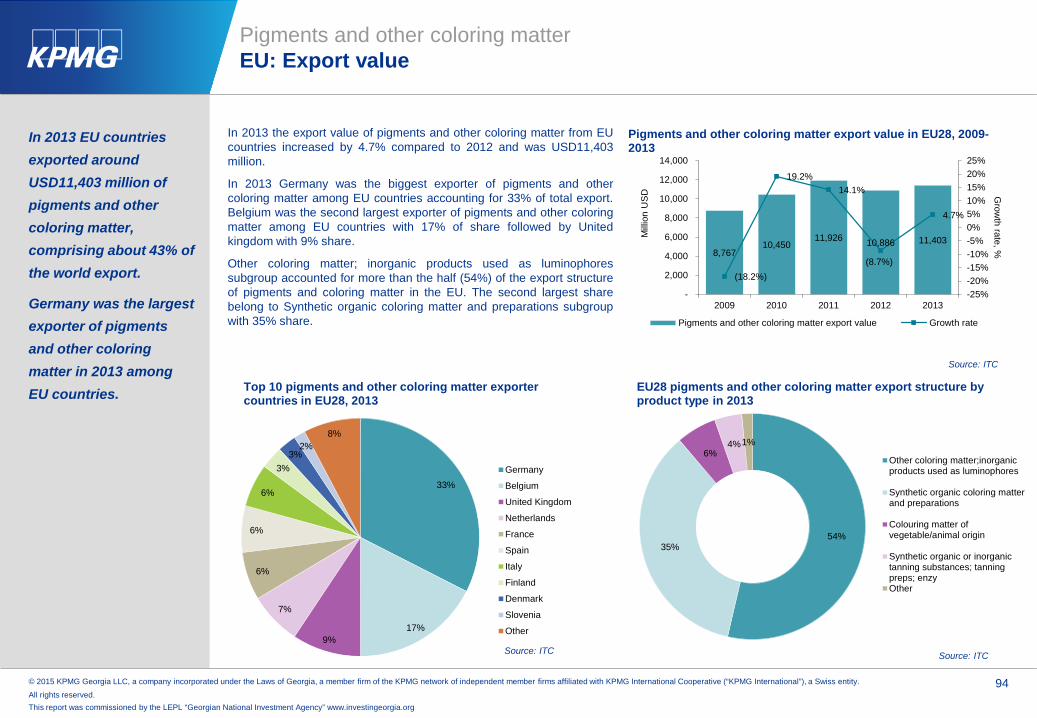
© 2015 KPMG Georgia LLC, a company incorporated under the Laws of Georgia, a member firm of the KPMG network of independent member firms affiliated with KPMG International Cooperative (“KPMG International”), a Swiss entity.
All rights reserved. 94
This report was commissioned by the LEPL “Georgian National Investment Agency” www.investingeorgia.org
In 2013 the export value of pigments and other coloring matter from EUcountries increased by 4.7% compared to 2012 and was USD11,403million.
In 2013 Germany was the biggest exporter of pigments and othercoloring matter among EU countries accounting for 33% of total export.Belgium was the second largest exporter of pigments and other coloringmatter among EU countries with 17% of share followed by Unitedkingdom with 9% share.
Other coloring matter; inorganic products used as luminophoressubgroup accounted for more than the half (54%) of the export structureof pigments and coloring matter in the EU. The second largest sharebelong to Synthetic organic coloring matter and preparations subgroupwith 35% share.
In 2013 EU countries exported around USD11,403 million of pigments and other coloring matter, comprising about 43% of the world export.
Germany was the largest exporter of pigments and other coloring matter in 2013 among EU countries.
Pigments and other coloring matterEU: Export value
Source: ITC
Source: ITC Source: ITC
8,767 10,450
11,926 10,886 11,403
(18.2%)
19.2% 14.1%
(8.7%)
4.7%
-25%-20%-15%-10%-5%0%5%10%15%20%25%
-
2,000
4,000
6,000
8,000
10,000
12,000
14,000
2009 2010 2011 2012 2013
Grow
th rate, %
Mill
ion
US
D
Pigments and other coloring matter export value in EU28, 2009-2013
Pigments and other coloring matter export value Growth rate
54%35%
6%4%1%
EU28 pigments and other coloring matter export structure by product type in 2013
Other coloring matter;inorganicproducts used as luminophores
Synthetic organic coloring matterand preparations
Colouring matter ofvegetable/animal origin
Synthetic organic or inorganictanning substances; tanningpreps; enzyOther
33%
17%9%
7%
6%
6%
6%
3%3%
2%8%
Top 10 pigments and other coloring matter exporter countries in EU28, 2013
Germany
Belgium
United Kingdom
Netherlands
France
Spain
Italy
Finland
Denmark
Slovenia
Other
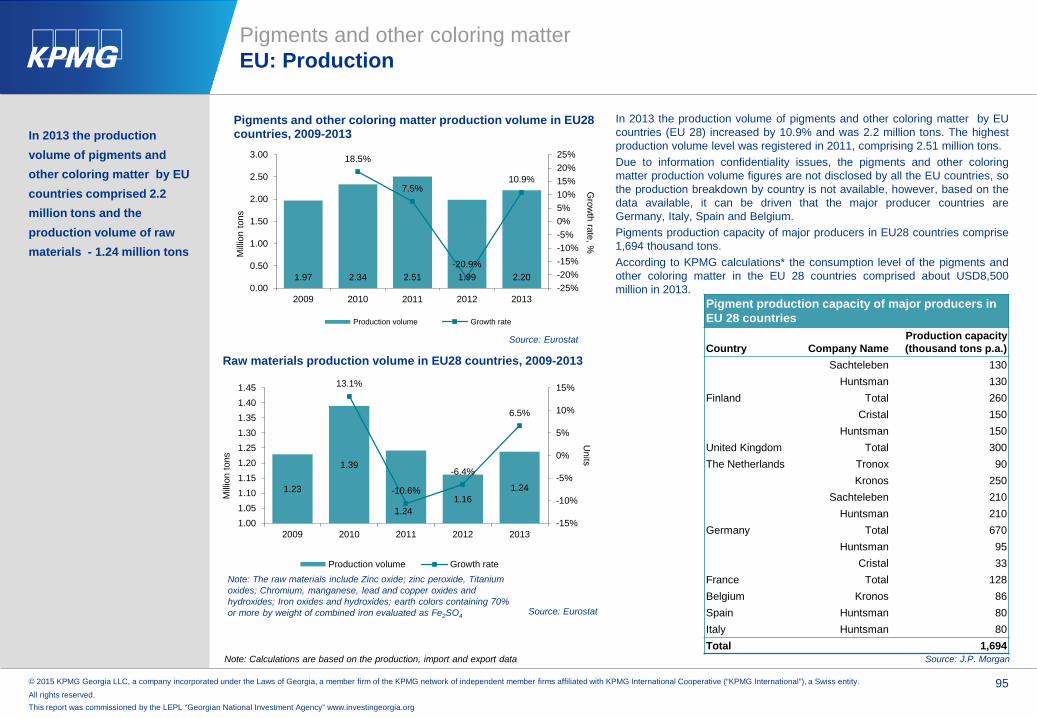
© 2015 KPMG Georgia LLC, a company incorporated under the Laws of Georgia, a member firm of the KPMG network of independent member firms affiliated with KPMG International Cooperative (“KPMG International”), a Swiss entity.
All rights reserved. 95
This report was commissioned by the LEPL “Georgian National Investment Agency” www.investingeorgia.org
In 2013 the production volume of pigments and other coloring matter by EU countries comprised 2.2 million tons and the production volume of raw materials - 1.24 million tons
Pigments and other coloring matterEU: Production
In 2013 the production volume of pigments and other coloring matter by EUcountries (EU 28) increased by 10.9% and was 2.2 million tons. The highestproduction volume level was registered in 2011, comprising 2.51 million tons.Due to information confidentiality issues, the pigments and other coloringmatter production volume figures are not disclosed by all the EU countries, sothe production breakdown by country is not available, however, based on thedata available, it can be driven that the major producer countries areGermany, Italy, Spain and Belgium.Pigments production capacity of major producers in EU28 countries comprise1,694 thousand tons.According to KPMG calculations* the consumption level of the pigments andother coloring matter in the EU 28 countries comprised about USD8,500million in 2013.
1.97 2.34 2.51 1.99 2.20
18.5%
7.5%
-20.9%
10.9%
-25%-20%-15%-10%-5%0%5%10%15%20%25%
0.00
0.50
1.00
1.50
2.00
2.50
3.00
2009 2010 2011 2012 2013
Grow
th rate, %
Mill
ion
tons
Pigments and other coloring matter production volume in EU28 countries, 2009-2013
Production volume Growth rate
Source: Eurostat
1.23
1.39
1.241.16
1.24
13.1%
-10.6%
-6.4%
6.5%
-15%
-10%
-5%
0%
5%
10%
15%
1.001.051.101.151.201.251.301.351.401.45
2009 2010 2011 2012 2013
Units
Mill
ion
tons
Raw materials production volume in EU28 countries, 2009-2013
Production volume Growth rate
Source: Eurostat
Note: The raw materials include Zinc oxide; zinc peroxide, Titanium oxides; Chromium, manganese, lead and copper oxides and hydroxides; Iron oxides and hydroxides; earth colors containing 70% or more by weight of combined iron evaluated as Fe2SO4
Pigment production capacity of major producers in EU 28 countries
Country Company NameProduction capacity (thousand tons p.a.)
Finland
Sachteleben 130Huntsman 130
Total 260
United Kingdom
Cristal 150Huntsman 150
Total 300The Netherlands Tronox 90
Germany
Kronos 250Sachteleben 210
Huntsman 210Total 670
France
Huntsman 95Cristal 33
Total 128Belgium Kronos 86Spain Huntsman 80Italy Huntsman 80Total 1,694
Source: J.P. Morgan Note: Calculations are based on the production, import and export data
© 2015 KPMG Georgia LLC, a company incorporated under the Laws of Georgia, a member firm of the KPMG network of independent member firms affiliated with KPMG International Cooperative (“KPMG International”), a Swiss entity.
All rights reserved. 96
This report was commissioned by the LEPL “Georgian National Investment Agency” www.investingeorgia.org
Pigments and other coloring matterProject pipeline
No major projects in Central Asia, South Caucuses, Turkey and Ukraine are identified.
The pigments and other coloring matter production industry is characterized by high barriers to entry consisting of high capital costs, proprietary technology and significant lead times (typically three to five years) required to construct new facilities or to expand existing capacity. In addition, the suppliers of raw materials need time to increase the supply of the raw materials.
So, according to major pigment producers, it is unlikely that any new major pigment plants will be constructed in Europe in the foreseeable future.
There is also tendencies of reconstructing of existing plants from USA and Europe in China and other Asian countries with low cost workforce and availability of raw materials.
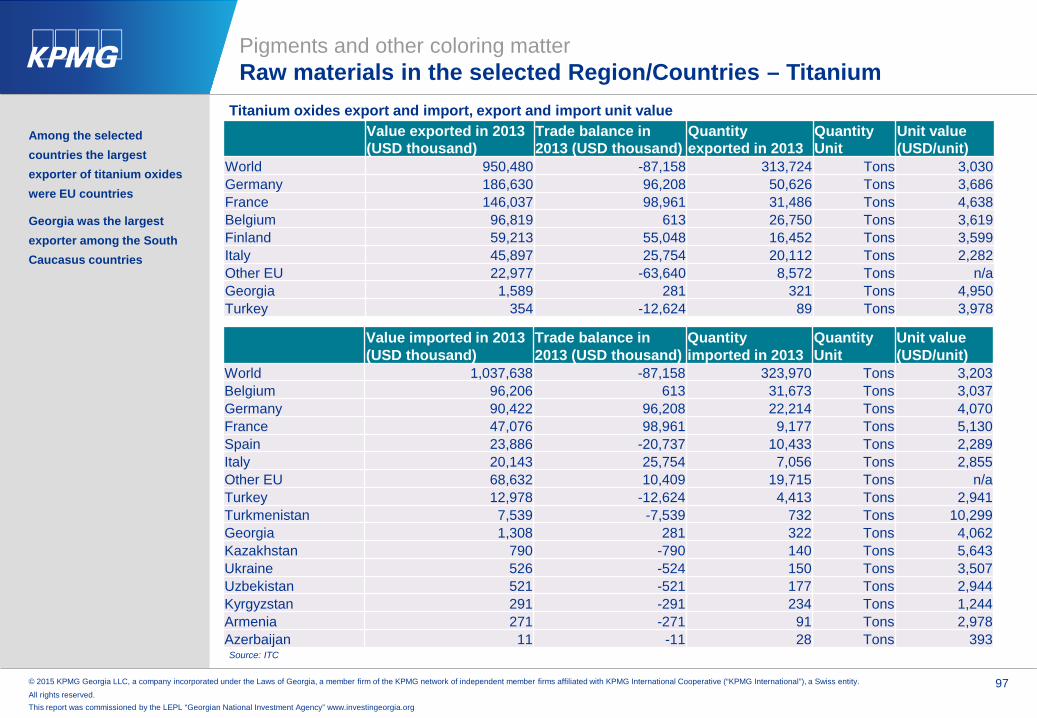
© 2015 KPMG Georgia LLC, a company incorporated under the Laws of Georgia, a member firm of the KPMG network of independent member firms affiliated with KPMG International Cooperative (“KPMG International”), a Swiss entity.
All rights reserved. 97
This report was commissioned by the LEPL “Georgian National Investment Agency” www.investingeorgia.org
Among the selected countries the largest exporter of titanium oxides were EU countries
Georgia was the largest exporter among the South Caucasus countries
Source: ITC
Value exported in 2013 (USD thousand)
Trade balance in 2013 (USD thousand)
Quantity exported in 2013
Quantity Unit
Unit value (USD/unit)
World 950,480 -87,158 313,724 Tons 3,030Germany 186,630 96,208 50,626 Tons 3,686France 146,037 98,961 31,486 Tons 4,638Belgium 96,819 613 26,750 Tons 3,619Finland 59,213 55,048 16,452 Tons 3,599Italy 45,897 25,754 20,112 Tons 2,282Other EU 22,977 -63,640 8,572 Tons n/aGeorgia 1,589 281 321 Tons 4,950Turkey 354 -12,624 89 Tons 3,978
Titanium oxides export and import, export and import unit value
Value imported in 2013 (USD thousand)
Trade balance in 2013 (USD thousand)
Quantity imported in 2013
Quantity Unit
Unit value (USD/unit)
World 1,037,638 -87,158 323,970 Tons 3,203Belgium 96,206 613 31,673 Tons 3,037Germany 90,422 96,208 22,214 Tons 4,070France 47,076 98,961 9,177 Tons 5,130Spain 23,886 -20,737 10,433 Tons 2,289Italy 20,143 25,754 7,056 Tons 2,855Other EU 68,632 10,409 19,715 Tons n/aTurkey 12,978 -12,624 4,413 Tons 2,941Turkmenistan 7,539 -7,539 732 Tons 10,299Georgia 1,308 281 322 Tons 4,062Kazakhstan 790 -790 140 Tons 5,643Ukraine 526 -524 150 Tons 3,507Uzbekistan 521 -521 177 Tons 2,944Kyrgyzstan 291 -291 234 Tons 1,244Armenia 271 -271 91 Tons 2,978Azerbaijan 11 -11 28 Tons 393
Pigments and other coloring matterRaw materials in the selected Region/Countries – Titanium

© 2015 KPMG Georgia LLC, a company incorporated under the Laws of Georgia, a member firm of the KPMG network of independent member firms affiliated with KPMG International Cooperative (“KPMG International”), a Swiss entity.
All rights reserved. 98
This report was commissioned by the LEPL “Georgian National Investment Agency” www.investingeorgia.org
Among the selected countries the largest exporter of iron oxides and hydroxides were EU countries
Source: ITC
Value exported in 2013 (USD thousand)
Trade balance in 2013 (USD thousand)
Quantity exported in 2013
Quantity Unit
Unit value (USD/unit)
World 1,109,574 -22,269 869,678 Tons 1,276Netherlands 166,861 51,662 93,133 Tons 1,792Belgium 144,153 95,267 178,299 Tons 808Germany 68,609 4,087 33,955 Tons 2,021Italy 41,222 16,737 19,264 Tons 2,140Poland 30,482 -146 16,001 Tons 1,905Spain 20,740 -64,234 21,918 Tons 946Other EU 27,323 -178,133 10,369 Tons n/aUkraine 3,597 549 3558 Tons 1011Turkey 1,012 -18,875 1,093 Tons 926Uzbekistan 344 -1,702 319 Tons 1,078Armenia 4 -54 6 Tons 667
Iron oxides and hydroxides export and import, export and import unit value
Value imported in 2013 (USD thousand)
Trade balance in 2013 (USD thousand)
Quantity imported in 2013
Quantity Unit
Unit value (USD/unit)
World 1,072,226 -237,568 1,042,693 Tons 1,028Germany 44,809 -44,809 51,293 Tons 874United Kingdom 34,660 -22,349 28,546 Tons 1,214Netherlands 29,117 -20,814 25,994 Tons 1,120France 28,179 -9,700 18,585 Tons 1,516Italy 26,929 31,651 32,914 Tons 818Other EU 112,912 -42,905 98,309 Tons n/aTurkey 19,887 -18,875 14,944 Tons 1,331Kazakhstan 3,581 -3,581 2,592 Tons 1,382Ukraine 3,048 549 2,474 Tons 1,232Uzbekistan 2,046 -1,702 2,382 Tons 859Turkmenistan 559 -559 366 Tons 1,527Azerbaijan 253 -253 253 Tons 1,000Kyrgyzstan 151 -151 177 Tons 853Georgia 71 -71 72 Tons 986Armenia 58 -54 34 Tons 1,706Tajikistan 22 -22 22 Tons 1,000
Pigments and other coloring matterRaw materials in the selected Region/Countries – Iron oxides and hydroxides
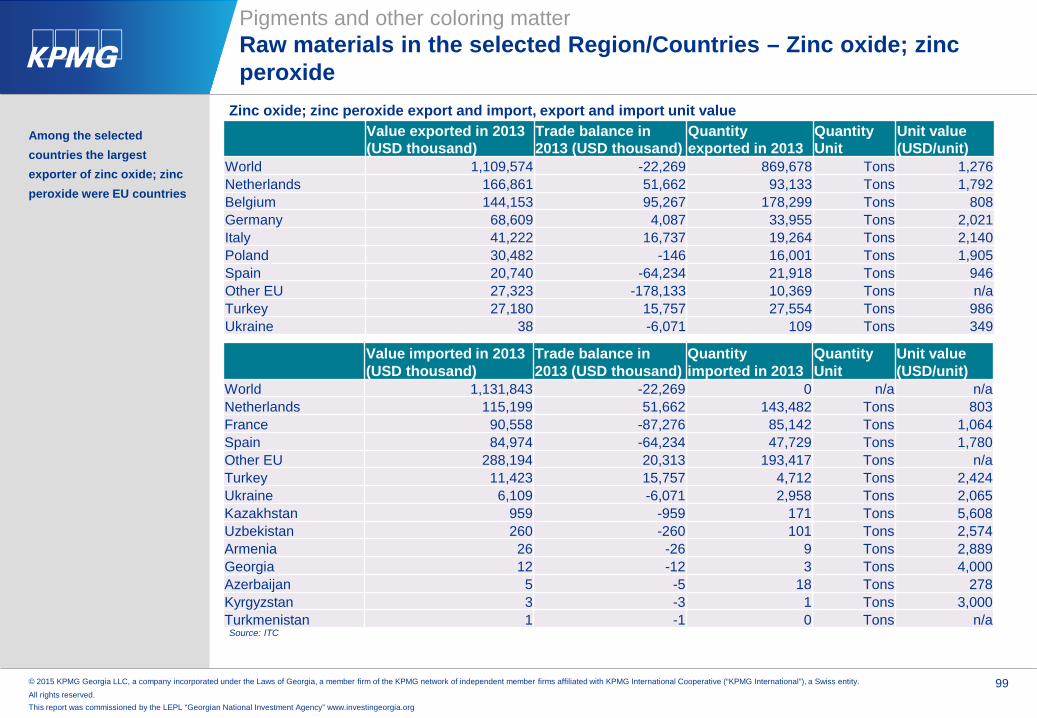
© 2015 KPMG Georgia LLC, a company incorporated under the Laws of Georgia, a member firm of the KPMG network of independent member firms affiliated with KPMG International Cooperative (“KPMG International”), a Swiss entity.
All rights reserved. 99
This report was commissioned by the LEPL “Georgian National Investment Agency” www.investingeorgia.org
Among the selected countries the largest exporter of zinc oxide; zinc peroxide were EU countries
Source: ITC
Value exported in 2013 (USD thousand)
Trade balance in 2013 (USD thousand)
Quantity exported in 2013
Quantity Unit
Unit value (USD/unit)
World 1,109,574 -22,269 869,678 Tons 1,276Netherlands 166,861 51,662 93,133 Tons 1,792Belgium 144,153 95,267 178,299 Tons 808Germany 68,609 4,087 33,955 Tons 2,021Italy 41,222 16,737 19,264 Tons 2,140Poland 30,482 -146 16,001 Tons 1,905Spain 20,740 -64,234 21,918 Tons 946Other EU 27,323 -178,133 10,369 Tons n/aTurkey 27,180 15,757 27,554 Tons 986Ukraine 38 -6,071 109 Tons 349
Zinc oxide; zinc peroxide export and import, export and import unit value
Value imported in 2013 (USD thousand)
Trade balance in 2013 (USD thousand)
Quantity imported in 2013
Quantity Unit
Unit value (USD/unit)
World 1,131,843 -22,269 0 n/a n/aNetherlands 115,199 51,662 143,482 Tons 803France 90,558 -87,276 85,142 Tons 1,064Spain 84,974 -64,234 47,729 Tons 1,780Other EU 288,194 20,313 193,417 Tons n/aTurkey 11,423 15,757 4,712 Tons 2,424Ukraine 6,109 -6,071 2,958 Tons 2,065Kazakhstan 959 -959 171 Tons 5,608Uzbekistan 260 -260 101 Tons 2,574Armenia 26 -26 9 Tons 2,889Georgia 12 -12 3 Tons 4,000Azerbaijan 5 -5 18 Tons 278Kyrgyzstan 3 -3 1 Tons 3,000Turkmenistan 1 -1 0 Tons n/a
Pigments and other coloring matterRaw materials in the selected Region/Countries – Zinc oxide; zinc peroxide
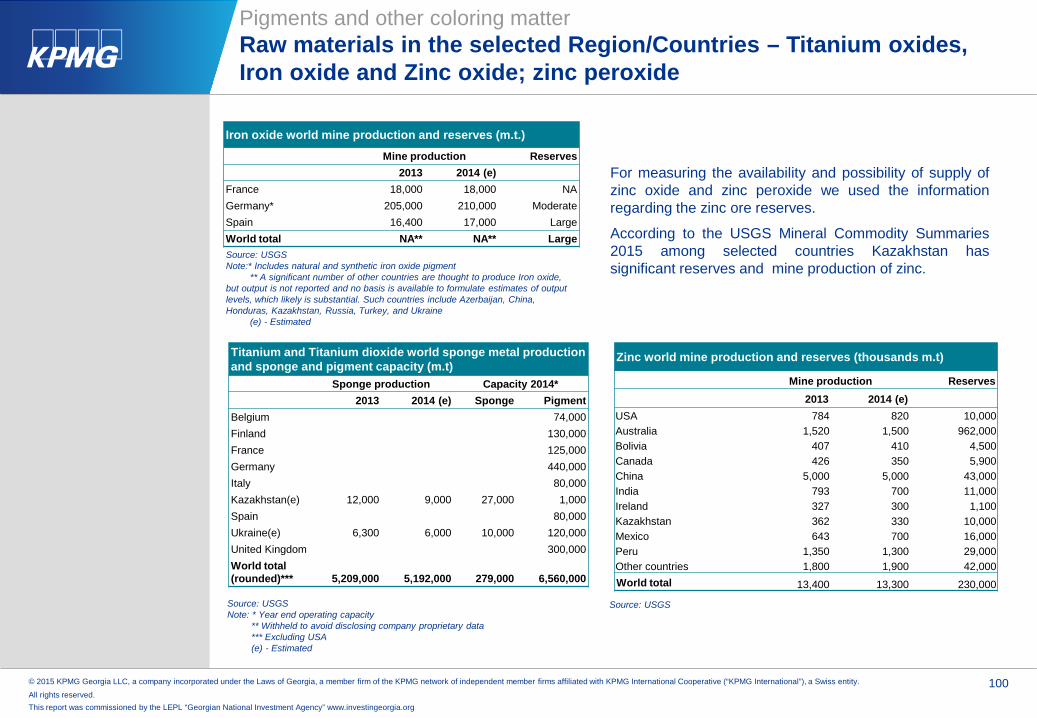
© 2015 KPMG Georgia LLC, a company incorporated under the Laws of Georgia, a member firm of the KPMG network of independent member firms affiliated with KPMG International Cooperative (“KPMG International”), a Swiss entity.
All rights reserved. 100
This report was commissioned by the LEPL “Georgian National Investment Agency” www.investingeorgia.org
Titanium and Titanium dioxide world sponge metal production and sponge and pigment capacity (m.t)
Sponge production Capacity 2014*2013 2014 (e) Sponge Pigment
Belgium 74,000Finland 130,000France 125,000Germany 440,000Italy 80,000Kazakhstan(e) 12,000 9,000 27,000 1,000Spain 80,000Ukraine(e) 6,300 6,000 10,000 120,000United Kingdom 300,000World total (rounded)*** 5,209,000 5,192,000 279,000 6,560,000
Source: USGSNote: * Year end operating capacity
** Withheld to avoid disclosing company proprietary data*** Excluding USA(e) - Estimated
Source: USGSNote:* Includes natural and synthetic iron oxide pigment
** A significant number of other countries are thought to produce Iron oxide, but output is not reported and no basis is available to formulate estimates of output levels, which likely is substantial. Such countries include Azerbaijan, China, Honduras, Kazakhstan, Russia, Turkey, and Ukraine
(e) - Estimated
Iron oxide world mine production and reserves (m.t.)
Mine production Reserves2013 2014 (e)
France 18,000 18,000 NAGermany* 205,000 210,000 ModerateSpain 16,400 17,000 LargeWorld total NA** NA** Large
For measuring the availability and possibility of supply ofzinc oxide and zinc peroxide we used the informationregarding the zinc ore reserves.
According to the USGS Mineral Commodity Summaries2015 among selected countries Kazakhstan hassignificant reserves and mine production of zinc.
Zinc world mine production and reserves (thousands m.t)
Mine production Reserves2013 2014 (e)
USA 784 820 10,000Australia 1,520 1,500 962,000Bolivia 407 410 4,500Canada 426 350 5,900China 5,000 5,000 43,000India 793 700 11,000Ireland 327 300 1,100Kazakhstan 362 330 10,000Mexico 643 700 16,000Peru 1,350 1,300 29,000Other countries 1,800 1,900 42,000World total 13,400 13,300 230,000
Source: USGS
Pigments and other coloring matterRaw materials in the selected Region/Countries – Titanium oxides, Iron oxide and Zinc oxide; zinc peroxide

© 2015 KPMG Georgia LLC, a company incorporated under the Laws of Georgia, a member firm of the KPMG network of independent member firms affiliated with KPMG International Cooperative (“KPMG International”), a Swiss entity.
All rights reserved. 101
This report was commissioned by the LEPL “Georgian National Investment Agency” www.investingeorgia.org
Pigments and other coloring matterMain factors of successful functionality of the factory
.Main factors Description
Buyer power Pigments and other coloring matter is mainly used in paint and coatings industry and plastics production. The latter is a big industry with wide variety of consumers, which generally leads to the decreased buyer power.
Raw materials availability (supplier power)
As mentioned earlier in the report the raw materials share in the production cost is around 82%which makes the producers margins sensitive to any fluctuation in the prices of materials andsupplies.
Production scale Generally pigments are produced in a large scale.
Intellectual property The demand for innovative high performance pigments and other coloring matter is increasingbut for leveraging in this new growth opportunity the industry participants will have to makesubstantial investments in the R&D.
Degree of regulation The industry is generally regulated.
Demand drivers The main demand driver for the industry is the strong demand from end user industries(specifically paint and coatings industry and plastics production).The demand for environmentally friendly products are increasing.
Other factors Setting up a production facilities of pigments and other coloring matter requires high capitalcosts, proprietary technology and significant lead times (typically three to five years) forconstruction.

Mineral Fertilizer and nitrogen compounds

© 2015 KPMG Georgia LLC, a company incorporated under the Laws of Georgia, a member firm of the KPMG network of independent member firms affiliated with KPMG International Cooperative (“KPMG International”), a Swiss entity.
All rights reserved. 103
This report was commissioned by the LEPL “Georgian National Investment Agency” www.investingeorgia.org
Mineral Fertilizer and nitrogen compoundsMapping – Georgian Classifier via Generally used classifiers
In Georgian National Classifier SEK 001-2004 Sub Group 24.15 includes two major
sections
Mineral Fertilizer and nitrogen compounds
Production of mineral fertilizersAmmonia production
Our analysis of the fertilizer market includes all nitrogen, phosphates and potash based fertilizers. In our analysis the use of ‘fertilizer’refers to all fertilizers (nitrogen, phosphate and potash based) and includes the total number (production, consumption, etc) of all thetypes. When analyzing the structure of the market from the perspective of the main types of fertilizers we separated three major groups:nitrogen fertilizers (refer to all nitrogen based fertilizers), phosphate fertilizers (refer to all phosphate based fertilizers), potash (refer to allpotassium based fertilizers), which is based on the general worldwide classification of fertilizers.
Nitrogen fertilizers Phosphate fertilizers Potassium fertilizers (potash)
In most of theglobal sources fertilizers are classified in three groups
Fertilizers are designed to improve plants growth and yield. Fertilizers replace the chemical components that are essential for growingplants. Fertilizers may be classified in different ways. When classifying the fertilizers from the perspective of nutrient structure fertilizerscan be classified as straight fertilizers which are based on one of the major nutrient (nitrogen, phosphates and potash) andmultinutrient fertilizers which are based on two or more nutrients.
Three major nutrients are nitrogen, phosphates and potassium (potash). Nitrogen is needed for growth and development in plants. Itis the building block for plants to produce protein. Phosphorus is essential for root development. It also provides the energy to drivemetabolic chemical reactions. Potassium (potash) is essential for protein synthesis and other key plant processes. Potassium helpsimprove crop resistance to disease and drought. Due to different functions nutrients can not be considered as interchangeable.
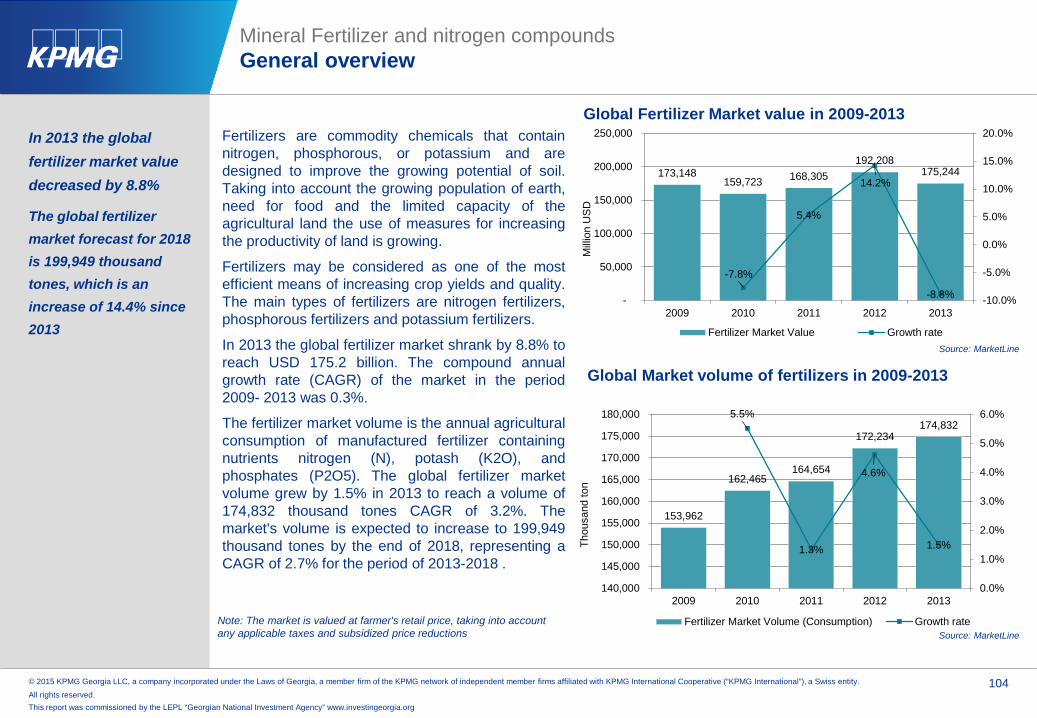
© 2015 KPMG Georgia LLC, a company incorporated under the Laws of Georgia, a member firm of the KPMG network of independent member firms affiliated with KPMG International Cooperative (“KPMG International”), a Swiss entity.
All rights reserved. 104
This report was commissioned by the LEPL “Georgian National Investment Agency” www.investingeorgia.org
Mineral Fertilizer and nitrogen compoundsGeneral overview
Fertilizers are commodity chemicals that containnitrogen, phosphorous, or potassium and aredesigned to improve the growing potential of soil.Taking into account the growing population of earth,need for food and the limited capacity of theagricultural land the use of measures for increasingthe productivity of land is growing.
Fertilizers may be considered as one of the mostefficient means of increasing crop yields and quality.The main types of fertilizers are nitrogen fertilizers,phosphorous fertilizers and potassium fertilizers.
In 2013 the global fertilizer market shrank by 8.8% toreach USD 175.2 billion. The compound annualgrowth rate (CAGR) of the market in the period2009- 2013 was 0.3%.
The fertilizer market volume is the annual agriculturalconsumption of manufactured fertilizer containingnutrients nitrogen (N), potash (K2O), andphosphates (P2O5). The global fertilizer marketvolume grew by 1.5% in 2013 to reach a volume of174,832 thousand tones CAGR of 3.2%. Themarket's volume is expected to increase to 199,949thousand tones by the end of 2018, representing aCAGR of 2.7% for the period of 2013-2018 .
In 2013 the global fertilizer market value decreased by 8.8%
The global fertilizer market forecast for 2018 is 199,949 thousand tones, which is an increase of 14.4% since 2013
173,148159,723 168,305
192,208175,244
-7.8%
5.4%
14.2%
-8.8% -10.0%
-5.0%
0.0%
5.0%
10.0%
15.0%
20.0%
-
50,000
100,000
150,000
200,000
250,000
2009 2010 2011 2012 2013
Mill
ion
US
D
Fertilizer Market Value Growth rate
153,962
162,465164,654
172,234174,832
5.5%
1.3%
4.6%
1.5%
0.0%
1.0%
2.0%
3.0%
4.0%
5.0%
6.0%
140,000
145,000
150,000
155,000
160,000
165,000
170,000
175,000
180,000
2009 2010 2011 2012 2013Th
ousa
nd to
n
Fertilizer Market Volume (Consumption) Growth rate
Global Fertilizer Market value in 2009-2013
Global Market volume of fertilizers in 2009-2013
Note: The market is valued at farmer's retail price, taking into account any applicable taxes and subsidized price reductions
Source: MarketLine
Source: MarketLine

© 2015 KPMG Georgia LLC, a company incorporated under the Laws of Georgia, a member firm of the KPMG network of independent member firms affiliated with KPMG International Cooperative (“KPMG International”), a Swiss entity.
All rights reserved. 105
This report was commissioned by the LEPL “Georgian National Investment Agency” www.investingeorgia.org
Nitrogen fertilizer is the largest segment of the global fertilizermarket, accounting for 59.8% (USD 104.8 billion) of the market'stotal value (revenues valued at farmer's retail price). Thephosphate fertilizer segment accounts for a further 26.1% (USD45.7 billion) of the market and the rest is potash fertilizer (USD24.6 billion) .
In terms of geographical segmentation Asia-Pacific accounts for69.3% (USD 121.3 billion) of the global fertilizer market valueand Europe accounts for a further 15.8% (USD 27.6 billion) ofthe global market. Americas accounts for 13.2% (USD 23.1billion) and Middle East and Africa for only 1.8% (USD 3 billion)
In 2013 the global import of fertilizes shrank by 8% comparedwith the previous year to reach USD 75.2 billion.
Nitrogen fertilizer is the largest segment of the global fertilizer market.
In 2013 the global import of fertilizes decreased by 8% compared with the previous year and reached USD 75.2 billion.
Nitrogen fertilizer accounted for approximately USD 30 billion of the global import of fertilizers.
Mineral Fertilizer and nitrogen compoundsMarket overview
The world import of fertilizers 2009-2013
Global fertilizer market segmentation by main fertilizer types 2013
Source: ITC
59.8%26.1%
14.1%
Nitrogen
Phosphate
Potash
69.3%
15.8%
13.2%1.8%
Asia-Pacific
Europe
Americas
Middle East& Africa
Global fertilizer market segmentation 2013
29,999
23,388
18,49145,292
58,401
85,291 81,790 75,270
-48.9%
28.9%
46.0%
-4.1% -8.0%
-60%
-40%
-20%
0%
20%
40%
60%
010,00020,00030,00040,00050,00060,00070,00080,00090,000
Mill
ion
US
D
OtherPhosphate fertilizerPotash fertilizerMixtures of nitrogen, phosphorous or potassium fertilizersNitrogen fertilizerGrowth rate
Source: MarketLine
Source: MarketLine
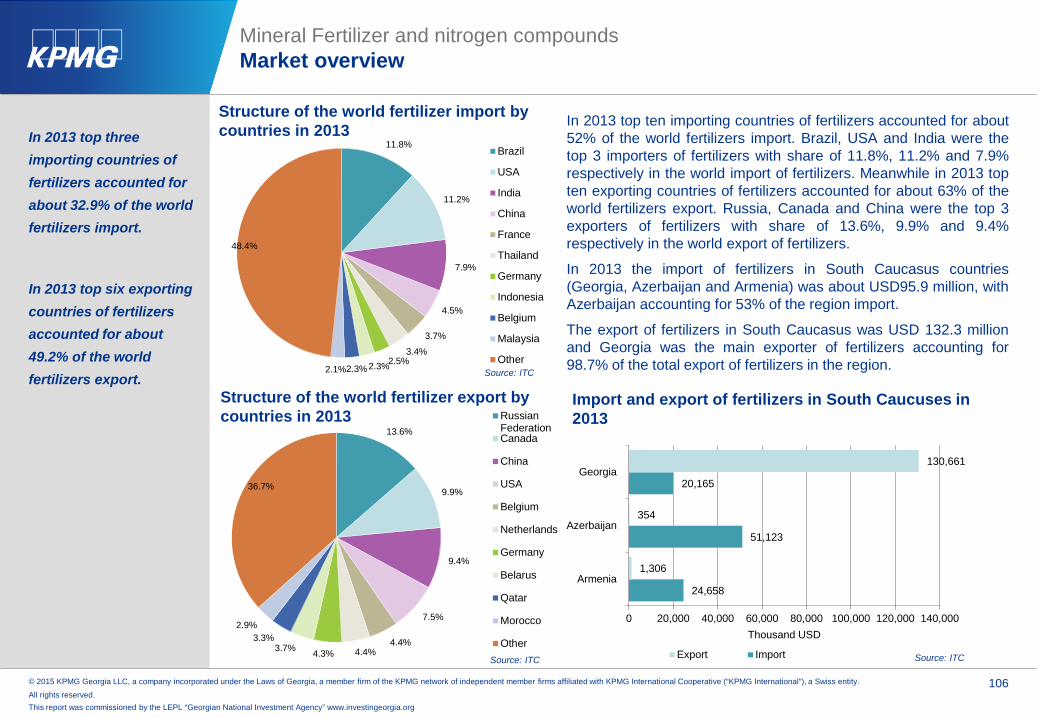
© 2015 KPMG Georgia LLC, a company incorporated under the Laws of Georgia, a member firm of the KPMG network of independent member firms affiliated with KPMG International Cooperative (“KPMG International”), a Swiss entity.
All rights reserved. 106
This report was commissioned by the LEPL “Georgian National Investment Agency” www.investingeorgia.org
11.8%
11.2%
7.9%
4.5%
3.7%
3.4%2.5%2.3%2.3%2.1%
48.4%
Brazil
USA
India
China
France
Thailand
Germany
Indonesia
Belgium
Malaysia
Other
13.6%
9.9%
9.4%
7.5%
4.4%4.4%4.3%3.7%
3.3%2.9%
36.7%
RussianFederationCanada
China
USA
Belgium
Netherlands
Germany
Belarus
Qatar
Morocco
Other
In 2013 top ten importing countries of fertilizers accounted for about52% of the world fertilizers import. Brazil, USA and India were thetop 3 importers of fertilizers with share of 11.8%, 11.2% and 7.9%respectively in the world import of fertilizers. Meanwhile in 2013 topten exporting countries of fertilizers accounted for about 63% of theworld fertilizers export. Russia, Canada and China were the top 3exporters of fertilizers with share of 13.6%, 9.9% and 9.4%respectively in the world export of fertilizers.
In 2013 the import of fertilizers in South Caucasus countries(Georgia, Azerbaijan and Armenia) was about USD95.9 million, withAzerbaijan accounting for 53% of the region import.
The export of fertilizers in South Caucasus was USD 132.3 millionand Georgia was the main exporter of fertilizers accounting for98.7% of the total export of fertilizers in the region.
In 2013 top three importing countries of fertilizers accounted for about 32.9% of the world fertilizers import.
In 2013 top six exporting countries of fertilizers accounted for about 49.2% of the world fertilizers export.
Mineral Fertilizer and nitrogen compoundsMarket overview
Import and export of fertilizers in South Caucuses in 2013
Structure of the world fertilizer import by countries in 2013
Structure of the world fertilizer export by countries in 2013
Source: ITC
Source: ITC
Source: ITC
24,658
51,123
20,165
1,306
354
130,661
0 20,000 40,000 60,000 80,000 100,000 120,000 140,000
Armenia
Azerbaijan
Georgia
Thousand USD
Export Import

© 2015 KPMG Georgia LLC, a company incorporated under the Laws of Georgia, a member firm of the KPMG network of independent member firms affiliated with KPMG International Cooperative (“KPMG International”), a Swiss entity.
All rights reserved. 107
This report was commissioned by the LEPL “Georgian National Investment Agency” www.investingeorgia.org
21.5%
6.2%
5.5%
5.3%
3.7%2.0%1.8%1.4%1.3%1.3%
50.0%
China
Russia
Canada
USA
India
Belarus
Germany
Indonesia
Ukraine
Trinidad&Tobago
Other
19.9%
10.1%
7.9%
4.7%1.6%
1.4%1.3%1.2%
1.0%
0.9%
50.0%
China
India
USA
Brazil
Indonesia
Pakistan
Canada
France
Russia
Germany
Other
Based on the main fertilizer nutrient (nitrogen,potash, and phosphates) consumption the topconsuming countries of fertilizer accounted forapproximately half of the global consumption.
According to 2011-2013 data the biggest consumerof all the main fertilizer nutrients was Chinaaccounting for 19.9% of the global consumption.India was the second largest consumer countrywith 10.1% share in the global consumptionfertilizer nutrients and USA was the third with 7.9%share.
The fertilizer market is highly concentrated with topten producing countries accounting forapproximately half of the total global production offertilizers.
According to 2013 data China accounted for 21.5%of the global production capacity of fertilizersfollowed by Russia 6.2% and Canada 5.5%.
In 2013 China accounted for 21.5% of the global production of fertilizers.
Global consumption of fertilizers was 174.8 million tones in 2013.
The global consumption of fertilizers nutrients is expected to reach 199.9 million ton by 2018.
The main factors that stipulates production of fertilizers in different region/ countries areavailability and price of key
raw materials in the region, regional demand for fertilizers, agricultural products demand (crop demand).
Mineral Fertilizer and nitrogen compoundsMarket overview
Main fertilizer consuming countries 2011-2013
Main countries with fertilizer production capacity in 2013Source: Agrium Factbook 2013-2014
Source: Agrium Factbook 2013-2014

© 2015 KPMG Georgia LLC, a company incorporated under the Laws of Georgia, a member firm of the KPMG network of independent member firms affiliated with KPMG International Cooperative (“KPMG International”), a Swiss entity.
All rights reserved. 108
This report was commissioned by the LEPL “Georgian National Investment Agency” www.investingeorgia.org
Phosphate and potash fertilizers are both produced from mined ores. Phosphate rock is the main raw material for production of phosphate based fertilizers such as MAP and DAP.
Nitrogen fertilizers are based on ammonia, which is made from the nitrogen in the air, using natural gas as a source of hydrogen and heat. Nitrogen fertilizer plants are often located near sources of natural gas.
All types of fertilizer production use gas as a source of energy.
Gas is also considered as a raw material for the production of nitrogen-based fertilizers.
Nitrogen fertilizer production cycle general description
Mineral Fertilizer and nitrogen compoundsProduction Chain
Ammonia
Air
Nitric acid plant productionAmmonia is used to produce nitrous oxide. As a result of furtherprocessing of the nitrous oxide form nitric acid
Ammonium NitrateProcessing
Natural gas
Nitrogen (Air)
Ammonia production
Ammonia is produced by combining nitrogen in the air withhydrogen in natural gas, under high temperature and pressureand in the presence of catalysts. This process for producingammonia is called the ‘Haber-Bosch’ process.
Urea
Under high pressureand temperature ammonia reacts with carbon-di-oxide to form a urea solution
Urea is finished nitrogen fertilizer product and is traded globally.
Ammonia Processing
Phosphorus productionPhosphorus is produced from phosphate rock by digesting thephosphate rock with a strong acid. Then Combined withammonia to form DAP or MAP.
Phosphate rock
AmmoniaProcessing
MAP
DAP
Phosphate fertilizer production cycle general description
Source: Agrium Factbook 2013-2014, KPMG Analysis
Source: Agrium Factbook 2013-2014, KPMG Analysis

© 2015 KPMG Georgia LLC, a company incorporated under the Laws of Georgia, a member firm of the KPMG network of independent member firms affiliated with KPMG International Cooperative (“KPMG International”), a Swiss entity.
All rights reserved. 109
This report was commissioned by the LEPL “Georgian National Investment Agency” www.investingeorgia.org
Potash fertilizer is produced separating the potassium-containing salts from other ore constituents. Production costs dependon geological conditions, ore depth and thickness, energy costs, K2O content, operational capacity and degree ofautomation. Potash and phosphate manufacturing plants are often located near potash and phosphate mines.
Mineral Fertilizer and nitrogen compoundsProduction Chain
1. Crushing2. Scrambling3. Floating to separate
potash from salt
4. Debriding anddrying5. SizingPotash ore/rock
Potash Processing Potash
Potash production cycle general description
Fertilizers produced from main nutrients (straight and multinutrient)Ammonia, anhydrous Nitric acid-60% Triple superphosphateAmmonia, aqua Sodium nitrate Deflourinated phosphateAmmonium chloride Urea Fused magnesium phosphate
Ammonium nitrateUrea ammonium nitrate solutions Phosphoric acid
Ammonium phosphate sulphate
Urea ammonium phosphate
Phosphoric acid merchant grade
Ammonium sulphateCalcium ammonium nitrate Superphosphoric acid
Ammonium polyphosphate solution Calcium nitrate Muriate of potashMonoammonium phosphate
Dicalcium phosphate anhydrous Potassium sulphate
Diammonium phosphateDicalcium phosphate dihydrate Potassium nitrate
Nitric acid -100% Single superphosphatePotassium magnesium sulphate
Wide verity of straight and multinutrient fertilizers areproduced base on the three main nutrients.
Below is presented the summary table of the main rawmaterials used in production of main fertilizers nutrients.
Fertilizer nutrient Raw materialsNitrogen Natural Gas
Phosphate Phosphate rockSulpahic acid
Potassium (Potash) Potassium Rock
Source: Agrium Factbook 2013-2014
Source: Agrium Factbook 2013-2014, KPMG Analysis
Source: KPMG analysis

© 2015 KPMG Georgia LLC, a company incorporated under the Laws of Georgia, a member firm of the KPMG network of independent member firms affiliated with KPMG International Cooperative (“KPMG International”), a Swiss entity.
All rights reserved. 110
This report was commissioned by the LEPL “Georgian National Investment Agency” www.investingeorgia.org
050
100150200250300350400450500
33.
5 44.
5 55.
5 66.
5 77.
5 88.
5 99.
5 1010
.5 1111
.5 12
US
D/t
Gas price (USD/mm Btu)Ammonia Urea Ammonium Nitrate
To asses the profitability of nitrogen fertilizerproduction in different level of processing wecalculated the gross profit margin for production ofammonia, urea and ammonium nitrate.
Production cost and global prices of all nitrogenfertilizers are highly correlated with the natural gasprices. Thus the natural gas price fluctuation maychange the profit margin of the nitrogen fertilizers.Using the natural gas price, unit production cost andnitrogen fertilizer price historical data (for the periodNovember 2013 – January 2015) we measure theaverage unit gross profit margin for ammonia, ureaand ammonium nitrate.
According to the analysis results ammonium nitratehad the highest average gross profit margin (36.9%)during the period.
Production cost and global prices of all nitrogen fertilizers are highly correlated with the natural gas prices.
The estimated average per unit (one ton) margin for ammonium was around USD 149.8, for urea USD 56.3 and for ammonium nitrate USD 102.9.
Mineral Fertilizer and nitrogen compoundsProfit distribution between market participants
Source: JP Morgan: Fertile Grounds 26 January 2015, KPMG research and analysis
-1000
100200300400500600700
US
D/t
Price - Black Seafob ($/t)
Production cost($/t)
Unit margin($/t)
-500
50100150200250300350400
US
D/t
Price - Black Seafob ($/t)
Production cost($/t)
Unit margin($/t)
November 2013 January 2015
050
100150200250300350
US
D/t
Price - Black Seafob ($/t)
Production cost($/t)
Unit margin($/t)
Nitrogen fertilizer production costs in relation to gas price
Ammonia gross profit margin
Urea gross profit margin
Gross profit margin 31.1%
Gross profit margin 17.8%
Gross profit margin 36.9%
Ammonium nitrate gross profit margin
Source: JP Morgan: Fertile Grounds 26 January 2015, KPMG research and analysis
Source: JP Morgan: Fertile Grounds 26 January 2015, KPMG research and analysis
Source: JP Morgan: Fertile Grounds 26 January 2015, KPMG research and analysis
November 2013 January 2015
November 2013 January 2015
November 2013 January 2015

© 2015 KPMG Georgia LLC, a company incorporated under the Laws of Georgia, a member firm of the KPMG network of independent member firms affiliated with KPMG International Cooperative (“KPMG International”), a Swiss entity.
All rights reserved. 111
This report was commissioned by the LEPL “Georgian National Investment Agency” www.investingeorgia.org
As the potash reserves are highly concentrated in Canada, Russia,and Belarus and the concentration level of potash market is higherthan in the phosphate and nitrogen industries. Concentrationprovides potash producers greater control and pricing power. Topsix producers control 77% of the global market.
Due to relatively flat potash cost curve and favorable prices, even high cost producers of potash are profitable. The gross profit margin of top producers is varying from 35% to up 71% for low cost producers. Uralkali and Belaruskali have the highest margins due to low cash costs.
All types of fertilizer production use gas as a source of energy.
Gas is also considered as a raw material for the production of nitrogen-based fertilizers.
Mineral Fertilizer and nitrogen compoundsProfit distribution between market participants
PotashCorp14%
Mosaic14%
Uralkali18%
Belaruskali12%
K+S10%
ICL9%
Other23%
The primal factors for making profit is the levelof prices in the region/the world and theproduction costs.
The production cost of phosphate fertilizersproducers may very drastically. In a givenprice level (USD 481) the gross profit marginfor market participants may very form 5.6% upto 49.3%. The reason for such big differenceis the structure of production cost and totalproduction cash cost level. Further analysis ofproduction costs is presented in the followingsection of this report.
Phosphate (DAP) gross profit margin of different market participants at a given price level
Source: Cross Asset research; Global Fertilizer Sector, KPMG research and analysis
Price = USD 481/t
Global Producer Potash Shipment Shares in 2013
Source: BMO Capital markets: Chemicals and Fertilizers, KPMG research
36.2%
49.3%45.7%
29.3%
5.6%
0.0%
10.0%
20.0%
30.0%
40.0%
50.0%
60.0%
Morocco Saudi Arabia PhosAgro(Russian)
Mosaic (USA) India

© 2015 KPMG Georgia LLC, a company incorporated under the Laws of Georgia, a member firm of the KPMG network of independent member firms affiliated with KPMG International Cooperative (“KPMG International”), a Swiss entity.
All rights reserved. 112
This report was commissioned by the LEPL “Georgian National Investment Agency” www.investingeorgia.org
1%
17%
4%
6%
1%8% 8%
8%
8%14%
10%
16%6%
10%
8%
6%22%
55%
0%
13%
8%
21%
3%
5%1%
0%
21%
5%
40%
11%
40%
2% 4% 3% 1%2%
0%
10%
20%
30%
40%
50%
60%
70%
80%
90%
100%
World production Export Import Consumption
West Europe EU 27Central Europe East Europe & Central AsiaNorth America Latin AmericaAfrica West AsiaSouth Asia East AsiaOceania Various
In 2014 Global phosphate rock production rose by 3% to 199Mt (million ton) concentrate. China accounts for the 80Mtrepresenting an increase of 4% over 2013. Excluding China,world phosphate rock production expanded by 2% to 119 Mt.
Morocco is the world’s leading phosphate rock exporter,accounting for roughly one-third of the world trade. Thelargest concentration of rock exporters is in the Middle Eastand North Africa. Together these regions represent almost75% of the total world trade.
India is the top importer of phosphate rock, accounting forroughly 24% of the world imports. The remainder of importsis fairly evenly spread among countries in Asia, Europe andNorth America.
Availability of Phosphate rock deposit is a decisive factor in the production of phosphorus and respective fertilizers.
Morocco is the world’s leading phosphate rock exporter, accounting for roughly one-third of the world trade.
2012 the world phosphate rock:
Production/Consumption – 195,296 thousand ton
Import, Export – 30,158 thousand ton
Mineral Fertilizer and nitrogen compoundsRaw Materials
Phosphate rock Production, Export, Import and Consumption by regions (based on 2012 data)
Source: US Geological Survey, KPMG research
Source: International Fertilizer Industry Association (IFA)
Phosphate rock deposit and mine production
In 2015, the world phosphate rock output and trade are expected toincrease reaching up to 204 Mt and around 32 Mt, respectively.Imports of phosphate concentrates are seen rising into Canada,India, Indonesia, and Europe.
According to the initial forecasts the main exporters in 2015 wouldbe Morocco, Jordan and Peru and the main Importer countrieswould be India and countries of South East Asia (Brunei, Burma,Cambodia, East Timor, Indonesia, Laos, Malaysia, the Philippines,Singapore, Thailand and Vietnam.).11. Argus and CIBC World Markets Inc.
Mine production Reserves 000 ton2013 2014e
Morocco and Western Sahara 26,400 30,000 50,000,000China 108,000 100,000 3,700,000Algeria 1,500 1,500 2,200,000Syria 500 1,000 1,800,000South Africa 2,300 2,200 1,500,000Jordan 5,400 6,000 1,300,000Russia 10,000 10,000 1,300,000US 31,200 27,100 1,100,000Australia 2,600 2,600 1,030,000Peru 2,580 2,600 820,000World total (rounded) - - 67,000,000
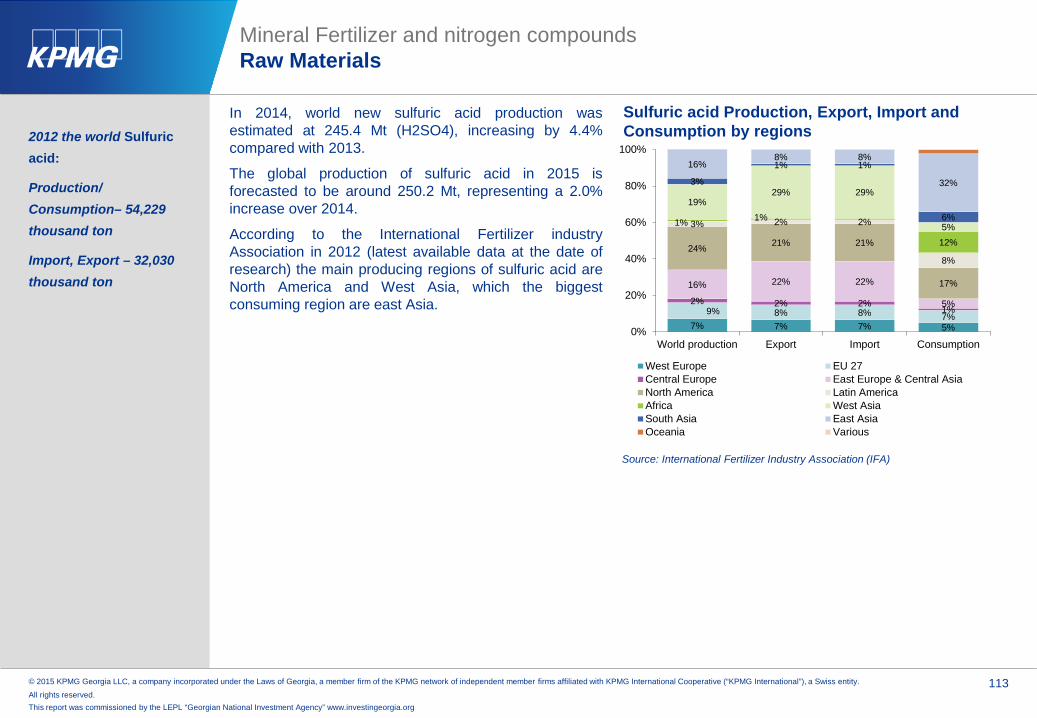
© 2015 KPMG Georgia LLC, a company incorporated under the Laws of Georgia, a member firm of the KPMG network of independent member firms affiliated with KPMG International Cooperative (“KPMG International”), a Swiss entity.
All rights reserved. 113
This report was commissioned by the LEPL “Georgian National Investment Agency” www.investingeorgia.org
In 2014, world new sulfuric acid production wasestimated at 245.4 Mt (H2SO4), increasing by 4.4%compared with 2013.
The global production of sulfuric acid in 2015 isforecasted to be around 250.2 Mt, representing a 2.0%increase over 2014.
According to the International Fertilizer industryAssociation in 2012 (latest available data at the date ofresearch) the main producing regions of sulfuric acid areNorth America and West Asia, which the biggestconsuming region are east Asia.
2012 the world Sulfuric acid:
Production/Consumption– 54,229 thousand ton
Import, Export – 32,030 thousand ton
Mineral Fertilizer and nitrogen compoundsRaw Materials
Sulfuric acid Production, Export, Import and Consumption by regions
7% 7% 7% 5%
9% 8% 8% 7%
2% 2% 2%1%
16% 22% 22%
5%
24% 21% 21%
17%
3% 2% 2%
8%
1% 1%
12%
19%29% 29%
5%
3%
1% 1%
6%
16%8% 8%
32%
0%
20%
40%
60%
80%
100%
World production Export Import Consumption
West Europe EU 27Central Europe East Europe & Central AsiaNorth America Latin AmericaAfrica West AsiaSouth Asia East AsiaOceania Various
Source: International Fertilizer Industry Association (IFA)
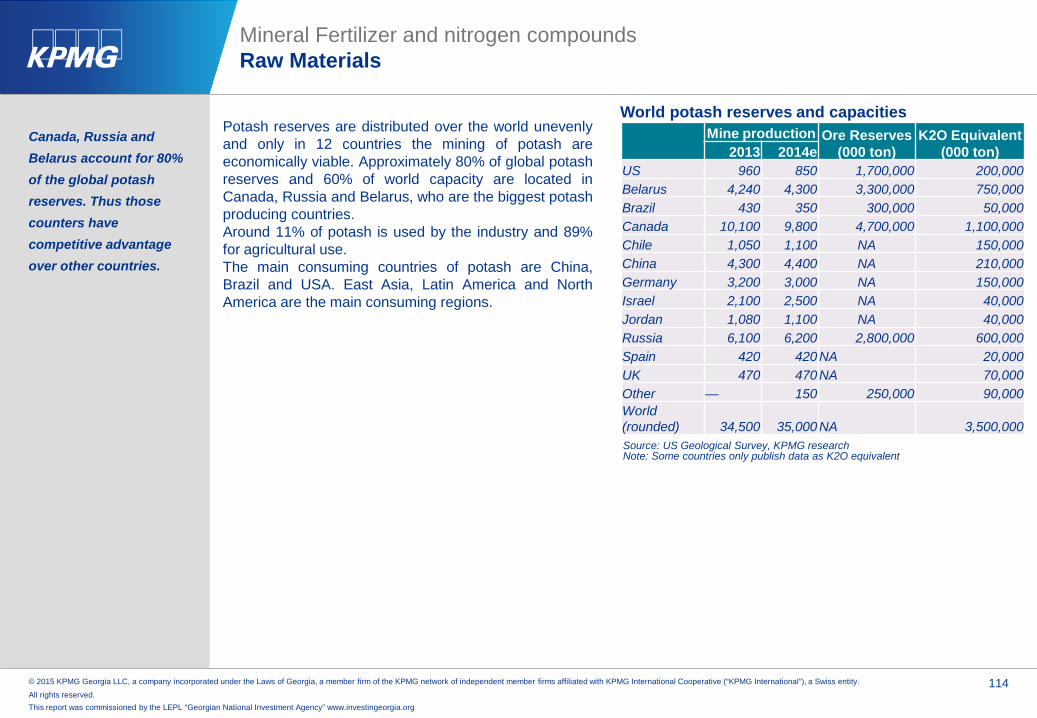
© 2015 KPMG Georgia LLC, a company incorporated under the Laws of Georgia, a member firm of the KPMG network of independent member firms affiliated with KPMG International Cooperative (“KPMG International”), a Swiss entity.
All rights reserved. 114
This report was commissioned by the LEPL “Georgian National Investment Agency” www.investingeorgia.org
Canada, Russia and Belarus account for 80% of the global potash reserves. Thus those counters have competitive advantage over other countries.
Mineral Fertilizer and nitrogen compoundsRaw Materials
Potash reserves are distributed over the world unevenlyand only in 12 countries the mining of potash areeconomically viable. Approximately 80% of global potashreserves and 60% of world capacity are located inCanada, Russia and Belarus, who are the biggest potashproducing countries.Around 11% of potash is used by the industry and 89%for agricultural use.The main consuming countries of potash are China,Brazil and USA. East Asia, Latin America and NorthAmerica are the main consuming regions.
World potash reserves and capacitiesMine production Ore Reserves
(000 ton)K2O Equivalent
(000 ton)2013 2014eUS 960 850 1,700,000 200,000Belarus 4,240 4,300 3,300,000 750,000Brazil 430 350 300,000 50,000Canada 10,100 9,800 4,700,000 1,100,000Chile 1,050 1,100 NA 150,000China 4,300 4,400 NA 210,000Germany 3,200 3,000 NA 150,000Israel 2,100 2,500 NA 40,000Jordan 1,080 1,100 NA 40,000Russia 6,100 6,200 2,800,000 600,000Spain 420 420 NA 20,000UK 470 470 NA 70,000Other — 150 250,000 90,000World (rounded) 34,500 35,000 NA 3,500,000Source: US Geological Survey, KPMG researchNote: Some countries only publish data as K2O equivalent

© 2015 KPMG Georgia LLC, a company incorporated under the Laws of Georgia, a member firm of the KPMG network of independent member firms affiliated with KPMG International Cooperative (“KPMG International”), a Swiss entity.
All rights reserved. 115
This report was commissioned by the LEPL “Georgian National Investment Agency” www.investingeorgia.org
Natural gas is distributed from producers or gas marketers tocustomers via networks of pipelines. Raw natural gas is amixture of methane, ethane, propane, butane, and otherhydrocarbons, along with various contaminants such asnitrogen compounds, sulfur compounds, and water.Processed natural gas is mainly methane.
According to BP's 2014 Statistical Review of World Energythe world exports of natural gas totals more than 1 trillioncubic meters, about 30 percent of production.
In 2013 the top natural gas producing countries were USA,Russia, Qatar, Iran, Canada. The top importer countrieswere Japan, Germany, Italy, Republic of Korea and China.
Nitrogen fertilizers can also be produced using coal.Historically, natural gas based producers have enjoyed aprice advantage over the coal based producers howeverrising natural gas prices and an improvement in technologyenabling the use of cheaper coal as feedstock has beeneroding that advantage.
According to the BP Statistical Review of World Energy thetop three countries with most coal reserves are USA, Russiaand China together accounting for about 57% of world coalreserves in 2013.
In 2013 the top exporter countries of coal were India,Australia, Russia, USA and Columbia. The top importercountries of coal were China, Japan, India, Republic ofKorea and Taiwan.
Around 80% of the production costs of ammonia goes for natural gas cost, thus availability of natural gas reserves in the country is a decisive factor for nitrogen based fertilizers production.
Using coal may be alternative to the natural gas.
In China 70% of the urea is produced from coal. However natural gas based producers has price advantage.
Mineral Fertilizer and nitrogen compoundsRaw Materials
19.8%
19.3%
4.6%4.6%4.5%3.3%
3.1%2.5%
2.4%2.3%
33.6%
USA
Russia
Qatar
Iran
Canada
China
Norway
Netherlands
Saud Arabia
Algeria
Other
26.6%
17.6%
12.8%
8.6%
6.8%
4.5%
3.8%
3.8%
15.5%
USD
Russia
Chain
Australia
India
Germany
Ukraine
Kazakhstan
Other
Source: International Energy Agency
Natural Gas Producer Countries, 2013
Top Countries with Coal Reserves, 2013
Source: BP Statistical Review of World Energy, June 2014
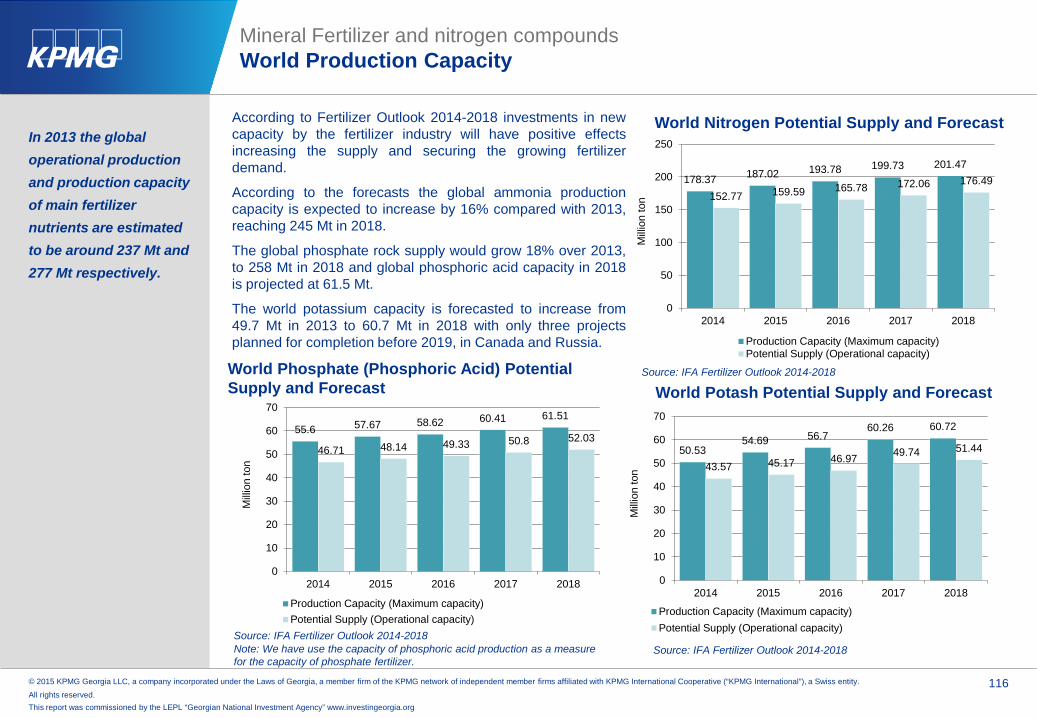
© 2015 KPMG Georgia LLC, a company incorporated under the Laws of Georgia, a member firm of the KPMG network of independent member firms affiliated with KPMG International Cooperative (“KPMG International”), a Swiss entity.
All rights reserved. 116
This report was commissioned by the LEPL “Georgian National Investment Agency” www.investingeorgia.org
55.6 57.67 58.62 60.41 61.51
46.71 48.14 49.33 50.8 52.03
0
10
20
30
40
50
60
70
2014 2015 2016 2017 2018
Mill
ion
ton
Production Capacity (Maximum capacity)Potential Supply (Operational capacity)
According to Fertilizer Outlook 2014-2018 investments in newcapacity by the fertilizer industry will have positive effectsincreasing the supply and securing the growing fertilizerdemand.
According to the forecasts the global ammonia productioncapacity is expected to increase by 16% compared with 2013,reaching 245 Mt in 2018.
The global phosphate rock supply would grow 18% over 2013,to 258 Mt in 2018 and global phosphoric acid capacity in 2018is projected at 61.5 Mt.
The world potassium capacity is forecasted to increase from49.7 Mt in 2013 to 60.7 Mt in 2018 with only three projectsplanned for completion before 2019, in Canada and Russia.
In 2013 the global operational production and production capacity of main fertilizer nutrients are estimated to be around 237 Mt and 277 Mt respectively.
Mineral Fertilizer and nitrogen compoundsWorld Production Capacity
Source: IFA Fertilizer Outlook 2014-2018
178.37 187.02 193.78 199.73 201.47
152.77 159.59 165.78 172.06 176.49
0
50
100
150
200
250
2014 2015 2016 2017 2018
Mill
ion
ton
Production Capacity (Maximum capacity)Potential Supply (Operational capacity)
50.5354.69 56.7
60.26 60.72
43.57 45.17 46.97 49.74 51.44
0
10
20
30
40
50
60
70
2014 2015 2016 2017 2018
Mill
ion
ton
Production Capacity (Maximum capacity)Potential Supply (Operational capacity)
World Nitrogen Potential Supply and Forecast
World Phosphate (Phosphoric Acid) Potential Supply and Forecast World Potash Potential Supply and Forecast
Source: IFA Fertilizer Outlook 2014-2018
Source: IFA Fertilizer Outlook 2014-2018
Note: We have use the capacity of phosphoric acid production as a measure for the capacity of phosphate fertilizer.

© 2015 KPMG Georgia LLC, a company incorporated under the Laws of Georgia, a member firm of the KPMG network of independent member firms affiliated with KPMG International Cooperative (“KPMG International”), a Swiss entity.
All rights reserved. 117
This report was commissioned by the LEPL “Georgian National Investment Agency” www.investingeorgia.org
Natural gas is the most important feedstockin ammonia production thus for nitrogenfertilizer production. Natural gas is makingup approximately 75-80% of cash cost ofammonia production. According toestimates a USD 1/MMBtu increase innatural gas increase the cost ofmanufacturing of ammonia by around USD33.
On the other hand for instance in China70% of the urea is produced from coal andonly 30% is produced using natural gas.
As the natural gas is the main inpute in the production of ammonia and other nitrogen fertilizers the production costs in different countries are directly affected by the natural gas (coal for china producers) prices in the regions. For instance European producers of nitrogen fertilizers historically have higher cost due to rare natural gas reserves in the region and high prices.
Mineral Fertilizer and nitrogen compoundsStructure of production costs – Nitrogen fertilizer
Ammonia production cash cost modelling
Urea production cash cost modelling
Natural Gas price x Gas Consumption (36 mmbtu/.mt ammonia)
Gas cost (70-80%) + other production costs (30-20%)
Total cash cost
Ammonia price x Ammonia use (0.58mt ammonia/mt urea)
Ammonia cost (70%) +Process Gas Cost (20%) +
other production costs (10%)
Total cash cost
Source: Yara, Macquarie Research, KPMG Research
Coal55%
Electricity25%
Depreciation8%
Labour4%
Others8%
Average cost breakdown of China thermal coal based urea producers
Source: Macquarie Research: China fertilizer sector, KPMG research

© 2015 KPMG Georgia LLC, a company incorporated under the Laws of Georgia, a member firm of the KPMG network of independent member firms affiliated with KPMG International Cooperative (“KPMG International”), a Swiss entity.
All rights reserved. 118
This report was commissioned by the LEPL “Georgian National Investment Agency” www.investingeorgia.org
Phosphate rock production costsdepends on factors such as orethickness, consistency, continuity, depthand concentration.
Phosphoric acid input costs are primarilyimpacted by costs of phosphate rock andsulfur.
Solid phosphate fertilizers are furtherimpacted by the cost of ammonia.
Non-integrated producers of phosphatefertilizers (DAP, MAP, etc.) rely onimports or domestic purchases for theirrock supply and the production cost ofsuch producers is directly impacted byrock price. Approximately one third ofproducers are non - integrated andhistorically their production costs arehigher.
For example the estimated productioncost of DAP of Indian producers wholack local supply of phosphate rock andhave to import it is between USD 400-460 for one ton, while the estimatedproduction of US integrated producersmerely exceeds USD 300 for one ton1.
The major production cost drivers for phosphate fertilizers are prices of phosphate rock, sulfur and ammonia.
Mineral Fertilizer and nitrogen compoundsStructure of production costs – Phosphate fertilizer
Phosphate fertilizer cash costs for raw materials used
Source: Macquarie Research: Agrium Inc., Potash Corp., KPMG research and analysis
Phosphate rock price x use (3.6 tons)
1 ton Phosphoric Acid (100% P2O5)
Sulfuric Acid price x use (2.8 tons)
Phosphate rock price x use (1.51-1.9 tons)
1 ton DAP (46% P2O5)
Sulfur x use (0.44 tons)
Ammonia x use (0.22 tons)
Phosphate rock price x use (1.71-1.96 tons)
1 ton MAP (52% P2O5)
Sulfur x use (0.53 tons)
Ammonia x use (0.145 tons)
1.Argus, CRU and CIBC World Markets Inc.

© 2015 KPMG Georgia LLC, a company incorporated under the Laws of Georgia, a member firm of the KPMG network of independent member firms affiliated with KPMG International Cooperative (“KPMG International”), a Swiss entity.
All rights reserved. 119
This report was commissioned by the LEPL “Georgian National Investment Agency” www.investingeorgia.org
18%44% 42% 27%
42%23%
36%15% 22%
19%
44% 6%
19%
34%
25%
16%
14%24%
18%
14%
257
208 190
279
454
0
50
100
150
200
250
300
350
400
450
500
0
50
100
150
200
250
300
350
400
450
500
Rock(Morocco)
Rock+Ammonia(Saudi Arabia)
Rock+Ammonia +Cheap
sulphur source(PhosAgro)
Rock +ammonia(Mosaic)
India (Rock based)
US
DIntegration level
Rock costs
Sulphur costs
Ammonia costs
Conversion costs
Cash cost
As demonstrated above the structure of production cash cost and the total cash costs depends on the level of integrationof the specific producer. Cost structure also depends on the rock deposit quality (rock grade) and the expense related tomining of rock.
In certain level of prices low cost producers continue making profit while non-integrated high cost producers became lossmaking. Producers who are integrated into ammonia and sulfur make additional profit margins.
A Saudi Arabia-based metal and mining company Ma’aden is one of the lowest cost producers of phosphate fertilizer (DAP) due to its 100% integration to ammonia and phosphate rock mining.
Reason of high cost of Indian producers is lack of domestic raw materials and opportunity for vertical integration.
Mineral Fertilizer and nitrogen compoundsStructure of production costs – Phosphate fertilizer
Source: Cross Asset research; Global Fertilizer Sector, KPMG research and analysis
Phosphate fertilizer (DAP) cost structure in different level of integration

© 2015 KPMG Georgia LLC, a company incorporated under the Laws of Georgia, a member firm of the KPMG network of independent member firms affiliated with KPMG International Cooperative (“KPMG International”), a Swiss entity.
All rights reserved. 120
This report was commissioned by the LEPL “Georgian National Investment Agency” www.investingeorgia.org
6277
121 125 130145 146 151
170185
020406080
100120140160180200
Pot
ash
cash
cos
t (C
OG
S,U
SD
)/t
We have used the production cost structure of majorproducers to come up with average structure ofproduction cost of potash.
However cash cost of different producers very baseon several factors such as:
mine’s geology
• ore thickness
• consistency
• continuity
• depth and grade
Energy costs
Operational capacity
Degree of automation
Taxes
Labor
Environmental costs
For instance German K+S has relatively highproduction costs at relatively old mines in Germanyand higher environmental costs.
Russian Uralkali has low costs due to low energy,labor costs and scale of production.
PotashCorp operates in big scale (17% of globalpotash capacity in 2013) and is low cost producer.
Availability of economically viable potash rock reserves in the region is a decisive factor for potash cash cost level.
Mineral Fertilizer and nitrogen compoundsStructure of production costs - Potash
Source: MorganStanley:Potash S&D Update 2014, KPMG Research
8%
16%
8%
21%15%
32%
Royalties and othertax
Depreciation andamortization
Other
Supplies and Services
Energy
Labor
Potash production costs (integrated producers)
Cash cost of different producers of potashSource: KPMG research and analysis
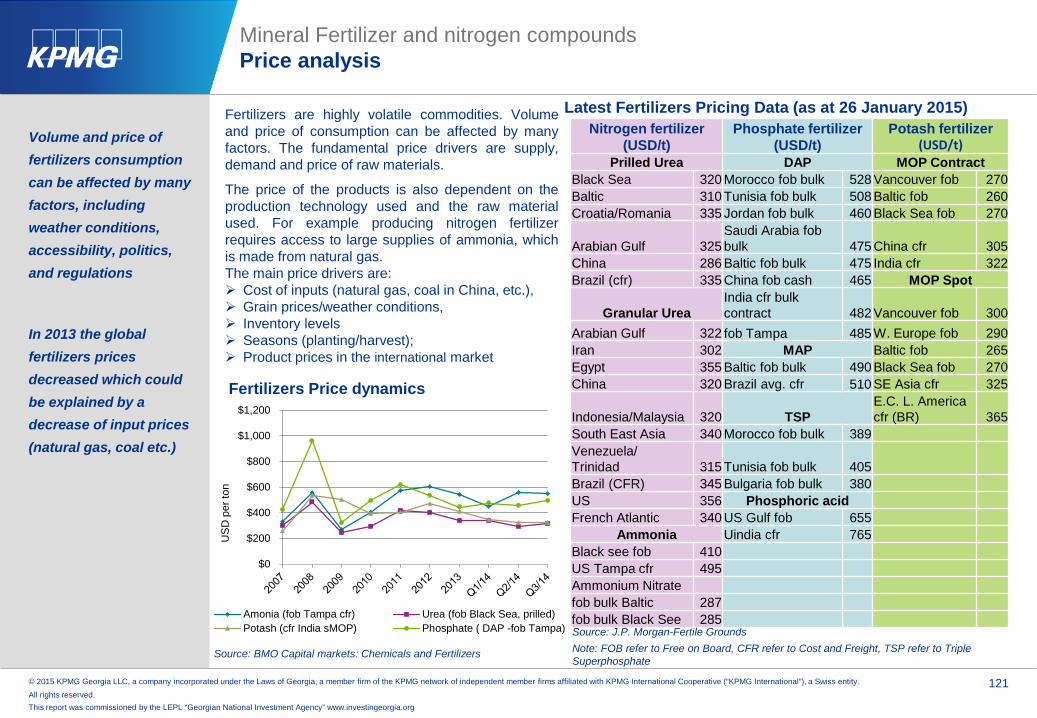
© 2015 KPMG Georgia LLC, a company incorporated under the Laws of Georgia, a member firm of the KPMG network of independent member firms affiliated with KPMG International Cooperative (“KPMG International”), a Swiss entity.
All rights reserved. 121
This report was commissioned by the LEPL “Georgian National Investment Agency” www.investingeorgia.org
Fertilizers are highly volatile commodities. Volumeand price of consumption can be affected by manyfactors. The fundamental price drivers are supply,demand and price of raw materials.
The price of the products is also dependent on theproduction technology used and the raw materialused. For example producing nitrogen fertilizerrequires access to large supplies of ammonia, whichis made from natural gas.The main price drivers are: Cost of inputs (natural gas, coal in China, etc.), Grain prices/weather conditions, Inventory levels Seasons (planting/harvest); Product prices in the international market
Volume and price of fertilizers consumption can be affected by many factors, including weather conditions, accessibility, politics, and regulations
In 2013 the global fertilizers prices decreased which could be explained by a decrease of input prices (natural gas, coal etc.)
Mineral Fertilizer and nitrogen compoundsPrice analysis
Latest Fertilizers Pricing Data (as at 26 January 2015)Nitrogen fertilizer
(USD/t)Phosphate fertilizer
(USD/t)Potash fertilizer
(USD/t)Prilled Urea DAP MOP Contract
Black Sea 320 Morocco fob bulk 528 Vancouver fob 270Baltic 310 Tunisia fob bulk 508 Baltic fob 260Croatia/Romania 335 Jordan fob bulk 460 Black Sea fob 270
Arabian Gulf 325Saudi Arabia fob bulk 475 China cfr 305
China 286 Baltic fob bulk 475 India cfr 322Brazil (cfr) 335 China fob cash 465 MOP Spot
Granular UreaIndia cfr bulk contract 482 Vancouver fob 300
Arabian Gulf 322 fob Tampa 485 W. Europe fob 290Iran 302 MAP Baltic fob 265Egypt 355 Baltic fob bulk 490 Black Sea fob 270China 320 Brazil avg. cfr 510 SE Asia cfr 325
Indonesia/Malaysia 320 TSPE.C. L. America cfr (BR) 365
South East Asia 340 Morocco fob bulk 389Venezuela/Trinidad 315 Tunisia fob bulk 405Brazil (CFR) 345 Bulgaria fob bulk 380US 356 Phosphoric acidFrench Atlantic 340 US Gulf fob 655
Ammonia Uindia cfr 765Black see fob 410US Tampa cfr 495Ammonium Nitratefob bulk Baltic 287fob bulk Black See 285Source: J.P. Morgan-Fertile GroundsNote: FOB refer to Free on Board, CFR refer to Cost and Freight, TSP refer to Triple Superphosphate
$0
$200
$400
$600
$800
$1,000
$1,200
US
D p
er to
n
Amonia (fob Tampa cfr) Urea (fob Black Sea, prilled)Potash (cfr India sMOP) Phosphate ( DAP -fob Tampa)
Fertilizers Price dynamics
Source: BMO Capital markets: Chemicals and Fertilizers
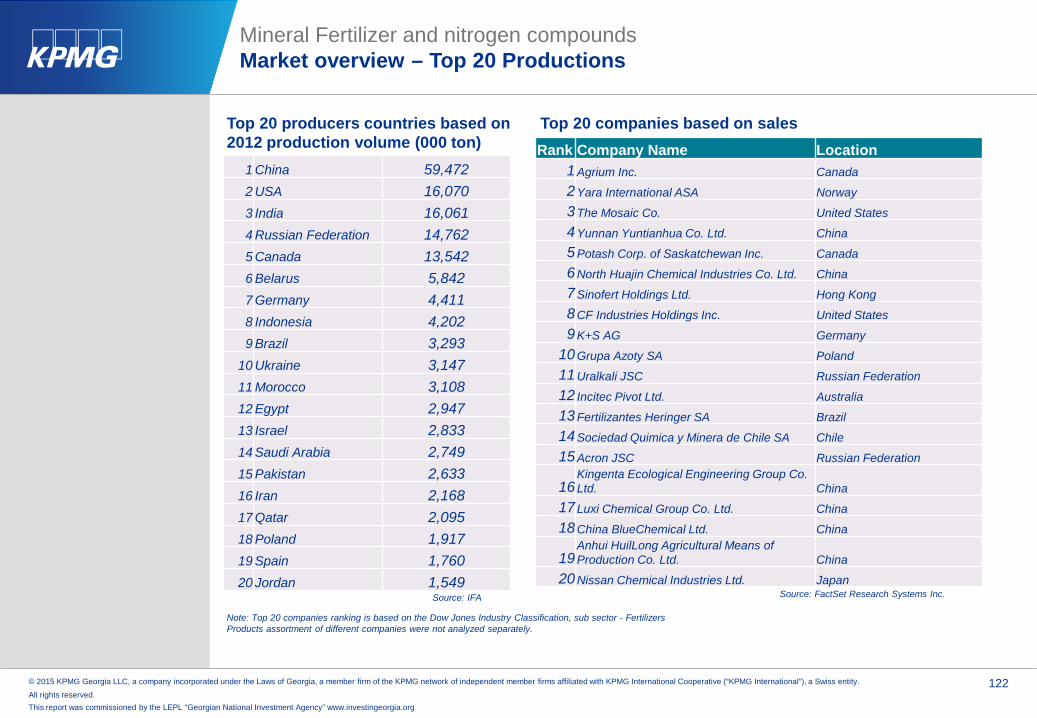
© 2015 KPMG Georgia LLC, a company incorporated under the Laws of Georgia, a member firm of the KPMG network of independent member firms affiliated with KPMG International Cooperative (“KPMG International”), a Swiss entity.
All rights reserved. 122
This report was commissioned by the LEPL “Georgian National Investment Agency” www.investingeorgia.org
Mineral Fertilizer and nitrogen compoundsMarket overview – Top 20 Productions
Source: FactSet Research Systems Inc.
1 China 59,472 2 USA 16,070 3 India 16,061 4 Russian Federation 14,762 5 Canada 13,542 6 Belarus 5,842 7 Germany 4,411 8 Indonesia 4,202 9 Brazil 3,293
10 Ukraine 3,147 11 Morocco 3,108 12 Egypt 2,947 13 Israel 2,833 14 Saudi Arabia 2,749 15 Pakistan 2,633 16 Iran 2,168 17 Qatar 2,095 18 Poland 1,917 19 Spain 1,760 20 Jordan 1,549
Top 20 producers countries based on 2012 production volume (000 ton)
Source: IFA
Top 20 companies based on salesRank Company Name Location
1 Agrium Inc. Canada2 Yara International ASA Norway3 The Mosaic Co. United States4 Yunnan Yuntianhua Co. Ltd. China5 Potash Corp. of Saskatchewan Inc. Canada6 North Huajin Chemical Industries Co. Ltd. China7 Sinofert Holdings Ltd. Hong Kong8 CF Industries Holdings Inc. United States9 K+S AG Germany
10 Grupa Azoty SA Poland11 Uralkali JSC Russian Federation12 Incitec Pivot Ltd. Australia13 Fertilizantes Heringer SA Brazil14 Sociedad Quimica y Minera de Chile SA Chile15 Acron JSC Russian Federation
16Kingenta Ecological Engineering Group Co. Ltd. China
17 Luxi Chemical Group Co. Ltd. China18 China BlueChemical Ltd. China
19Anhui HuilLong Agricultural Means of Production Co. Ltd. China
20 Nissan Chemical Industries Ltd. Japan
Note: Top 20 companies ranking is based on the Dow Jones Industry Classification, sub sector - FertilizersProducts assortment of different companies were not analyzed separately.

© 2015 KPMG Georgia LLC, a company incorporated under the Laws of Georgia, a member firm of the KPMG network of independent member firms affiliated with KPMG International Cooperative (“KPMG International”), a Swiss entity.
All rights reserved. 123
This report was commissioned by the LEPL “Georgian National Investment Agency” www.investingeorgia.org
Mineral Fertilizer and nitrogen compoundsMarket overview – Top 20 Importers and exporters
Source: ITC
Importers Exporters1 Ylem Energy Services Private Limited Ylem Energy Services Private Limited2 Univar Univar3 S3 Strategic Sourcing Solutions, S.L. S3 Strategic Sourcing Solutions, S.L.4 Cadilhac Boom Buying Pvt. Ltd.5 CRISTIAN GRUP S.R.L. Hansa International Reg. 2010 GmbH & Co. KG6 Compagnie de Produits Chimiques du Maroc Compagnie de Produits Chimiques du Maroc7 Deborel Maroc s.a.r.l. Deborel Maroc s.a.r.l.8 Eltachem Maroc s.a.r.l. IMPAG AG9 IMPAG AG Manuel Riesgo, S.A.
10 Islandwide Marketing Services (Pvt) LtdUNIUNEA NATIONALA A COOPERATIVELOR DE CONSUM
11 Marbar Chimie Qingdao FTZ United International Inc.12 Ets Sous-Traitance et de Commercialisation Africaine IBIS Chemie International13 Manuel Riesgo, S.A. Russtail Trade Company14 Pétrole du Maghreb Norbright Industry Co.,Ltd.15 Comptoir Agricole du Souss WORLD SERVICE CASH AND CARRY, Srl16 Covirep D.R. Dyechem (India) Pvt. Ltd.17 Polycrom Industrial Fine Chemicals (Pvt) Ltd Levantina De Graneles S.L.18 Consortium Marocain s.a.r.l. Brenntag Química, S.A.19 Univar AG Innochem NV20 D.R. Dyechem (India) Pvt. Ltd. AGRISAB, s.r.o.
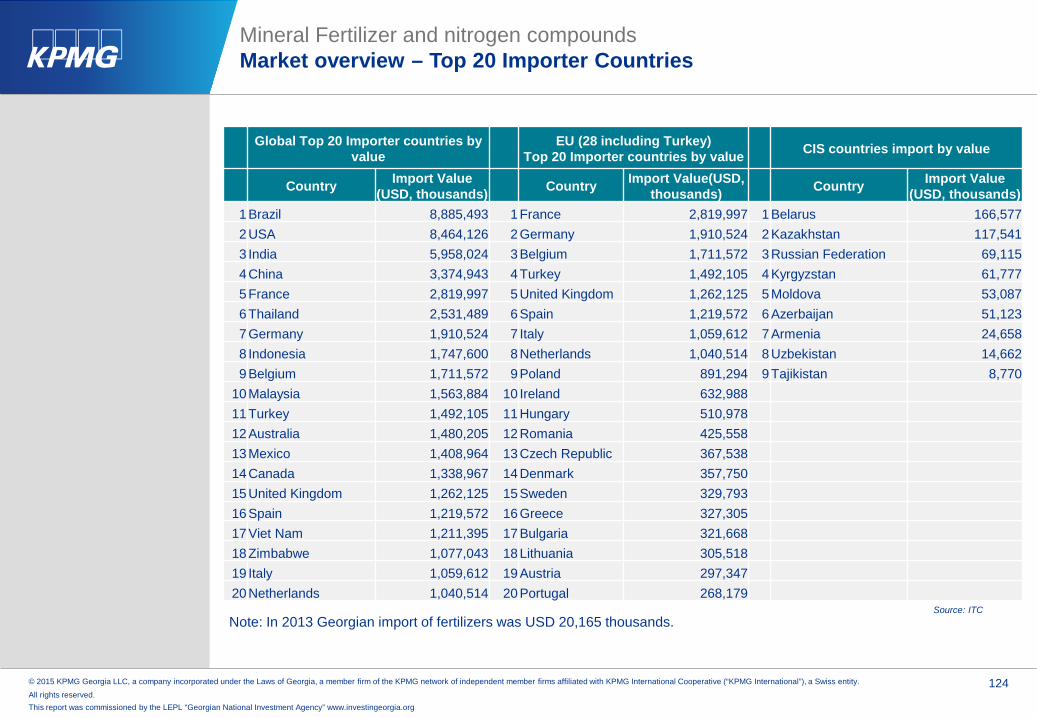
© 2015 KPMG Georgia LLC, a company incorporated under the Laws of Georgia, a member firm of the KPMG network of independent member firms affiliated with KPMG International Cooperative (“KPMG International”), a Swiss entity.
All rights reserved. 124
This report was commissioned by the LEPL “Georgian National Investment Agency” www.investingeorgia.org
Mineral Fertilizer and nitrogen compoundsMarket overview – Top 20 Importer Countries
Global Top 20 Importer countries by value
EU (28 including Turkey)Top 20 Importer countries by value CIS countries import by value
Country Import Value (USD, thousands) Country Import Value(USD,
thousands) Country Import Value (USD, thousands)
1 Brazil 8,885,493 1 France 2,819,997 1 Belarus 166,5772 USA 8,464,126 2 Germany 1,910,524 2 Kazakhstan 117,5413 India 5,958,024 3 Belgium 1,711,572 3 Russian Federation 69,1154 China 3,374,943 4 Turkey 1,492,105 4 Kyrgyzstan 61,7775 France 2,819,997 5 United Kingdom 1,262,125 5 Moldova 53,0876 Thailand 2,531,489 6 Spain 1,219,572 6 Azerbaijan 51,1237 Germany 1,910,524 7 Italy 1,059,612 7 Armenia 24,6588 Indonesia 1,747,600 8 Netherlands 1,040,514 8 Uzbekistan 14,6629 Belgium 1,711,572 9 Poland 891,294 9 Tajikistan 8,770
10 Malaysia 1,563,884 10 Ireland 632,98811 Turkey 1,492,105 11 Hungary 510,97812 Australia 1,480,205 12 Romania 425,55813 Mexico 1,408,964 13 Czech Republic 367,53814 Canada 1,338,967 14 Denmark 357,75015 United Kingdom 1,262,125 15 Sweden 329,79316 Spain 1,219,572 16 Greece 327,30517 Viet Nam 1,211,395 17 Bulgaria 321,66818 Zimbabwe 1,077,043 18 Lithuania 305,51819 Italy 1,059,612 19 Austria 297,34720 Netherlands 1,040,514 20 Portugal 268,179
Source: ITCNote: In 2013 Georgian import of fertilizers was USD 20,165 thousands.

© 2015 KPMG Georgia LLC, a company incorporated under the Laws of Georgia, a member firm of the KPMG network of independent member firms affiliated with KPMG International Cooperative (“KPMG International”), a Swiss entity.
All rights reserved. 125
This report was commissioned by the LEPL “Georgian National Investment Agency” www.investingeorgia.org
Mineral Fertilizer and nitrogen compoundsMarket overview – Top 20 Exporter Countries
Global Top 20 Exporter countries by value
EU (28 including Turkey)Top 20 Exporter countries by value CIS countries Exporter by value
Country Export Value (USD, thousands) Country Export Value
(USD, thousands) Country Export Value (USD, thousands)
1 Russian Federation 9,121,229 1 Belgium 2,970,849 1 Russian Federation 9,121,2292 Canada 6,605,323 2 Netherlands 2,921,102 2 Belarus 2,464,1293 China 6,252,535 3 Germany 2,873,925 3 Uzbekistan 194,3724 USA 5,006,815 4 Lithuania 1,061,741 4 Kazakhstan 62,2285 Belgium 2,970,849 5 Spain 1,023,127 5 Kyrgyzstan 4,7896 Netherlands 2,921,102 6 Poland 758,167 6 Armenia 1,3067 Germany 2,873,925 7 Italy 540,569 7 Azerbaijan 3548 Belarus 2,464,129 8 Romania 499,107 8 Moldova 109 Qatar 2,191,581 9 France 477,921 9 Tajikistan 0
10 Morocco 1,938,895 10 Finland 475,41211 Israel 1,729,683 11 Austria 429,96312 Egypt 1,185,767 12 United Kingdom 367,49913 Ukraine 1,171,091 13 Slovakia 347,25214 Lithuania 1,061,741 14 Croatia 310,04915 Saudi Arabia 1,037,929 15 Bulgaria 226,07616 Spain 1,023,127 16 Portugal 190,38817 Oman 905,985 17 Sweden 176,22018 Jordan 896,018 18 Hungary 162,93319 Chile 852,759 19 Czech Republic 161,67920 Iran 827,578 20 Greece 161,677
Source: ITCNote: In 2013 Georgian export of fertilizers was USD 130,661 thousands.

© 2015 KPMG Georgia LLC, a company incorporated under the Laws of Georgia, a member firm of the KPMG network of independent member firms affiliated with KPMG International Cooperative (“KPMG International”), a Swiss entity.
All rights reserved. 126
This report was commissioned by the LEPL “Georgian National Investment Agency” www.investingeorgia.org
4.22
7.91
13.03
20.17 20.78
43.0%
87.6%
64.6%54.8%
3.1%
0%10%20%30%40%50%60%70%80%90%100%
0
5
10
15
20
25
2010 2011 2012 2013 2014
Mill
ion
US
D
Fertilizer Import Import Growth rate
Fertilizer importer structure by countries, 2014
In 2014 the import of fertilizers in Georgia increasedby 3.1% and was USD 20.8 million. During 2010 –2014 the fertilizer import recorded 49% CAGR.
In 2014 Uzbekistan accounted for 31% of the totalimport of fertilizers to Georgia. Kazakhstan was thesecond largest exporter of fertilizers to Georgiaaccounting for 23% of the import.
In 2013 the mixture of nitrogen, phosphorous orpotassium fertilizers were the main type of fertilizersimported to Georgia accounting for 62% of the import.Nitrogen fertilizer was the second largest group ofimported fertilizers (31%).
In 2014 Georgia imported USD 20.8 million of fertilizes majority of which was mixture of nitrogen, phosphorous or potassium fertilizers.
Mineral Fertilizer and nitrogen compoundsGeorgia- Fertilizer import
Import of fertilizer in 2010 - 2014
Fertilizer import structure by product type in 2014Source: ITC
Source: ITC Source: ITC
31%
23%10%
9%
5%
4%
3%
3%
3%2%
7%
Uzbekistan
Kazakhstan
Italy
RussianFederationTurkey
Finland
Belarus
Armenia
Portugal
Greece
62%
31%
4%2%1%Mixtures of nitrogen,phosphorous or potassiumfertilizers
Nitrogen fertilizer
Other
Phosphate fertilizer
Potash fertilizer

© 2015 KPMG Georgia LLC, a company incorporated under the Laws of Georgia, a member firm of the KPMG network of independent member firms affiliated with KPMG International Cooperative (“KPMG International”), a Swiss entity.
All rights reserved. 127
This report was commissioned by the LEPL “Georgian National Investment Agency” www.investingeorgia.org
38%
23%
9%
7%
7%
3%
3%3%
2% 2% 3%
Turkey
USA
Armenia
Bulgaria
Greece
Zimbabwe
France
Mozambique
Spain
Italy
Other
72.11
144.09137.33
130.66137.69
19.8%
99.8%
-4.7% -4.9%5.4%
-20%
0%
20%
40%
60%
80%
100%
120%
0
20
40
60
80
100
120
140
160
2010 2011 2012 2013 2014
Mill
ion
US
D
Fertilizer Export Export Growth rate
Fertilizer export structure by countries, 2014
In 2014 the export of fertilizers from Georgiaincreased by 5.4% and was USD 137.7 million.During the 2010 – 2014 the fertilizer export recorded17.6% CAGR.
In 2014 the largest export country for Georgiafertilizers was Turkey. It accounted for 38% ofGeorgia’s export. The second largest destination ofexport for Georgian fertilizers was USA accountingfor 23% of the export, followed by Armenia andBulgaria accounting for 9% and 7% respectively.
In 2014 Georgia export of fertilizers included mainlynitrogen based fertilizers (99.9% of fertilizersexport).
In 2014 Georgia exported USD 137.7 million of fertilizes.
Georgia exports mainly nitrogen fertilizer.
Mineral Fertilizer and nitrogen compoundsGeorgia- Fertilizer export
Export of fertilizer in 2010 - 2014
Source: ITC
Source: ITC
Nitrogen fertilizer 99.95%
Other0.05%
Fertilizer Export structure by product type in 2014
Source: ITC
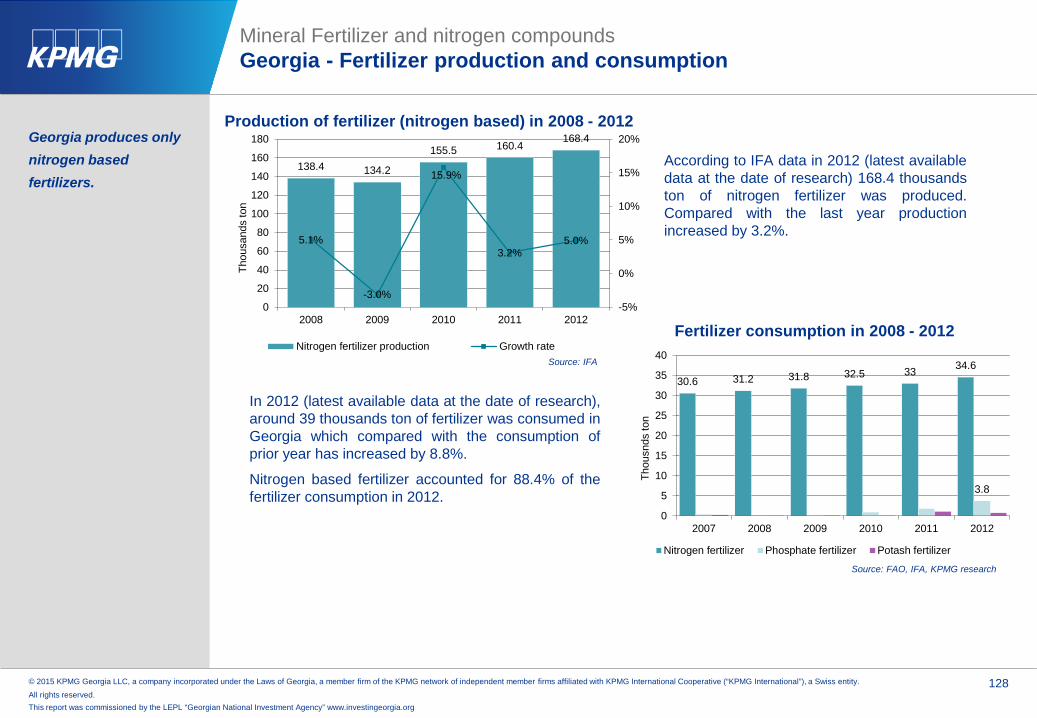
© 2015 KPMG Georgia LLC, a company incorporated under the Laws of Georgia, a member firm of the KPMG network of independent member firms affiliated with KPMG International Cooperative (“KPMG International”), a Swiss entity.
All rights reserved. 128
This report was commissioned by the LEPL “Georgian National Investment Agency” www.investingeorgia.org
In 2012 (latest available data at the date of research),around 39 thousands ton of fertilizer was consumed inGeorgia which compared with the consumption ofprior year has increased by 8.8%.
Nitrogen based fertilizer accounted for 88.4% of thefertilizer consumption in 2012.
Georgia produces only nitrogen based fertilizers.
Mineral Fertilizer and nitrogen compoundsGeorgia - Fertilizer production and consumption
Fertilizer consumption in 2008 - 2012
Source: FAO, IFA, KPMG research
30.6 31.2 31.8 32.5 33 34.6
3.8
0
5
10
15
20
25
30
35
40
2007 2008 2009 2010 2011 2012
Thou
snds
ton
Nitrogen fertilizer Phosphate fertilizer Potash fertilizer
138.4 134.2
155.5 160.4168.4
5.1%
-3.0%
15.9%
3.2%5.0%
-5%
0%
5%
10%
15%
20%
0
20
40
60
80
100
120
140
160
180
2008 2009 2010 2011 2012
Thou
sand
s to
n
Nitrogen fertilizer production Growth rate
Production of fertilizer (nitrogen based) in 2008 - 2012
According to IFA data in 2012 (latest availabledata at the date of research) 168.4 thousandston of nitrogen fertilizer was produced.Compared with the last year productionincreased by 3.2%.
Source: IFA

© 2015 KPMG Georgia LLC, a company incorporated under the Laws of Georgia, a member firm of the KPMG network of independent member firms affiliated with KPMG International Cooperative (“KPMG International”), a Swiss entity.
All rights reserved. 129
This report was commissioned by the LEPL “Georgian National Investment Agency” www.investingeorgia.org
51%
38%
4%2%1%1% 3%
Georgia
Iran
Netherlands
Italy
Uzbekistan
Belarus
Other
13.6211.61
15.27
25.09 24.66
106.8%
-14.8%
31.5%
64.3%
-1.7%
-40%
-20%
0%
20%
40%
60%
80%
100%
120%
0
5
10
15
20
25
30
2009 2010 2011 2012 2013
Mill
ion
US
D
Fertilizer Import Import Growth rate
Fertilizer importer structure by countries, 2013
88%
5%5% 2%0%
Nitrogen fertilizer
Mixtures of nitrogen,phosphorous orpotassium fertilizers
Other
Phosphate fertilizer
Potash fertilizer
In 2013 the import of fertilizers in Armenia decreasedby 1.7% and was USD 24.7 million. During the 2009 –2013 the fertilizer import recorded 16% CARG.
In 2013 Georgia accounted for the 51% of the totalimport of fertilizers to Armenia. Second largest tradepartner from the perspective of fertilizers internationaltrade was Iran accounting for 38%.
In 2013 Nitrogen based fertilizers was the main typeof fertilizer imported to Armenia. It accounted for 88%of the import of fertilizers.
In 2013 Armenia imported USD 24.7 million of fertilizes majority of which were nitrogen based fertilizers.
Mineral Fertilizer and nitrogen compoundsArmenia - Fertilizer import
Import of fertilizer in 2009 - 2013
Fertilizer import structure by product type in 2013
Source: ITC
Source: ITC Source: ITC

© 2015 KPMG Georgia LLC, a company incorporated under the Laws of Georgia, a member firm of the KPMG network of independent member firms affiliated with KPMG International Cooperative (“KPMG International”), a Swiss entity.
All rights reserved. 130
This report was commissioned by the LEPL “Georgian National Investment Agency” www.investingeorgia.org
0.10 0.04
0.62
1.02
1.31
0
0.2
0.4
0.6
0.8
1
1.2
1.4
2009 2010 2011 2012 2013
Mill
ion
US
D
Fertilizer Export
According to IFA data in 2012 (latest available data atthe date of research), there was no production ofNitrogen, phosphate or potash based fertilizer inArmenia. In 2011 8 thousand of nitrogen basedfertilizer was produced in the country.
In 2013 the export of fertilizers from Armeniaincreased by 28.5% and was USD 1.3 millionexported mainly to Georgia.
According to FAO data in 2012 around 15 thousandston of fertilized was consumed in Armenia. Comparedwith 2011 the consumption has increased by 22.9%.
Nitrogen based fertilized accounted for 95% of thefertilizer consumption in 2012.
Nitrogen based fertilized accounted for 95% of the fertilizer consumption. The total consumption of fertilizers in Armenia in 2012 was 15,113 ton
Mineral Fertilizer and nitrogen compoundsArmenia - Fertilizer export, production and consumption
Export of fertilizer in 2009 - 2013
Source: FAO Source: ITC
2008 2009 2010 2011 2012Nitrogen fertilizer 8,059 13,233 10,408 12,152 14,365Phosphate fertilizer 55 99 413 69 384Potash fertilizer 61 - 34 73 364
-
2,000
4,000
6,000
8,000
10,000
12,000
14,000
16,000
Ton
Nitrogen fertilizer Phosphate fertilizer Potash fertilizer
Fertilizer consumption in 2008 - 2012
7.28.9
15.2
8
002468
10121416
2008 2009 2010 2011 2012
Thou
snds
ton
Production of fertilizer (nitrogen based) in 2008 - 2012
Source: IFA

© 2015 KPMG Georgia LLC, a company incorporated under the Laws of Georgia, a member firm of the KPMG network of independent member firms affiliated with KPMG International Cooperative (“KPMG International”), a Swiss entity.
All rights reserved. 131
This report was commissioned by the LEPL “Georgian National Investment Agency” www.investingeorgia.org
Fertilizer importer structure by countries, 2013
In 2013 the import of fertilizers in Azerbaijan increasedby 6.2% compared with 2012 and reached USD 51.1million. During the 2009 – 2013 the fertilizer importrecorded 21.1% CAGR.
In 2013 Russia was the largest Azerbaijan exporter offertilizers. Russia accounted for 63% of Azerbaijanimport. Iran was the second largest importer toAzerbaijan with 17% share in total fertilizer import.
In 2013 Nitrogen based fertilizers was the main type offertilizer imported to Azerbaijan. It accounted for 58% ofthe import of fertilizers.
According to ITC data, there was no significant export offertilizers from Azerbaijan (only USA 354 thousands).
In 2013 Azerbaijan imported USD 51.1 million of fertilizes majority of which were nitrogen based fertilizers.
Mineral Fertilizer and nitrogen compoundsAzerbaijan- Fertilizer import
Import of fertilizer in 2009 - 2013
Fertilizer import structure by product type in 2013
Source: ITC
Source: ITC Source: ITC
23.7920.05
39.12
48.1351.12
-63.5%
-15.7%
95.2%
23.0%6.2%
-80%-60%-40%-20%0%20%40%60%80%100%120%
0
10
20
30
40
50
60
2009 2010 2011 2012 2013
Mill
ion
US
D
Fertilizer Import Import Growth rate
63%
17%
3%
3%
3%2%
2%2%1%1% 3%RussianFederationIran
Kazakhstan
Turkey
Georgia
Israel
Jordan
Netherlands
Belgium
Italy
58%26%
10%
5% 1%Nitrogen fertilizer
Mixtures of nitrogen,phosphorous or potassiumfertilizers
Phosphate fertilizer
Potash fertilizer
Other
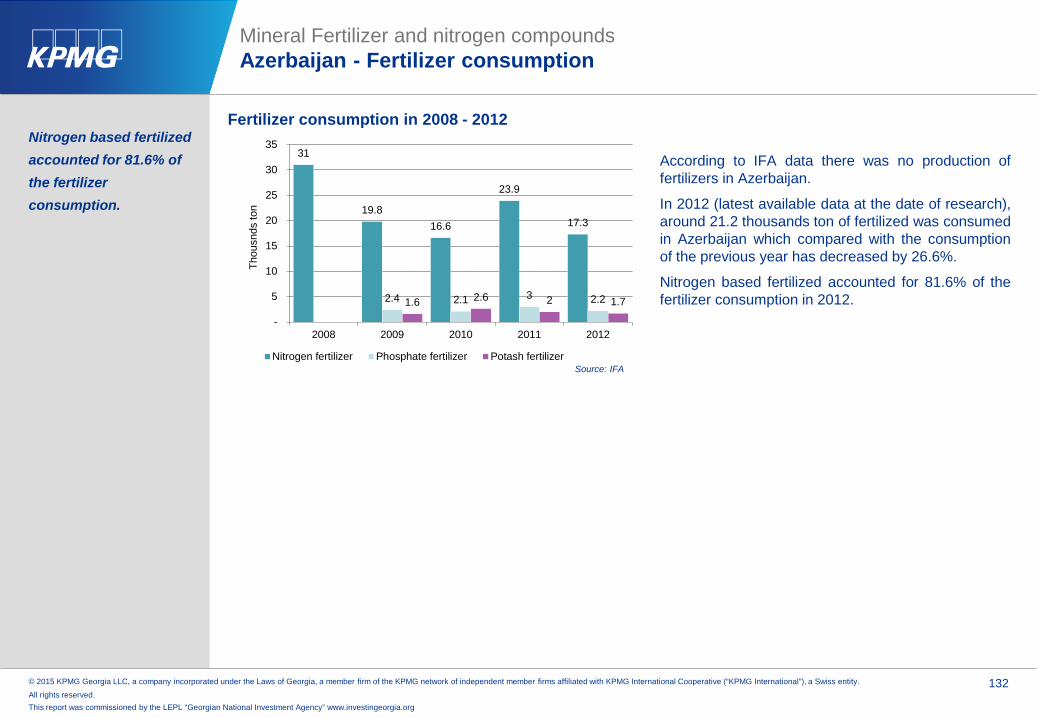
© 2015 KPMG Georgia LLC, a company incorporated under the Laws of Georgia, a member firm of the KPMG network of independent member firms affiliated with KPMG International Cooperative (“KPMG International”), a Swiss entity.
All rights reserved. 132
This report was commissioned by the LEPL “Georgian National Investment Agency” www.investingeorgia.org
According to IFA data there was no production offertilizers in Azerbaijan.
In 2012 (latest available data at the date of research),around 21.2 thousands ton of fertilized was consumedin Azerbaijan which compared with the consumptionof the previous year has decreased by 26.6%.
Nitrogen based fertilized accounted for 81.6% of thefertilizer consumption in 2012.
Nitrogen based fertilized accounted for 81.6% of the fertilizer consumption.
Mineral Fertilizer and nitrogen compoundsAzerbaijan - Fertilizer consumption
Fertilizer consumption in 2008 - 2012
Source: IFA
31
19.816.6
23.9
17.3
2.4 2.1 3 2.21.6 2.6 2 1.7
-
5
10
15
20
25
30
35
2008 2009 2010 2011 2012
Thou
snds
ton
Nitrogen fertilizer Phosphate fertilizer Potash fertilizer

© 2015 KPMG Georgia LLC, a company incorporated under the Laws of Georgia, a member firm of the KPMG network of independent member firms affiliated with KPMG International Cooperative (“KPMG International”), a Swiss entity.
All rights reserved. 133
This report was commissioned by the LEPL “Georgian National Investment Agency” www.investingeorgia.org
257.3
417.7
726.7
780.4816.2
-57.4%
62.3%74.0%
7.4% 4.6%
-80%
-60%
-40%
-20%
0%
20%
40%
60%
80%
100%
0
100
200
300
400
500
600
700
800
900
2009 2010 2011 2012 2013
Mill
ion
US
D
Fertilizer Import Import Growth rate
Fertilizer importer structure by countries, 2013
In 2013 the import of fertilizers in Ukraine increasedby 4.6% and reached USD 816 million. During the2009 – 2013 the fertilizer import recorded 33.5%CAGR.
In 2014 Russia accounted for 74% of the total importof fertilizers to Ukraine. Belarus was the secondlargest exporter of fertilizers to Ukraine accounting for18% of the import.
In 2013 the mixture of nitrogen, phosphorous orpotassium fertilizers were the main type of fertilizersimported to Ukraine. It accounted for 65% of theimport. Nitrogen fertilizer was the second largestgroup of imported fertilizers (26%).
In 2013 Ukraine imported USD 816million of fertilizers majority of which was mixture of nitrogen, phosphorous or potassium fertilizers.
Mineral Fertilizer and nitrogen compoundsUkraine - Fertilizer import
Import of fertilizer in 2009 - 2013
Fertilizer import structure by product type in 2013
Source: ITC
Source: ITC Source: ITC
74%
18%
1%1% 6%
RussianFederation
Belarus
Finland
Poland
Other65%
26%
9%
0.04% 0.04%
Mixtures of nitrogen,phosphorous orpotassium fertilizers
Nitrogen fertilizer
Potash fertilizer
Other
Phosphate fertilizer

© 2015 KPMG Georgia LLC, a company incorporated under the Laws of Georgia, a member firm of the KPMG network of independent member firms affiliated with KPMG International Cooperative (“KPMG International”), a Swiss entity.
All rights reserved. 134
This report was commissioned by the LEPL “Georgian National Investment Agency” www.investingeorgia.org
25%
9.1%
8.8%
7%7%4%
4%
3%
3%
2%
27%
Turkey
Brazil
Italy
Nigeria
Mexico
Côte d'Ivoire
India
Malaysia
Senegal
Morocco
Other97%
3%0%
Nitrogen fertilizer
Mixtures ofnitrogen,phosphorous orpotassium fertilizers
Other
Fertilizer export structure by countries in 2013
In 2013 the export of fertilizers from Ukrainedecreased by 34.4% and was USD 1,171 million. Thehighest level of the fertilizer export from Ukraine wasrecorded in 2011 when the export reached USD 1,820million.
In 2013 Turkey accounted for 25% of the Ukrainianexport of fertilizers. The second largest destination ofexport for Ukraine fertilizers was Brazil accounting for9.1% of the export, followed by Italy 8.8% respectively.
In 2014 Ukraine export of fertilizers included mainlynitrogen based fertilizers (97% of fertilizers export).
In 2013 Ukraine exported USD 1,171 million of fertilizers.
Ukraine exports mainly nitrogen fertilizer.
Mineral Fertilizer and nitrogen compoundsUkraine - Fertilizer export
Export of fertilizer in 2009 - 2013
Source: ITC
Source: ITC
Fertilizer Export structure by product type in 2013
Source: ITC
858 941
1,820 1,786
1,171
-57.0%
9.6%
93.4%
-1.8%
-34.4%
-80%-60%-40%-20%0%20%40%60%80%100%120%
0200400600800
1,0001,2001,4001,6001,8002,000
2009 2010 2011 2012 2013
Mill
ion
US
D
Fertilizer Export Export Growth rate

© 2015 KPMG Georgia LLC, a company incorporated under the Laws of Georgia, a member firm of the KPMG network of independent member firms affiliated with KPMG International Cooperative (“KPMG International”), a Swiss entity.
All rights reserved. 135
This report was commissioned by the LEPL “Georgian National Investment Agency” www.investingeorgia.org
2,816
2,154 2,312
2,985 3,040
127 25 77 97 107 -
500
1,000
1,500
2,000
2,500
3,000
3,500
2008 2009 2010 2011 2012
Thou
sand
s to
n
Nitrogen fertilizer Phosphate fertilizer
In 2012 (latest available data at the date ofresearch), the consumption of fertilizers inUkraine increased by 10% and reached 1,664thousands ton. Nitrogen based fertilizedaccounted for 75% of the fertilizer consumptionin 2012.
Ukraine produces mainly nitrogen based fertilizers.
Mineral Fertilizer and nitrogen compoundsUkraine - Fertilizer production and consumption
Fertilizer consumption in 2008 - 2012
Production of fertilizer (nitrogen based) in 2008 - 2012
According to IFA data in 2012 (latest availabledata at the date of research) the production offertilizers increased by 2.1% compared with theprevious year and reached 3,147 thousandston.
Nitrogen fertilizer accounted for 97% of totalfertilizer production volume in Ukraine.
Source: IFA
800 700 650
1,159 1,255
150 167 170 216 253 156 100 110 137 156
-
200
400
600
800
1,000
1,200
1,400
2008 2009 2010 2011 2012Th
ousa
nds
ton
Nitrogen fertilizer Phosphate fertilizer Potash fertilizer
Source: IFA

© 2015 KPMG Georgia LLC, a company incorporated under the Laws of Georgia, a member firm of the KPMG network of independent member firms affiliated with KPMG International Cooperative (“KPMG International”), a Swiss entity.
All rights reserved. 136
This report was commissioned by the LEPL “Georgian National Investment Agency” www.investingeorgia.org
1,057 1,017
1,374 1,3831,492
-28.7%
-3.8%
35.2%
0.6%7.9%
-40%
-30%
-20%
-10%
0%
10%
20%
30%
40%
0
200
400
600
800
1,000
1,200
1,400
1,600
2009 2010 2011 2012 2013
Mill
ion
US
D
Fertilizer Import Import Growth rate
Fertilizer importer structure by countries, 2013
In 2013 the import of fertilizers in Turkey increased by7.9% and reached USD 1,492 million. During the2009 – 2013 the fertilizer import recorded 9% CAGR.
In 2014 Ukraine accounted for 23% of the total importof fertilizers to Turkey. Russia was the second largestexporter of fertilizers to Turkey accounting for 22% ofthe import.
In 2013 nitrogen fertilizer were the main type offertilizers imported to Turkey. It accounted for 70% ofthe import. The mixture of nitrogen, phosphorous orpotassium fertilizers was the second largest group ofimported fertilizers (26%).
In 2013 Turkey imported USD 1,492 million of fertilizes majority of which was nitrogen fertilizer.
Mineral Fertilizer and nitrogen compoundsTurkey - Fertilizer import
Import of fertilizer in 2009 - 2013
Fertilizer import structure by product type in 2013
Source: ITC
Source: ITC Source: ITC
23%
22%
8%7%
5%
3%
3%
3%
3%
2%
21%Ukraine
RussianFederationEgypt
Tunisia
Romania
Croatia
Iran
Jordan
Greece
Belgium
Other
70%
26%
4%0%0% Nitrogen fertilizer
Mixtures of nitrogen,phosphorous orpotassium fertilizers
Potash fertilizer
Phosphate fertilizer
Other

© 2015 KPMG Georgia LLC, a company incorporated under the Laws of Georgia, a member firm of the KPMG network of independent member firms affiliated with KPMG International Cooperative (“KPMG International”), a Swiss entity.
All rights reserved. 137
This report was commissioned by the LEPL “Georgian National Investment Agency” www.investingeorgia.org
Fertilizer export structure by countries in 2013
In 2013 the export of fertilizers from Turkey decreasedby 33.4% and was USD 98.5 million. The highest levelof the fertilizer export from Turkey was registered in2010 when the export reached USD 205.6 million.
In 2013 Iraq accounted for 13.5% of the Turkey exportof fertilizers. The second largest destination of exportfor Turkey fertilizers was Greece accounting for 13.4%of the export, followed by Romania 12.1%respectively.
In 2014 the mixture of nitrogen, phosphorous orpotassium fertilizers accounted for 83% of Turkeyexport of fertilizers.
In 2013 Turkey exported USD 98.5 million of fertilizers.
Mineral Fertilizer and nitrogen compoundsTurkey - Fertilizer export
Export of fertilizer in 2009 - 2013
Source: ITC
Source: ITC
Fertilizer Export structure by product type in 2013
Source: ITC
83.68
205.59 200.60
147.83
98.51
-61.5%
145.7%
-2.4%-26.3% -33.4%
-100%
-50%
0%
50%
100%
150%
200%
0
50
100
150
200
250
2009 2010 2011 2012 2013
Mill
ion
US
D
Fertilizer Export Export Growth rate
13.5%
13.4%
12.1%
8.8%5.9%
4.3%4.1%
3.7%
2.7%
2.6%
28.8%
Iraq
Greece
Romania
Cyprus
Togo
Nigeria
Spain
Morocco
Syrian ArabRepublicLebanon
Other
83%
11%
4%
0.3%
2%
Mixtures of nitrogen,phosphorous orpotassium fertilizersNitrogen fertilizer
Potash fertilizer
Phosphate fertilizer
Other

© 2015 KPMG Georgia LLC, a company incorporated under the Laws of Georgia, a member firm of the KPMG network of independent member firms affiliated with KPMG International Cooperative (“KPMG International”), a Swiss entity.
All rights reserved. 138
This report was commissioned by the LEPL “Georgian National Investment Agency” www.investingeorgia.org
1,133
1,412 1,344 1,259
1,432
329
577 515 490 532
89 64 84 98 101
-
200
400
600
800
1,000
1,200
1,400
1,600
2008 2009 2010 2011 2012
Thou
sand
s to
n
Nitrogen fertilizer Phosphate fertilizer Potash fertilizer
In 2012 (latest available data at the date ofresearch), the consumption of fertilizers inUkraine increased by 10% and reached 2,065thousands ton. Nitrogen based fertilizedaccounted for 69% of the fertilizer consumptionin 2012.
In 2012 Turkey produce 1,410 thousands ton of fertilizer.
Mineral Fertilizer and nitrogen compoundsTurkey - Fertilizer production and consumption
Fertilizer consumption in 2008 - 2012
Production of fertilizer (nitrogen based) in 2008 - 2012
According to IFA data in 2012 (latest availabledata at the date of research) the production offertilizers increased by 3.2% compared with theprevious year and reached 1,410 thousandston.
Turkey mainly produce nitrogen based andphosphate based fertilizers. In 2012 the shareof nitrogen fertilizer was 64% of totalproduction.
Source: IFA
Source: IFA
518 557
747
929 905
306 375
481 437 505
- 100 200 300 400 500 600 700 800 900
1,000
2008 2009 2010 2011 2012
Thou
sand
s to
n
Nitrogen fertilizer Phosphate fertilizer
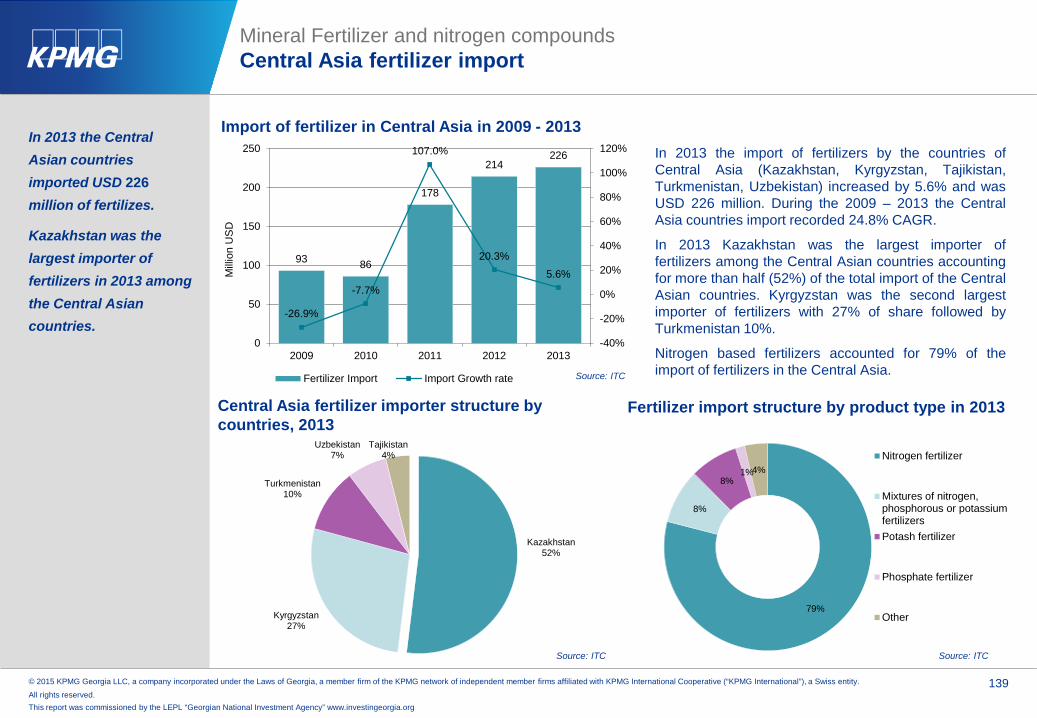
© 2015 KPMG Georgia LLC, a company incorporated under the Laws of Georgia, a member firm of the KPMG network of independent member firms affiliated with KPMG International Cooperative (“KPMG International”), a Swiss entity.
All rights reserved. 139
This report was commissioned by the LEPL “Georgian National Investment Agency” www.investingeorgia.org
93 86
178
214226
-26.9%
-7.7%
107.0%
20.3%
5.6%
-40%
-20%
0%
20%
40%
60%
80%
100%
120%
0
50
100
150
200
250
2009 2010 2011 2012 2013
Mill
ion
US
D
Fertilizer Import Import Growth rate
In 2013 the import of fertilizers by the countries ofCentral Asia (Kazakhstan, Kyrgyzstan, Tajikistan,Turkmenistan, Uzbekistan) increased by 5.6% and wasUSD 226 million. During the 2009 – 2013 the CentralAsia countries import recorded 24.8% CAGR.
In 2013 Kazakhstan was the largest importer offertilizers among the Central Asian countries accountingfor more than half (52%) of the total import of the CentralAsian countries. Kyrgyzstan was the second largestimporter of fertilizers with 27% of share followed byTurkmenistan 10%.
Nitrogen based fertilizers accounted for 79% of theimport of fertilizers in the Central Asia.
In 2013 the Central Asian countries imported USD 226 million of fertilizes.
Kazakhstan was the largest importer of fertilizers in 2013 among the Central Asian countries.
Mineral Fertilizer and nitrogen compoundsCentral Asia fertilizer import
Import of fertilizer in Central Asia in 2009 - 2013
Central Asia fertilizer importer structure by countries, 2013
Fertilizer import structure by product type in 2013
Source: ITC
Source: ITC Source: ITC
Kazakhstan 52%
Kyrgyzstan 27%
Turkmenistan10%
Uzbekistan7%
Tajikistan4%
79%
8%
8%1%4%
Nitrogen fertilizer
Mixtures of nitrogen,phosphorous or potassiumfertilizersPotash fertilizer
Phosphate fertilizer
Other
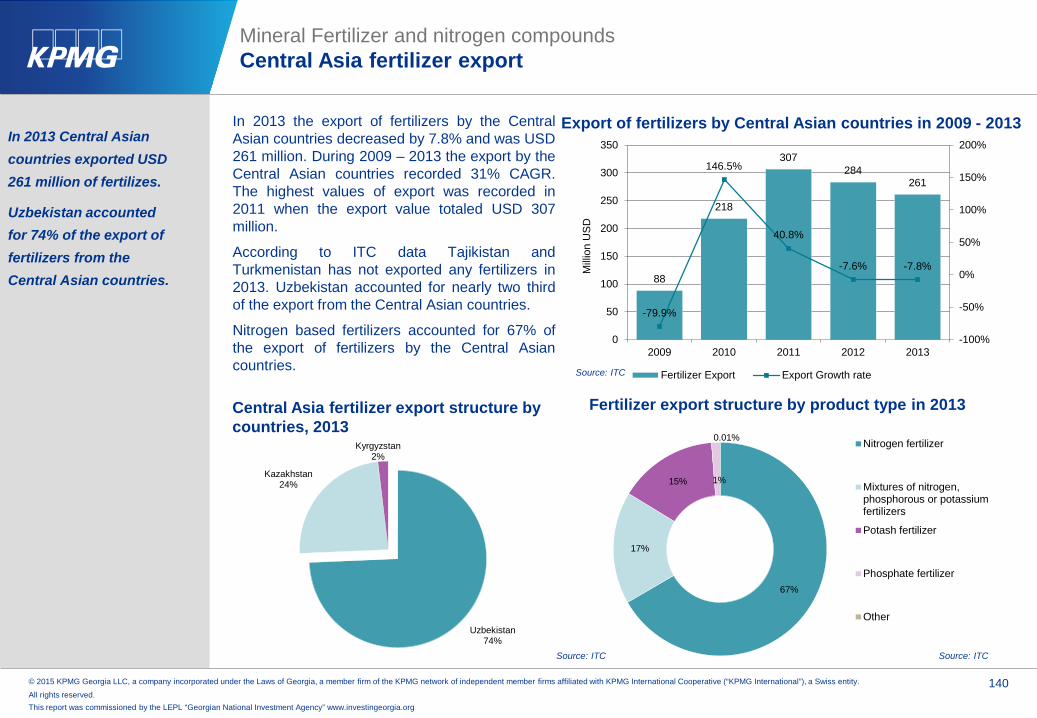
© 2015 KPMG Georgia LLC, a company incorporated under the Laws of Georgia, a member firm of the KPMG network of independent member firms affiliated with KPMG International Cooperative (“KPMG International”), a Swiss entity.
All rights reserved. 140
This report was commissioned by the LEPL “Georgian National Investment Agency” www.investingeorgia.org
88
218
307284
261
-79.9%
146.5%
40.8%
-7.6% -7.8%
-100%
-50%
0%
50%
100%
150%
200%
0
50
100
150
200
250
300
350
2009 2010 2011 2012 2013
Mill
ion
US
D
Fertilizer Export Export Growth rate
In 2013 the export of fertilizers by the CentralAsian countries decreased by 7.8% and was USD261 million. During 2009 – 2013 the export by theCentral Asian countries recorded 31% CAGR.The highest values of export was recorded in2011 when the export value totaled USD 307million.
According to ITC data Tajikistan andTurkmenistan has not exported any fertilizers in2013. Uzbekistan accounted for nearly two thirdof the export from the Central Asian countries.
Nitrogen based fertilizers accounted for 67% ofthe export of fertilizers by the Central Asiancountries.
In 2013 Central Asian countries exported USD 261 million of fertilizes.
Uzbekistan accounted for 74% of the export of fertilizers from the Central Asian countries.
Mineral Fertilizer and nitrogen compoundsCentral Asia fertilizer export
Export of fertilizers by Central Asian countries in 2009 - 2013
Central Asia fertilizer export structure by countries, 2013
Fertilizer export structure by product type in 2013
Source: ITC
Source: ITC Source: ITC
Uzbekistan74%
Kazakhstan 24%
Kyrgyzstan 2%
67%
17%
15% 1%
0.01% Nitrogen fertilizer
Mixtures of nitrogen,phosphorous or potassiumfertilizers
Potash fertilizer
Phosphate fertilizer
Other

© 2015 KPMG Georgia LLC, a company incorporated under the Laws of Georgia, a member firm of the KPMG network of independent member firms affiliated with KPMG International Cooperative (“KPMG International”), a Swiss entity.
All rights reserved. 141
This report was commissioned by the LEPL “Georgian National Investment Agency” www.investingeorgia.org
76 80 71 115 87
300 335 340 340 340
958 972 1,005 962 989
-
200
400
600
800
1,000
1,200
2008 2009 2010 2011 2012
Thou
sand
ton
Kazakhstan Turkmenistan Uzbekistan
According to IFA data, there was no production offertilizers in Tajikistan and Turkmenistan in 2012.
In 2012 (the latest available data at the date ofresearch) Kazakhstan, Turkmenistan andUzbekistan together produced 1,416 thousandston of fertilizer nutrient. Compared with the 2011the production has decreased by 0.1%.
Kazakhstan produced mainly nitrogen basedfertilizer (90% of production) and phosphatebased fertilizer (10% of production).Turkmenistan produced only nitrogen basedfertilizers. 88% of the production of Uzbekistanwas nitrogen based, 11% phosphate based andonly 1% potash fertilizer.
In 2012 (the latest available data at the date ofresearch) the Central Asian countries togetherconsumed around 1,007 thousands ton offertilizer nutrient. The largest consumer offertilizers among the Central Asian countries wasUzbekistan accounting of 64% of consumption inthe region. The second largest consumer in theregion was Turkmenistan (26% of regionconsumption).
Nitrogen based fertilizer accounted for 86% offertilizer consumption by the Central Asiancountries.
In 2012 the Central Asian countries produced 1,416 thousand ton of fertilizes.
Uzbekistan accounted for 70% of the fertilizers production by the Central Asian countries.
Mineral Fertilizer and nitrogen compoundsCentral Asia fertilizer production and consumption
Production of fertilizers by the Central Asian countries in 2008 - 2012
Source: IFA
Consumption of fertilizers by the Central Asian countries in 2008 - 2012
58 60 65 69 70 4 31 33 32 32 12 11 11 11 4
270 273 275 275 280
780 721
650 644 686
- 100 200 300 400 500 600 700 800 900
2008 2009 2010 2011 2012
Thou
sand
ton
Kazakhstan Kyrgyzstan Tajikistan Turkmenistan Uzbekistan
Source: IFA

© 2015 KPMG Georgia LLC, a company incorporated under the Laws of Georgia, a member firm of the KPMG network of independent member firms affiliated with KPMG International Cooperative (“KPMG International”), a Swiss entity.
All rights reserved. 142
This report was commissioned by the LEPL “Georgian National Investment Agency” www.investingeorgia.org
9.73
13.04
17.2917.03 17.02
-51.5%
33.9% 32.6%
-1.5% -0.05%
-60%
-50%
-40%
-30%
-20%
-10%
0%
10%
20%
30%
40%
0
2
4
6
8
10
12
14
16
18
20
2009 2010 2011 2012 2013
Bill
ion
US
D
Fertilizer Import Import Growth rate
16.6%
11.2%
10.1%
7.4%
7.2%6.2%
6.1%
5.2%
3.7%
3.0%
23.3%France
Germany
Belgium
United Kingdom
Spain
Italy
Netherlands
Poland
Ireland
Hungary
Other
In 2013 the import of fertilizers by EU countries (EU28) decreased by 0.05% and was USD 17.2 billion.During the 2009–2013 EU countries importrecorded 15% CAGR.
In 2013 France was the biggest importer offertilizers among EU countries accounting for 16.6%of total import of EU countries. Germany was thesecond largest importer of fertilizers among EUcountries with 11.2% of share followed by Belgiumand UK with 10.1% and 7.4% respectively.
Nitrogen based fertilizers accounted for about thehalf (47.1%) of the import of fertilizers in EU.
In 2013 EU countries imported around USD 17.2 billion of fertilizers.
France was the largest importer of fertilizers in 2013 among EU countries.
Mineral Fertilizer and nitrogen compoundsEU fertilizer import
Import of fertilizer in EU in 2009 - 2013
Top Ten fertilizer importer countries in EU, 2013
47.1%
31.7%
16.3%
2.5%2.4%Nitrogen fertilizer
Mixtures of nitrogen,phosphorous orpotassium fertilizers
Potash fertilizer
Phosphate fertilizer
Other
EU fertilizer import structure by product type in 2013Source: ITC
Source: ITC Source: ITC

© 2015 KPMG Georgia LLC, a company incorporated under the Laws of Georgia, a member firm of the KPMG network of independent member firms affiliated with KPMG International Cooperative (“KPMG International”), a Swiss entity.
All rights reserved. 143
This report was commissioned by the LEPL “Georgian National Investment Agency” www.investingeorgia.org
47.9%
30.6%
15.7%
4.0%1.8% Nitrogen fertilizer
Mixtures of nitrogen,phosphorous or potassiumfertilizers
Potash fertilizer
Other
Phosphate fertilizer
18.1%
17.8%
17.5%6.5%
6.2%
4.6%
3.3%
3.0%
2.9%
2.9%
17.2%
Belgium
Netherlands
Germany
Lithuania
Spain
Poland
Italy
Romania
France
Finland
Other
10.09
12.39
16.99 17.00 16.42
-46.3%
22.8%
37.2%
0.1% -3.4%
-60%-50%-40%-30%-20%-10%0%10%20%30%40%50%
0
2
4
6
8
10
12
14
16
18
2009 2010 2011 2012 2013
Bill
ion
US
D
Fertilizer Export Export Growth rate
In 2013 the export of fertilizers from EU countriesdecreased by 3.4% and was USD 16.42 billion.During the 2009 – 2013 EU countries exportrecorded 13% CAGR.
In 2013 Belgium was the biggest exporter offertilizers among EU countries accounting for18.1% of total export of EU countries.Netherlands was the second largest exporter offertilizers among EU countries with 17.8% ofshare followed by Germany with 17.5%.
Nitrogen based fertilizers accounted for about thehalf (47.9%) of the export of fertilizers in the EU.
In 2013 EU countries exported around USD 17.2 billion of fertilizers.
Belgium was the largest exporter of fertilizers in 2013 among EU countries.
Mineral Fertilizer and nitrogen compoundsEU fertilizer export
Export of fertilizer in EU in 2009 - 2013
Top Ten fertilizer exporter countries in EU, 2013 EU fertilizer export structure by product type in 2013Source: ITC
Source: ITC Source: ITC

© 2015 KPMG Georgia LLC, a company incorporated under the Laws of Georgia, a member firm of the KPMG network of independent member firms affiliated with KPMG International Cooperative (“KPMG International”), a Swiss entity.
All rights reserved. 144
This report was commissioned by the LEPL “Georgian National Investment Agency” www.investingeorgia.org
2006 2007 2008 2009 2010 2011 2012 2013eFrance 3,493 3,828 2,785 2,891 3,429 2,995 3,122 3,285Germany 2,306 2,635 1,904 2,167 2,361 2,274 2,326 2,375Poland 1,970 2,141 1,870 1,889 1,922 2,001 2,065 2,152Spain 1,809 1,935 1,078 1,411 1,698 1,455 1,513 1,590Italy 1,380 1,330 952 852 892 1,094 1,093 1,161
0500
1,0001,5002,0002,5003,0003,5004,0004,500
Thou
sand
ton
France
Germany
Poland
Spain
Italy
France is the biggest consumer of fertilizers in Europe. In 2013 France consumed 3,285 thousand ton of fertilizers.Top European fertilizer consumer countries are France, Germany Poland, Spain and Italy. According to estimates in2013 (the latest available data at the date of research) together they consume 10.563 thousand ton of fertilizers.Compared with 2012 the consumption of top five European countries increased by 4.4%.
Mineral Fertilizer and nitrogen compoundsEU fertilizer consumption
Fertilizer Consumption in Europe – Top Five Countries
Source: Agrium Factbook 2013-2014
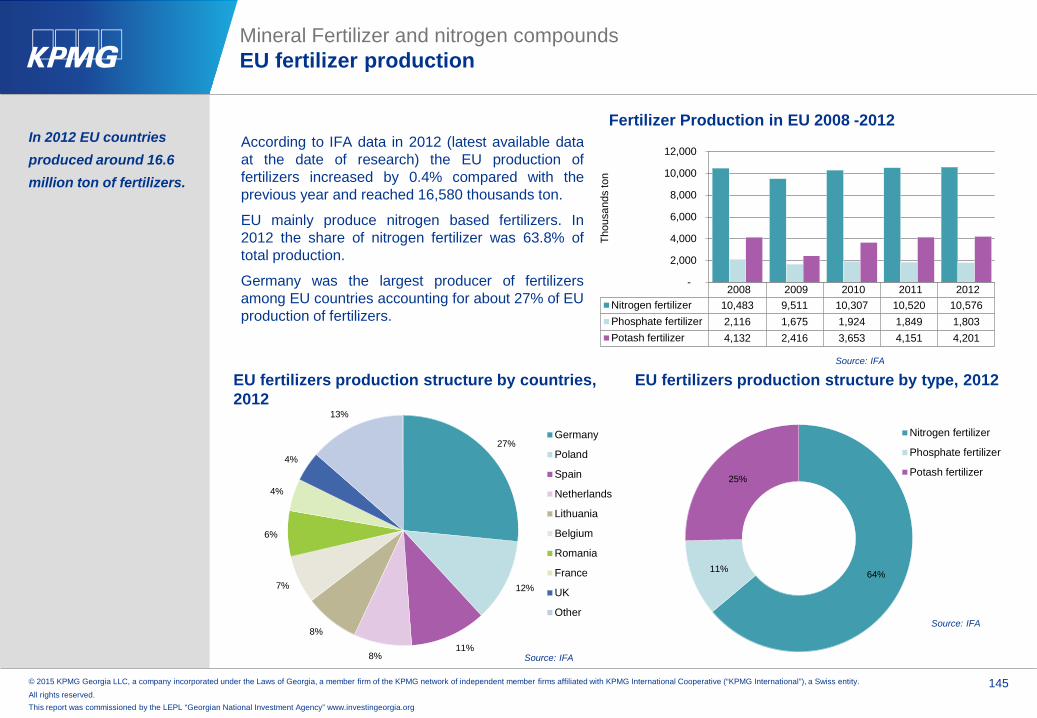
© 2015 KPMG Georgia LLC, a company incorporated under the Laws of Georgia, a member firm of the KPMG network of independent member firms affiliated with KPMG International Cooperative (“KPMG International”), a Swiss entity.
All rights reserved. 145
This report was commissioned by the LEPL “Georgian National Investment Agency” www.investingeorgia.org
2008 2009 2010 2011 2012Nitrogen fertilizer 10,483 9,511 10,307 10,520 10,576Phosphate fertilizer 2,116 1,675 1,924 1,849 1,803Potash fertilizer 4,132 2,416 3,653 4,151 4,201
-
2,000
4,000
6,000
8,000
10,000
12,000
Thou
sand
s to
n
According to IFA data in 2012 (latest available dataat the date of research) the EU production offertilizers increased by 0.4% compared with theprevious year and reached 16,580 thousands ton.
EU mainly produce nitrogen based fertilizers. In2012 the share of nitrogen fertilizer was 63.8% oftotal production.
Germany was the largest producer of fertilizersamong EU countries accounting for about 27% of EUproduction of fertilizers.
In 2012 EU countries produced around 16.6 million ton of fertilizers.
Mineral Fertilizer and nitrogen compoundsEU fertilizer production
Fertilizer Production in EU 2008 -2012
Source: IFA
27%
12%
11%8%
8%
7%
6%
4%
4%
13%
Germany
Poland
Spain
Netherlands
Lithuania
Belgium
Romania
France
UK
Other
EU fertilizers production structure by countries, 2012
Source: IFA
Source: IFA
64%11%
25%
Nitrogen fertilizer
Phosphate fertilizer
Potash fertilizer
EU fertilizers production structure by type, 2012

© 2015 KPMG Georgia LLC, a company incorporated under the Laws of Georgia, a member firm of the KPMG network of independent member firms affiliated with KPMG International Cooperative (“KPMG International”), a Swiss entity.
All rights reserved. 146
This report was commissioned by the LEPL “Georgian National Investment Agency” www.investingeorgia.org
Mineral Fertilizer and nitrogen compoundsProject pipeline
Source: IFA, Macquarie Research, KPMG research
Company Facility Location Products ExpectedCompletion
IncrementalCapacity Type
Ammonia UreaTurkmenistan State Concern Maryazot II Turkmenistan
Ammonia, Urea 2014 0.4 0.635 Greenfield
SOCAR (State Oil Company of the Azerbaijan Republic) - Azerbaijan Urea 2017 -- 0.661 Greenfield
Nitrogen Fertilizer (Ammonia and urea) capacity expansion projects
Potash capacity expansion projectsCompany Location Type/Mine Type Initial Capacity Start dateBelaruskali Soligorsk, Belarus Brownfield 1,500 -Belneftekhim Turkmenistan Conventional 1400 2015Source: INSTITUTIONAL EQUITY RESEARCH, Agriculture, Chemicals And Fertilizers 2015 Outlook, Macquarie Research, KPMG research
According to the International Fertilizer Industry Association (IFA) the main additions to ammonia capacity in future willbe in East Asia (China, Indonesia), Africa (Algeria, Egypt, Nigeria), West Asia (Saudi Arabia, Iran, Bahrain) and LatinAmerica (Venezuela, Brazil). Significant amount of phosphate capacity addition is expected in Morocco, Saudi Arabia,China and Brazil. Potash production capacity is expected to increase mainly in Russia and Canada.
The projects of future capacity development in the regions (selected regions and countries including South Caucasus,EU, Central Asia, Georgia, Ukraine, Turkey) are presented in the tables below (information regarding other planedprojects in the region was not available as at the data of the analysis).
Company Country Investment Capacity Launch data Other detailsCaustic JSC and Kazatomprom Kazakhstan - - 2015-2018 Sulfuric acid plant.
Sulfuric acid capacity expansion projects
Source: KPMG research

© 2015 KPMG Georgia LLC, a company incorporated under the Laws of Georgia, a member firm of the KPMG network of independent member firms affiliated with KPMG International Cooperative (“KPMG International”), a Swiss entity.
All rights reserved. 147
This report was commissioned by the LEPL “Georgian National Investment Agency” www.investingeorgia.org
Among the selected countries Turkmenistan and Kazakhstan have the largest reserves of natural gas
Natural gas is a raw material for a number of chemical industries including production of fertilizers, industrial gases and organicchemicals.
According to CIA World Factbook the EU 28 total reserves of natural gas is estimated to be 1,994 billion cubic meters which isapproximately 1% of world estimated reserves (194,900 billion cubic meters, 2013 estimates).
According to the 2013 estimates Turkmenistan has the largest reserve of natural gas among the Central Asian countries (17,500 billioncubic meters).
According to BP statistical review among the selected counties the largest producers of natural gas in 2013 were Netherlands,Turkmenistan and Uzbekistan.
2008 2009 2010 2011 2012 2013Netherlands 66.6 62.7 70.5 64.2 63.9 68.7Turkmenistan 66.1 36.4 42.4 59.5 62.3 62.3Uzbekistan 62.2 60 59.6 57 56.9 55.2United Kingdom 69.6 59.7 57.1 45.2 38.9 36.5Ukraine 19 19.3 18.5 18.7 18.6 19.3Kazakhstan 16.9 16.4 15.9 17.5 18.4 18.5Azerbaijan 14.8 14.8 15.1 14.8 15.6 16.2Romania 11.4 11.3 10.9 10.9 10.9 11Germany 13 12.2 10.6 10 9 8.2Italy 8.5 7.3 7.7 7.7 7.9 7.1Denmark 10.1 8.4 8.2 6.6 5.8 4.8Poland 4.1 4.1 4.1 4.3 4.3 4.2
Country Reserves (million cubic meters)
EU 28Netherlands 1,230,000 United Kingdom 246,000 Germany 125,000 Romania 105,500 Total EU 28 1,993,563
Central AsiaTurkmenistan 17,500,000 Kazakhstan 2,407,000 Uzbekistan 1,841,000 Kyrgyzstan 5,663 Tajikistan 5,663 Total Central Asia 21,759,326
Other countriesGeorgia 8,495Turkey 6,173 Ukraine 1,104,000 Source: CIA World Factbook
Proved Natural Gas ReservesProduction of Natural Gas (billion cubic meters)
Source: BP Statistical Review of World Energy June 2014
Mineral Fertilizer and nitrogen compoundsRaw materials in the selected Region/Countries - Natural gas

© 2015 KPMG Georgia LLC, a company incorporated under the Laws of Georgia, a member firm of the KPMG network of independent member firms affiliated with KPMG International Cooperative (“KPMG International”), a Swiss entity.
All rights reserved. 148
This report was commissioned by the LEPL “Georgian National Investment Agency” www.investingeorgia.org
The largest consumers of Natural Gas among the selected countries in 2013 were Germany and United Kingdom
2008 2009 2010 2011 2012 2013Germany 81.2 78 83.3 74.5 78.4 83.6United Kingdom 93.4 87 94.2 78.1 73.7 73.1Italy 77.8 71.5 76.2 71.4 68.7 64.2Turkey 37.5 35.7 39 44.7 45.3 45.6Uzbekistan 48.7 43.5 45.5 49.1 46.9 45.2Ukraine 60 46.8 52.2 53.7 49.5 45France 43.8 41.8 46.9 40.5 42.2 42.8Netherlands 38.6 38.9 43.6 38.1 36.4 37.1Spain 38.6 34.6 34.6 32.2 31.3 29Turkmenistan 20.5 19.9 22.6 23.4 26.4 22.3Belgium 16.5 16.8 18.8 16.6 16.9 16.8Poland 14.9 14.4 15.5 15.7 16.6 16.7Romania 15.9 13.3 13.6 13.9 13.5 12.5Kazakhstan 8.9 8.6 9 9.6 10.4 11.4Azerbaijan 9.2 7.8 7.4 8.1 8.5 8.6Hungary 14 12.7 12.6 10.3 10.2 8.6Austria 9.5 9.3 10.1 9.5 9 8.5Czech Republic 8.7 8.2 9.3 8.4 8.2 8.4Slovakia 5.7 4.9 5.6 5.2 4.9 5.4Republic of Ireland 5 4.7 5.2 4.6 4.5 4.5Portugal 4.7 4.7 5.1 5.2 4.5 4.1Denmark 4.6 4.4 5 4.2 3.9 3.7Greece 3.9 3.3 3.6 4.4 4.1 3.6Switzerland 3.1 3 3.3 3 3.3 3.6Finland 4 3.6 3.9 3.5 3.1 2.8Lithuania 3.2 2.7 3.1 3.4 3.3 2.7Bulgaria 3.2 2.3 2.6 2.9 2.7 2.6Sweden 0.9 1.1 1.6 1.3 1.1 1.1Armenia 1.9 1.6 1.7 2.1 2.5 N/AGeorgia 1.7 1.7 1.7 1.5 1.8 N/AKyrgyzstan 0.8 0.7 0.5 0.4 0.4 N/ATajikistan 0.4 0.2 0.2 0.2 0.2 N/A
Consumption of Natural Gas (billion cubic meters)
Source: BP Statistical Review of World Energy June 2014, International Energy Statistics, KMPG analysis
Mineral Fertilizer and nitrogen compoundsRaw materials in the selected Region/Countries - Natural gas

© 2015 KPMG Georgia LLC, a company incorporated under the Laws of Georgia, a member firm of the KPMG network of independent member firms affiliated with KPMG International Cooperative (“KPMG International”), a Swiss entity.
All rights reserved. 149
This report was commissioned by the LEPL “Georgian National Investment Agency” www.investingeorgia.org
The largest exporters of Natural Gas in gaseous state among the selected countries in 2013 were Netherlands and Germany
The largest importers of Natural Gas in gaseous state among the selected countries in 2013 were Germany and Italy
Source: ITC
Value exported in 2013 (USD thousand)
Trade balance in 2013 (USD thousand)
Quantity exported in 2013
Quantity Unit
Unit value (USD/unit)
World 225,627,704 453,849,591 Tons 497 Netherlands 23,271,137 13,358,049 38,043,214 Tons 612Germany 14,059,268 -36,169,784 28,705,184 Tons 490Belgium 10,063,419 -7,075,332 20,174,584 Tons 499United Kingdom 3,373,790 -5,912,391 6,554,196 Tons 515France 2,202,720 -16,171,627 4,415,890 Tons 499Other EU 2,676,986 -40,762,913 4,352,180 Tons n/aTurkmenistan 9,000,705 9,000,705 18,711,500 Tons 481Kazakhstan 1,956,818 1,466,640 16,550,235 Tons 118Uzbekistan 1,166,014 1,166,014 3,762,509 Tons 310Azerbaijan 701,980 701,978 2,187,892 Tons 321Armenia 10,340 -561,426 40,223 Tons 257
Natural gas in (gaseous state) export and import, export and import unit value
Value imported in 2013 (USD thousand)
Trade balance in 2013 (USD thousand)
Quantity imported in 2013
Quantity Unit
Unit value (USD/unit)
World 229,527,999 412,705,190 Tons 556Germany 50,229,052 -36,169,784 98,087,015 Tons 512Italy 24,837,440 -24,706,141 40,625,550 Tons 611France 18,374,347 -16,171,627 30,481,122 Tons 603Belgium 17,138,751 -7,075,332 28,431,398 Tons 603Other EU 52,993,664 -23,803,050 83,544,964 Tons n/aUkraine 11,538,192 -11,538,192 18,909,096 Tons 610Armenia 571,766 -561,426 1,718,171 Tons 333Kazakhstan 490,178 1,466,640 3,915,784 Tons 125Georgia 288,392 -288,392 1,447,920 Tons 199Kyrgyzstan 64,158 -64,158 106,432 Tons 603
Mineral Fertilizer and nitrogen compoundsRaw materials in the selected Region/Countries - Natural gas

© 2015 KPMG Georgia LLC, a company incorporated under the Laws of Georgia, a member firm of the KPMG network of independent member firms affiliated with KPMG International Cooperative (“KPMG International”), a Swiss entity.
All rights reserved. 150
This report was commissioned by the LEPL “Georgian National Investment Agency” www.investingeorgia.org
02468
1012141618
2003 2004 2005 2006 2007 2008 2009 2010 2011 2012 2013
US
D p
er m
illio
n B
tu
Japancif
Average GermanImport Price
UK(Heren NBP Index)
USHenry Hub
Canada(Alberta)
Price of Natural gas for various countries
Source: BP Statistical Review of World Energy June 2014, International Energy Statistics, KMPG analysis
In the 2003-2013 period the German import priceof natural gas has increased while the price inthe US has decreased.
The availability of domestic reserve of naturalgas is decisive factor for the price thus thecountries with natural gas reserves havecompetitive advantage in industries which usenatural gases heavily (e.g. nitrogen fertilizerproduction).
Mineral Fertilizer and nitrogen compoundsRaw materials in the selected Region/Countries - Natural gas
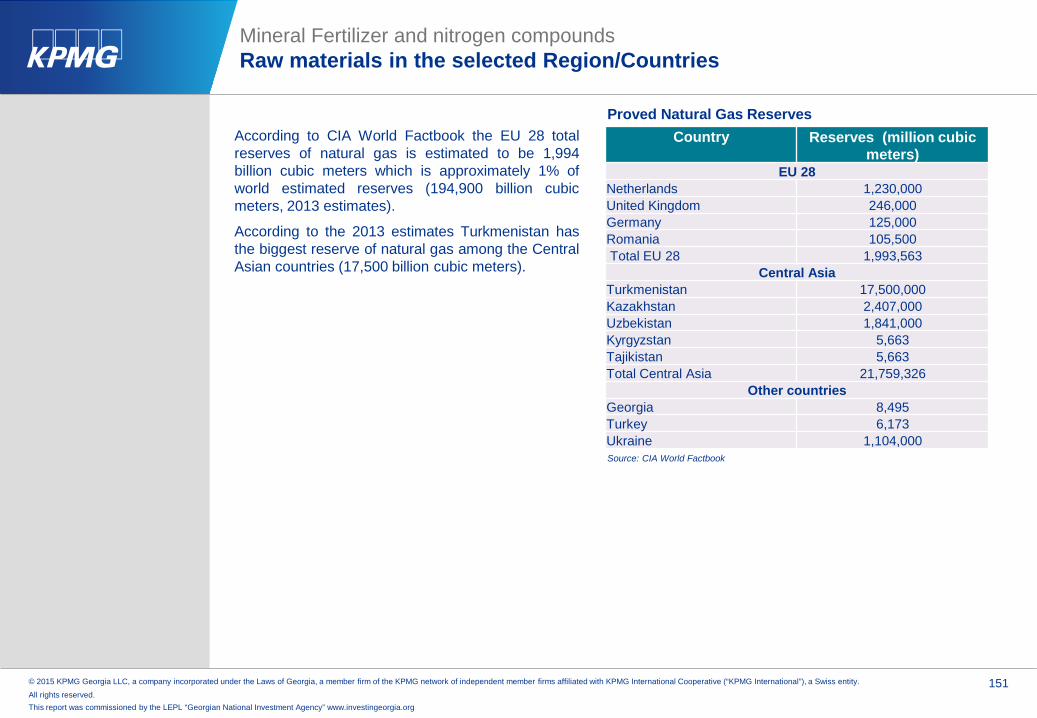
© 2015 KPMG Georgia LLC, a company incorporated under the Laws of Georgia, a member firm of the KPMG network of independent member firms affiliated with KPMG International Cooperative (“KPMG International”), a Swiss entity.
All rights reserved. 151
This report was commissioned by the LEPL “Georgian National Investment Agency” www.investingeorgia.org
Mineral Fertilizer and nitrogen compoundsRaw materials in the selected Region/Countries
Source: CIA World Factbook
Proved Natural Gas ReservesAccording to CIA World Factbook the EU 28 totalreserves of natural gas is estimated to be 1,994billion cubic meters which is approximately 1% ofworld estimated reserves (194,900 billion cubicmeters, 2013 estimates).
According to the 2013 estimates Turkmenistan hasthe biggest reserve of natural gas among the CentralAsian countries (17,500 billion cubic meters).
Country Reserves (million cubic meters)
EU 28Netherlands 1,230,000 United Kingdom 246,000 Germany 125,000 Romania 105,500 Total EU 28 1,993,563
Central AsiaTurkmenistan 17,500,000 Kazakhstan 2,407,000 Uzbekistan 1,841,000 Kyrgyzstan 5,663 Tajikistan 5,663 Total Central Asia 21,759,326
Other countriesGeorgia 8,495Turkey 6,173 Ukraine 1,104,000

© 2015 KPMG Georgia LLC, a company incorporated under the Laws of Georgia, a member firm of the KPMG network of independent member firms affiliated with KPMG International Cooperative (“KPMG International”), a Swiss entity.
All rights reserved. 152
This report was commissioned by the LEPL “Georgian National Investment Agency” www.investingeorgia.org
According the Mineral Commodity Summaries 2015,Germany has the biggest reserves of potash rockamong EU countries. According to availableinformation there is no potash rock reserves inCentral Asia and South Caucasus .
According to the Investmentmine webpage thecurrent price of potash is USD 305.2 per ton (as at 3March 2015).
Among Central Asia countries only Kazakhstan hasreserves of phosphate rock. The estimated reservesof phosphate rock is around 260 million ton or 0.39%of world reserves. The mine production of phosphaterock in 2014 in Kazakhstan was around 1,600thousand ton. There is no reserves of phosphaterock in the EU countries and the countries of SouthCaucasus.
According to the Investmentmine webpage thecurrent price of phosphate rock is USD 115 per ton(as at 3 March 2015).
Ore Reserves (000 ton)
K2O equivalent(000 ton)
Belarus 3,300,000 750,000Germany - 150,000Spain - 20,000UK - 70,000
Potash Reserves
Source: US Geological Survey, KPMG researchNote: Some countries only publish data as K2O equivalent
2013 (000 ton)
2014(000 ton)
Belarus 4,240 4,300Germany 3,200 3,000Spain 420 420UK 470 470
Potash Mine production
Source: US Geological Survey, KPMG research
Phosphate rock is mined from underground ore deposits and used in production of additional phosphoric acid
After the potash ore is mined, the potassium chloride is separated from other salts mixed in the ore using thevarious methods (e.g. flotation). For detailed information regarding trade of potash (potassium chloride is includedin potash group) please see the mineral fertilizer sector.
Mineral Fertilizer and nitrogen compoundsRaw materials in the selected Region/Countries

© 2015 KPMG Georgia LLC, a company incorporated under the Laws of Georgia, a member firm of the KPMG network of independent member firms affiliated with KPMG International Cooperative (“KPMG International”), a Swiss entity.
All rights reserved. 153
This report was commissioned by the LEPL “Georgian National Investment Agency” www.investingeorgia.org
The largest exporters of phosphoric acid and polyphosphoric acids (supplier countries) among the selected countries were Belgium and Netherlands
Value exported in 2013 (USD thousand)
Trade balance in 2013 (USD thousand)
Quantity exported in 2013
Quantity Unit
Unit value (USD/unit)
World 4,122,013 6,052,579 Tons 681Belgium 265,897 30,063 190,134 Tons 1,398Netherlands 146,095 -30,026 69,476 Tons 2,103Finland 47,845 46,327 45,075 Tons 1,061Poland 40,213 30,728 44,539 Tons 903Other EU 69,766 -747,198 74,313 Tons n/aKazakhstan 5,827 4,807 6,753 Tons 863Turkey 1,086 -150,832 764 Tons 1,421Kyrgyzstan 62 -39 36 Tons 1,722Georgia 4 -318 4 Tons 1,000Ukraine 4 -3,845 3 Tons 1,333
Phosphoric acid and polyphosphoric acids export and import, export and import unit value
Source: ITC*Note: There was no available information for phosphoric acid trade separately
Value imported in 2013 (USD thousand)
Trade balance in 2013 (USD thousand)
Quantity imported in 2013
Quantity Unit
Unit value (USD/unit)
World 4,412,489 0 No quantityBelgium 235,834 30,063 219,695 Tons 1,073Germany 211,471 -189,567 211,817 Tons 998France 183,653 -180,676 301,592 Tons 609Netherlands 176,121 -30,026 258,717 Tons 681Spain 167,861 -162,362 339,405 Tons 495Other EU 266,211 -138,767 361,369 Tons n/aTurkey 151,918 -150,832 235,636 Tons 645Ukraine 3,849 -3,845 4,897 Tons 786Kazakhstan 1,020 4,807 618 Tons 1,650Georgia 322 -318 194 Tons 1,660Azerbaijan 219 -219 250 Tons 876Uzbekistan 125 -125 94 Tons 1,330Kyrgyzstan 101 -39 73 Tons 1,384Turkmenistan 60 -60 33 Tons 1,818Armenia 42 -42 30 Tons 1,400
Mineral Fertilizer and nitrogen compoundsRaw materials in the selected Region/Countries

© 2015 KPMG Georgia LLC, a company incorporated under the Laws of Georgia, a member firm of the KPMG network of independent member firms affiliated with KPMG International Cooperative (“KPMG International”), a Swiss entity.
All rights reserved. 154
This report was commissioned by the LEPL “Georgian National Investment Agency” www.investingeorgia.org
Mineral Fertilizer and nitrogen compoundsMain factors of successful functionality of the factory
Main factors Description
Buyer power The main buyers of fertilizers are distributors, wholesalers, and retailers. They tend to purchasefertilizers directly from the manufacturers of fertilizers. Large buyers have significant financialstrength and can negotiate favorable prices using their scale. Other general buyers do not workwith long term contracts and can easily switch the product. Thus the competitive price is animportant factor for ensuring long term demand for the products manufactured. Another importantfactor is a long term effective relationship with the buyers.
Raw materialsavailability (supplier power)
While competitive price is an important factor it is difficult to sustain as the fertilizers price arehighly volatile, especially due to fluctuations in raw material prices. The raw materials used in themanufacturing of fertilizers include nitrogen, phosphorus, potassium, sulfur and natural gas.Availability of some key inputs are restricted and most fertilizers producers must rely on imports.For instance the producer of nitrogen fertilizers need to enter into long term contracts withsuppliers of natural gas to control the risk of the rising prices. Also for decreasing the productioncost the potash and phosphate producers need to be vertically integrated. As illustrated earlier inthis report the higher integration level is the more cost effective the production becomes.
Production scale For being cost effective large scale production (to achieve the economies of scale) is required.
Intellectual property Investments in the intellectual property is needed to produce effective fertilizers.
Degree of regulation The fertilizer industry is regulated so the degree of regulation is also a factor to be considered.
Demand drivers Developments of agricultural industry directly affects the demand and the price for variousfertilizers. Also the developed agricultural industry in domestic market may be a significantadvantage (e.g. less transportation cost thus more competitive price).
Other factors The fertilizer production equipment has specialized nature thus the fixed costs for entering thebusiness are high

Other basic organic chemicals

© 2015 KPMG Georgia LLC, a company incorporated under the Laws of Georgia, a member firm of the KPMG network of independent member firms affiliated with KPMG International Cooperative (“KPMG International”), a Swiss entity.
All rights reserved. 156
This report was commissioned by the LEPL “Georgian National Investment Agency” www.investingeorgia.org
Other basic organic chemicalsMapping – Georgian Classifier via Generally used classifiers
In Georgian National Classifier SEK 001-2004 Sub Group 24.14.9 includes five major
sections
Other basic organic chemicals
Saturated and unsaturated acyclic
hydrocarbon production
Hydrocarbons Alcohols
Classification of other basic chemicals under research
Saturated and unsaturated cyclic
hydrocarbon production
Acyclic alcohols and cyclic,
including synthetic ethanol production
Mono- and poli-carboxylic acids, including acetic acid, production
Synthetic aromatic
substances
Acids Aromatics
The KPMG analysis includes the following major groups of other basic chemicals – hydrocarbons, alcohols, acids andaromatics as the cumulative world trade of these four groups comprise about 67% of the total trade of the other basic organicchemicals. Based on the world trade values major items are selected in each group. The breakdown of each group ispresented in the mapping above.
© 2015 KPMG Georgia LLC, a company incorporated under the Laws of Georgia, a member firm of the KPMG network of independent member firms affiliated with KPMG International Cooperative (“KPMG International”), a Swiss entity.
All rights reserved. 157
This report was commissioned by the LEPL “Georgian National Investment Agency” www.investingeorgia.org
Organic chemicals represent more than 95% of all compounds known to exist and form the basis of the chemical industry
Other basic organic chemicalGeneral overview
Organic chemicals represent more than 95% of all compounds known to exist and form the basis of the chemicalindustry. Most organic compounds are derived from oil, natural gas, or natural gas liquids. There are three basic stagesin converting crude oil or natural gas into final products:
Manufacture base chemicals, or building blocks (e.g., ethylene, propylene, or benzene).
Convert base chemicals into intermediate products (e.g., ethylene glycol or styrene).
Process or convert intermediates into finished products.
Organic chemicals consists of acyclic hydrocarbons and cyclic hydrocarbons. In their terms, acyclic hydrocarbons (acyclic hydrocarbons contain only hydrogen and carbon atoms) can be saturated hydrocarbons and unsaturated hydrocarbons, while the cyclic hydrocarbons are classified as hydrocarbons, aromatic hydrocarbons and heterocyclics.
The fundamental difference between cyclic and acyclic hydrocarbons is the arrangement of the carbon atoms ina cyclic structure. Saturated hydrocarbons are typically used as a fuel (or as a feedstock to create unsaturated compounds).
The report includes research on hydrocarbons as a whole and research of alcohols and acids, which are oxygenatedhydrocarbons, as well as, research on aromatics, which are cyclic hydrocarbons.

© 2015 KPMG Georgia LLC, a company incorporated under the Laws of Georgia, a member firm of the KPMG network of independent member firms affiliated with KPMG International Cooperative (“KPMG International”), a Swiss entity.
All rights reserved. 158
This report was commissioned by the LEPL “Georgian National Investment Agency” www.investingeorgia.org
In 2013 the world trade of organic chemicals was equal to USD 473 billion
Other basic organic chemicalsMarket overview
The world trade of organic chemicals havebeen steadily increasing for the period of2009-2011 and had only 2.8% decrease in2012 which was followed by the increase. Thecompound annual growth rate of the organicchemicals trade was equal to 9.4%.
In the period of 2009-2013 The world trade oforganic chemicals reached its peak in 2011equaling USD 477,610 million.
In 2013 cyclic and acyclic hydrocarbonsaccounted for 18% of the world trade of theorganic chemicals, while the acyclic alcoholsaccounted for 9%.
329,579 395,745
477,610 464,426 473,286
(16.4%)
20.1% 20.7%
(2.8%) 1.9%
-20%
-15%
-10%
-5%
0%
5%
10%
15%
20%
25%
-
100,000
200,000
300,000
400,000
500,000
600,000
2009 2010 2011 2012 2013G
rowth rate, %U
SD
mill
ion
International trade of organic chemicals, 2009-2013
International trade Growth rateSource: ITC
16%
14%
9%
6%5%4%
4%4%
3%3%
32%
International trade of organic chemicals by product type, 2013
Heterocyclic compounds with nitrogen hetero-atom; nucleic acids and thei
Cyclic hydrocarbons
Acyclic alcohols and their derivatives
Acyclic hydrocarbons
Heterocyclic compounds, nes
Polycarboxylic acids, their anhydrides, halides etc and their derivative
Oxygen-function amino-compounds
Hormones; their derivatives; steroids nes
Ethers, ether-alcohols, ether-phenols and peroxides and thier derivatives
Saturated acyclic monocarboxylic acids and their derivatives
OtherSource: ITC
Heterocyclic compounds withnitrogen hetero-atomsaccounted for the biggestshare in the world trade oforganic chemicals equaling to16%

© 2015 KPMG Georgia LLC, a company incorporated under the Laws of Georgia, a member firm of the KPMG network of independent member firms affiliated with KPMG International Cooperative (“KPMG International”), a Swiss entity.
All rights reserved. 159
This report was commissioned by the LEPL “Georgian National Investment Agency” www.investingeorgia.org
5,970 6,731 7,462 7,973 8,226
14,267
19,330
24,114
20,847 18,910
9,347 11,600
14,014 13,330 13,808
6,812
9,702 11,511 10,547 11,168
30%
21%
(8%)
(1%)
-10%
-5%
0%
5%
10%
15%
20%
25%
30%
35%
-
5,000
10,000
15,000
20,000
25,000
30,000
2009 2010 2011 2012 2013
US
D m
illio
n
International trade of acids and their derivatives, 2009-2013
Carboxylic acids and theirderivatives
Polycarboxylic acids, theiranhydrides, halides etc andtheir derivative
Saturated acyclicmonocarboxylic acids andtheir derivatives, nes
Unsaturated acyclic and cyclicmonocarboxylic acid andanhydrides, halides
Total carboxylic acids andtheir derivatives growth
16,123
24,125
31,679 30,709 29,943 30,477
41,121
53,913 54,928
65,480
6,687 9,403 11,411 9,427 9,189
907 1,005 1,160 1,158 1,211
40%
30%
(2%)
10%
-10%
0%
10%
20%
30%
40%
50%
-
10,000
20,000
30,000
40,000
50,000
60,000
70,000
2009 2010 2011 2012 2013
US
D m
illio
n
International trade of hydrocarbons, 2009-2013
Acyclic hydrocarbonsCyclic HydrocarbonsHalogenated derivatives of hydrocarbonsHydrocarbon derivatives, sulfonated, nitratedTotal hydrocarbons growth rate
In 2013 the world tradeof acids, hydrocarbonsand alcohols was equalto USD 52,112 million, USD 105,823 million andUSD 45,437 millionrespectively
In 2013 the world trade of aromatics comprised approximately 38% of world trade of hydrocarbons
Other basic organic chemicalsMarket overview
Source: ITC
Source: ITC
22,232
33,410
43,063 41,019 43,194
1,123 1,469 1,976 2,229 2,243
49%
29%
(4%)
5%
-10%
0%
10%
20%
30%
40%
50%
60%
- 5,000
10,000 15,000 20,000 25,000 30,000 35,000 40,000 45,000 50,000
2009 2010 2011 2012 2013
US
D m
illio
n
International trade of alcohols, 2009-2013
Acyclic alcohols and their derivatives Cyclic alcohols and their derivativesTotal alcohols growth rate
Source: ITC
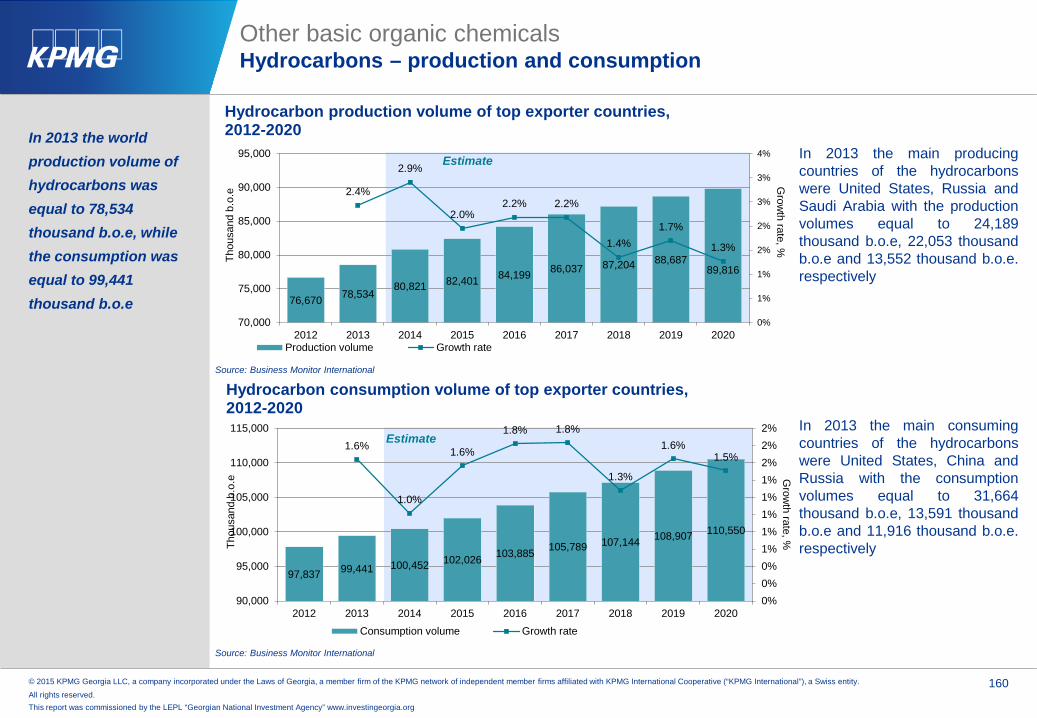
© 2015 KPMG Georgia LLC, a company incorporated under the Laws of Georgia, a member firm of the KPMG network of independent member firms affiliated with KPMG International Cooperative (“KPMG International”), a Swiss entity.
All rights reserved. 160
This report was commissioned by the LEPL “Georgian National Investment Agency” www.investingeorgia.org
In 2013 the worldproduction volume ofhydrocarbons wasequal to 78,534 thousand b.o.e, whilethe consumption wasequal to 99,441 thousand b.o.e
Other basic organic chemicalsHydrocarbons – production and consumption
76,670 78,53480,821 82,401 84,199 86,037 87,204 88,687
89,816
2.4%
2.9%
2.0% 2.2% 2.2%
1.4% 1.7%
1.3%
0%
1%
1%
2%
2%
3%
3%
4%
70,000
75,000
80,000
85,000
90,000
95,000
2012 2013 2014 2015 2016 2017 2018 2019 2020
Grow
th rate, %
Thou
sand
b.o
.e
Hydrocarbon production volume of top exporter countries, 2012-2020
Production volume Growth rate
Estimate
Source: Business Monitor International
97,837 99,441 100,452 102,026 103,885 105,789 107,144 108,907 110,550
1.6%
1.0%
1.6%
1.8% 1.8%
1.3%
1.6% 1.5%
0%0%0%1%1%1%1%1%2%2%2%
90,000
95,000
100,000
105,000
110,000
115,000
2012 2013 2014 2015 2016 2017 2018 2019 2020
Grow
th rate, %
Thou
sand
b.o
.e
Hydrocarbon consumption volume of top exporter countries, 2012-2020
Consumption volume Growth rate
Estimate
Source: Business Monitor International
In 2013 the main producingcountries of the hydrocarbonswere United States, Russia andSaudi Arabia with the productionvolumes equal to 24,189thousand b.o.e, 22,053 thousandb.o.e and 13,552 thousand b.o.e.respectively
In 2013 the main consumingcountries of the hydrocarbonswere United States, China andRussia with the consumptionvolumes equal to 31,664thousand b.o.e, 13,591 thousandb.o.e and 11,916 thousand b.o.e.respectively
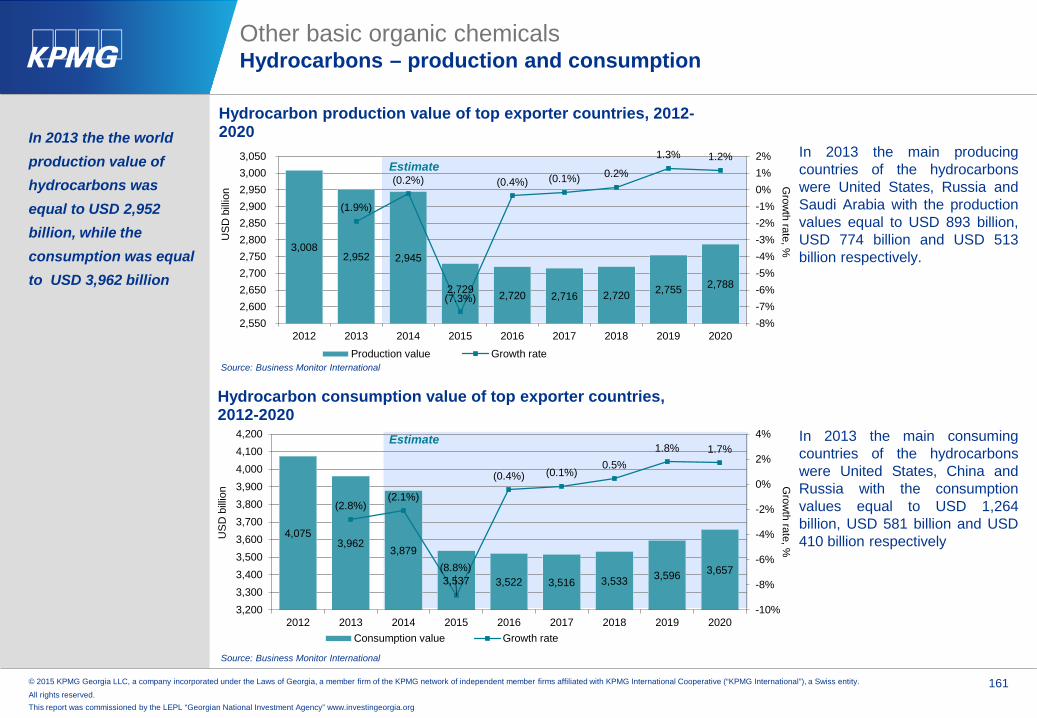
© 2015 KPMG Georgia LLC, a company incorporated under the Laws of Georgia, a member firm of the KPMG network of independent member firms affiliated with KPMG International Cooperative (“KPMG International”), a Swiss entity.
All rights reserved. 161
This report was commissioned by the LEPL “Georgian National Investment Agency” www.investingeorgia.org
4,075 3,962
3,879
3,537 3,522 3,516 3,533 3,596 3,657
(2.8%)(2.1%)
(8.8%)
(0.4%) (0.1%)0.5%
1.8% 1.7%
-10%
-8%
-6%
-4%
-2%
0%
2%
4%
3,2003,3003,4003,5003,6003,7003,8003,9004,0004,1004,200
2012 2013 2014 2015 2016 2017 2018 2019 2020
Grow
th rate, %
US
D b
illio
n
Hydrocarbon consumption value of top exporter countries, 2012-2020
Consumption value Growth rate
3,008 2,952 2,945
2,729 2,720 2,716 2,720 2,755 2,788
(1.9%)
(0.2%)
(7.3%)
(0.4%) (0.1%) 0.2%
1.3% 1.2%
-8%-7%-6%-5%-4%-3%-2%-1%0%1%2%
2,5502,6002,6502,7002,7502,8002,8502,9002,9503,0003,050
2012 2013 2014 2015 2016 2017 2018 2019 2020
Grow
th rate, %
US
D b
illio
n
Hydrocarbon production value of top exporter countries, 2012-2020
Production value Growth rate
In 2013 the the worldproduction value ofhydrocarbons wasequal to USD 2,952 billion, while theconsumption was equalto USD 3,962 billion
Other basic organic chemicalsHydrocarbons – production and consumption
Source: Business Monitor International
Source: Business Monitor International
Estimate
EstimateIn 2013 the main producingcountries of the hydrocarbonswere United States, Russia andSaudi Arabia with the productionvalues equal to USD 893 billion,USD 774 billion and USD 513billion respectively.
In 2013 the main consumingcountries of the hydrocarbonswere United States, China andRussia with the consumptionvalues equal to USD 1,264billion, USD 581 billion and USD410 billion respectively

© 2015 KPMG Georgia LLC, a company incorporated under the Laws of Georgia, a member firm of the KPMG network of independent member firms affiliated with KPMG International Cooperative (“KPMG International”), a Swiss entity.
All rights reserved. 162
This report was commissioned by the LEPL “Georgian National Investment Agency” www.investingeorgia.org
Other basic organic chemicalHydrocarbons – cost structure
Oil quantity x Price
HydrocarbonsOil refining, synthesis
Hydrocarbons raw materials cost modeling
natural gasquantity x Price
OR
Natural gas is analysed in the section Mineral fertilizers and nitrogen compounds.

© 2015 KPMG Georgia LLC, a company incorporated under the Laws of Georgia, a member firm of the KPMG network of independent member firms affiliated with KPMG International Cooperative (“KPMG International”), a Swiss entity.
All rights reserved. 163
This report was commissioned by the LEPL “Georgian National Investment Agency” www.investingeorgia.org
The cumulative world trade of ethylene glycol (ethanedio) and methanol (methyl alcohol) accounts for 60.1% of the world trade of alcohol
Other basic organic chemicalAlcohols – Market Overview
The alcohols are divided into two subgroups cyclic alcohols and acyclic alcohols and each of the groups includes largevariety of alcohol types. The world trade of two main alcohols - Ethylene glycol (ethanediol) and Methanol (methylalcohol) accounts for approximately 60.1% of the world trade of alcohols. The analysis of the alcohol sector will bebased on the analyses of these two main alcohols.
ITC code Name World trade, 20132905Acyclic alcohols and their derivatives USD 43,193,548 thousand2906Cyclic alcohols and their derivatives USD 2,242,603 thousand
ITC subgroups included in the analysis
Source: ITC, KPMG research
polyester resin26%
antifreeze10%
industrial uses6%polyester film
4%others
2%
polyester fibre52%
Uses of ethylene glycol (ethanediol)
Source: Essential Chemical industry
9%
13%
2%2%
3%1%
14%
2%7%10%
7%
30%
Uses of Methanol Acetic acid
Methyl-tertiary-butyl ether
Methyl methacrylate
Methylamine
Chloromethane
Dimethylterephthalate
Petrol blending
Biodiesel
Dimethyl ether
Methanol to olefins and methanolto propeneOther
Methanal
Source: Essential Chemical industry
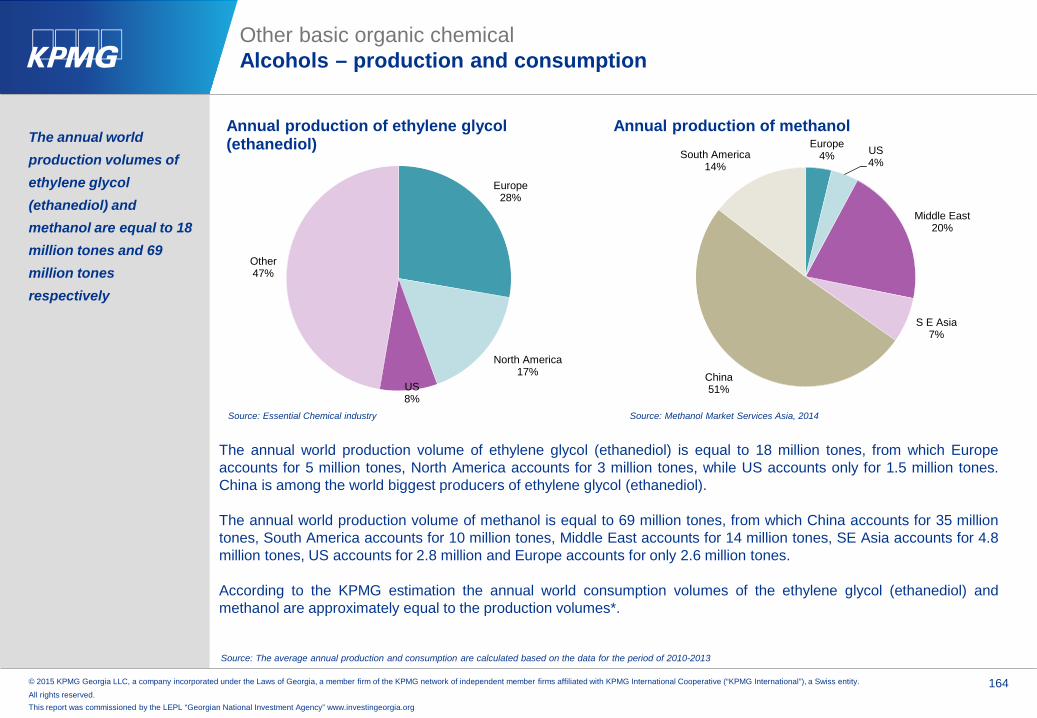
© 2015 KPMG Georgia LLC, a company incorporated under the Laws of Georgia, a member firm of the KPMG network of independent member firms affiliated with KPMG International Cooperative (“KPMG International”), a Swiss entity.
All rights reserved. 164
This report was commissioned by the LEPL “Georgian National Investment Agency” www.investingeorgia.org
The annual world production volumes of ethylene glycol (ethanediol) and methanol are equal to 18 million tones and 69 million tones respectively
Other basic organic chemicalAlcohols – production and consumption
The annual world production volume of ethylene glycol (ethanediol) is equal to 18 million tones, from which Europeaccounts for 5 million tones, North America accounts for 3 million tones, while US accounts only for 1.5 million tones.China is among the world biggest producers of ethylene glycol (ethanediol).
The annual world production volume of methanol is equal to 69 million tones, from which China accounts for 35 milliontones, South America accounts for 10 million tones, Middle East accounts for 14 million tones, SE Asia accounts for 4.8million tones, US accounts for 2.8 million and Europe accounts for only 2.6 million tones.
According to the KPMG estimation the annual world consumption volumes of the ethylene glycol (ethanediol) andmethanol are approximately equal to the production volumes*.
Europe28%
North America17%
US8%
Other47%
Annual production of ethylene glycol (ethanediol)
Source: Essential Chemical industry
Europe4% US
4%
Middle East20%
S E Asia7%
China51%
South America14%
Annual production of methanol
Source: Methanol Market Services Asia, 2014
Source: The average annual production and consumption are calculated based on the data for the period of 2010-2013
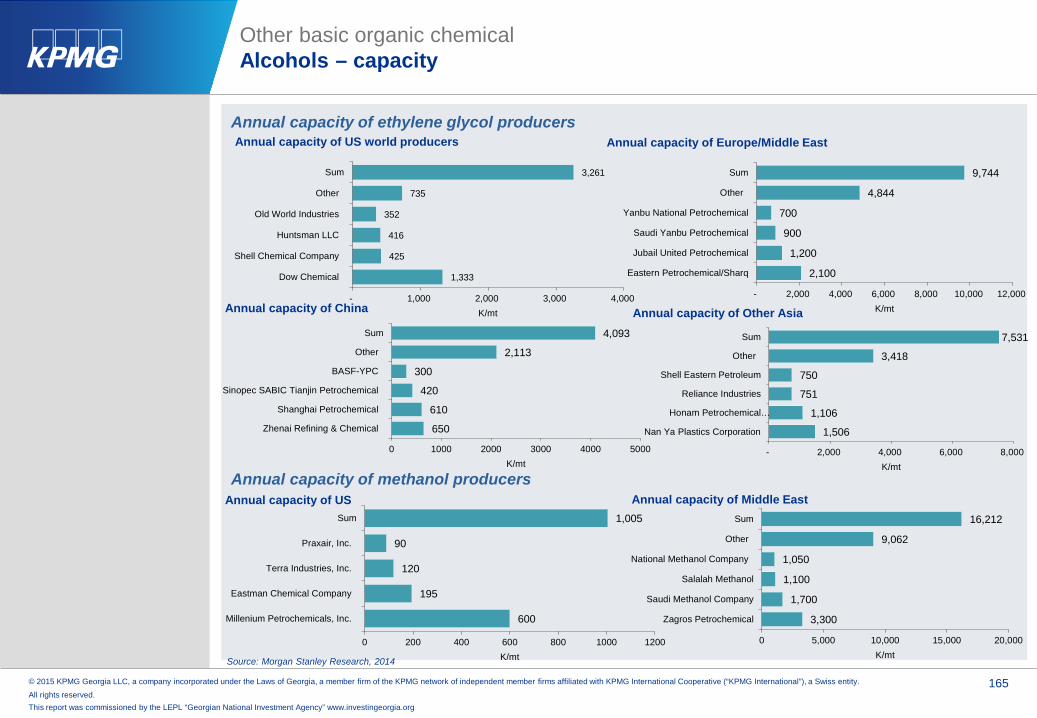
© 2015 KPMG Georgia LLC, a company incorporated under the Laws of Georgia, a member firm of the KPMG network of independent member firms affiliated with KPMG International Cooperative (“KPMG International”), a Swiss entity.
All rights reserved. 165
This report was commissioned by the LEPL “Georgian National Investment Agency” www.investingeorgia.org
Other basic organic chemicalAlcohols – capacity
Annual capacity of ethylene glycol producers
2,100
1,200
900
700
4,844
9,744
- 2,000 4,000 6,000 8,000 10,000 12,000
Eastern Petrochemical/Sharq
Jubail United Petrochemical
Saudi Yanbu Petrochemical
Yanbu National Petrochemical
Other
Sum
K/mt
Annual capacity of Europe/Middle East
650
610
420
300
2,113
4,093
0 1000 2000 3000 4000 5000
Zhenai Refining & Chemical
Shanghai Petrochemical
Sinopec SABIC Tianjin Petrochemical
BASF-YPC
Other
Sum
K/mt
Annual capacity of China
1,506
1,106
751
750
3,418
7,531
- 2,000 4,000 6,000 8,000
Nan Ya Plastics Corporation
Honam Petrochemical…
Reliance Industries
Shell Eastern Petroleum
Other
Sum
K/mt
Annual capacity of Other Asia
Annual capacity of methanol producers
600
195
120
90
1,005
0 200 400 600 800 1000 1200
Millenium Petrochemicals, Inc.
Eastman Chemical Company
Terra Industries, Inc.
Praxair, Inc.
Sum
K/mt
Annual capacity of US
3,300
1,700
1,100
1,050
9,062
16,212
0 5,000 10,000 15,000 20,000
Zagros Petrochemical
Saudi Methanol Company
Salalah Methanol
National Methanol Company
Other
Sum
K/mt
Annual capacity of Middle East
Source: Morgan Stanley Research, 2014
1,333
425
416
352
735
3,261
- 1,000 2,000 3,000 4,000
Dow Chemical
Shell Chemical Company
Huntsman LLC
Old World Industries
Other
Sum
K/mt
Annual capacity of US world producers

© 2015 KPMG Georgia LLC, a company incorporated under the Laws of Georgia, a member firm of the KPMG network of independent member firms affiliated with KPMG International Cooperative (“KPMG International”), a Swiss entity.
All rights reserved. 166
This report was commissioned by the LEPL “Georgian National Investment Agency” www.investingeorgia.org
Other basic organic chemicalAlcohols – capacity
Source: Morgan Stanley Research, 2014
1,800
1,000
1,000
850
37,914
42,564
0 10,000 20,000 30,000 40,000 50,000
Shenhua Baotou Coal Chemical
Inner Mongolia Boyuan UnitedChemical
Jiutai Energy Inner Mongolia
Shenhua Ningxia Coal Chemical
Other
Sum
K/mt
Annual capacity of China
3,882
2,815
1,700
1,700
15,585
25,682
0 5,000 10,000 15,000 20,000 25,000 30,000
Methanlol Holdings
Methanex
Petronas Methanol
Atlas Methanol
Other
Sum
K/mt
Annual capacity of the rest of the world

© 2015 KPMG Georgia LLC, a company incorporated under the Laws of Georgia, a member firm of the KPMG network of independent member firms affiliated with KPMG International Cooperative (“KPMG International”), a Swiss entity.
All rights reserved. 167
This report was commissioned by the LEPL “Georgian National Investment Agency” www.investingeorgia.org
Other basic organic chemicalAlcohols – cost structure
Ethylene glycol is manufactured from ethene via epoxyethane. It is miscible with water and it lowers the freezing pointof water so it is used as an antifreeze.
Methanol is produced from synthesis gas (carbon monoxide and hydrogen), itself derived from oil, coal or,increasingly, biomass. It may become central to the development of biorefineries as an intermediate in theconversion of biomass to useful products.
Source: Essential Chemical Industry
Water quantity x Price
Epoxyethane Quantity x Price
Ethylene glycol (ethanediol)
Hydration process
Synthesis gas x Price
Methanol (methyl alcohol)
Catalytically converting process to methanol at elevated temperatures
Alcohols raw materials cost modeling

© 2015 KPMG Georgia LLC, a company incorporated under the Laws of Georgia, a member firm of the KPMG network of independent member firms affiliated with KPMG International Cooperative (“KPMG International”), a Swiss entity.
All rights reserved. 168
This report was commissioned by the LEPL “Georgian National Investment Agency” www.investingeorgia.org
8%
7%
18%
9%
58%
Acetic acid, its anhydride, salt and esters nes
Other compoundes included in the subgroup which use acetic acid (Vinyl andEthhyl acetate)Terephthalic acid and its salts
Acrylic acid, its salts and esters
Other
There are various types of acids and while being included in one big group each separate acid has its own characteristics, specifications in production methods and most importantly application in various industries.
Other basic organic chemicalAcids – Market overview
Acids global import structureThere are various types of acids and while being included inone big group each separate acid has its owncharacteristics, specifications in production methods andmost importantly application in various industries. Thus usingthe international trade statistics (world import) we conductedanalysis to identify the most used acids and separatelyanalyze them. For the total import of acids we take the totalimport of four groups presented in the table below as allthose subgroups included various acids, their salts, estersand derivatives.As per ITC data acetic acid (including its anhydride, salt andesters) accounts for around 8% of total import of carboxylicacids and their derivatives. Other chemical compounds(acids, acetates) that consume the acetic acid and areincluded in the sub groups accounted for another 7%.Having the all above information we considered the aceticacid as one of the most used and chose to analyze this acidseparately.We also chose to separately analyze the acrylic acid as itaccounts for another 10% (together with its salts and ester)and Terephthalic acid which including its salts accounts for18% of selected group.
ITC code Name World trade, 2013
2915Saturated acyclic monocarboxylic acids & their derivatives (including acetic acid) USD 13,801 million2916Unsaturated acyclic & cyclic monocarboxylic acid & anhydrides, halides (including acrylic acid) USD 11,168 million2917Polycarboxylic acids, their anhydrides, halides etc & their derivative (including terephtalic acid) USD 18,910 million2918Carboxylic acids & their derivatives USD 8,225 million
ITC subgroups included in the analysis
Source: ITC, KPMG research
Source: ITC, KPMG research
This includes not only various
acids, but also their derivatives
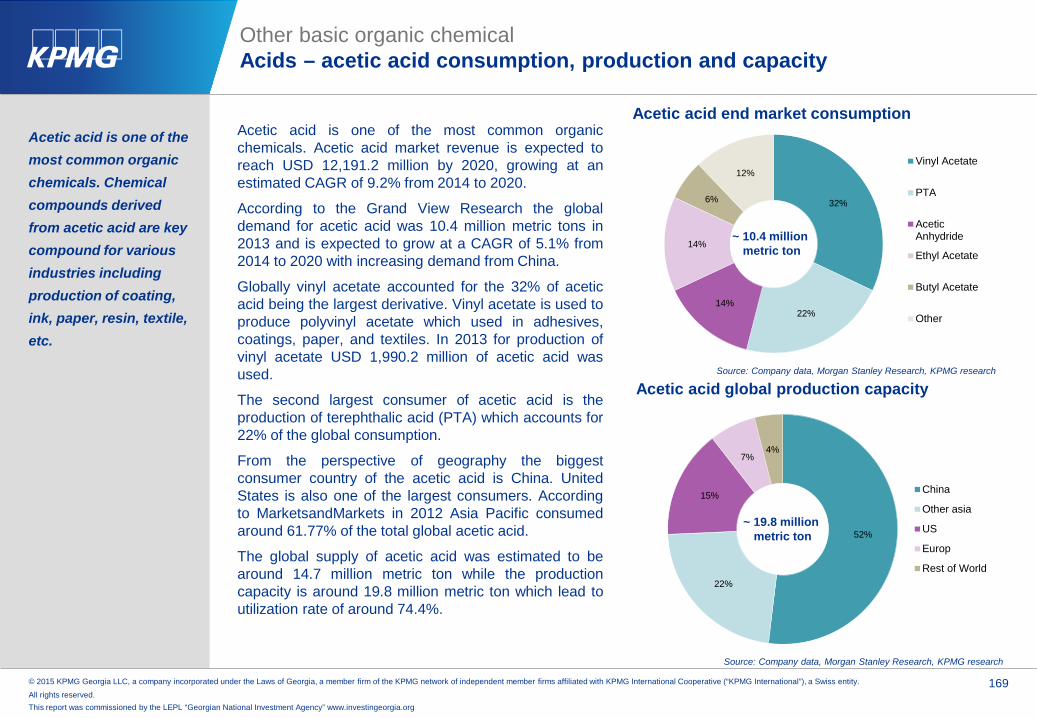
© 2015 KPMG Georgia LLC, a company incorporated under the Laws of Georgia, a member firm of the KPMG network of independent member firms affiliated with KPMG International Cooperative (“KPMG International”), a Swiss entity.
All rights reserved. 169
This report was commissioned by the LEPL “Georgian National Investment Agency” www.investingeorgia.org
Acetic acid is one of the most common organic chemicals. Chemical compounds derived from acetic acid are key compound for various industries including production of coating, ink, paper, resin, textile, etc.
Other basic organic chemicalAcids – acetic acid consumption, production and capacity
Acetic acid is one of the most common organicchemicals. Acetic acid market revenue is expected toreach USD 12,191.2 million by 2020, growing at anestimated CAGR of 9.2% from 2014 to 2020.
According to the Grand View Research the globaldemand for acetic acid was 10.4 million metric tons in2013 and is expected to grow at a CAGR of 5.1% from2014 to 2020 with increasing demand from China.
Globally vinyl acetate accounted for the 32% of aceticacid being the largest derivative. Vinyl acetate is used toproduce polyvinyl acetate which used in adhesives,coatings, paper, and textiles. In 2013 for production ofvinyl acetate USD 1,990.2 million of acetic acid wasused.
The second largest consumer of acetic acid is theproduction of terephthalic acid (PTA) which accounts for22% of the global consumption.
From the perspective of geography the biggestconsumer country of the acetic acid is China. UnitedStates is also one of the largest consumers. Accordingto MarketsandMarkets in 2012 Asia Pacific consumedaround 61.77% of the total global acetic acid.
The global supply of acetic acid was estimated to bearound 14.7 million metric ton while the productioncapacity is around 19.8 million metric ton which lead toutilization rate of around 74.4%.
Source: Company data, Morgan Stanley Research, KPMG research
32%
22%14%
14%
6%
12%Vinyl Acetate
PTA
AceticAnhydride
Ethyl Acetate
Butyl Acetate
Other
Acetic acid end market consumption
52%
22%
15%
7%4%
China
Other asia
US
Europ
Rest of World
Acetic acid global production capacity
~ 19.8 million metric ton
~ 10.4 million metric ton
Source: Company data, Morgan Stanley Research, KPMG research

© 2015 KPMG Georgia LLC, a company incorporated under the Laws of Georgia, a member firm of the KPMG network of independent member firms affiliated with KPMG International Cooperative (“KPMG International”), a Swiss entity.
All rights reserved. 170
This report was commissioned by the LEPL “Georgian National Investment Agency” www.investingeorgia.org
The largest producer of acetic acid is Celanese Corporation (USA)
Other basic organic chemicalAcids – acetic acid production and cost structure
The largest producer of acetic acid is CelaneseCorporation.
Nowadays acetic acid is produced by carbonylation ofmethanol (around 95%). This method was originallydeveloped by Monsanto.
When preparing acetic acid using carbonylation methodthe process conversion effectiveness is around 98-99%.For producing one ton of acetic acid using the abovementioned method around 0.54 tons of methanol and 0.5ton of CO (carbon monoxide) is required.
Acetic acid is also produced in many other chemicalreactions where it appears as a by-product of the reactionand it can be recovered and used. According to theestimates (Morgan Stanley) recovered acid accounts foraround 17% of total world supply of acetic acid.
Main acetic acid producer companies market share15%
14%
7%
6%6%3%
49%
Celanese (USA)
BP (UK)
Shanghai Wujing (China)
Jiangsu Sopo (China)
Shandong Yanco Cathyl(China)
Chang Chun (China)
Other
Source: Company data, Morgan Stanley Research, KPMG research
Acetic acids raw materials cost modeling
Source: Company data, Morgan Stanley Research, KPMG research
Methanol price x quantity (around 0.54 ton)
CO price x quantity (0.5 ton)
Acetic acid total cost
Carbonylation

© 2015 KPMG Georgia LLC, a company incorporated under the Laws of Georgia, a member firm of the KPMG network of independent member firms affiliated with KPMG International Cooperative (“KPMG International”), a Swiss entity.
All rights reserved. 171
This report was commissioned by the LEPL “Georgian National Investment Agency” www.investingeorgia.org
42.6%
23.5%
8.8%
7.4%
7.4%
4.4%5.9%
n-butyl acrylate
Ethyl acrylate
Detergents
2-ethylhexyl acrylates
Specialty acrylates
Water treatment &Dispersants
Other
23.2%
22.7%
20.4%
29.6%
4.1%
China
Other asia
USA
Western Europe
Rest of World
Acrylic acid is used primarily in architectural paints and coatings. Also acrylic acid is used for automotive coatings and radiation curable coatings.
One of the major factors driving the demand for acid at the global level is the industrial application of acids. Number of industries including production consumer goods, cosmetics, polymers, pharmaceuticals, solvents, paints, food and beverage, etc. use acids.
Other basic organic chemicalAcids – acrylic acid consumption, production and capacity
Acrylic acids are widely used in the form of differentesters (e.g. n-butyl acrylate). The end marketconsumption of acrylic acids and its derivatives includesurface coatings, textiles, adhesives, and plastics.According to the MarketsandMarkets press releases, In2014 the acrylic acid consumption was around is 5,570KT (thousand metric ton) and is expected to grow up to6,974 KT by 2019 with CAGR of 4.60% during theperiod.
The global capacity of acrylic acid was estimated to bearound 6.4 million metric ton. China accounts for about23.2% of global production capacity of acrylic acid andUSA accounted of 20.4%.
Having the world demand of around 5.6 metric ton thecurrent production capacity should have been utilized ataround 87% utilization rate to meet the global demand.
Taking the projections of the MarketsandMarkets andassuming the utilization rate stay at the current rate weestimated that by 2019 around 1.6 million metric ton ofadditional production capacity would be required to meetthe increased global demand of acrylic acids.
Again Asia Pacific, specifically China was the largestmarket for acrylic acid and its derivatives in 2013.
Source: Company data, Morgan Stanley Research, KPMG research
Acrylic acid end market consumption
Acrylic acid global production capacity
~6.4 million metric ton
~5.6 million metric ton
Source: Company data, Morgan Stanley Research, KPMG research

© 2015 KPMG Georgia LLC, a company incorporated under the Laws of Georgia, a member firm of the KPMG network of independent member firms affiliated with KPMG International Cooperative (“KPMG International”), a Swiss entity.
All rights reserved. 172
This report was commissioned by the LEPL “Georgian National Investment Agency” www.investingeorgia.org
BASF is the world’s largest producer of acrylic acid and acrylic esters.
BASF has operating production sites all over the world.
Other basic organic chemicalAcids – acrylic acid production and cost structure
The largest producer of acrylic acid is BASF accountingfor 20% of the market followed by USA Dow (12%market share).Several production processes for acrylic acid exists.According to the Morgan Stanley reports currently thepropylene oxidation is the most commercially viableproduction method. The Propylene oxidation process isdescribed in the below chart.Acrylic acids are highly volatile and explosive liquids.The transportation of acrylic acid is not easy so thedemand tends to be met by local suppliers.
Main acrylic acid producer companies market share
Source: Company data, Morgan Stanley Research, KPMG researchPropylene oxidation process (raw materials cost modeling)
Source: Company data, Morgan Stanley Research, KPMG research
Propylene price x quantity
Oxygen Acrylic acid
20%
12%
10%
9%8%
8%
33%
BASF (Germany)
Dow (USD)
Arkema (France)
Nippon Shokubai (Japan)
Evonik/Rohm &Haas(Germany)
FPC (Taiwan - FormosaPlastics Corporation)
Other
Steam
Mixing
Nickel metal oxide catalyst price x quantity
A reaction with nickel metal oxide catalyst at 357°C takes place.
This process yields close to 90%
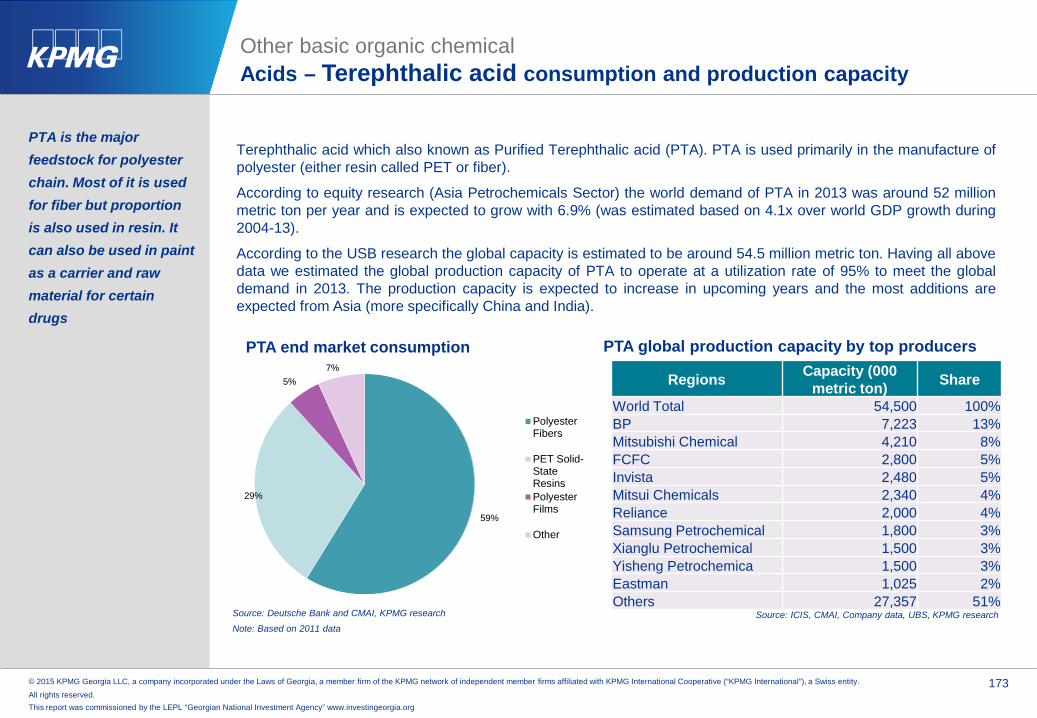
© 2015 KPMG Georgia LLC, a company incorporated under the Laws of Georgia, a member firm of the KPMG network of independent member firms affiliated with KPMG International Cooperative (“KPMG International”), a Swiss entity.
All rights reserved. 173
This report was commissioned by the LEPL “Georgian National Investment Agency” www.investingeorgia.org
PTA is the major feedstock for polyester chain. Most of it is used for fiber but proportion is also used in resin. It can also be used in paint as a carrier and raw material for certain drugs
Other basic organic chemicalAcids – Terephthalic acid consumption and production capacity
Terephthalic acid which also known as Purified Terephthalic acid (PTA). PTA is used primarily in the manufacture ofpolyester (either resin called PET or fiber).
According to equity research (Asia Petrochemicals Sector) the world demand of PTA in 2013 was around 52 millionmetric ton per year and is expected to grow with 6.9% (was estimated based on 4.1x over world GDP growth during2004-13).
According to the USB research the global capacity is estimated to be around 54.5 million metric ton. Having all abovedata we estimated the global production capacity of PTA to operate at a utilization rate of 95% to meet the globaldemand in 2013. The production capacity is expected to increase in upcoming years and the most additions areexpected from Asia (more specifically China and India).
PTA end market consumption PTA global production capacity by top producers
Source: Deutsche Bank and CMAI, KPMG research
59%
29%
5%7%
PolyesterFibers
PET Solid-StateResinsPolyesterFilms
Other
Note: Based on 2011 dataSource: ICIS, CMAI, Company data, UBS, KPMG research
Regions Capacity (000 metric ton) Share
World Total 54,500 100%BP 7,223 13%Mitsubishi Chemical 4,210 8%FCFC 2,800 5%Invista 2,480 5%Mitsui Chemicals 2,340 4%Reliance 2,000 4%Samsung Petrochemical 1,800 3%Xianglu Petrochemical 1,500 3%Yisheng Petrochemica 1,500 3%Eastman 1,025 2%Others 27,357 51%
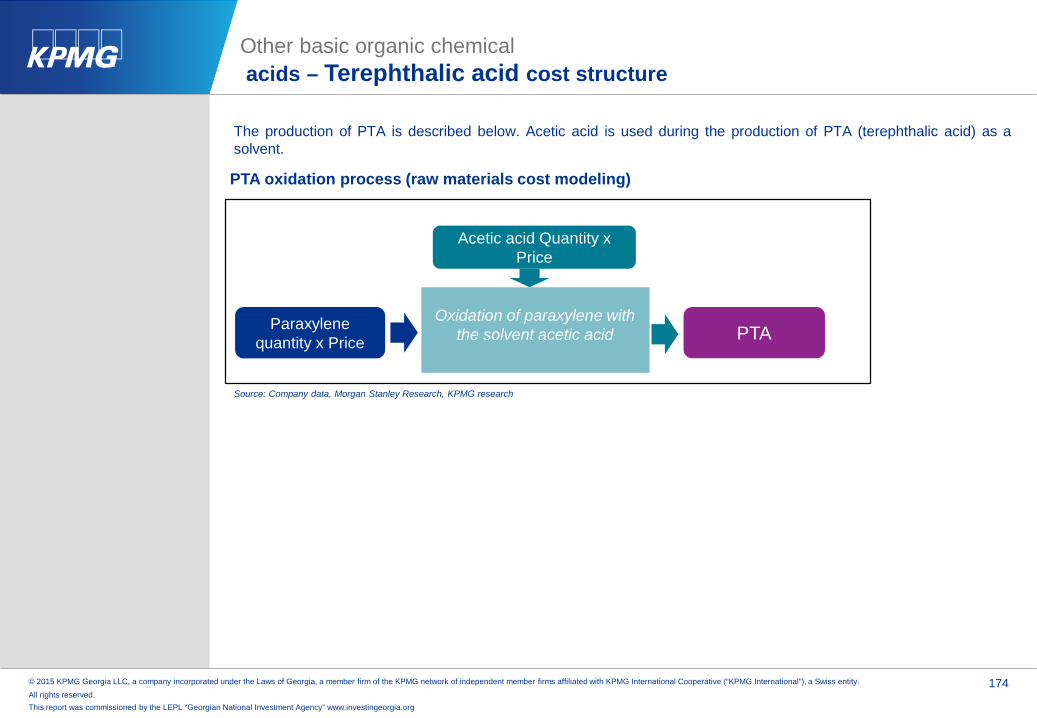
© 2015 KPMG Georgia LLC, a company incorporated under the Laws of Georgia, a member firm of the KPMG network of independent member firms affiliated with KPMG International Cooperative (“KPMG International”), a Swiss entity.
All rights reserved. 174
This report was commissioned by the LEPL “Georgian National Investment Agency” www.investingeorgia.org
Other basic organic chemicalacids – Terephthalic acid cost structure
The production of PTA is described below. Acetic acid is used during the production of PTA (terephthalic acid) as asolvent.
PTA oxidation process (raw materials cost modeling)
Paraxylenequantity x Price
Acetic acid Quantity x Price
PTAOxidation of paraxylene with
the solvent acetic acid
Source: Company data, Morgan Stanley Research, KPMG research

© 2015 KPMG Georgia LLC, a company incorporated under the Laws of Georgia, a member firm of the KPMG network of independent member firms affiliated with KPMG International Cooperative (“KPMG International”), a Swiss entity.
All rights reserved. 175
This report was commissioned by the LEPL “Georgian National Investment Agency” www.investingeorgia.org
48% of benzene is used for producing ethylbenzene
Other basic organic chemicalAromatics – Market overview
All aromatics are cyclic hydrocarbons. The analysis will include the three widely used aromatics – Benzene,Toluene (Methylbenzene) and Xylenes (Dimethylbenzenes) (o-Xylene, p-Xylene, m-Xylene and mixed isomers)
ITC code Name World trade, 2013290220Benzene USD 10,484,895 thousand290230Toluene USD 3,868,010 thousand290241O-Xylene USD 1,651,926 thousand290242M-Xylene USD 163,546 thousand290243P-Xylene USD 22,643,813 thousand290244Mixed Xylene isomers USD 1,262,318 thousand
ITC subgroups included in the analysis
Source: ITC, KPMG research
others8%
ethylbenzene48%cumens
20%
alkylbenzenes3%
cyclohexane13%
nitrobenzene8%
Uses of benzene
Source: Essential Chemical industry
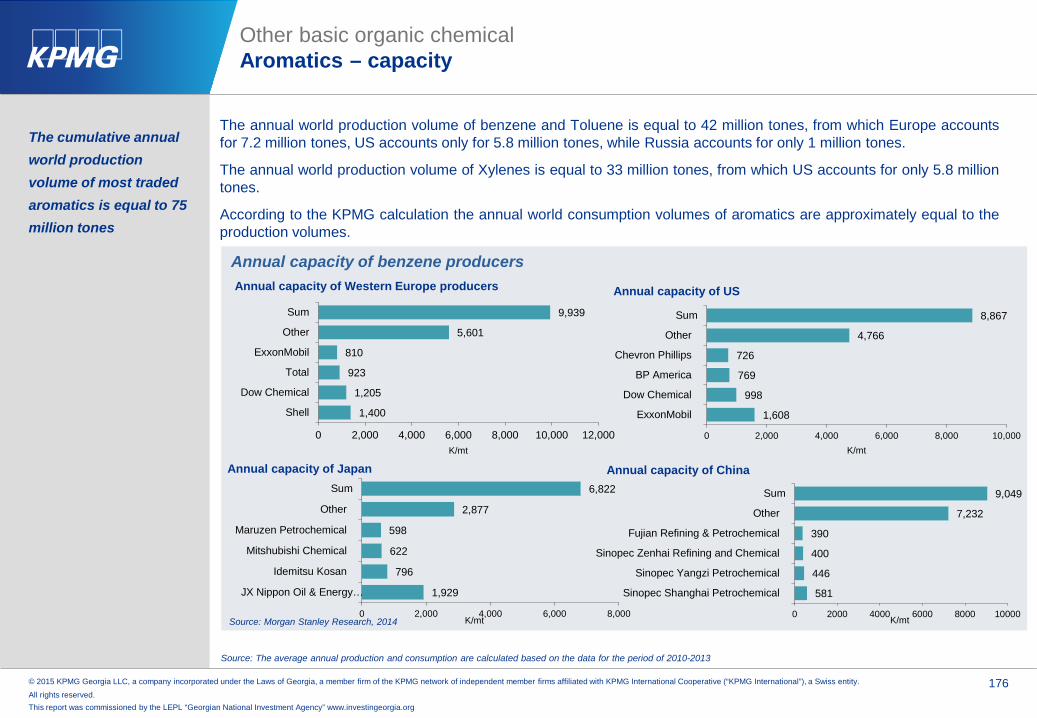
© 2015 KPMG Georgia LLC, a company incorporated under the Laws of Georgia, a member firm of the KPMG network of independent member firms affiliated with KPMG International Cooperative (“KPMG International”), a Swiss entity.
All rights reserved. 176
This report was commissioned by the LEPL “Georgian National Investment Agency” www.investingeorgia.org
Source: The average annual production and consumption are calculated based on the data for the period of 2010-2013
1,608
998
769
726
4,766
8,867
0 2,000 4,000 6,000 8,000 10,000
ExxonMobil
Dow Chemical
BP America
Chevron Phillips
Other
Sum
K/mt
Annual capacity of US
1,929
796
622
598
2,877
6,822
0 2,000 4,000 6,000 8,000
JX Nippon Oil & Energy…
Idemitsu Kosan
Mitshubishi Chemical
Maruzen Petrochemical
Other
Sum
K/mt
Annual capacity of Japan
581
446
400
390
7,232
9,049
0 2000 4000 6000 8000 10000
Sinopec Shanghai Petrochemical
Sinopec Yangzi Petrochemical
Sinopec Zenhai Refining and Chemical
Fujian Refining & Petrochemical
Other
Sum
K/mt
Annual capacity of China
The cumulative annual world production volume of most traded aromatics is equal to 75 million tones
Other basic organic chemicalAromatics – capacity
The annual world production volume of benzene and Toluene is equal to 42 million tones, from which Europe accountsfor 7.2 million tones, US accounts only for 5.8 million tones, while Russia accounts for only 1 million tones.
The annual world production volume of Xylenes is equal to 33 million tones, from which US accounts for only 5.8 milliontones.
According to the KPMG calculation the annual world consumption volumes of aromatics are approximately equal to theproduction volumes.
Annual capacity of benzene producers
Source: Morgan Stanley Research, 2014
1,400
1,205
923
810
5,601
9,939
0 2,000 4,000 6,000 8,000 10,000 12,000
Shell
Dow Chemical
Total
ExxonMobil
Other
Sum
K/mt
Annual capacity of Western Europe producers
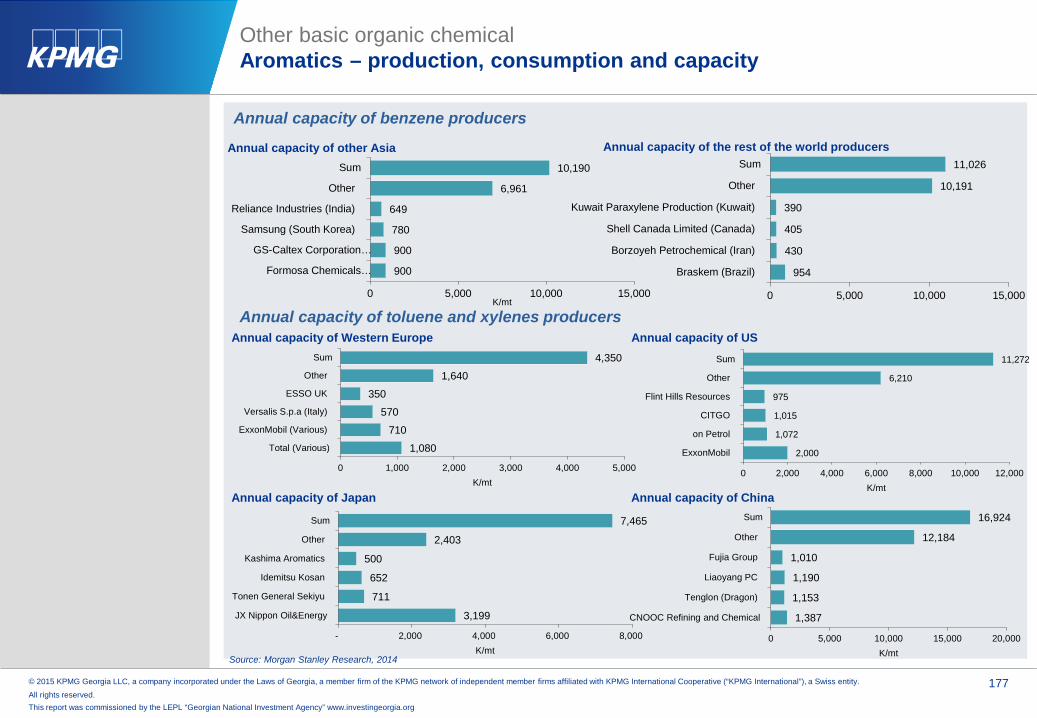
© 2015 KPMG Georgia LLC, a company incorporated under the Laws of Georgia, a member firm of the KPMG network of independent member firms affiliated with KPMG International Cooperative (“KPMG International”), a Swiss entity.
All rights reserved. 177
This report was commissioned by the LEPL “Georgian National Investment Agency” www.investingeorgia.org
Other basic organic chemicalAromatics – production, consumption and capacity
Annual capacity of benzene producers
900
900
780
649
6,961
10,190
0 5,000 10,000 15,000
Formosa Chemicals…
GS-Caltex Corporation…
Samsung (South Korea)
Reliance Industries (India)
Other
Sum
K/mt
Annual capacity of other Asia
Annual capacity of toluene and xylenes producers
1,080
710
570
350
1,640
4,350
0 1,000 2,000 3,000 4,000 5,000
Total (Various)
ExxonMobil (Various)
Versalis S.p.a (Italy)
ESSO UK
Other
Sum
K/mt
Annual capacity of Western Europe
3,199
711
652
500
2,403
7,465
- 2,000 4,000 6,000 8,000
JX Nippon Oil&Energy
Tonen General Sekiyu
Idemitsu Kosan
Kashima Aromatics
Other
Sum
K/mt
Annual capacity of Japan
1,387
1,153
1,190
1,010
12,184
16,924
0 5,000 10,000 15,000 20,000
CNOOC Refining and Chemical
Tenglon (Dragon)
Liaoyang PC
Fujia Group
Other
Sum
K/mt
Annual capacity of China
2,000
1,072
1,015
975
6,210
11,272
0 2,000 4,000 6,000 8,000 10,000 12,000
ExxonMobil
on Petrol
CITGO
Flint Hills Resources
Other
Sum
K/mt
Annual capacity of US
Source: Morgan Stanley Research, 2014
954
430
405
390
10,191
11,026
0 5,000 10,000 15,000
Braskem (Brazil)
Borzoyeh Petrochemical (Iran)
Shell Canada Limited (Canada)
Kuwait Paraxylene Production (Kuwait)
Other
SumAnnual capacity of the rest of the world producers

© 2015 KPMG Georgia LLC, a company incorporated under the Laws of Georgia, a member firm of the KPMG network of independent member firms affiliated with KPMG International Cooperative (“KPMG International”), a Swiss entity.
All rights reserved. 178
This report was commissioned by the LEPL “Georgian National Investment Agency” www.investingeorgia.org
Other basic organic chemicalAromatics – production, consumption and capacity
1,050
1,000
950
500
1,957
5,457
0 1,000 2,000 3,000 4,000 5,000 6,000
Oman Oil Co JV (Oman)
Kuwait Aromatics (Kuwait)
Borzuyeh PC (Iran)
SAFRA (Saudi Arabia)
Other
Sum
K/mt
Annual capacity of Middle East
Annual capacity of toluene and xylenes producers
Source: Morgan Stanley Research, 2014
2,375
1,815
1,795
1,745
10,539
18,269
- 5,000 10,000 15,000 20,000
Reliance Industries (India)
FCFC (Taiwan)
S-Oil
SK Global Chemical (Korea)
Other
Sum
K/mt
Annual capacity of the rest of world
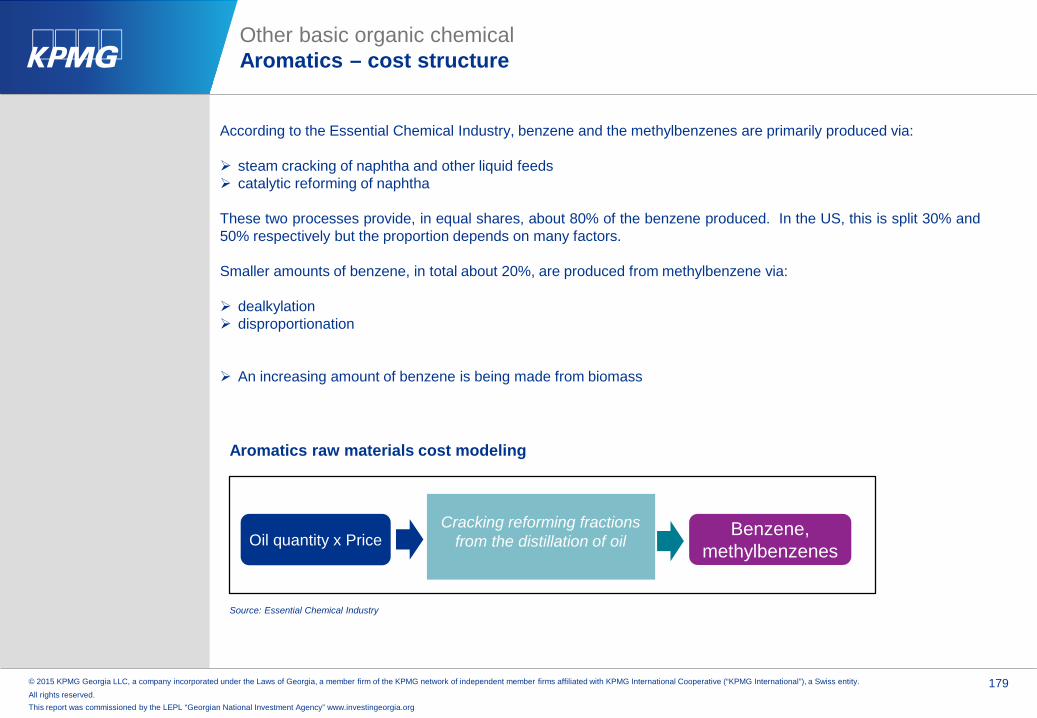
© 2015 KPMG Georgia LLC, a company incorporated under the Laws of Georgia, a member firm of the KPMG network of independent member firms affiliated with KPMG International Cooperative (“KPMG International”), a Swiss entity.
All rights reserved. 179
This report was commissioned by the LEPL “Georgian National Investment Agency” www.investingeorgia.org
Other basic organic chemicalAromatics – cost structure
According to the Essential Chemical Industry, benzene and the methylbenzenes are primarily produced via:
steam cracking of naphtha and other liquid feeds catalytic reforming of naphtha
These two processes provide, in equal shares, about 80% of the benzene produced. In the US, this is split 30% and50% respectively but the proportion depends on many factors.
Smaller amounts of benzene, in total about 20%, are produced from methylbenzene via:
dealkylation disproportionation
An increasing amount of benzene is being made from biomass
Source: Essential Chemical Industry
Oil quantity x Price Benzene, methylbenzenes
Cracking reforming fractions from the distillation of oil
Aromatics raw materials cost modeling

© 2015 KPMG Georgia LLC, a company incorporated under the Laws of Georgia, a member firm of the KPMG network of independent member firms affiliated with KPMG International Cooperative (“KPMG International”), a Swiss entity.
All rights reserved. 180
This report was commissioned by the LEPL “Georgian National Investment Agency” www.investingeorgia.org
Production chain for hydrocarbons, aromatics, alcohols and acids
Industrial gasesProduction chain
Main raw materials, key ratios for 2014
Raw materials Reaction Hydrocarbons
Natural oil
Reaction Alcohols Reaction Acids
Acetic acid Acrylic acid Terephthalic acid Etc.
For preparation ofacids variousreactions are used.Acids mainly areprepared by theoxidation of anumber of differentfunctional groupssuch as aldehydesor alcohols.There are alsoother methods ofpreparing the acidssuch as hydrolysisof nitriles, heatingof dicarboxylicacids, etc.
Acids and Caustics- industry average marginsP/E 17.4xReturn on Assets % 2.2%Gross Margin % 11.0%SG&A Margin % 5.8%EBIT Margin % 4.30%Net Income Margin % 3.2%
Alcohols - industry average marginsP/E 18.0xReturn on Assets % 2.4%Gross Margin % 5.2%SG&A Margin % 2.6%EBIT Margin % 2.7%Net Income Margin % 2.5%
ethylene glycol (ethanediol)
Methanol Etc.
Crude petroleum and natural gas P/E 13.2xReturn on Assets % (0.9%)Gross Margin % 8%SG&A Margin % 4.9%EBIT Margin % 1.6%Net Income Margin % 1.3%
There arethree mainways forpreparation ofalcohol, whichare synthesisof chemicalcompounds,hydrolysis ofsugar and thethird method isextraction ofalcohol fromplants. Thetechnical(chemical)alcohol isprepared y themeans ofsynthesis ofchemicalcompounds,that ishydrocarbons
Petrochemicals*P/E 12.3xReturn on Assets % 6.2%Gross Margin % 12.9%SG&A Margin % 8%EBIT Margin % 3.4%Net Income Margin % 1.8%
Oil refining
Note: As most of the hydrocarbons are petrochemicals, the key ratios for petrochemicals are presented
Aromatics

© 2015 KPMG Georgia LLC, a company incorporated under the Laws of Georgia, a member firm of the KPMG network of independent member firms affiliated with KPMG International Cooperative (“KPMG International”), a Swiss entity.
All rights reserved. 181
This report was commissioned by the LEPL “Georgian National Investment Agency” www.investingeorgia.org
The main raw material for other basic organic chemicals is natural oil
Other basic organic chemicalRaw materials
As it is illustrated in the production chain, the basic raw material for the other basic chemicals is natural oil. Alcohols areproduced from hydrocarbons by the means of synthesis, while the alcohols are raw materials for acids. Aromatics arecyclic hydrocarbons and natural oil is used as a raw material for producing hydrocarbons consequently aromatics.
35
51.1
19.9
109.4
17.35.6
0
20
40
60
80
100
120
Total NorthAmerica
Total S.and Cent.America
TotalEurope and
Eurasia
TotalMiddle East
Total Africa Total AsiaPacific
Thou
sand
mill
ion
tone
s
Reserves of oil, 2013
781.1
374.4
834.8
1329.3
418.6 392
0
200
400
600
800
1000
1200
1400
Total NorthAmerica
Total S.and Cent.America
TotalEurope and
Eurasia
TotalMiddle East
Total Africa Total AsiaPacific
Mill
ion
tone
s
Production volume of oil, 2013
1024.2
311.6
878.6
384.8
170.9
1415
0
200
400
600
800
1000
1200
1400
1600
TotalNorth
America
Total S.and Cent.America
TotalEurope
andEurasia
TotalMiddleEast
TotalAfrica
Total AsiaPacific
Mill
ion
tone
s
Consumption volume of oil, 2013
In 2013 the total trade of crude oil was equal to 1,878.3 milliontonnes. In 2013 the prices of natural oil were as follows:
Source: Deutsche BP Statistical Review of World Energy , June 2014
Source: Deutsche BP Statistical Review of World Energy , June 2014
Source: Deutsche BP Statistical Review of World Energy , June 2014
Natural oil prices, 2013
Dubai USD/bbl
Brent USD/bbl
Nigerian ForcadosUSD/bbl
West TexasIntermediateUSD/bbl
105.47 108.66 111.95 97.99
Source: Platts
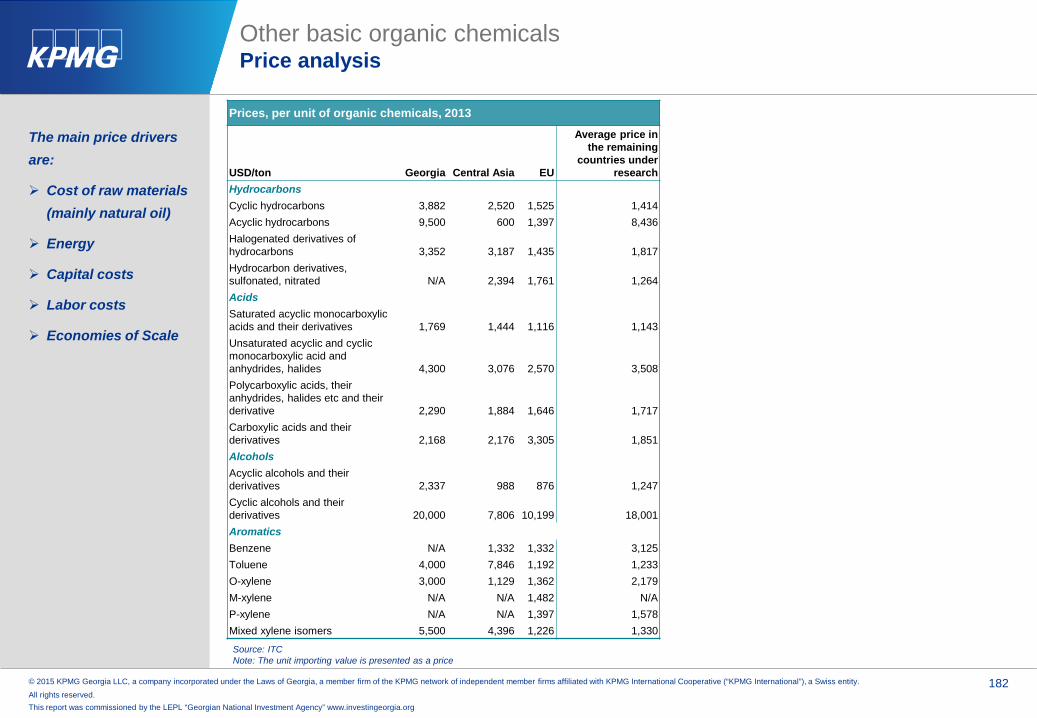
© 2015 KPMG Georgia LLC, a company incorporated under the Laws of Georgia, a member firm of the KPMG network of independent member firms affiliated with KPMG International Cooperative (“KPMG International”), a Swiss entity.
All rights reserved. 182
This report was commissioned by the LEPL “Georgian National Investment Agency” www.investingeorgia.org
Prices, per unit of organic chemicals, 2013
USD/ton Georgia Central Asia EU
Average price in the remaining
countries under research
HydrocarbonsCyclic hydrocarbons 3,882 2,520 1,525 1,414Acyclic hydrocarbons 9,500 600 1,397 8,436Halogenated derivatives of hydrocarbons 3,352 3,187 1,435 1,817Hydrocarbon derivatives, sulfonated, nitrated N/A 2,394 1,761 1,264AcidsSaturated acyclic monocarboxylic acids and their derivatives 1,769 1,444 1,116 1,143Unsaturated acyclic and cyclic monocarboxylic acid and anhydrides, halides 4,300 3,076 2,570 3,508Polycarboxylic acids, their anhydrides, halides etc and their derivative 2,290 1,884 1,646 1,717Carboxylic acids and their derivatives 2,168 2,176 3,305 1,851AlcoholsAcyclic alcohols and their derivatives 2,337 988 876 1,247Cyclic alcohols and their derivatives 20,000 7,806 10,199 18,001AromaticsBenzene N/A 1,332 1,332 3,125Toluene 4,000 7,846 1,192 1,233O-xylene 3,000 1,129 1,362 2,179M-xylene N/A N/A 1,482 N/AP-xylene N/A N/A 1,397 1,578Mixed xylene isomers 5,500 4,396 1,226 1,330
The main price drivers are:
Cost of raw materials (mainly natural oil)
Energy
Capital costs
Labor costs
Economies of Scale
Other basic organic chemicalsPrice analysis
Source: ITCNote: The unit importing value is presented as a price

© 2015 KPMG Georgia LLC, a company incorporated under the Laws of Georgia, a member firm of the KPMG network of independent member firms affiliated with KPMG International Cooperative (“KPMG International”), a Swiss entity.
All rights reserved. 183
This report was commissioned by the LEPL “Georgian National Investment Agency” www.investingeorgia.org
Other basic organic chemicalsMarket overview – Top 20 Importer Countries
Global Top 20 Importer countries by value
EU (28 including Turkey)Top 20 Importer countries by value CIS countries Importer by value
Country Import Value (USD, thousands) Country Import Value
(USD, thousands) Country Import Value (USD, thousands)
1 China 65,876,608 1 Belgium 37,561,778 1 Russian Federation 3,329,068
2United States of America 54,737,678 2 Germany 33,483,783 2 Belarus 608,070
3 Belgium 37,561,778 3 Netherlands 19,451,836 3 Kazakhstan 220,173 4 Germany 33,483,783 4 France 18,989,894 4 Uzbekistan 87,279 5 Netherlands 19,451,836 5 Italy 18,310,803 5 Azerbaijan 34,817 6 France 18,989,894 6 United Kingdom 13,011,395 6 Republic of Moldova 26,893 7 Italy 18,310,803 7 Spain 10,687,160 7 Armenia 10,698 8 India 16,960,213 8 Turkey 5,314,064 8 Kyrgyzstan 10,601 9 Japan 16,164,353 9 Austria 5,198,210 9 Tajikistan 2,548
10 Switzerland 14,579,972 10 Ireland 4,365,789 11 Korea, Republic of 14,381,568 11 Poland 3,798,647 12 United Kingdom 13,011,395 12 Sweden 2,894,840 13 Taipei, Chinese 11,738,962 13 Portugal 1,635,651 14 Brazil 10,735,824 14 Finland 1,578,432 15 Spain 10,687,160 15 Hungary 1,433,035 16 Mexico 10,030,628 16 Czech Republic 1,182,183 17 Singapore 7,330,514 17 Greece 969,419 18 Indonesia 7,011,465 18 Denmark 930,994 19 Canada 6,421,752 19 Lithuania 854,370 20 Turkey 5,314,064 20 Romania 847,079 Source: ITC
Note: In 2013 Georgian import of organic chemicals was USD 9,201 thousand.
Organic chemicals, 2013

© 2015 KPMG Georgia LLC, a company incorporated under the Laws of Georgia, a member firm of the KPMG network of independent member firms affiliated with KPMG International Cooperative (“KPMG International”), a Swiss entity.
All rights reserved. 184
This report was commissioned by the LEPL “Georgian National Investment Agency” www.investingeorgia.org
Other basic organic chemicalsMarket overview – Top 20 Importer Countries
Global Top 20 Importer countries by value
EU (28 including Turkey)Top 20 Importer countries by value CIS countries Importer by value
Country Import Value (USD, thousands) Country Import Value
(USD, thousands) Country Import Value (USD, thousands)
1 China 31,680,199 Belgium 9,624,182 Russian Federation 196,6432 Belgium 9,624,182 Netherlands 5,462,447 Belarus 62,553
3United States of America 7,203,230 Germany 4,951,076 Kazakhstan 11,831
4 Taipei, Chinese 5,582,388 France 3,176,140 Uzbekistan 4,4765 Netherlands 5,462,447 Spain 1,363,766 Azerbaijan 1,5066 Korea, Republic of 5,174,186 United Kingdom 1,315,815 Kyrgyzstan 1,2917 Germany 4,951,076 Italy 997,476 Armenia 6258 India 3,702,700 Sweden 956,983 Republic of Moldova 5009 Mexico 3,519,555 Poland 810,810 Tajikistan 29
10 France 3,176,140 Turkey 743,245 11 Indonesia 3,057,830 Finland 742,922 12 Malaysia 1,449,578 Portugal 553,501 13 Spain 1,363,766 Austria 494,965 14 Canada 1,333,350 Hungary 353,027 15 United Kingdom 1,315,815 Czech Republic 303,982 16 Singapore 1,108,620 Greece 203,348 17 Japan 1,105,556 Romania 158,596 18 Colombia 1,016,546 Slovakia 127,923 19 Thailand 1,003,065 Estonia 116,213 20 Italy 997,476 Ireland 33,219 Source: ITC
Note: In 2013 Georgian import of hydrocarbons was USD 514 thousand.
Hydrocarbons, 2013
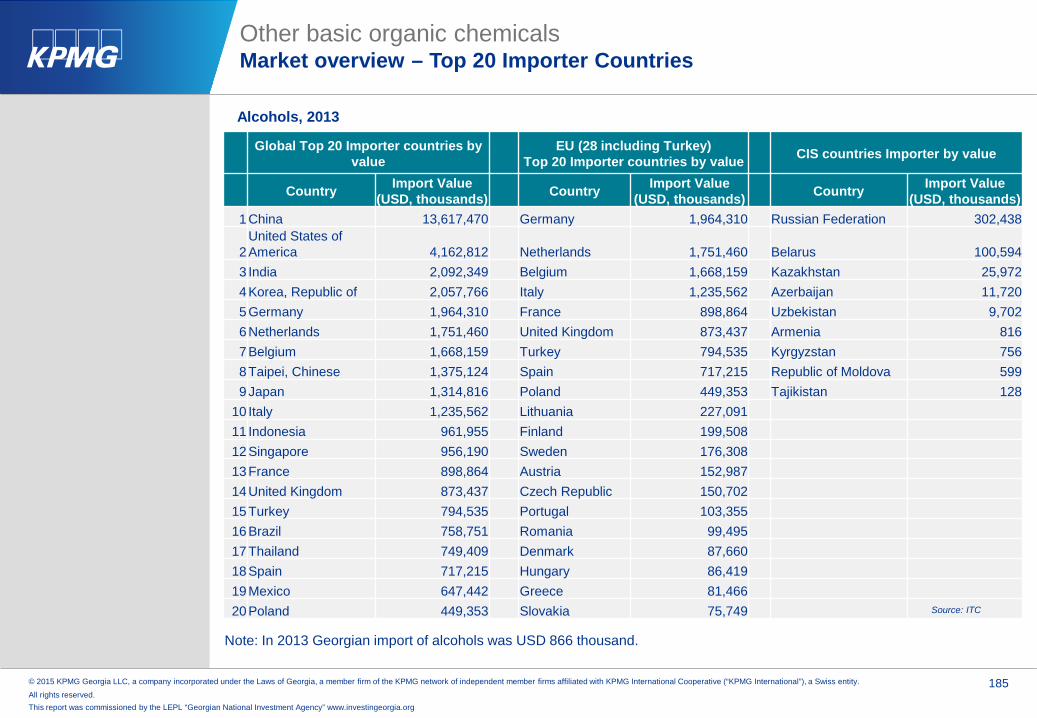
© 2015 KPMG Georgia LLC, a company incorporated under the Laws of Georgia, a member firm of the KPMG network of independent member firms affiliated with KPMG International Cooperative (“KPMG International”), a Swiss entity.
All rights reserved. 185
This report was commissioned by the LEPL “Georgian National Investment Agency” www.investingeorgia.org
Other basic organic chemicalsMarket overview – Top 20 Importer Countries
Global Top 20 Importer countries by value
EU (28 including Turkey)Top 20 Importer countries by value CIS countries Importer by value
Country Import Value (USD, thousands) Country Import Value
(USD, thousands) Country Import Value (USD, thousands)
1 China 13,617,470 Germany 1,964,310 Russian Federation 302,438
2United States of America 4,162,812 Netherlands 1,751,460 Belarus 100,594
3 India 2,092,349 Belgium 1,668,159 Kazakhstan 25,972 4 Korea, Republic of 2,057,766 Italy 1,235,562 Azerbaijan 11,720 5 Germany 1,964,310 France 898,864 Uzbekistan 9,702 6 Netherlands 1,751,460 United Kingdom 873,437 Armenia 816 7 Belgium 1,668,159 Turkey 794,535 Kyrgyzstan 756 8 Taipei, Chinese 1,375,124 Spain 717,215 Republic of Moldova 599 9 Japan 1,314,816 Poland 449,353 Tajikistan 128
10 Italy 1,235,562 Lithuania 227,091 11 Indonesia 961,955 Finland 199,508 12 Singapore 956,190 Sweden 176,308 13 France 898,864 Austria 152,987 14 United Kingdom 873,437 Czech Republic 150,702 15 Turkey 794,535 Portugal 103,355 16 Brazil 758,751 Romania 99,495 17 Thailand 749,409 Denmark 87,660 18 Spain 717,215 Hungary 86,419 19 Mexico 647,442 Greece 81,466 20 Poland 449,353 Slovakia 75,749 Source: ITC
Note: In 2013 Georgian import of alcohols was USD 866 thousand.
Alcohols, 2013

© 2015 KPMG Georgia LLC, a company incorporated under the Laws of Georgia, a member firm of the KPMG network of independent member firms affiliated with KPMG International Cooperative (“KPMG International”), a Swiss entity.
All rights reserved. 186
This report was commissioned by the LEPL “Georgian National Investment Agency” www.investingeorgia.org
Other basic organic chemicalsMarket overview – Top 20 Importer Countries
Global Top 20 Importer countries by value
EU (28 including Turkey)Top 20 Importer countries by value CIS countries Importer by value
Country Import Value (USD, thousands) Country Import Value
(USD, thousands) Country Import Value (USD, thousands)
1 China 5,705,504 Germany 3,749,920 Russian Federation 650,682
2United States of America 3,951,786 Belgium 3,306,657 Belarus 81,024
3 Germany 3,749,920 Italy 2,350,794 Kazakhstan 21,753 4 Belgium 3,306,657 Netherlands 1,994,873 Uzbekistan 21,064 5 India 3,185,291 France 1,666,074 Republic of Moldova 4,075 6 Italy 2,350,794 Spain 1,538,064 Azerbaijan 3,901 7 Netherlands 1,994,873 United Kingdom 1,390,742 Armenia 2,250 8 Japan 1,863,297 Turkey 1,363,185 Kyrgyzstan 1,088 9 France 1,666,074 Lithuania 512,317 Tajikistan 900
10 Brazil 1,551,117 Poland 398,046 11 Spain 1,538,064 Ireland 306,260 12 United Kingdom 1,390,742 Sweden 273,158 13 Turkey 1,363,185 Austria 247,375 14 Korea, Republic of 1,254,945 Finland 205,527 15 Mexico 1,112,111 Portugal 175,531 16 Taipei, Chinese 957,266 Czech Republic 140,221 17 Canada 881,111 Denmark 121,525 18 Indonesia 824,929 Luxembourg 111,285 19 Singapore 824,265 Slovenia 99,471 20 Switzerland 818,872 Greece 85,189 Source: ITC
Note: In 2013 Georgian import of acids was USD 1,865 thousand.
Acids, 2013

© 2015 KPMG Georgia LLC, a company incorporated under the Laws of Georgia, a member firm of the KPMG network of independent member firms affiliated with KPMG International Cooperative (“KPMG International”), a Swiss entity.
All rights reserved. 187
This report was commissioned by the LEPL “Georgian National Investment Agency” www.investingeorgia.org
Other basic organic chemicalsMarket overview – Top 20 Importer Countries
Global Top 20 Importer countries by value
EU (28 including Turkey)Top 20 Importer countries by value CIS countries Importer by value
Country Import Value (USD, thousands) Country Import Value
(USD, thousands) Country Import Value (USD, thousands)
1 China 15,885,110 Belgium 1,946,291 Russian Federation 29,283 2 Taipei, Chinese 2,951,184 Netherlands 1,025,003 Belarus 27,536
3United States of America 2,314,617 Germany 789,795 Kazakhstan 4,412
4 Belgium 1,946,291 Spain 453,056 Uzbekistan 143 5 Indonesia 1,467,083 France 361,095 Armenia 47 6 Mexico 1,451,979 Portugal 339,114 Kyrgyzstan 23 7 India 1,170,816 Italy 273,255 Azerbaijan 2 8 Korea, Republic of 1,029,244 United Kingdom 235,183 Tajikistan 1 9 Netherlands 1,025,003 Turkey 161,323 Republic of Moldova -
10 Germany 789,795 Czech Republic 118,825 11 Malaysia 718,525 Finland 66,093 12 Singapore 696,911 Austria 59,470 13 Saudi Arabia 642,324 Poland 52,110 14 Pakistan 509,633 Sweden 25,338 15 Spain 453,056 Bulgaria 17,885 16 France 361,095 Denmark 1,786 17 Portugal 339,114 Slovakia 1,347 18 Canada 334,219 Greece 1,041 19 Italy 273,255 Ireland 988 20 United Kingdom 235,183 Lithuania 750 Source: ITC
Note: In 2013 Georgian import of aromatics was USD 48 thousand.
Aromatics, 2013

© 2015 KPMG Georgia LLC, a company incorporated under the Laws of Georgia, a member firm of the KPMG network of independent member firms affiliated with KPMG International Cooperative (“KPMG International”), a Swiss entity.
All rights reserved. 188
This report was commissioned by the LEPL “Georgian National Investment Agency” www.investingeorgia.org
Global Top 20 Exporter countries by value
EU (28 including Turkey)Top 20 Exporter countries by value CIS countries Exporter by value
Country Export Value (USD, thousands) Country Export Value
(USD, thousands) Country Export Value (USD, thousands)
1United States of America 46,510,903 1 Belgium 40,772,783 1 Russian Federation 4,600,466
2 China 42,201,531 2 Germany 30,216,927 2 Belarus 236,024 3 Belgium 40,772,783 3 Ireland 26,798,136 3 Azerbaijan 34,705 4 Germany 30,216,927 4 Netherlands 25,460,997 4 Kazakhstan 25,683 5 Ireland 26,798,136 5 France 13,906,596 5 Uzbekistan 4,200 6 Japan 26,293,882 6 United Kingdom 12,765,620 6 Republic of Moldova 953 7 Netherlands 25,460,997 7 Italy 7,229,241 7 Kyrgyzstan 669 8 Korea, Republic of 24,856,006 8 Spain 4,945,008 8 Armenia 256 9 Switzerland 18,870,572 9 Austria 2,560,505 9 Tajikistan 10
10 Singapore 18,038,377 10 Sweden 2,370,663 11 France 13,906,596 11 Poland 1,798,494 12 India 13,340,364 12 Hungary 1,638,496 13 Saudi Arabia 13,210,626 13 Denmark 1,288,447 14 United Kingdom 12,765,620 14 Portugal 1,252,966 15 Taipei, Chinese 12,027,870 15 Finland 1,251,329 16 Italy 7,229,241 16 Czech Republic 1,237,797 17 Thailand 6,817,647 17 Turkey 598,463 18 Canada 5,056,848 18 Slovakia 414,889 19 Spain 4,945,008 19 Slovenia 290,366 20 Russian Federation 4,600,466 20 Romania 166,790
Other basic organic chemicalsMarket overview – Top 20 Exporter Countries
Source: ITC
Note: In 2013 Georgian export of organic chemicals was USD 765 thousand.
Organic chemicals, 2013
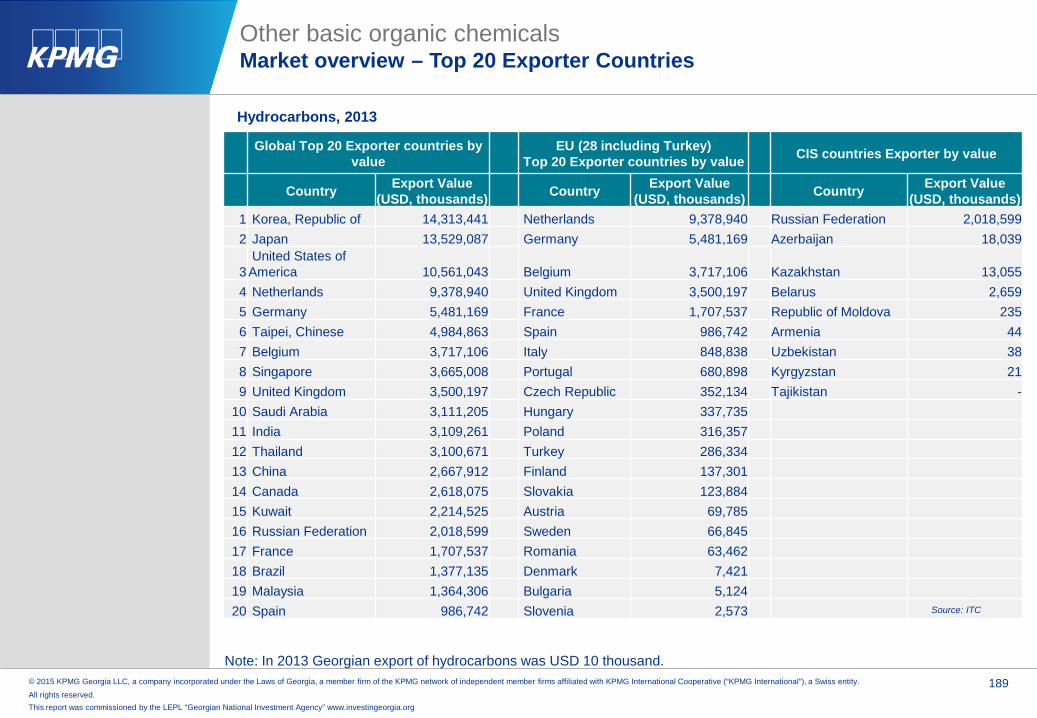
© 2015 KPMG Georgia LLC, a company incorporated under the Laws of Georgia, a member firm of the KPMG network of independent member firms affiliated with KPMG International Cooperative (“KPMG International”), a Swiss entity.
All rights reserved. 189
This report was commissioned by the LEPL “Georgian National Investment Agency” www.investingeorgia.org
Other basic organic chemicalsMarket overview – Top 20 Exporter Countries
Global Top 20 Exporter countries by value
EU (28 including Turkey)Top 20 Exporter countries by value CIS countries Exporter by value
Country Export Value (USD, thousands) Country Export Value
(USD, thousands) Country Export Value (USD, thousands)
1 Korea, Republic of 14,313,441 Netherlands 9,378,940 Russian Federation 2,018,599 2 Japan 13,529,087 Germany 5,481,169 Azerbaijan 18,039
3United States of America 10,561,043 Belgium 3,717,106 Kazakhstan 13,055
4 Netherlands 9,378,940 United Kingdom 3,500,197 Belarus 2,659 5 Germany 5,481,169 France 1,707,537 Republic of Moldova 235 6 Taipei, Chinese 4,984,863 Spain 986,742 Armenia 44 7 Belgium 3,717,106 Italy 848,838 Uzbekistan 38 8 Singapore 3,665,008 Portugal 680,898 Kyrgyzstan 21 9 United Kingdom 3,500,197 Czech Republic 352,134 Tajikistan -
10 Saudi Arabia 3,111,205 Hungary 337,735 11 India 3,109,261 Poland 316,357 12 Thailand 3,100,671 Turkey 286,334 13 China 2,667,912 Finland 137,301 14 Canada 2,618,075 Slovakia 123,884 15 Kuwait 2,214,525 Austria 69,785 16 Russian Federation 2,018,599 Sweden 66,845 17 France 1,707,537 Romania 63,462 18 Brazil 1,377,135 Denmark 7,421 19 Malaysia 1,364,306 Bulgaria 5,124 20 Spain 986,742 Slovenia 2,573 Source: ITC
Note: In 2013 Georgian export of hydrocarbons was USD 10 thousand.
Hydrocarbons, 2013

© 2015 KPMG Georgia LLC, a company incorporated under the Laws of Georgia, a member firm of the KPMG network of independent member firms affiliated with KPMG International Cooperative (“KPMG International”), a Swiss entity.
All rights reserved. 190
This report was commissioned by the LEPL “Georgian National Investment Agency” www.investingeorgia.org
Other basic organic chemicalsMarket overview – Top 20 Exporter Countries
Global Top 20 Exporter countries by value
EU (28 including Turkey)Top 20 Exporter countries by value CIS countries Exporter by value
Country Export Value (USD, thousands) Country Export Value
(USD, thousands) Country Export Value (USD, thousands)
1 Saudi Arabia 3,516,678 Netherlands 2,478,699 Russian Federation 831,194
2United States of America 2,570,342 Germany 2,336,066 Belarus 25,950
3 Singapore 2,502,065 Belgium 1,870,677 Azerbaijan 13,7344 Netherlands 2,478,699 France 326,544 Uzbekistan 7885 Germany 2,336,066 Spain 313,735 Kazakhstan 16 Taipei, Chinese 1,963,014 Poland 279,096 Tajikistan -7 Belgium 1,870,677 Finland 209,846 Armenia -8 Trinidad and Tobago 1,842,763 Italy 167,531 Kyrgyzstan -
9Iran (Islamic Republic of) 1,802,597 Sweden 123,903 Republic of Moldova -
10 Canada 1,616,461 Ireland 119,874 11 China 1,443,856 United Kingdom 117,746 12 Kuwait 1,272,027 Slovakia 47,494 13 Malaysia 1,261,279 Turkey 31,179 14 Japan 1,173,249 Czech Republic 18,756 15 Korea, Republic of 955,124 Austria 11,615 16 Russian Federation 831,194 Hungary 10,664 17 India 744,445 Bulgaria 8,728 18 Indonesia 640,976 Denmark 7,518 19 Oman 609,408 Luxembourg 7,396 20 Venezuela 595,534 Latvia 6,301
Source: ITC
Note: In 2013 Georgian export of alcohols was USD 57 thousand.
Alcohols, 2013

© 2015 KPMG Georgia LLC, a company incorporated under the Laws of Georgia, a member firm of the KPMG network of independent member firms affiliated with KPMG International Cooperative (“KPMG International”), a Swiss entity.
All rights reserved. 191
This report was commissioned by the LEPL “Georgian National Investment Agency” www.investingeorgia.org
Other basic organic chemicalsMarket overview – Top 20 Exporter Countries
Global Top 20 Exporter countries by value
EU (28 including Turkey)Top 20 Exporter countries by value CIS countries Exporter by value
Country Export Value (USD, thousands) Country Export Value
(USD, thousands) Country Export Value (USD, thousands)
1 China 6,311,132 Belgium 4,881,214 Russian Federation 250,0102 Korea, Republic of 5,436,601 Germany 3,791,766 Belarus 24,249
3United States of America 5,014,370 Netherlands 2,585,096 Uzbekistan 371
4 Belgium 4,881,214 Italy 981,034 Kazakhstan 1585 Germany 3,791,766 United Kingdom 823,729 Republic of Moldova 1016 Netherlands 2,585,096 Poland 630,849 Armenia 597 Taipei, Chinese 2,160,304 Spain 600,114 Azerbaijan -8 Thailand 1,602,592 France 360,148 Kyrgyzstan -9 Japan 1,581,134 Portugal 312,001 Tajikistan -
10 Mexico 1,337,206 Czech Republic 182,357 11 Singapore 1,287,661 Sweden 145,725 12 India 1,283,945 Ireland 110,715 13 Malaysia 1,272,942 Hungary 110,259 14 Italy 981,034 Finland 109,458 15 United Kingdom 823,729 Turkey 96,260 16 Poland 630,849 Austria 76,371 17 Spain 600,114 Estonia 52,802 18 Saudi Arabia 531,297 Denmark 46,121 19 Switzerland 446,929 Bulgaria 19,580 20 Indonesia 444,273 Lithuania 11,245 Source: ITC
Note: In 2013 Georgian export of acids was USD 313 thousand.
Acids, 2013

© 2015 KPMG Georgia LLC, a company incorporated under the Laws of Georgia, a member firm of the KPMG network of independent member firms affiliated with KPMG International Cooperative (“KPMG International”), a Swiss entity.
All rights reserved. 192
This report was commissioned by the LEPL “Georgian National Investment Agency” www.investingeorgia.org
Other basic organic chemicalsMarket overview – Top 20 Exporter Countries
Global Top 20 Exporter countries by value
EU (28 including Turkey)Top 20 Exporter countries by value CIS countries Exporter by value
Country Export Value (USD, thousands) Country Export Value
(USD, thousands) Country Export Value (USD, thousands)
1 Korea, Republic of 8,167,618 Germany 2,025,506 Russian Federation 221,741 2 Japan 6,716,385 Netherlands 1,822,667 Armenia 29
3United States of America 3,285,012 United Kingdom 965,062 Kyrgyzstan 19
4 Taipei, Chinese 2,649,370 Belgium 863,257 Kazakhstan 3 5 India 2,538,255 Portugal 294,885 Belarus -6 Thailand 2,339,569 Turkey 250,789 Azerbaijan -7 Germany 2,025,506 Hungary 185,281 Republic of Moldova -8 Netherlands 1,822,667 Spain 160,378 Uzbekistan -9 Singapore 1,728,168 Slovakia 115,095 Tajikistan -
10 Kuwait 1,362,752 Poland 87,620 11 Malaysia 1,044,672 France 86,474 12 United Kingdom 965,062 Czech Republic 72,995 13 Belgium 863,257 Romania 49,035 14 Brazil 667,276 Italy 36,515 15 Israel 559,194 Sweden 1,032 16 China 391,867 Austria 492 17 Oman 380,186 Denmark 476 18 Portugal 294,885 Lithuania 421 19 Canada 253,349 Slovenia 391 20 Turkey 250,789 Latvia 256 Source: ITC
Note: In 2013 Georgian export of aromatics was USD 0 thousand.
Aromatics, 2013
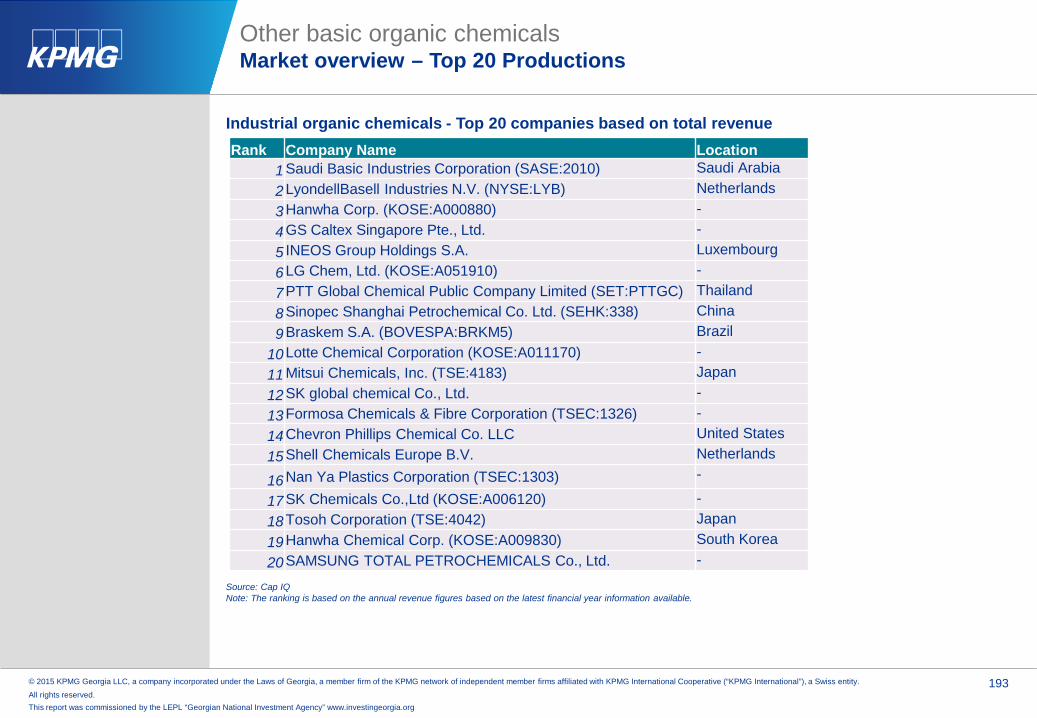
© 2015 KPMG Georgia LLC, a company incorporated under the Laws of Georgia, a member firm of the KPMG network of independent member firms affiliated with KPMG International Cooperative (“KPMG International”), a Swiss entity.
All rights reserved. 193
This report was commissioned by the LEPL “Georgian National Investment Agency” www.investingeorgia.org
Other basic organic chemicalsMarket overview – Top 20 Productions
Industrial organic chemicals - Top 20 companies based on total revenue Rank Company Name Location
1 Saudi Basic Industries Corporation (SASE:2010) Saudi Arabia2 LyondellBasell Industries N.V. (NYSE:LYB) Netherlands3 Hanwha Corp. (KOSE:A000880) -4 GS Caltex Singapore Pte., Ltd. -5 INEOS Group Holdings S.A. Luxembourg6 LG Chem, Ltd. (KOSE:A051910) -7 PTT Global Chemical Public Company Limited (SET:PTTGC) Thailand8 Sinopec Shanghai Petrochemical Co. Ltd. (SEHK:338) China9 Braskem S.A. (BOVESPA:BRKM5) Brazil
10 Lotte Chemical Corporation (KOSE:A011170) -11 Mitsui Chemicals, Inc. (TSE:4183) Japan12 SK global chemical Co., Ltd. -13 Formosa Chemicals & Fibre Corporation (TSEC:1326) -14 Chevron Phillips Chemical Co. LLC United States15 Shell Chemicals Europe B.V. Netherlands
16 Nan Ya Plastics Corporation (TSEC:1303) -
17 SK Chemicals Co.,Ltd (KOSE:A006120) -18 Tosoh Corporation (TSE:4042) Japan19 Hanwha Chemical Corp. (KOSE:A009830) South Korea20 SAMSUNG TOTAL PETROCHEMICALS Co., Ltd. -
Source: Cap IQNote: The ranking is based on the annual revenue figures based on the latest financial year information available.

© 2015 KPMG Georgia LLC, a company incorporated under the Laws of Georgia, a member firm of the KPMG network of independent member firms affiliated with KPMG International Cooperative (“KPMG International”), a Swiss entity.
All rights reserved. 194
This report was commissioned by the LEPL “Georgian National Investment Agency” www.investingeorgia.org
Other basic organic chemicalsMarket overview – Top 20 Productions
Petrochemicals - Top 20 companies based on total revenue Rank Company Name Location
1 LyondellBasell Industries N.V. (NYSE:LYB) Netherlands2 Hanwha Corp. (KOSE:A000880) -3 GS Caltex Singapore Pte., Ltd. -4 INEOS Group Holdings S.A. Luxembourg5 LG Chem, Ltd. (KOSE:A051910) -6 PTT Global Chemical Public Company Limited (SET:PTTGC) Thailand7 Sinopec Shanghai Petrochemical Co. Ltd. (SEHK:338) China8 Braskem S.A. (BOVESPA:BRKM5) Brazil9 Lotte Chemical Corporation (KOSE:A011170) -
10 Mitsui Chemicals, Inc. (TSE:4183) Japan11 SK global chemical Co., Ltd. -12 Formosa Chemicals & Fibre Corporation (TSEC:1326) -13 Chevron Phillips Chemical Co. LLC United States14 Shell Chemicals Europe B.V. Netherlands15 Nan Ya Plastics Corporation (TSEC:1303) -
16 Hanwha Chemical Corp. (KOSE:A009830) South Korea
17 SAMSUNG TOTAL PETROCHEMICALS Co., Ltd. -18 Yeochun NCC Co., Ltd. -19 Formosa Plastics Corporation (TSEC:1301) -20 National Petrochemical Company Ltd. -
Source: Cap IQNote: The ranking is based on the annual revenue figures based on the latest financial year information available.

© 2015 KPMG Georgia LLC, a company incorporated under the Laws of Georgia, a member firm of the KPMG network of independent member firms affiliated with KPMG International Cooperative (“KPMG International”), a Swiss entity.
All rights reserved. 195
This report was commissioned by the LEPL “Georgian National Investment Agency” www.investingeorgia.org
Other basic organic chemicalsMarket overview – Top 20 Productions
Acids and caustics - Top 20 companies based on total revenue Rank Company Name Location
1 PTT Global Chemical Public Company Limited (SET:PTTGC) Thailand2 Hyosung Corp. (KOSE:A004800) -3 Hanwha Chemical Corp. (KOSE:A009830) South Korea4 Formosa Plastics Corporation (TSEC:1301) -5 Westlake Chemical Corp. (NYSE:WLK) United States6 Inner Mongolia Yili Energy Company Limited (SHSE:600277) -7 AK Holdings, Inc. (KOSE:A006840) -8 UPC Technology Corporation (TSEC:1313) -9 Mitsui Chemicals Polyurethanes, Inc. -
10 SYRAL Belgium N.V. Belgium11 Samnam Petrochemical Co., Ltd. -12 Kureha Corporation (TSE:4023) -13 Chemiphos SA (Pty) Ltd. South Africa14 China Petrochemical Development Corp. (TSEC:1314) -15 Ciech SA (WSE:CIE) Poland
16 Tongsuh Petrochemical Corp., Ltd. -
17 Rhodia Polyamide Intermediates SAS -18 Siam Mitsui PTA Co., Ltd. -19 Gadiv Petrochemical Industries Ltd. -20 Befar Group Co., Ltd. (SHSE:601678) -
Source: Cap IQNote: (1) The ranking is based on the annual revenue figures based on the latest financial year information available.
(2) Companies producing inorganic acids may also be included
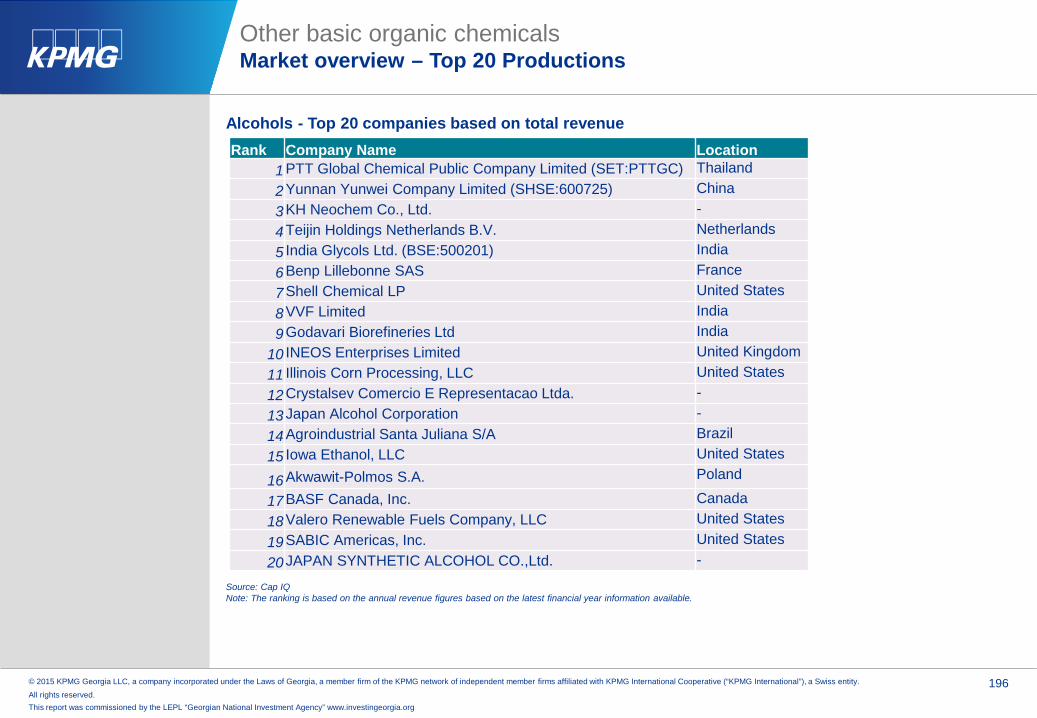
© 2015 KPMG Georgia LLC, a company incorporated under the Laws of Georgia, a member firm of the KPMG network of independent member firms affiliated with KPMG International Cooperative (“KPMG International”), a Swiss entity.
All rights reserved. 196
This report was commissioned by the LEPL “Georgian National Investment Agency” www.investingeorgia.org
Other basic organic chemicalsMarket overview – Top 20 Productions
Alcohols - Top 20 companies based on total revenue Rank Company Name Location
1 PTT Global Chemical Public Company Limited (SET:PTTGC) Thailand2 Yunnan Yunwei Company Limited (SHSE:600725) China3 KH Neochem Co., Ltd. -4 Teijin Holdings Netherlands B.V. Netherlands5 India Glycols Ltd. (BSE:500201) India6 Benp Lillebonne SAS France7 Shell Chemical LP United States8 VVF Limited India9 Godavari Biorefineries Ltd India
10 INEOS Enterprises Limited United Kingdom11 Illinois Corn Processing, LLC United States12 Crystalsev Comercio E Representacao Ltda. -13 Japan Alcohol Corporation -14 Agroindustrial Santa Juliana S/A Brazil15 Iowa Ethanol, LLC United States
16 Akwawit-Polmos S.A. Poland
17 BASF Canada, Inc. Canada18 Valero Renewable Fuels Company, LLC United States19 SABIC Americas, Inc. United States20 JAPAN SYNTHETIC ALCOHOL CO.,Ltd. -
Source: Cap IQNote: The ranking is based on the annual revenue figures based on the latest financial year information available.

© 2015 KPMG Georgia LLC, a company incorporated under the Laws of Georgia, a member firm of the KPMG network of independent member firms affiliated with KPMG International Cooperative (“KPMG International”), a Swiss entity.
All rights reserved. 197
This report was commissioned by the LEPL “Georgian National Investment Agency” www.investingeorgia.org
Other basic organic chemicalsMarket overview – Top 20 Productions
Aromatics - Top 20 companies based on total revenue Rank Company Name Location
1 ExxonMobil United States2 JX Nippon Oil & Energy Corp Japan3 Reliance Industries India4 FCFC Taiwan5 S-Oil -6 SK Global Chemical Korea7 Shell -8 CNOOC Refining and Chemical China9 Dow Chemical -
10 Liaoyang PC China11 Tenglon (Dragon) China12 Marathon Petrol United States13 Total -14 Oman Oil Co JV Oman15 CITGO United States
16 Fujia Group China
17 Kuwait Aromatics Kuwait18 Flint Hills Resources United States19 Borzuyeh PC Iran20 Formosa Chemicals Taiwan
Source: Morgan Stanley Research, 2014Note: The ranking is based on the annual revenue figures based on the latest financial year information available.
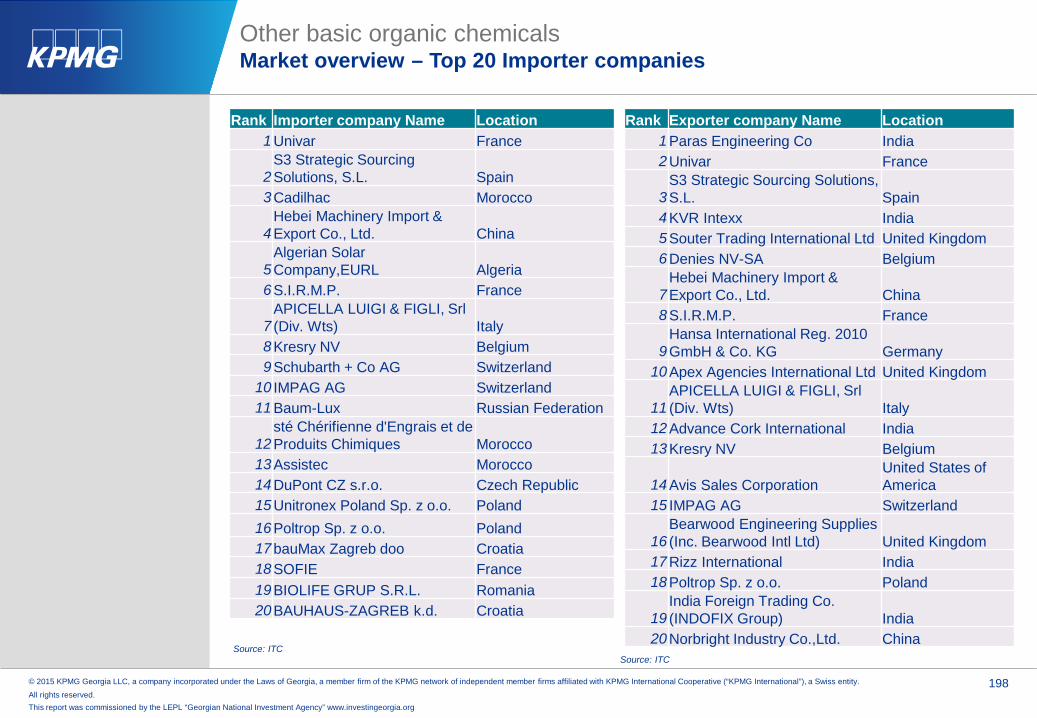
© 2015 KPMG Georgia LLC, a company incorporated under the Laws of Georgia, a member firm of the KPMG network of independent member firms affiliated with KPMG International Cooperative (“KPMG International”), a Swiss entity.
All rights reserved. 198
This report was commissioned by the LEPL “Georgian National Investment Agency” www.investingeorgia.org
Other basic organic chemicalsMarket overview – Top 20 Importer companies
Rank Importer company Name Location1 Univar France
2S3 Strategic Sourcing Solutions, S.L. Spain
3 Cadilhac Morocco
4Hebei Machinery Import & Export Co., Ltd. China
5Algerian Solar Company,EURL Algeria
6 S.I.R.M.P. France
7APICELLA LUIGI & FIGLI, Srl (Div. Wts) Italy
8 Kresry NV Belgium9 Schubarth + Co AG Switzerland
10 IMPAG AG Switzerland11 Baum-Lux Russian Federation
12sté Chérifienne d'Engrais et de Produits Chimiques Morocco
13 Assistec Morocco14 DuPont CZ s.r.o. Czech Republic15 Unitronex Poland Sp. z o.o. Poland16 Poltrop Sp. z o.o. Poland17 bauMax Zagreb doo Croatia18 SOFIE France19 BIOLIFE GRUP S.R.L. Romania20 BAUHAUS-ZAGREB k.d. Croatia
Source: ITC
Rank Exporter company Name Location1 Paras Engineering Co India2 Univar France
3S3 Strategic Sourcing Solutions, S.L. Spain
4 KVR Intexx India5 Souter Trading International Ltd United Kingdom6 Denies NV-SA Belgium
7Hebei Machinery Import & Export Co., Ltd. China
8 S.I.R.M.P. France
9Hansa International Reg. 2010 GmbH & Co. KG Germany
10 Apex Agencies International Ltd United Kingdom
11APICELLA LUIGI & FIGLI, Srl (Div. Wts) Italy
12 Advance Cork International India13 Kresry NV Belgium
14 Avis Sales CorporationUnited States of America
15 IMPAG AG Switzerland
16Bearwood Engineering Supplies (Inc. Bearwood Intl Ltd) United Kingdom
17 Rizz International India18 Poltrop Sp. z o.o. Poland
19India Foreign Trading Co. (INDOFIX Group) India
20 Norbright Industry Co.,Ltd. ChinaSource: ITC

© 2015 KPMG Georgia LLC, a company incorporated under the Laws of Georgia, a member firm of the KPMG network of independent member firms affiliated with KPMG International Cooperative (“KPMG International”), a Swiss entity.
All rights reserved. 199
This report was commissioned by the LEPL “Georgian National Investment Agency” www.investingeorgia.org
In 2014 the total importof organic chemicalswas equal to USD 11,346thousand
Source: ITC
In 2013 Georgia was mostlyimporting from Switzerland,which had 19% share in thetotal import of Georgia.
In 2013 the mosty importedorganic chemical by Georgiawas carboxylic acids andtheir derivatives withimporting share equal to 7%.
Source: ITCSource: ITC
Other basic organic chemicalsGeorgia – organic chemicals import
19%
18%
13%10%
7%
5%
4%
4%
2%2%
16%
Organic chemistry import structure by countries, 2014
Switzerland
Turkey
China
Germany
India
Italy
Spain
Netherlands
United States of America
France
Other
33%
7%
7%6%6%
5%
5%
4%
3%
3%
21%
Organic chemical import structure by product type in 2014Organic compounds, nes
Carboxylic acids and their derivatives
Acyclic alcohols and their derivatives
Saturated acyclic monocarboxylic acids and their derivatives
Oxygen-function amino-compounds
Compounds with other nitrogen function
Organo-sulphur compounds
Heterocyclic compounds with nitrogen hetero-atom; nucleic acids and thei
Halogenated derivatives of hydrocarbons
Aldehyde;cyclic polymer of aldehyde;paraformaldehyde
Other
8,583 7,676
9,023 9,825
9,201
11,346
(10.6%)
17.5%
8.9%
(6.4%)
23.3%
-15%
-10%
-5%
0%
5%
10%
15%
20%
25%
30%
-
2,000
4,000
6,000
8,000
10,000
12,000
2009 2010 2011 2012 2013 2014
Import of organic chemistry in 2009 - 2014, USD thousand
Organic chemistry Growth rate
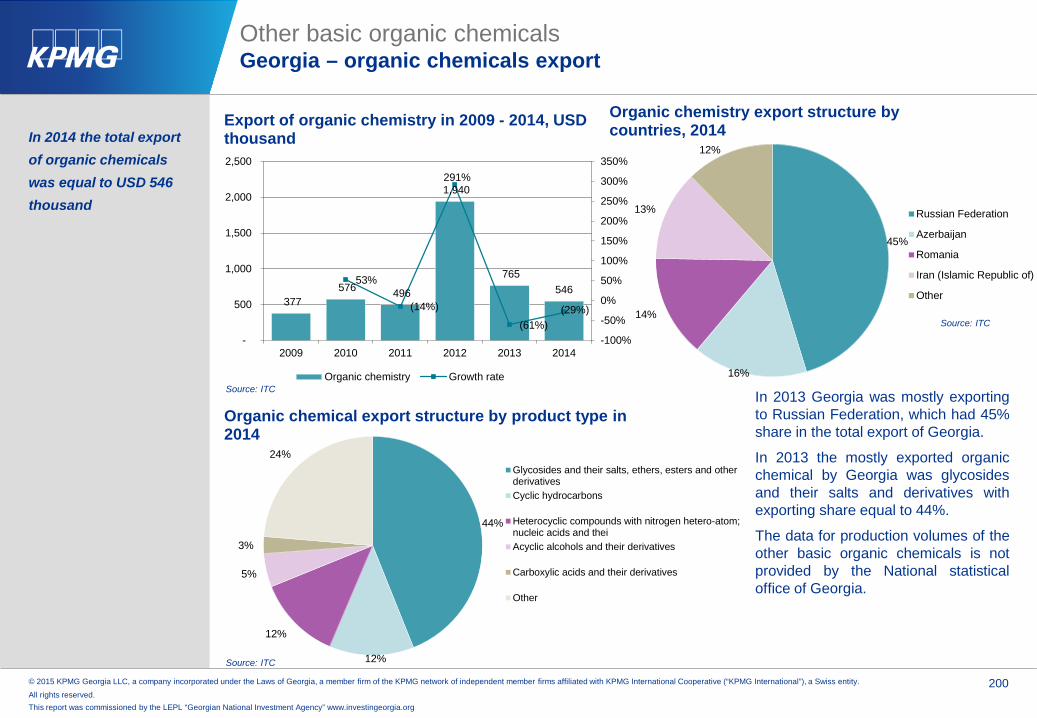
© 2015 KPMG Georgia LLC, a company incorporated under the Laws of Georgia, a member firm of the KPMG network of independent member firms affiliated with KPMG International Cooperative (“KPMG International”), a Swiss entity.
All rights reserved. 200
This report was commissioned by the LEPL “Georgian National Investment Agency” www.investingeorgia.org
45%
16%
14%
13%
12%
Organic chemistry export structure by countries, 2014
Russian Federation
Azerbaijan
Romania
Iran (Islamic Republic of)
Other
In 2014 the total exportof organic chemicalswas equal to USD 546thousand
Source: ITC
In 2013 Georgia was mostly exportingto Russian Federation, which had 45%share in the total export of Georgia.
In 2013 the mostly exported organicchemical by Georgia was glycosidesand their salts and derivatives withexporting share equal to 44%.
The data for production volumes of theother basic organic chemicals is notprovided by the National statisticaloffice of Georgia.
Source: ITC
Source: ITC
Other basic organic chemicalsGeorgia – organic chemicals export
44%
12%
12%
5%
3%
24%
Organic chemical export structure by product type in 2014
Glycosides and their salts, ethers, esters and otherderivativesCyclic hydrocarbons
Heterocyclic compounds with nitrogen hetero-atom;nucleic acids and theiAcyclic alcohols and their derivatives
Carboxylic acids and their derivatives
Other
377 576 496
1,940
765 546
53%
(14%)
291%
(61%)(29%)
-100%
-50%
0%
50%
100%
150%
200%
250%
300%
350%
-
500
1,000
1,500
2,000
2,500
2009 2010 2011 2012 2013 2014
Export of organic chemistry in 2009 - 2014, USD thousand
Organic chemistry Growth rate
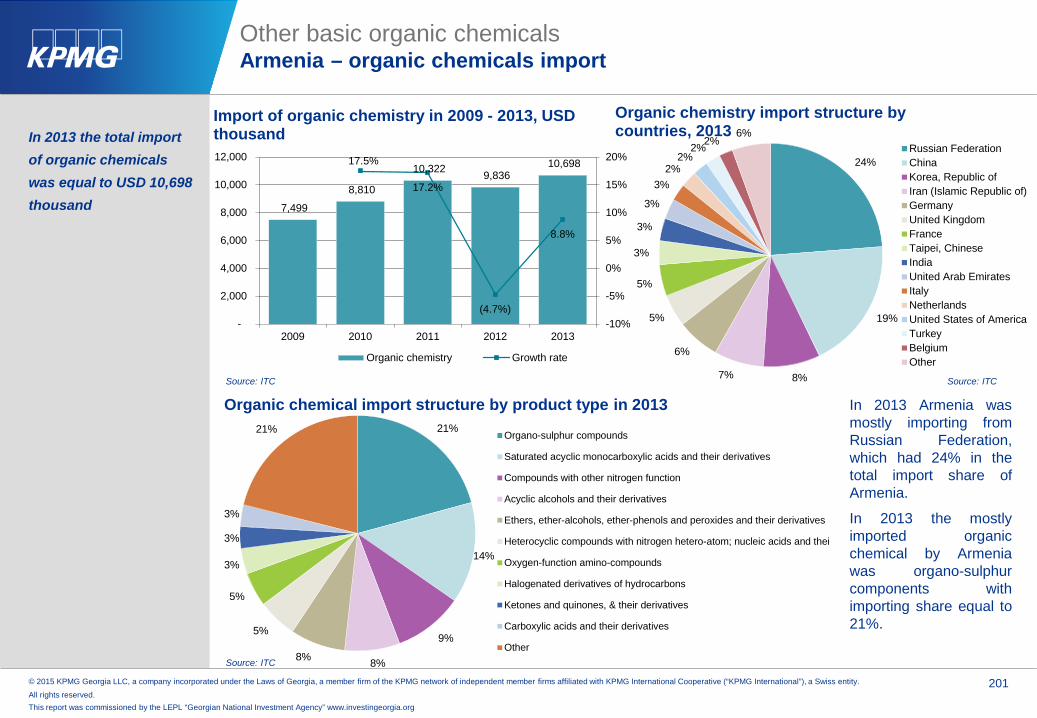
© 2015 KPMG Georgia LLC, a company incorporated under the Laws of Georgia, a member firm of the KPMG network of independent member firms affiliated with KPMG International Cooperative (“KPMG International”), a Swiss entity.
All rights reserved. 201
This report was commissioned by the LEPL “Georgian National Investment Agency” www.investingeorgia.org
In 2013 the total import of organic chemicalswas equal to USD 10,698thousand
Source: ITC
In 2013 Armenia wasmostly importing fromRussian Federation,which had 24% in thetotal import share ofArmenia.
In 2013 the mostlyimported organicchemical by Armeniawas organo-sulphurcomponents withimporting share equal to21%.
Source: ITC Source: ITC
Other basic organic chemicalsArmenia – organic chemicals import
24%
19%
8%7%
6%
5%
5%
3%
3%
3%
3%2%
2%2%2%
6%
Organic chemistry import structure by countries, 2013
Russian FederationChinaKorea, Republic ofIran (Islamic Republic of)GermanyUnited KingdomFranceTaipei, ChineseIndiaUnited Arab EmiratesItalyNetherlandsUnited States of AmericaTurkeyBelgiumOther
21%
14%
9%
8%8%
5%
5%
3%
3%
3%
21%
Organic chemical import structure by product type in 2013
Organo-sulphur compounds
Saturated acyclic monocarboxylic acids and their derivatives
Compounds with other nitrogen function
Acyclic alcohols and their derivatives
Ethers, ether-alcohols, ether-phenols and peroxides and their derivatives
Heterocyclic compounds with nitrogen hetero-atom; nucleic acids and thei
Oxygen-function amino-compounds
Halogenated derivatives of hydrocarbons
Ketones and quinones, & their derivatives
Carboxylic acids and their derivatives
Other
7,499
8,810
10,322 9,836 10,698 17.5%
17.2%
(4.7%)
8.8%
-10%
-5%
0%
5%
10%
15%
20%
-
2,000
4,000
6,000
8,000
10,000
12,000
2009 2010 2011 2012 2013
Import of organic chemistry in 2009 - 2013, USD thousand
Organic chemistry Growth rate

© 2015 KPMG Georgia LLC, a company incorporated under the Laws of Georgia, a member firm of the KPMG network of independent member firms affiliated with KPMG International Cooperative (“KPMG International”), a Swiss entity.
All rights reserved. 202
This report was commissioned by the LEPL “Georgian National Investment Agency” www.investingeorgia.org
In 2013 the total export of organic chemicalswas equal to USD 256 thousand
Source: ITC
In 2013 Armenia wasmostly exporting toBelgium, which had 26%share in the total exportof Armenia.
In 2013 the mostlyexported organicchemical by Armeniawas heterocycliccompounds withnitrogen hetero-atom;nucleic acids and theiwith exporting shareequal to 20%.
Source: ITC Source: ITC
Other basic organic chemicalsArmenia – organic chemicals export
26%
19%
15%
12%
8%
20%
Organic chemistry export structure by countries, 2013
Belgium
Ukraine
Georgia
Germany
Belarus
Other
20%
16%
11%7%
5%
5%
5%
5%
5%
21%
Organic chemical export structure by product type in 2013
Heterocyclic compounds with nitrogen hetero-atom; nucleic acids & thei
Polycarboxylic acids, their anhydrides, halides etc & their derivative
Cyclic hydrocarbons
Organo-sulphur compounds
Carboxyamid-functn compound;amide function compound of carbonic acid
Halogenated derivatives of hydrocarbons
Ethers, ether-alcohols, ether-phenols & peroxides & thier derivatives
Saturated acyclic monocarboxylic acids & their derivatives
Ketones & quinones, & their derivatives
Other
317
482 450
389
256
52%
(7%)(14%)
(34%)-40%
-30%
-20%
-10%
0%
10%
20%
30%
40%
50%
60%
-
100
200
300
400
500
600
2009 2010 2011 2012 2013
Export of organic chemistry in 2009 - 2013, USD thousand
Organic chemistry Growth rate

© 2015 KPMG Georgia LLC, a company incorporated under the Laws of Georgia, a member firm of the KPMG network of independent member firms affiliated with KPMG International Cooperative (“KPMG International”), a Swiss entity.
All rights reserved. 203
This report was commissioned by the LEPL “Georgian National Investment Agency” www.investingeorgia.org
485
719
93748.2%
30.3%
0%
10%
20%
30%
40%
50%
60%
0100200300400500600700800900
1000
2012 2013 2014
US
D th
ousa
nd
Production and consumption of other basic chemicals
Production volume Growth rate
For the period of 2012-2014 the consumption and production volumes of other basic chemicals were growing reaching USD 937 thousand in 2014
Source: National Statistical Service of the Republic of Armenia
Other basic organic chemicalsArmenia – organic chemicals production and consumption
For the period of 2012-2014 the compound annual growth of production and consumption of the other basic chemicalswas equal to approximately 39% in Armenia.
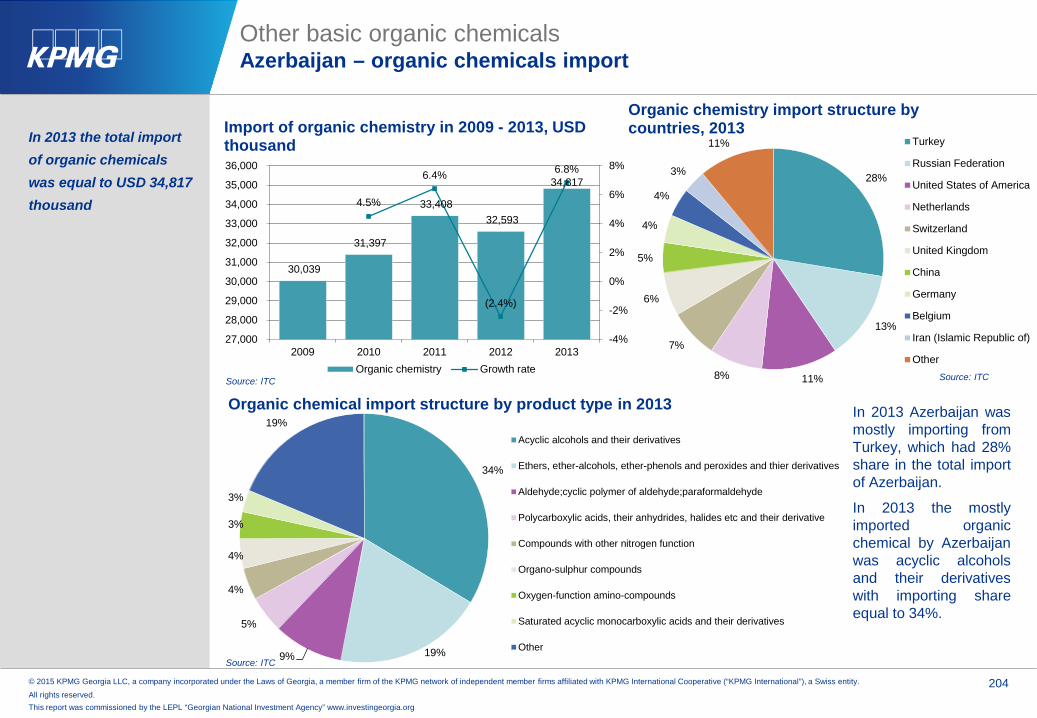
© 2015 KPMG Georgia LLC, a company incorporated under the Laws of Georgia, a member firm of the KPMG network of independent member firms affiliated with KPMG International Cooperative (“KPMG International”), a Swiss entity.
All rights reserved. 204
This report was commissioned by the LEPL “Georgian National Investment Agency” www.investingeorgia.org
In 2013 the total import of organic chemicalswas equal to USD 34,817thousand
Source: ITC
In 2013 Azerbaijan wasmostly importing fromTurkey, which had 28%share in the total importof Azerbaijan.
In 2013 the mostlyimported organicchemical by Azerbaijanwas acyclic alcoholsand their derivativeswith importing shareequal to 34%.
Source: ITC Source: ITC
Other basic organic chemicalsAzerbaijan – organic chemicals import
28%
13%
11%8%
7%
6%
5%
4%
4%
3%
11%
Organic chemistry import structure by countries, 2013
Turkey
Russian Federation
United States of America
Netherlands
Switzerland
United Kingdom
China
Germany
Belgium
Iran (Islamic Republic of)
Other
34%
19%9%
5%
4%
4%
3%
3%
19%Organic chemical import structure by product type in 2013
Acyclic alcohols and their derivatives
Ethers, ether-alcohols, ether-phenols and peroxides and thier derivatives
Aldehyde;cyclic polymer of aldehyde;paraformaldehyde
Polycarboxylic acids, their anhydrides, halides etc and their derivative
Compounds with other nitrogen function
Organo-sulphur compounds
Oxygen-function amino-compounds
Saturated acyclic monocarboxylic acids and their derivatives
Other
30,039
31,397
33,408 32,593
34,817
4.5%
6.4%
(2.4%)
6.8%
-4%
-2%
0%
2%
4%
6%
8%
27,000
28,000
29,000
30,000
31,000
32,000
33,000
34,000
35,000
36,000
2009 2010 2011 2012 2013
Import of organic chemistry in 2009 - 2013, USD thousand
Organic chemistry Growth rate

© 2015 KPMG Georgia LLC, a company incorporated under the Laws of Georgia, a member firm of the KPMG network of independent member firms affiliated with KPMG International Cooperative (“KPMG International”), a Swiss entity.
All rights reserved. 205
This report was commissioned by the LEPL “Georgian National Investment Agency” www.investingeorgia.org
In 2013 the total exportof organic chemicalswas equal to USD 34,705thousand
Source: ITC
In 2013 Azerbaijan wasmostly exporting to RussianFederation, which had 29%share in the total export ofAzerbaijan.
In 2013 the mostly exportedorganic chemical byAzerbaijan was acyclichydrocarbons withexporting share equal to52%.
Source: ITC Source: ITC
Other basic organic chemicalsAzerbaijan – organic chemicals export
29%
24%17%
9%
7%
5%4%
5%
Organic chemistry export structure by countries, 2013
Russian Federation
Poland
Turkey
Belarus
China
Ukraine
Spain
Other
52%
40%
7% 1%
Organic chemical export structure by product type in 2013
Acyclic hydrocarbons
Acyclic alcohols and their derivatives
Glycosides & their salts, ethers, esters & other derivatives
Ethers, ether-alcohols, ether-phenols & peroxides & thierderivatives
19,552
33,280
53,221
39,719 34,705
70% 60%
(25%)
(13%)
-40%
-20%
0%
20%
40%
60%
80%
-
10,000
20,000
30,000
40,000
50,000
60,000
2009 2010 2011 2012 2013
Export of organic chemistry in 2009 - 2013, USD thousand
Organic chemistry Growth rate

© 2015 KPMG Georgia LLC, a company incorporated under the Laws of Georgia, a member firm of the KPMG network of independent member firms affiliated with KPMG International Cooperative (“KPMG International”), a Swiss entity.
All rights reserved. 206
This report was commissioned by the LEPL “Georgian National Investment Agency” www.investingeorgia.org
In 2013 the total production volume andvalue of hydrocarbonswas estimated to equalto 1,169 thousand b.o.eand USD 43 billionrespectively
Other basic organic chemicalsAzerbaijan – organic chemicals production
Source: Business Monitor International
Source: Business Monitor International
1,154 1,169 1,164 1,206 1,248 1,265 1,369
1,492 1,518 1,504 1,490 1,466
(2.6%)
1.3%
(0.5%)
3.6% 3.5%
1.3%
8.2%9.0%
1.7%
(1.0%) (0.9%)(1.6%)
-4%
-2%
0%
2%
4%
6%
8%
10%
-
200
400
600
800
1,000
1,200
1,400
1,600
2012 2013 2014 2015 2016 2017 2018 2019 2020 2021 2022 2023
Thou
sand
b.o
.e.
Hydrocarbon production volume estimation, 2012-2023
Production volume Growth rate
4443
41
38 38 38
41
4445
44 44 44
(1.1%)(2.3%)
(3.8%)
(9.2%)
0.3% -
7.6% 7.8%
2.3%
(1.1%)(0.1%) (0.6%)
-12%
-10%
-8%
-6%
-4%
-2%
0%
2%
4%
6%
8%
10%
34
36
38
40
42
44
46
2012 2013 2014 2015 2016 2017 2018 2019 2020 2021 2022 2023
US
D b
illio
b
Hydrocarbon production value estimation, 2012-2023
Production value Growth rate

© 2015 KPMG Georgia LLC, a company incorporated under the Laws of Georgia, a member firm of the KPMG network of independent member firms affiliated with KPMG International Cooperative (“KPMG International”), a Swiss entity.
All rights reserved. 207
This report was commissioned by the LEPL “Georgian National Investment Agency” www.investingeorgia.org
In 2013 the total consumption volumeand value ofhydrocarbons wasestimated to equal to243 thousand b.o.e andUSD 8 billionrespectively
Other basic organic chemicalsAzerbaijan – organic chemicals consumption
Source: Business Monitor International
The State Statistical Committee ofAzerbaijan provides information only onproduction volumes of isopropyl alcoholwhich equals to 13,825 tones in 2013.According to KPMG calculations in 2013Azerbaijan exported all the producedisopropyl alcohol and the domesticconsumption was approximately equal to0.
The State Statistical Committee ofAzerbaijan provided no data on theproduction volumes of the acids andaromatics.
Source: Business Monitor International
241 243 248 253 259 266 271 278 284 293 302 31110.4%
0.9%1.9% 2.1% 2.2% 2.6% 2.3% 2.3% 2.3%
3.2% 3.0% 2.9%
0%
2%
4%
6%
8%
10%
12%
0
50
100
150
200
250
300
350
2012 2013 2014 2015 2016 2017 2018 2019 2020 2021 2022 2023
Thou
sand
b.o
.e.
Hydrocarbon consumption volume estimation, 2012-2023
Consumption volume Growth rate
98 8
8 8 88
88
89
9
12.6%
(2.8%)(0.8%)
(8.1%)
(1.3%)
0.7% 2.1%
1.3%2.6% 3.0%
2.6%
4.8%
-10%
-5%
0%
5%
10%
15%
7
7
8
8
9
9
10
2012 2013 2014 2015 2016 2017 2018 2019 2020 2021 2022 2023
US
D b
illio
n
Hydrocarbon consumption value estimation, 2012-2023
Consumption value Growth rate
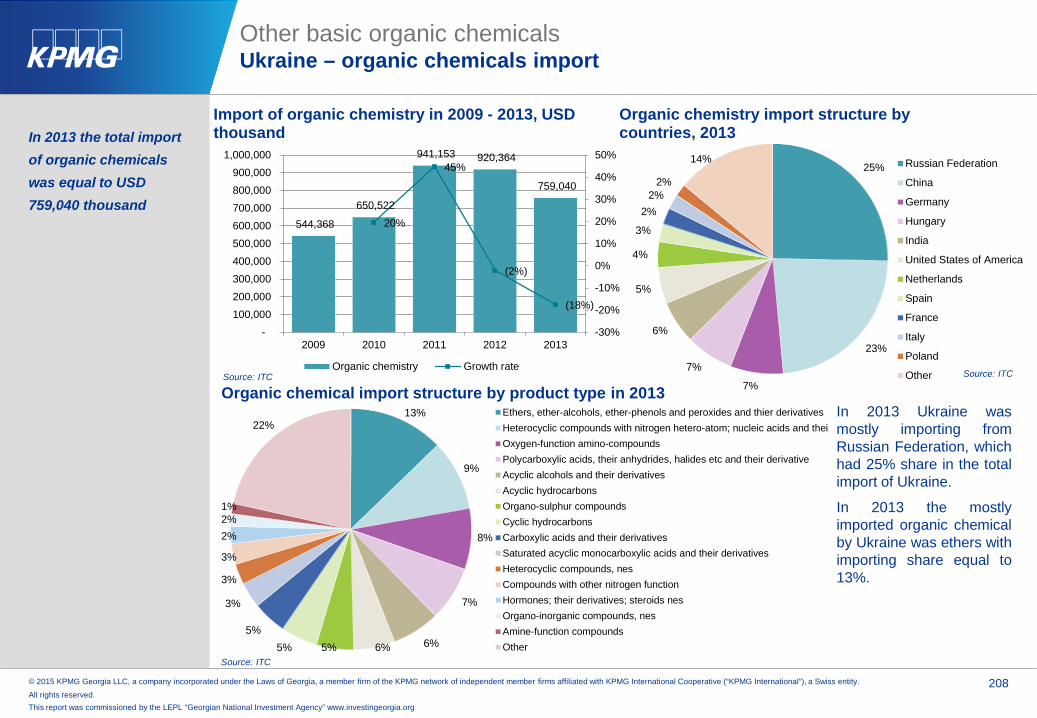
© 2015 KPMG Georgia LLC, a company incorporated under the Laws of Georgia, a member firm of the KPMG network of independent member firms affiliated with KPMG International Cooperative (“KPMG International”), a Swiss entity.
All rights reserved. 208
This report was commissioned by the LEPL “Georgian National Investment Agency” www.investingeorgia.org
13%
9%
8%
7%
6%6%5%5%5%
3%
3%
3%
2%2%1%
22%
Organic chemical import structure by product type in 2013Ethers, ether-alcohols, ether-phenols and peroxides and thier derivativesHeterocyclic compounds with nitrogen hetero-atom; nucleic acids and theiOxygen-function amino-compoundsPolycarboxylic acids, their anhydrides, halides etc and their derivativeAcyclic alcohols and their derivativesAcyclic hydrocarbonsOrgano-sulphur compoundsCyclic hydrocarbonsCarboxylic acids and their derivativesSaturated acyclic monocarboxylic acids and their derivativesHeterocyclic compounds, nesCompounds with other nitrogen functionHormones; their derivatives; steroids nesOrgano-inorganic compounds, nesAmine-function compoundsOther
In 2013 the total import of organic chemicalswas equal to USD 759,040 thousand
Other basic organic chemicalsUkraine – organic chemicals import
Source: ITC
Source: ITC
25%
23%
7%
7%
6%
5%
4%
3%
2%2%
2%
14%
Organic chemistry import structure by countries, 2013
Russian Federation
China
Germany
Hungary
India
United States of America
Netherlands
Spain
France
Italy
Poland
Other
In 2013 Ukraine wasmostly importing fromRussian Federation, whichhad 25% share in the totalimport of Ukraine.
In 2013 the mostlyimported organic chemicalby Ukraine was ethers withimporting share equal to13%.
Source: ITC
544,368
650,522
941,153 920,364
759,040
20%
45%
(2%)
(18%)
-30%
-20%
-10%
0%
10%
20%
30%
40%
50%
- 100,000 200,000 300,000 400,000 500,000 600,000 700,000 800,000 900,000
1,000,000
2009 2010 2011 2012 2013
Import of organic chemistry in 2009 - 2013, USD thousand
Organic chemistry Growth rate
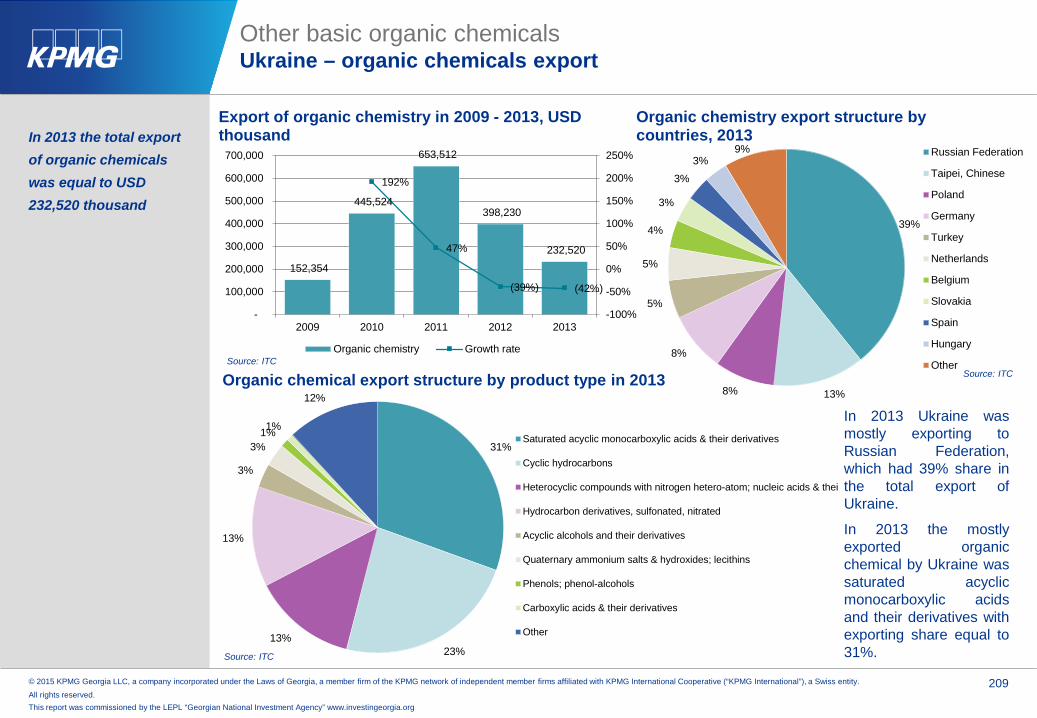
© 2015 KPMG Georgia LLC, a company incorporated under the Laws of Georgia, a member firm of the KPMG network of independent member firms affiliated with KPMG International Cooperative (“KPMG International”), a Swiss entity.
All rights reserved. 209
This report was commissioned by the LEPL “Georgian National Investment Agency” www.investingeorgia.org
39%
13%8%
8%
5%
5%
4%
3%
3%
3%9%
Organic chemistry export structure by countries, 2013
Russian Federation
Taipei, Chinese
Poland
Germany
Turkey
Netherlands
Belgium
Slovakia
Spain
Hungary
Other
In 2013 the total exportof organic chemicalswas equal to USD 232,520 thousand
Other basic organic chemicalsUkraine – organic chemicals export
Source: ITC
In 2013 Ukraine wasmostly exporting toRussian Federation,which had 39% share inthe total export ofUkraine.
In 2013 the mostlyexported organicchemical by Ukraine wassaturated acyclicmonocarboxylic acidsand their derivatives withexporting share equal to31%.
Source: ITC
31%
23%13%
13%
3%
3%1%1%
12%Organic chemical export structure by product type in 2013
Saturated acyclic monocarboxylic acids & their derivatives
Cyclic hydrocarbons
Heterocyclic compounds with nitrogen hetero-atom; nucleic acids & thei
Hydrocarbon derivatives, sulfonated, nitrated
Acyclic alcohols and their derivatives
Quaternary ammonium salts & hydroxides; lecithins
Phenols; phenol-alcohols
Carboxylic acids & their derivatives
Other
Source: ITC
152,354
445,524
653,512
398,230
232,520
192%
47%
(39%) (42%)
-100%
-50%
0%
50%
100%
150%
200%
250%
-
100,000
200,000
300,000
400,000
500,000
600,000
700,000
2009 2010 2011 2012 2013
Export of organic chemistry in 2009 - 2013, USD thousand
Organic chemistry Growth rate

© 2015 KPMG Georgia LLC, a company incorporated under the Laws of Georgia, a member firm of the KPMG network of independent member firms affiliated with KPMG International Cooperative (“KPMG International”), a Swiss entity.
All rights reserved. 210
This report was commissioned by the LEPL “Georgian National Investment Agency” www.investingeorgia.org
14.8 14 13.411.3 10.8 10.6 10.7 10.9 11.2 11.5 11.9 12.4
4.8%
(4.9%) (4.7%)
(15.8%)
(3.7%)(2.3%)
0.5% 2.7% 2.2% 2.7% 3.2%
4.5%
-20%
-15%
-10%
-5%
0%
5%
10%
0
2
4
6
8
10
12
14
16
2012 2013 2014 2015 2016 2017 2018 2019 2020 2021 2022 2023
US
D b
illio
n
Hydrocarbon production value, 2012-2023
Production value Growth rate
427 427 426 418 412 411 414 423433
446462
481
1.6%
- (0.2%)
(1.8%)
(1.4%)
(0.2%)
0.7%
2.0% 2.5%
3.0% 3.5%
4.0%
-3%
-2%
-1%
0%
1%
2%
3%
4%
5%
360
380
400
420
440
460
480
500
2012 2013 2014 2015 2016 2017 2018 2019 2020 2021 2022 2023
Thou
sand
b.o
.e.
Hydrocarbon production volume, 2012-2023
Production volume Growth rate
EstimateIn 2013 the total production volume andvalue of hydrocarbonswas equal to 427 thousand b.o.e and USD 14 billion respectively
Other basic organic chemicalsUkraine – organic chemicals production
Source: Business Monitor International
Source: Business Monitor International
Estimate

© 2015 KPMG Georgia LLC, a company incorporated under the Laws of Georgia, a member firm of the KPMG network of independent member firms affiliated with KPMG International Cooperative (“KPMG International”), a Swiss entity.
All rights reserved. 211
This report was commissioned by the LEPL “Georgian National Investment Agency” www.investingeorgia.org
In 2013 the total consumption volumeand value ofhydrocarbons was equalto 1,093 thousand b.o.eand USD 37 billionrespectively
Other basic organic chemicalsUkraine – organic chemicals consumption
Source: Business Monitor International
1,172
1,0931,092 1,103 1,113 1,121
1,1311,142 1,146 1,151 1,156 1,161
(4.5%)
(6.7%)
(0.1%)
1.0% 0.9% 0.7% 0.9% 1.0% 0.4% 0.4% 0.4% 0.5%
-8%
-7%
-6%
-5%
-4%
-3%
-2%
-1%
0%
1%
2%
1,040
1,060
1,080
1,100
1,120
1,140
1,160
1,180
2012 2013 2014 2015 2016 2017 2018 2019 2020 2021 2022 2023
Thou
sand
b.o
.e.
Hydrocarbon consumption volume, 2012-2023
Consumption volume Growth rate
Estimate
4237 36
28 28 28 29 30 30 31 31 32
(1.1%)
(9.9%)
(4.0%)
(21.5%)
(1.4%) (0.8%)
3.3% 3.8% 1.6% 1.6% 0.7%
3.4%
-25%
-20%
-15%
-10%
-5%
0%
5%
10%
0
5
10
15
20
25
30
35
40
45
2012 2013 2014 2015 2016 2017 2018 2019 2020 2021 2022 2023
US
D b
illio
n
Hydrocarbon consumption value, 2012-2023
Consumption value Growth rate
Estimate
According to the StateStatistics Service of Ukraine,Ukraine produces acetic acidand phenols which hadproduction volumes equal to101,184 and 4,368 tonesrespectively in 2013.
According to KPMGcalculations the consumptionvolumes of acetic acid andphenols was equal to 34,805and 3,792 tones respectivelyin 2013.
The State Statistics Serviceof Ukraine did not providedata on the productionvolumes of other types ofother basic chemicals whichare under research and forwhich production volumesare not mentioned.
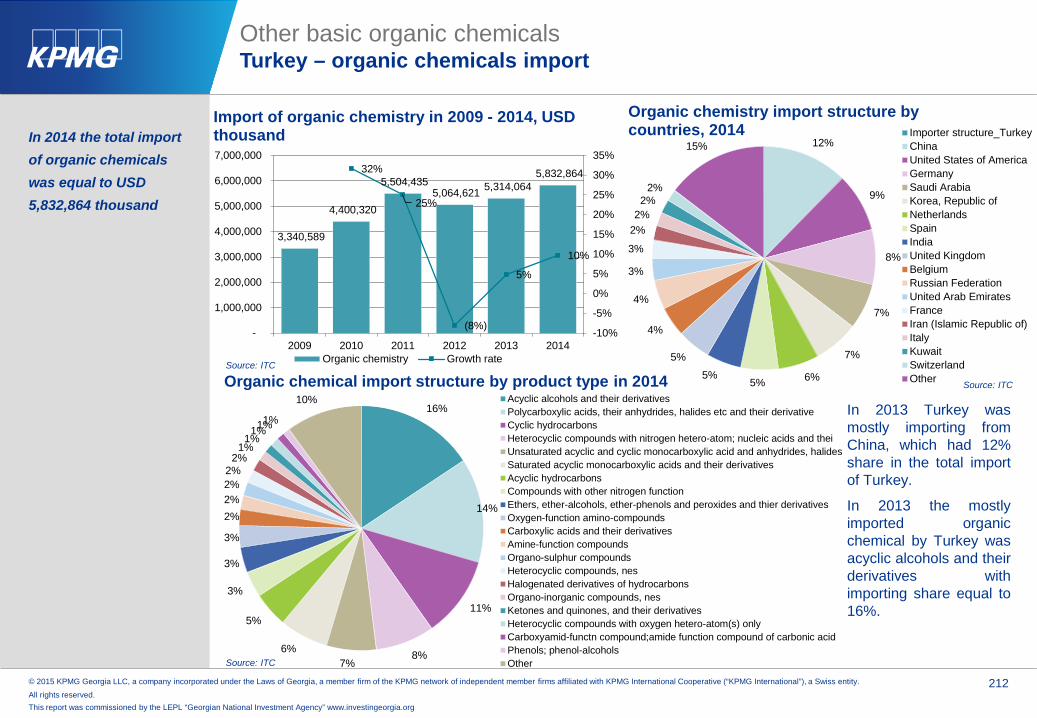
© 2015 KPMG Georgia LLC, a company incorporated under the Laws of Georgia, a member firm of the KPMG network of independent member firms affiliated with KPMG International Cooperative (“KPMG International”), a Swiss entity.
All rights reserved. 212
This report was commissioned by the LEPL “Georgian National Investment Agency” www.investingeorgia.org
In 2014 the total importof organic chemicalswas equal to USD 5,832,864 thousand
Source: ITC
In 2013 Turkey wasmostly importing fromChina, which had 12%share in the total importof Turkey.
In 2013 the mostlyimported organicchemical by Turkey wasacyclic alcohols and theirderivatives withimporting share equal to16%.
Source: ITC
12%
9%
8%
7%
7%
6%5%5%
5%
4%
4%
3%
3%
2%2%2%
2%
15%
Organic chemistry import structure by countries, 2014 Importer structure_Turkey
ChinaUnited States of AmericaGermanySaudi ArabiaKorea, Republic ofNetherlandsSpainIndiaUnited KingdomBelgiumRussian FederationUnited Arab EmiratesFranceIran (Islamic Republic of)ItalyKuwaitSwitzerlandOther
Other basic organic chemicalsTurkey – organic chemicals import
16%
14%
11%
8%7%
6%
5%
3%
3%
3%
2%2%2%2%
2%1%
1%1%1%1%
10%Organic chemical import structure by product type in 2014
Acyclic alcohols and their derivativesPolycarboxylic acids, their anhydrides, halides etc and their derivativeCyclic hydrocarbonsHeterocyclic compounds with nitrogen hetero-atom; nucleic acids and theiUnsaturated acyclic and cyclic monocarboxylic acid and anhydrides, halidesSaturated acyclic monocarboxylic acids and their derivativesAcyclic hydrocarbonsCompounds with other nitrogen functionEthers, ether-alcohols, ether-phenols and peroxides and thier derivativesOxygen-function amino-compoundsCarboxylic acids and their derivativesAmine-function compoundsOrgano-sulphur compoundsHeterocyclic compounds, nesHalogenated derivatives of hydrocarbonsOrgano-inorganic compounds, nesKetones and quinones, and their derivativesHeterocyclic compounds with oxygen hetero-atom(s) onlyCarboxyamid-functn compound;amide function compound of carbonic acidPhenols; phenol-alcoholsOther
Source: ITC
3,340,589
4,400,320
5,504,435 5,064,621 5,314,064
5,832,864 32%
25%
(8%)
5%
10%
-10%
-5%
0%
5%
10%
15%
20%
25%
30%
35%
-
1,000,000
2,000,000
3,000,000
4,000,000
5,000,000
6,000,000
7,000,000
2009 2010 2011 2012 2013 2014
Import of organic chemistry in 2009 - 2014, USD thousand
Organic chemistry Growth rate

© 2015 KPMG Georgia LLC, a company incorporated under the Laws of Georgia, a member firm of the KPMG network of independent member firms affiliated with KPMG International Cooperative (“KPMG International”), a Swiss entity.
All rights reserved. 213
This report was commissioned by the LEPL “Georgian National Investment Agency” www.investingeorgia.org
In 2014 the total exportof organic chemicalswas equal to USD 534,080 thousand
Source: ITC
In 2013 Turkey was mostlyexporting to Italy, whichhad 27% share in the totalexport of Turkey.
In 2013 the mostly exportedorganic chemical by Turkeywas cyclic hydrocarbonswith exporting share equalto 39%.
Source: ITC Source: ITC
Other basic organic chemicalsTurkey – organic chemicals export
27%
13%
6%4%4%3%
3%2%
2%2%
2%2%
2%2%2%
23%
Organic chemistry export structure by countries, 2013 Italy
United States of AmericaSpainPortugalGreeceChinaUnited KingdomRussian FederationAzerbaijanIndonesiaIran (Islamic Republic of)GermanyNetherlandsIndiaUnited Arab EmiratesOther
39%
11%7%6%
6%
5%
3%
3%
3%
3%2%
12%Organic chemical export structure by product type in 2014
Cyclic hydrocarbons
Polycarboxylic acids, their anhydrides, halides etc and their derivative
Vegetable alkaloids&their salts, ethers, esters and other derivatives
Saturated acyclic monocarboxylic acids and their derivatives
Acyclic hydrocarbons
Carboxyamid-functn compound;amide function compound of carbonic acid
Nitrile-function compounds
Acyclic alcohols and their derivatives
Ethers, ether-alcohols, ether-phenols and peroxides and their derivatives
Ketones and quinones, and their derivatives
Heterocyclic compounds with nitrogen hetero-atom; nucleic acids and thei
Other
347,686
520,326 545,361
646,895 598,463
534,080
50%
5%
19%
(7%)(11%)
(20%)
(10%)
-
10%
20%
30%
40%
50%
60%
-
100,000
200,000
300,000
400,000
500,000
600,000
700,000
2009 2010 2011 2012 2013 2014
Export of organic chemistry in 2009 - 2014, USD thousand
Organic chemistry Growth rate
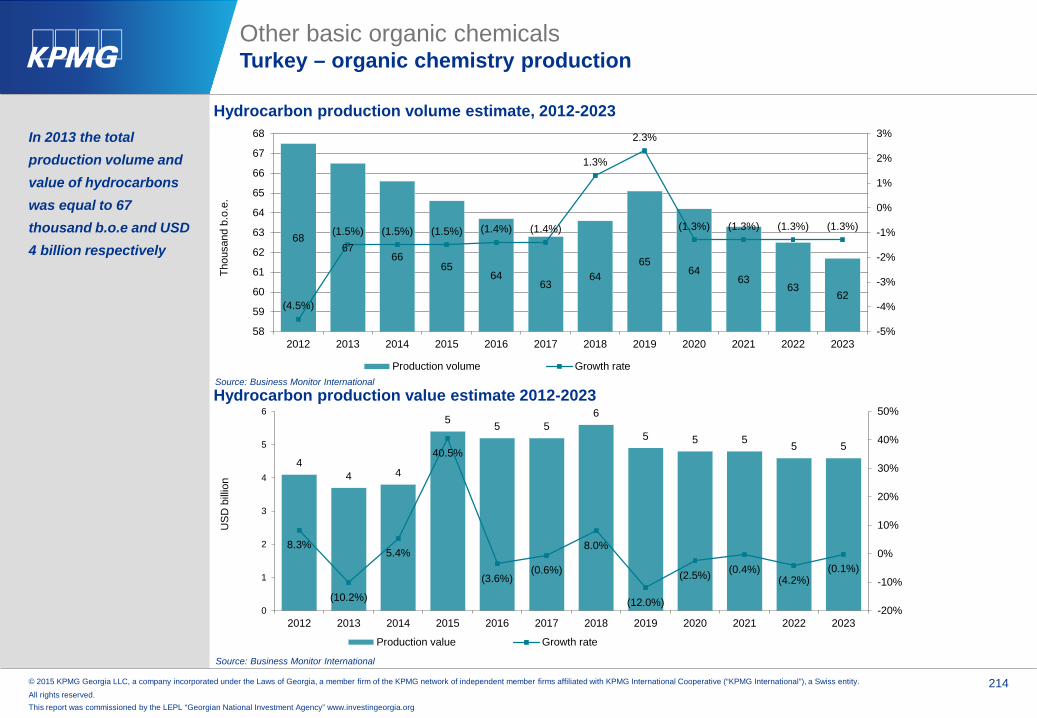
© 2015 KPMG Georgia LLC, a company incorporated under the Laws of Georgia, a member firm of the KPMG network of independent member firms affiliated with KPMG International Cooperative (“KPMG International”), a Swiss entity.
All rights reserved. 214
This report was commissioned by the LEPL “Georgian National Investment Agency” www.investingeorgia.org
6867
6665
6463
6465
6463
6362
(4.5%)
(1.5%) (1.5%) (1.5%) (1.4%) (1.4%)
1.3%
2.3%
(1.3%) (1.3%) (1.3%) (1.3%)
-5%
-4%
-3%
-2%
-1%
0%
1%
2%
3%
58
59
60
61
62
63
64
65
66
67
68
2012 2013 2014 2015 2016 2017 2018 2019 2020 2021 2022 2023
Thou
sand
b.o
.e.
Hydrocarbon production volume estimate, 2012-2023
Production volume Growth rate
In 2013 the total production volume andvalue of hydrocarbonswas equal to 67 thousand b.o.e and USD 4 billion respectively
Other basic organic chemicalsTurkey – organic chemistry production
Source: Business Monitor International
Source: Business Monitor International
44 4
5 5 56
5 5 5 5 5
8.3%
(10.2%)
5.4%
40.5%
(3.6%)(0.6%)
8.0%
(12.0%)
(2.5%) (0.4%)(4.2%)
(0.1%)
-20%
-10%
0%
10%
20%
30%
40%
50%
0
1
2
3
4
5
6
2012 2013 2014 2015 2016 2017 2018 2019 2020 2021 2022 2023
US
D b
illio
n
Hydrocarbon production value estimate 2012-2023
Production value Growth rate
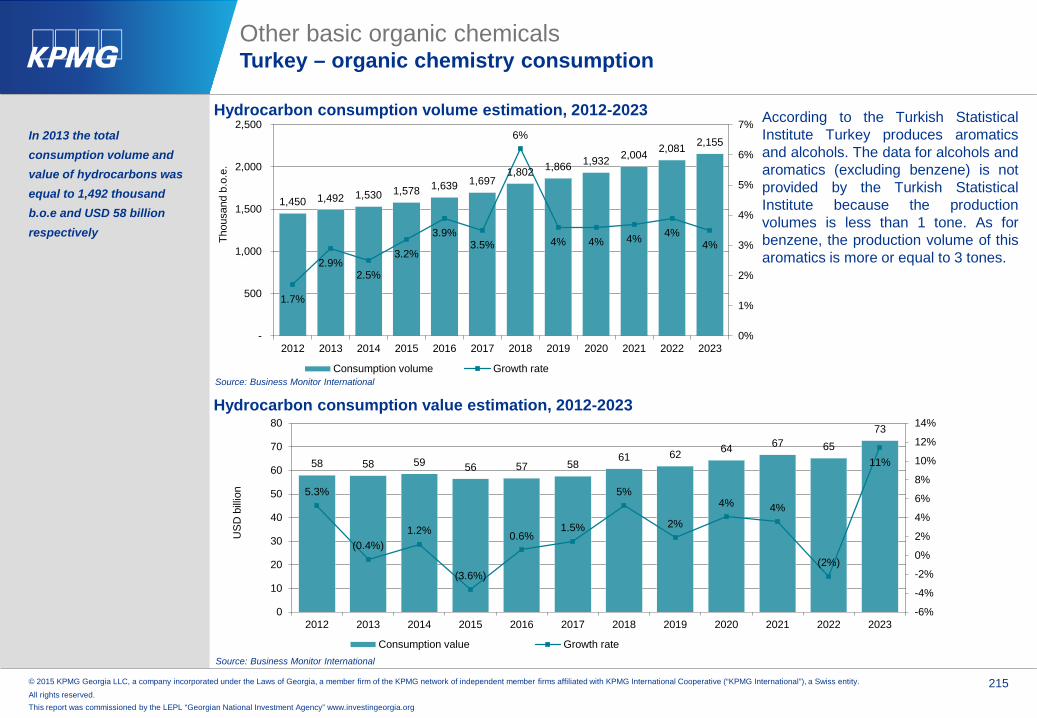
© 2015 KPMG Georgia LLC, a company incorporated under the Laws of Georgia, a member firm of the KPMG network of independent member firms affiliated with KPMG International Cooperative (“KPMG International”), a Swiss entity.
All rights reserved. 215
This report was commissioned by the LEPL “Georgian National Investment Agency” www.investingeorgia.org
In 2013 the total consumption volume andvalue of hydrocarbons wasequal to 1,492 thousandb.o.e and USD 58 billionrespectively
Other basic organic chemicalsTurkey – organic chemistry consumption
Source: Business Monitor International
According to the Turkish StatisticalInstitute Turkey produces aromaticsand alcohols. The data for alcohols andaromatics (excluding benzene) is notprovided by the Turkish StatisticalInstitute because the productionvolumes is less than 1 tone. As forbenzene, the production volume of thisaromatics is more or equal to 3 tones.
1,450 1,492 1,530 1,578 1,639 1,697 1,802 1,866 1,932 2,004 2,081 2,155
1.7%
2.9% 2.5%
3.2%
3.9% 3.5%
6%
4% 4% 4% 4% 4%
0%
1%
2%
3%
4%
5%
6%
7%
-
500
1,000
1,500
2,000
2,500
2012 2013 2014 2015 2016 2017 2018 2019 2020 2021 2022 2023
Thou
sand
b.o
.e.
Hydrocarbon consumption volume estimation, 2012-2023
Consumption volume Growth rateSource: Business Monitor International
58 58 59 56 57 5861 62 64 67 65
73
5.3%
(0.4%)1.2%
(3.6%)
0.6% 1.5%
5%
2%
4% 4%
(2%)
11%
-6%
-4%
-2%
0%
2%
4%
6%
8%
10%
12%
14%
0
10
20
30
40
50
60
70
80
2012 2013 2014 2015 2016 2017 2018 2019 2020 2021 2022 2023
US
D b
illio
n
Hydrocarbon consumption value estimation, 2012-2023
Consumption value Growth rate

© 2015 KPMG Georgia LLC, a company incorporated under the Laws of Georgia, a member firm of the KPMG network of independent member firms affiliated with KPMG International Cooperative (“KPMG International”), a Swiss entity.
All rights reserved. 216
This report was commissioned by the LEPL “Georgian National Investment Agency” www.investingeorgia.org
67%
26%
3% 3% 1%
Organic chemistry import structure by importer countries, 2013
Kazakhstan
Uzbekistan
Kyrgyzstan
Turkmenistan
Tajikistan
In 2013 the total import of organic chemicals was equalto USD 330,694 thousand
Source: ITC
In 2013 Kazakhstanwas the most importingcountry among CentralAsian countries withthe importing share of67%
In 2013 the mostlyimported organicchemical by the CentralAsia was amino-function compoundswith importing shareequal to 16%.
Source: ITC
Source: ITC
Other basic organic chemicalsCentral Asia – organic chemicals import
16%
11%
9%
9%7%6%
5%
5%
4%
4%
4%
3%
17%Organic chemical import structure by product type in 2013
Amine-function compounds
Acyclic alcohols and their derivatives
Oxygen-function amino-compounds
Organo-sulphur compounds
Antibiotics
Heterocyclic compounds with nitrogen hetero-atom; nucleic acids and thei
Saturated acyclic monocarboxylic acids and their derivatives
Carboxylic acids and their derivatives
Ethers, ether-alcohols, ether-phenols and peroxides and thier derivatives
Compounds with other nitrogen function
Polycarboxylic acids, their anhydrides, halides etc and their derivative
Organo-inorganic compounds, nes
Other
156,160 168,938
317,084 316,012 330,694
8%
88%
(0.3%)5%
-10%0%10%20%30%40%50%60%70%80%90%100%
-
50,000
100,000
150,000
200,000
250,000
300,000
350,000
2009 2010 2011 2012 2013
Import of organic chemistry in 2009 - 2013, USD thousand
Organic chemistry Growth rate

© 2015 KPMG Georgia LLC, a company incorporated under the Laws of Georgia, a member firm of the KPMG network of independent member firms affiliated with KPMG International Cooperative (“KPMG International”), a Swiss entity.
All rights reserved. 217
This report was commissioned by the LEPL “Georgian National Investment Agency” www.investingeorgia.org
In 2013 the total export of organic chemicals was equalto USD 30,569 thousand
Source: ITC
In 2013 Kazakhstan wasthe most exporting countryamong Central Asiancountries with the exportingshare of 84%
In 2013 the mostly exportedorganic chemical by theCentral Asia was acyclichydrocarbons withexporting share equal to43%.
Source: ITC Source: ITC
Other basic organic chemicalsCentral Asia – organic chemicals export
84%
14%
2%0%
0%
Organic chemistry export structure by exporter countries, 2013
Kazakhstan
Uzbekistan
Kyrgyzstan
Tajikistan
Turkmenistan
43%
37%
7%
3%3%
2%2%1% 2%Organic chemical export structure by product type in 2013
Acyclic hydrocarbons
Ethers, ether-alcohols, ether-phenols & peroxides & thier derivatives
Vegetable alkaloids&their salts, ethers, esters & other derivatives
Glycosides & their salts, ethers, esters & other derivatives
Acyclic alcohols and their derivatives
Aldehyde;cyclic polymer of aldehyde;paraformaldehyde
Phosphoric esters, their salts and their derivatives
Saturated acyclic monocarboxylic acids & their derivatives
Other
7,991
17,074
37,762
58,129
30,569
114% 121%
54%
(47%)
-60%-40%-20%0%20%40%60%80%100%120%140%
-
10,000
20,000
30,000
40,000
50,000
60,000
70,000
2009 2010 2011 2012 2013
Export of organic chemistry in 2009 - 2013, USD thousand
Organic chemistry Growth rate

© 2015 KPMG Georgia LLC, a company incorporated under the Laws of Georgia, a member firm of the KPMG network of independent member firms affiliated with KPMG International Cooperative (“KPMG International”), a Swiss entity.
All rights reserved. 218
This report was commissioned by the LEPL “Georgian National Investment Agency” www.investingeorgia.org
71
67 65 63
68 76 80 8899
114 120 1160.1%
(5.1%)(3.5%) (3.6%)
8.0%
11.8%
5.7%
9.9% 12.2%
15.9%
4.7%
(2.5%)
-10%
-5%
0%
5%
10%
15%
20%
0
20
40
60
80
100
120
140
2012 2013 2014 2015 2016 2017 2018 2019 2020 2021 2022 2023
US
D b
illio
n
Hydrocarbon production value, 2012-2023
Production value Growth rate
1,800 1,772 1,767 1,765 1,945
2,224 2,378
2,588 2,874
3,295 3,446 3,354
(1.9%) (1.6%)(0.3%) (0.2%)
10.2%
14.3%
6.9%
8.8%
11.1%
14.7%
4.6%
(2.7%)
-4%
-2%
0%
2%
4%
6%
8%
10%
12%
14%
16%
-
500
1,000
1,500
2,000
2,500
3,000
3,500
4,000
2012 2013 2014 2015 2016 2017 2018 2019 2020 2021 2022 2023
Thou
sand
b.o
.e.
Hydrocarbon production volume, 2012-2023
Production volume Growth rate
Estimate
EstimateIn 2013 the total production volume andvalue of hydrocarbonswas equal to 1,772 thousand b.o.e and USD 67 billion respectively
Other basic organic chemicalsKazakhstan – organic chemicals production
Source: Business Monitor International
Source: Business Monitor International
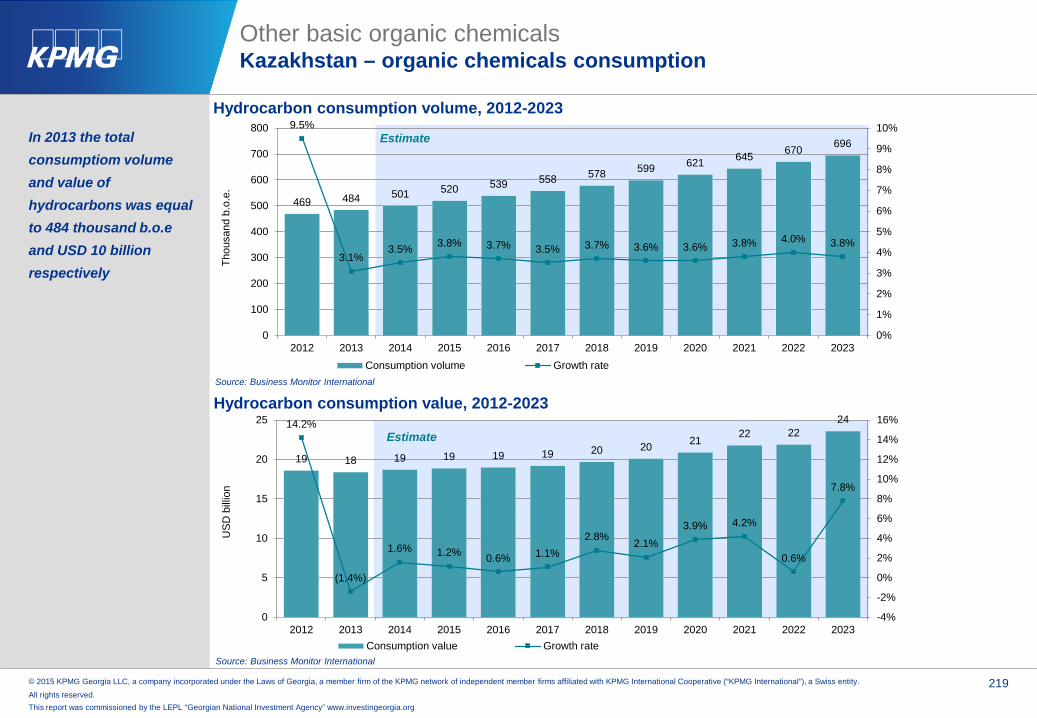
© 2015 KPMG Georgia LLC, a company incorporated under the Laws of Georgia, a member firm of the KPMG network of independent member firms affiliated with KPMG International Cooperative (“KPMG International”), a Swiss entity.
All rights reserved. 219
This report was commissioned by the LEPL “Georgian National Investment Agency” www.investingeorgia.org
19 18 19 19 19 19 20 20 21 22 222414.2%
(1.4%)
1.6% 1.2% 0.6% 1.1% 2.8% 2.1%
3.9% 4.2%
0.6%
7.8%
-4%
-2%
0%
2%
4%
6%
8%
10%
12%
14%
16%
0
5
10
15
20
25
2012 2013 2014 2015 2016 2017 2018 2019 2020 2021 2022 2023
US
D b
illio
n
Hydrocarbon consumption value, 2012-2023
Consumption value Growth rate
469 484 501 520 539 558 578 599 621 645 670 696
9.5%
3.1% 3.5% 3.8% 3.7% 3.5% 3.7% 3.6% 3.6% 3.8% 4.0% 3.8%
0%
1%
2%
3%
4%
5%
6%
7%
8%
9%
10%
0
100
200
300
400
500
600
700
800
2012 2013 2014 2015 2016 2017 2018 2019 2020 2021 2022 2023
Thou
sand
b.o
.e.
Hydrocarbon consumption volume, 2012-2023
Consumption volume Growth rate
EstimateIn 2013 the total consumptiom volumeand value ofhydrocarbons was equalto 484 thousand b.o.eand USD 10 billionrespectively
Other basic organic chemicalsKazakhstan – organic chemicals consumption
Source: Business Monitor International
Source: Business Monitor International
Estimate

© 2015 KPMG Georgia LLC, a company incorporated under the Laws of Georgia, a member firm of the KPMG network of independent member firms affiliated with KPMG International Cooperative (“KPMG International”), a Swiss entity.
All rights reserved. 220
This report was commissioned by the LEPL “Georgian National Investment Agency” www.investingeorgia.org
49 50 55 58 58 60 64
70 77
81 89
101
9.6%
3.2%
8.9%
5.7%
0.6%
3.0%
5.7%
9.5%10.3%
5.5%
9.6%
14.0%
0%
2%
4%
6%
8%
10%
12%
14%
16%
-
20
40
60
80
100
120
2012 2013 2014 2015 2016 2017 2018 2019 2020 2021 2022 2023
US
D b
illio
n
Hydrocarbon production value estimation, 2012-2023
Production value Growth rate
1,464 1,567 1,693 1,821 1,949 2,051 2,191
2,414 2,673
2,823 3,103
3,547
7.3% 7.1%8.0%
7.6%7.0%
5.3%
6.8%
10.2% 10.7%
5.6%
9.9%
14.3%
0%
2%
4%
6%
8%
10%
12%
14%
16%
-
500
1,000
1,500
2,000
2,500
3,000
3,500
4,000
2012 2013 2014 2015 2016 2017 2018 2019 2020 2021 2022 2023
Thou
sand
b.o
.e
Hydrocarbon production volume estimation, 2012-2023
Production volume Growth rate
Estimate
EstimateIn 2013 the total production volume andvalue of hydrocarbonswas estimated to equalto 1567 thousand b.o.eand USD 50 billionrespectively
Other basic organic chemicalsTurkmenistan – organic chemicals production
Source: Business Monitor International
Source: Business Monitor International

© 2015 KPMG Georgia LLC, a company incorporated under the Laws of Georgia, a member firm of the KPMG network of independent member firms affiliated with KPMG International Cooperative (“KPMG International”), a Swiss entity.
All rights reserved. 221
This report was commissioned by the LEPL “Georgian National Investment Agency” www.investingeorgia.org
16 16 17 18 18 19 19
20 22
23 24 25
8.8%
1.0%
5.7%3.8%
0.7%
3.6%
4.8%5.4% 5.3%
6.0%
3.1%
7.8%
0%
1%
2%
3%
4%
5%
6%
7%
8%
9%
10%
-
5
10
15
20
25
30
2012 2013 2014 2015 2016 2017 2018 2019 2020 2021 2022 2023
US
D b
illio
n
Hydrocarbon consumption value estimation, 2012-2023
Consumption value Growth rate
484 508 536 565 599 635
673 713
751 796
840 882 6.0%
4.9%5.5% 5.5%
6.1% 6.0% 6.1% 5.9%
5.3%
6.0%
5.5%5.0%
0%
1%
2%
3%
4%
5%
6%
7%
-
100
200
300
400
500
600
700
800
900
1,000
2012 2013 2014 2015 2016 2017 2018 2019 2020 2021 2022 2023
Thou
sand
b.o
.e
Hydrocarbon consumption volume estimation, 2012-2023
Consumption volume Growth rate
Estimate
EstimateIn 2013 the total consumption volumeand value ofhydrocarbons wasestimated to equal to508 thousand b.o.e andUSD 16 billionrespectively
Other basic organic chemicalsTurkmenistan – organic chemicals consumption
Source: Business Monitor International
Source: Business Monitor International
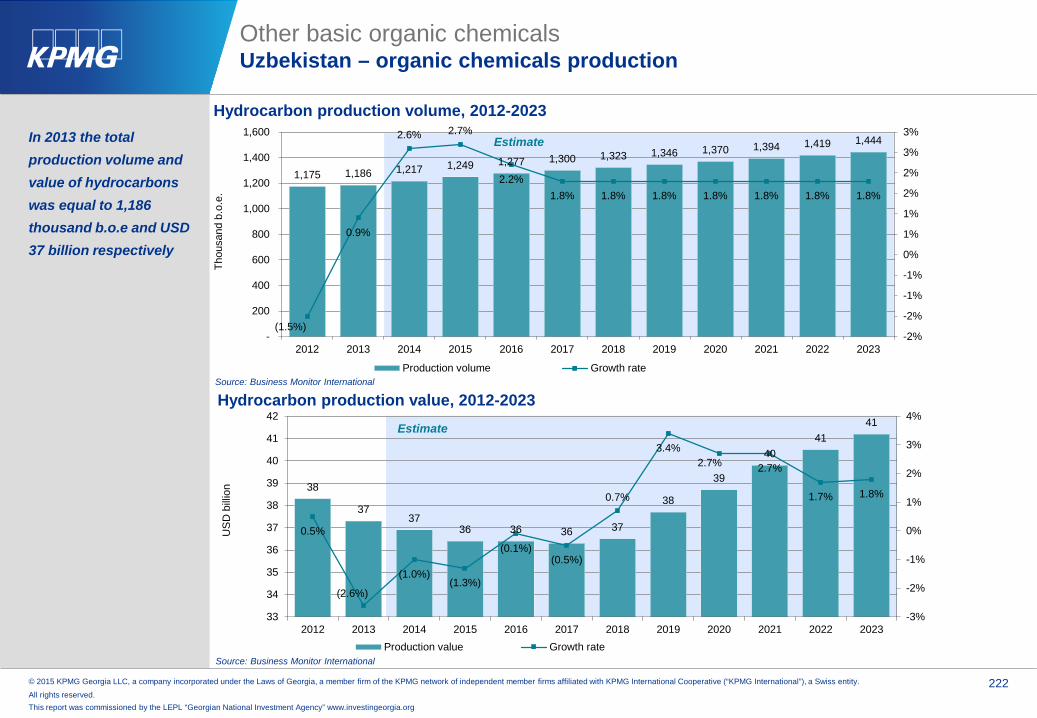
© 2015 KPMG Georgia LLC, a company incorporated under the Laws of Georgia, a member firm of the KPMG network of independent member firms affiliated with KPMG International Cooperative (“KPMG International”), a Swiss entity.
All rights reserved. 222
This report was commissioned by the LEPL “Georgian National Investment Agency” www.investingeorgia.org
38
3737
36 36 36 37
38
39
4041
41
0.5%
(2.6%)
(1.0%)(1.3%)
(0.1%)(0.5%)
0.7%
3.4% 2.7% 2.7%
1.7% 1.8%
-3%
-2%
-1%
0%
1%
2%
3%
4%
33
34
35
36
37
38
39
40
41
42
2012 2013 2014 2015 2016 2017 2018 2019 2020 2021 2022 2023
US
D b
illio
n
Hydrocarbon production value, 2012-2023
Production value Growth rate
1,175 1,186 1,217 1,249 1,277 1,300 1,323 1,346 1,370 1,394 1,419 1,444
(1.5%)
0.9%
2.6% 2.7%
2.2% 1.8% 1.8% 1.8% 1.8% 1.8% 1.8% 1.8%
-2%
-2%
-1%
-1%
0%
1%
1%
2%
2%
3%
3%
-
200
400
600
800
1,000
1,200
1,400
1,600
2012 2013 2014 2015 2016 2017 2018 2019 2020 2021 2022 2023
Thou
sand
b.o
.e.
Hydrocarbon production volume, 2012-2023
Production volume Growth rate
Estimate
EstimateIn 2013 the total production volume andvalue of hydrocarbonswas equal to 1,186 thousand b.o.e and USD 37 billion respectively
Other basic organic chemicalsUzbekistan – organic chemicals production
Source: Business Monitor International
Source: Business Monitor International

© 2015 KPMG Georgia LLC, a company incorporated under the Laws of Georgia, a member firm of the KPMG network of independent member firms affiliated with KPMG International Cooperative (“KPMG International”), a Swiss entity.
All rights reserved. 223
This report was commissioned by the LEPL “Georgian National Investment Agency” www.investingeorgia.org
3332
31
30
32 32 33
34
35 35 3535
5.2%
(2.6%)(3.9%)
(5.1%)
9.3%
-1.0%
3.5% 3.1%
(0.8%)0.4%
1.6%
-6%
-4%
-2%
0%
2%
4%
6%
8%
10%
12%
26
27
28
29
30
31
32
33
34
35
36
2012 2013 2014 2015 2016 2017 2018 2019 2020 2021 2022 2023
US
D b
illio
n
Hydrocarbon consumption value, 2012-2023
Consumption value Growth rate
1,004 1,014 1,005 988
1,111 1,137 1,161 1,186 1,213 1,191 1,203 1,214
2.7%
0.9%
(0.8%)(1.7%)
12.5%
2.3% 2.1% 2.2% 2.2%
(1.8%)
1.0% 1.0%
-4%
-2%
0%
2%
4%
6%
8%
10%
12%
14%
-
200
400
600
800
1,000
1,200
1,400
2012 2013 2014 2015 2016 2017 2018 2019 2020 2021 2022 2023
Thou
sand
b.o
.e.
Hydrocarbon consumption volume, 2012-2023
Consumption volume Growth rate
EstimateIn 2013 the total production volume andvalue of hydrocarbonswas equal to 1,005thousand b.o.e and USD 32 billion respectively
Other basic organic chemicalsUzbekistan – organic chemicals consumption
Source: Business Monitor International
Source: Business Monitor International
Estimate
The State Statistical Services ofthe Central Asian countries donot provide data on theproduction volumes of othertypes of other basic chemicalswhich are under research andfor which production volumesare not mentioned.

© 2015 KPMG Georgia LLC, a company incorporated under the Laws of Georgia, a member firm of the KPMG network of independent member firms affiliated with KPMG International Cooperative (“KPMG International”), a Swiss entity.
All rights reserved. 224
This report was commissioned by the LEPL “Georgian National Investment Agency” www.investingeorgia.org
In 2013 the total import of organic chemicals was equalto USD 179,704,338 thousand
Source: ITC
In 2013 Belgium was themost importing countryamong EU countries withthe share of 21%
In 2013 the mostlyimported organic chemicalby the EU washeterocyclic compoundswith nitrogen hetero-atom;nucleic acids and withimporting share equal to19%.
Source: ITC Source: ITC
Other basic organic chemicalsEU – organic chemicals import
21%
19%
11%10%
10%
7%
6%
3%2%
2%2%7%
Organic chemicals import structure by importer countries, 2013
Belgium
Germany
Netherlands
France
Italy
United Kingdom
Spain
Austria
Ireland
Poland
Sweden
Other
19%
9%
7%
7%
6%5%4%3%
3%
3%
3%
2%
2%
2%2%2%
19%Organic chemicals import structure by product type in 2013
Heterocyclic compounds with nitrogen hetero-atom; nucleic acids and theiCyclic hydrocarbonsAcyclic hydrocarbonsHormones; their derivatives; steroids nesAcyclic alcohols and their derivativesOxygen-function amino-compoundsHeterocyclic compounds, nesSaturated acyclic monocarboxylic acids and their derivativesPolycarboxylic acids, their anhydrides, halides etc and their derivativeEthers, ether-alcohols, ether-phenols & peroxides and their derivativesAmine-function compoundsUnsaturated acyclic and cyclic monocarboxylic acid and anhydrides, halidesSulphonamidesCarboxyamid-functn compound;amide function compound of carbonic acidPhenols; phenol-alcoholsCarboxylic acids and their derivativesOther
133,979,282 152,305,980
182,723,236 178,476,970 179,704,338
14%
20%
(2%)0.7%
-5%
0%
5%
10%
15%
20%
25%
-20,000,00040,000,00060,000,00080,000,000
100,000,000120,000,000140,000,000160,000,000180,000,000200,000,000
2009 2010 2011 2012 2013
Import of organic chemistry in 2009 - 2013, USD thousand
Organic chemistry Growth rate

© 2015 KPMG Georgia LLC, a company incorporated under the Laws of Georgia, a member firm of the KPMG network of independent member firms affiliated with KPMG International Cooperative (“KPMG International”), a Swiss entity.
All rights reserved. 225
This report was commissioned by the LEPL “Georgian National Investment Agency” www.investingeorgia.org
25%
9%
6%
6%5%5%
5%3%
3%
3%
3%
3%
2%2%1%1%1%1%1%
1%1%1%1%
9%Organic chemicals export structure by product type in 2013
Heterocyclic compounds with nitrogen hetero-atom; nucleic acids and theiCyclic hydrocarbonsAcyclic hydrocarbonsHeterocyclic compounds, nesHormones; their derivatives; steroids nesAcyclic alcohols and their derivativesOxygen-function amino-compoundsEthers, ether-alcohols, ether-phenols and peroxides and thier derivativesSaturated acyclic monocarboxylic acids and their derivativesSulphonamidesPolycarboxylic acids, their anhydrides, halides etc and their derivativeAmine-function compoundsUnsaturated acyclic and cyclic monocarboxylic acid and anhydrides, halidesCompounds with other nitrogen functionKetones and quinones, and their derivativesHeterocyclic compounds with oxygen hetero-atom(s) onlyNitrile-function compoundsPhenols; phenol-alcoholsEpoxides, epoxyalcohols, epoxyphenolsandepoxyethersandtheir derivativesCarboxylic acids and their derivativesOrgano-sulphur compoundsOrgano-inorganic compounds, nesHalogenated derivatives of hydrocarbonsOther
In 2013 the total export of organic chemicals was equalto USD 177,006,664 thousand
Source: ITC
In 2013 Belgium wasthe most exportingcountry among EUcountries with theexporting share of 23%
In 2013 the mostlyexported organicchemical by the EUwas heterocycliccompounds withnitrogen hetero-atom;nucleic acids and theiwith exporting shareequal to 25%.
Source: ITC Source: ITC
Other basic organic chemicalsEU – organic chemicals export
23%
17%
15%
14%
8%
7%
4%3%
2%1%6%
Organic chemicals export structure by exporter countries, 2013 Belgium
Germany
Ireland
Netherlands
France
United Kingdom
Italy
Spain
Austria
Sweden
Other
140,726,239 156,387,969
175,385,890 174,304,892 177,006,664
11.1% 12.1%
(0.6%)1.6%
-2%
0%
2%
4%
6%
8%
10%
12%
14%
-20,000,00040,000,00060,000,00080,000,000
100,000,000120,000,000140,000,000160,000,000180,000,000200,000,000
2009 2010 2011 2012 2013
Export of organic chemistry in 2009 - 2013, USD thousand
Organic chemistry Growth rate

© 2015 KPMG Georgia LLC, a company incorporated under the Laws of Georgia, a member firm of the KPMG network of independent member firms affiliated with KPMG International Cooperative (“KPMG International”), a Swiss entity.
All rights reserved. 226
This report was commissioned by the LEPL “Georgian National Investment Agency” www.investingeorgia.org
10,957 12,867
10,915 12,089
11,109
13,399
15,910
15,381 16,897
15,760 17.4%
(15.2%)
10.8%
(8.1%)
18.7%
(3.3%)
9.9%
(6.7%)
-20%-15%-10%-5%0%5%10%15%20%25%
-2,0004,0006,0008,000
10,00012,00014,00016,00018,000
2009 2010 2011 2012 2013
Thou
sand
tons
EU Alcohol production and consumption volume, 2009-2013
Production volume Consumption volumeProduction growth rate Consumption growth rate
3%
13%
3%
7%
7%
10%
11%2%
11%
4%1%
3%1%
5%
19%
1%
Alcohol production structure by type, 2013
Industrial fatty alcohols
Methanol (methyl alcohol)
Propan-1-ol (propyl alcohol) and propan-2-ol (isopropyl alcohol)
Butan-1-ol (n-butyl alcohol)
Butanols (excluding butan-1-ol (n-butyl alcohol))
Octanol (octyl alcohol) and isomers thereof
Lauryl alcohol; cetyl alcohol; stearyl alcohol and other saturated monohydric alcohols (excluding methyl, propyl and isopropyl, n-butyl, other butanols, octyl)Unsaturated monohydric alcohols
Diols and polyhydric alcohols (excluding ethylene glycol and propylene glycol, D-glucitol)
Cyclanic, cyclenic or cycloterpenic alcohols and their halogenated, sulphonated, nitrated or nitrosated derivatives
Aromatic alcohols and their halogenated, sulphonated, nitrated or nitrosated derivatives
Carboxilic acid with alcohol, phenol, aldehyde or ketone functions
Amino-alcohols, their ethers and esters with only 1 oxygen function and their salts excluding monoethanolamine and its salts,diethanolamine and its salts, triethanolamine and its saltsEther-alcohols and their halogenated, sulphonated, nitrated or nitrosated derivatives (excluding 2,2-Oxydiethanol)
Polyethylene glycols and other polyether alcohols, in primary forms
Other
In 2013 the EU production and consumption of alcohol were respectively equal to 11.1 and 15.8 million tones
The mostly alcohol producing country in EU was Germany with 81% share
Other basic organic chemicalsEU – organic chemicals production and consumption
81%
7%
6%3% 2%1%
Alcohols production structure by countries, 2013
Germany
Belgium
France
Italy
Spain
Other
Source: EurostatNote: Due to confidentiality matters some countries have not publisheddata on production volumes of alcohols, the chart illustrates available data
Source: Eurostat
Source: EurostatNote: Consumption figures are calculated by KPMG

© 2015 KPMG Georgia LLC, a company incorporated under the Laws of Georgia, a member firm of the KPMG network of independent member firms affiliated with KPMG International Cooperative (“KPMG International”), a Swiss entity.
All rights reserved. 227
This report was commissioned by the LEPL “Georgian National Investment Agency” www.investingeorgia.org
In 2013 the EU production and consumption of acids were respectively equal to 1.2 and 3.7 million tones
The mostly acid producing country in EU was Germany with 71% share
Other basic organic chemicalsEU – organic chemicals production and consumption
Source: Eurostat
Source: EurostatNote: Consumption figures are calculated by KPMG
71%
10%
12%
7%Acids production structure by countries, 2013
Germany
Spain
Finland
Other
Source: EurostatNote: Due to confidentiality matters some countries have not publisheddata on production volumes of acids, the chart illustrates available data
15.7%
43.6%0.4%
40.3%
Acids production structure by type, 2013
Industrial tall oil fatty acids
Industrial monocarboxylic fatty acids distilled (excluding stearic, oleic tall oil)
Aromatic monocarboxylic acids, (anhydrides), halides, peroxides, peroxyacids, derivativesexcluding benzoic acid, phenylacetic acids their salts/esters, benzoyl peroxide, benzoyl chloride
Aromatic polycarboxylic acids, their anhydrides, halides, peroxides, peroxyacids and theirhalogenated, sulphonated, nitrated or nitrosated derivatives (excluding esters of orthophthalicacid, phthalic
1,085 1,331 1,162 1,160 1,191
4,749 5,297
3,830
3,021 3,654
22.7%
(12.7%)
(0.1%)
2.6%
11.5%
(27.7%)(21.1%)
21.0%
-40%
-30%
-20%
-10%
0%
10%
20%
30%
-
1,000
2,000
3,000
4,000
5,000
6,000
2009 2010 2011 2012 2013
Thou
sand
tone
s
EU Acids production and consumption volume, 2009-2013
Production volume Consumption volumeProduction growth rate Consumption growth rate
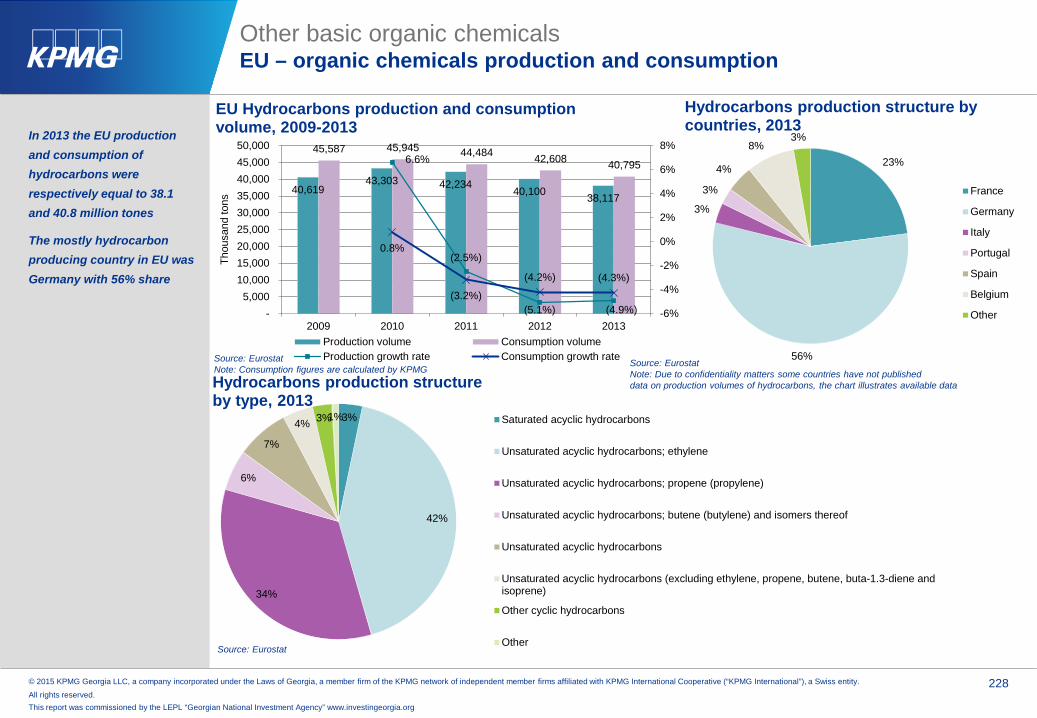
© 2015 KPMG Georgia LLC, a company incorporated under the Laws of Georgia, a member firm of the KPMG network of independent member firms affiliated with KPMG International Cooperative (“KPMG International”), a Swiss entity.
All rights reserved. 228
This report was commissioned by the LEPL “Georgian National Investment Agency” www.investingeorgia.org
40,619 43,303 42,234
40,100 38,117
45,587 45,945 44,484 42,608 40,795 6.6%
(2.5%)
(5.1%) (4.9%)
0.8%
(3.2%)
(4.2%) (4.3%)
-6%
-4%
-2%
0%
2%
4%
6%
8%
-5,000
10,00015,00020,00025,00030,00035,00040,00045,00050,000
2009 2010 2011 2012 2013
Thou
sand
tons
EU Hydrocarbons production and consumption volume, 2009-2013
Production volume Consumption volumeProduction growth rate Consumption growth rate
23%
56%
3%
3%
4%
8%3%
Hydrocarbons production structure by countries, 2013
France
Germany
Italy
Portugal
Spain
Belgium
Other
In 2013 the EU production and consumption of hydrocarbons were respectively equal to 38.1 and 40.8 million tones
The mostly hydrocarbon producing country in EU was Germany with 56% share
Other basic organic chemicalsEU – organic chemicals production and consumption
Source: Eurostat
Source: EurostatNote: Due to confidentiality matters some countries have not publisheddata on production volumes of hydrocarbons, the chart illustrates available data
3%
42%
34%
6%
7%
4% 3%1%
Hydrocarbons production structure by type, 2013
Saturated acyclic hydrocarbons
Unsaturated acyclic hydrocarbons; ethylene
Unsaturated acyclic hydrocarbons; propene (propylene)
Unsaturated acyclic hydrocarbons; butene (butylene) and isomers thereof
Unsaturated acyclic hydrocarbons
Unsaturated acyclic hydrocarbons (excluding ethylene, propene, butene, buta-1.3-diene andisoprene)
Other cyclic hydrocarbons
Other
Source: EurostatNote: Consumption figures are calculated by KPMG

© 2015 KPMG Georgia LLC, a company incorporated under the Laws of Georgia, a member firm of the KPMG network of independent member firms affiliated with KPMG International Cooperative (“KPMG International”), a Swiss entity.
All rights reserved. 229
This report was commissioned by the LEPL “Georgian National Investment Agency” www.investingeorgia.org
Source: EurostatNote: Consumption figures are calculated by KPMG
61%14%
5%
16%
4%
Aromatics production structure by type, 2013
Benzene
Toluene
o-Xylene
p-Xylene
m-Xylene and mixed xyleneisomers
10,526
10,262
11,226
10,361
10,579
(2.5%)
9.4%
(7.7%)
2.1%
-10%-8%-6%-4%-2%0%2%4%6%8%10%12%
9,600
9,800
10,000
10,200
10,400
10,600
10,800
11,000
11,200
11,400
2009 2010 2011 2012 2013
Thou
sand
tone
s
EU Aromatics production volume, 2009-2013
Production volume Growth rate
In 2013 the EU production and consumption of aromatics were respectively equal to 10.6 and 10 million tones
The mostly hydrocarbon producing country in EU was Germany with 53.5% share
Other basic organic chemicalsEU – organic chemicals production and consumption
Source: Eurostat
Source: Eurostat
19.3%
53.5%
6.1%
2.3%
9.3%
4.4%4.9%0.2%
Aromatics production structure by countries, 2013
France
Germany
Portugal
Spain
Belgium
Poland
Hungary
Other
Source: EurostatNote: Due to confidentiality matters some countries have not publisheddata on production volumes of aromatics, the chart illustrates available data
10,475
10,187
10,736
9,800
9,996
(2.8%)
5.4%
(8.7%)
2.0%
-10%
-8%
-6%
-4%
-2%
0%
2%
4%
6%
8%
9,200
9,400
9,600
9,800
10,000
10,200
10,400
10,600
10,800
11,000
2009 2010 2011 2012 2013
Thou
sand
tone
s
EU Aromatics consumption volume, 2009-2013
Consumption volume Growth rate

© 2015 KPMG Georgia LLC, a company incorporated under the Laws of Georgia, a member firm of the KPMG network of independent member firms affiliated with KPMG International Cooperative (“KPMG International”), a Swiss entity.
All rights reserved. 230
This report was commissioned by the LEPL “Georgian National Investment Agency” www.investingeorgia.org
Other basic organic chemicalsProject pipeline
Kazakhstan is set to construct a major petrochemicals complex in the Atyrau region that is designed toproduce up to 800,000 metric tons of polypropylene per year starting in 2016. The 4.5 billion euro ($6.2billion) project was ordered by the Kazakh government to increase the productive use of associatedpetroleum gas, much of it currently flared off. The completion of those two stages is due 2016.
A third complex stage, planned for 2016, is set to produce butadiene using feedstock from two other majorKazakh oil fields, Karachaganak in the country’s north west and Kashagan field in the Caspian Sea. Thecompletion of the stages is due 2018.
the South Korean petrochemical firm LG Chem is planning to build an ethylene production plant in Atyrau.The company will construct it along with two Kazakh firms and production is also due to begin in 2016.
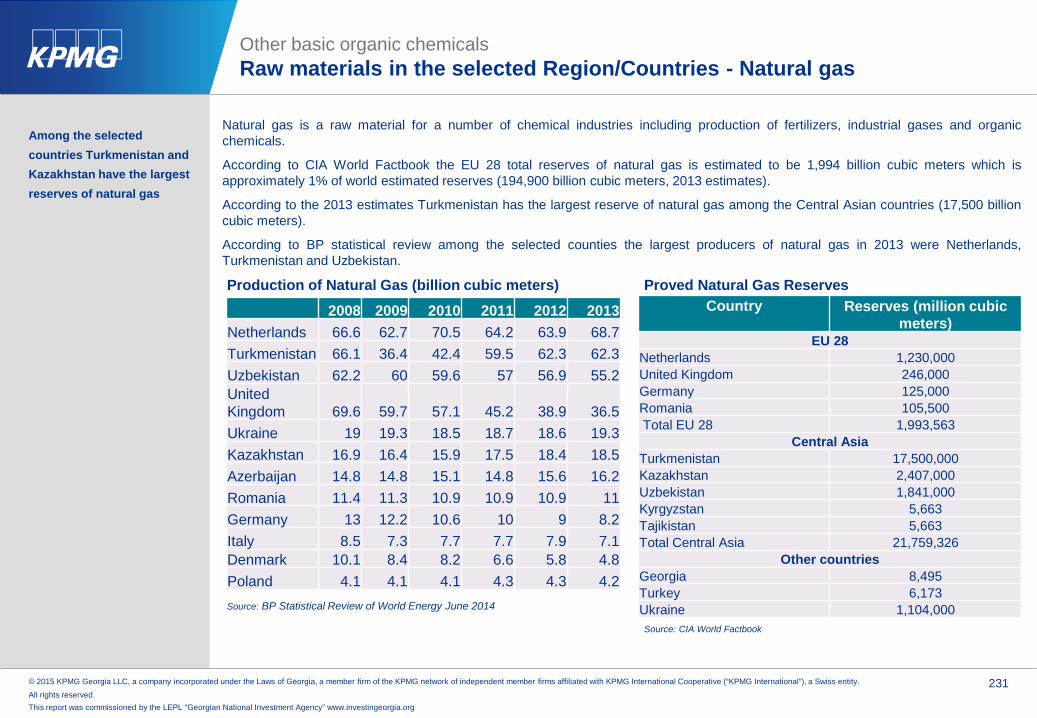
© 2015 KPMG Georgia LLC, a company incorporated under the Laws of Georgia, a member firm of the KPMG network of independent member firms affiliated with KPMG International Cooperative (“KPMG International”), a Swiss entity.
All rights reserved. 231
This report was commissioned by the LEPL “Georgian National Investment Agency” www.investingeorgia.org
Among the selected countries Turkmenistan and Kazakhstan have the largest reserves of natural gas
Natural gas is a raw material for a number of chemical industries including production of fertilizers, industrial gases and organicchemicals.
According to CIA World Factbook the EU 28 total reserves of natural gas is estimated to be 1,994 billion cubic meters which isapproximately 1% of world estimated reserves (194,900 billion cubic meters, 2013 estimates).
According to the 2013 estimates Turkmenistan has the largest reserve of natural gas among the Central Asian countries (17,500 billioncubic meters).
According to BP statistical review among the selected counties the largest producers of natural gas in 2013 were Netherlands,Turkmenistan and Uzbekistan.
2008 2009 2010 2011 2012 2013Netherlands 66.6 62.7 70.5 64.2 63.9 68.7Turkmenistan 66.1 36.4 42.4 59.5 62.3 62.3Uzbekistan 62.2 60 59.6 57 56.9 55.2United Kingdom 69.6 59.7 57.1 45.2 38.9 36.5Ukraine 19 19.3 18.5 18.7 18.6 19.3Kazakhstan 16.9 16.4 15.9 17.5 18.4 18.5Azerbaijan 14.8 14.8 15.1 14.8 15.6 16.2Romania 11.4 11.3 10.9 10.9 10.9 11Germany 13 12.2 10.6 10 9 8.2Italy 8.5 7.3 7.7 7.7 7.9 7.1Denmark 10.1 8.4 8.2 6.6 5.8 4.8Poland 4.1 4.1 4.1 4.3 4.3 4.2
Country Reserves (million cubic meters)
EU 28Netherlands 1,230,000 United Kingdom 246,000 Germany 125,000 Romania 105,500 Total EU 28 1,993,563
Central AsiaTurkmenistan 17,500,000 Kazakhstan 2,407,000 Uzbekistan 1,841,000 Kyrgyzstan 5,663 Tajikistan 5,663 Total Central Asia 21,759,326
Other countriesGeorgia 8,495Turkey 6,173 Ukraine 1,104,000 Source: CIA World Factbook
Proved Natural Gas ReservesProduction of Natural Gas (billion cubic meters)
Source: BP Statistical Review of World Energy June 2014
Other basic organic chemicalsRaw materials in the selected Region/Countries - Natural gas

© 2015 KPMG Georgia LLC, a company incorporated under the Laws of Georgia, a member firm of the KPMG network of independent member firms affiliated with KPMG International Cooperative (“KPMG International”), a Swiss entity.
All rights reserved. 232
This report was commissioned by the LEPL “Georgian National Investment Agency” www.investingeorgia.org
The largest consumers of Natural Gas among the selected countries in 2013 were Germany and United Kingdom
2008 2009 2010 2011 2012 2013Germany 81.2 78 83.3 74.5 78.4 83.6United Kingdom 93.4 87 94.2 78.1 73.7 73.1Italy 77.8 71.5 76.2 71.4 68.7 64.2Turkey 37.5 35.7 39 44.7 45.3 45.6Uzbekistan 48.7 43.5 45.5 49.1 46.9 45.2Ukraine 60 46.8 52.2 53.7 49.5 45France 43.8 41.8 46.9 40.5 42.2 42.8Netherlands 38.6 38.9 43.6 38.1 36.4 37.1Spain 38.6 34.6 34.6 32.2 31.3 29Turkmenistan 20.5 19.9 22.6 23.4 26.4 22.3Belgium 16.5 16.8 18.8 16.6 16.9 16.8Poland 14.9 14.4 15.5 15.7 16.6 16.7Romania 15.9 13.3 13.6 13.9 13.5 12.5Kazakhstan 8.9 8.6 9 9.6 10.4 11.4Azerbaijan 9.2 7.8 7.4 8.1 8.5 8.6Hungary 14 12.7 12.6 10.3 10.2 8.6Austria 9.5 9.3 10.1 9.5 9 8.5Czech Republic 8.7 8.2 9.3 8.4 8.2 8.4Slovakia 5.7 4.9 5.6 5.2 4.9 5.4Republic of Ireland 5 4.7 5.2 4.6 4.5 4.5Portugal 4.7 4.7 5.1 5.2 4.5 4.1Denmark 4.6 4.4 5 4.2 3.9 3.7Greece 3.9 3.3 3.6 4.4 4.1 3.6Switzerland 3.1 3 3.3 3 3.3 3.6Finland 4 3.6 3.9 3.5 3.1 2.8Lithuania 3.2 2.7 3.1 3.4 3.3 2.7Bulgaria 3.2 2.3 2.6 2.9 2.7 2.6Sweden 0.9 1.1 1.6 1.3 1.1 1.1Armenia 1.9 1.6 1.7 2.1 2.5 N/AGeorgia 1.7 1.7 1.7 1.5 1.8 N/AKyrgyzstan 0.8 0.7 0.5 0.4 0.4 N/ATajikistan 0.4 0.2 0.2 0.2 0.2 N/A
Consumption of Natural Gas (billion cubic meters)
Source: BP Statistical Review of World Energy June 2014, International Energy Statistics, KMPG analysis
Other basic organic chemicalsRaw materials in the selected Region/Countries - Natural gas

© 2015 KPMG Georgia LLC, a company incorporated under the Laws of Georgia, a member firm of the KPMG network of independent member firms affiliated with KPMG International Cooperative (“KPMG International”), a Swiss entity.
All rights reserved. 233
This report was commissioned by the LEPL “Georgian National Investment Agency” www.investingeorgia.org
The largest exporters of Natural Gas in gaseous state among the selected countries in 2013 were Netherlands and Germany
The largest importers of Natural Gas in gaseous state among the selected countries in 2013 were Germany and Italy
Source: ITC
Value exported in 2013 (USD thousand)
Trade balance in 2013 (USD thousand)
Quantity exported in 2013
Quantity Unit
Unit value (USD/unit)
World 225,627,704 453,849,591 Tons 497 Netherlands 23,271,137 13,358,049 38,043,214 Tons 612Germany 14,059,268 -36,169,784 28,705,184 Tons 490Belgium 10,063,419 -7,075,332 20,174,584 Tons 499United Kingdom 3,373,790 -5,912,391 6,554,196 Tons 515France 2,202,720 -16,171,627 4,415,890 Tons 499Other EU 2,676,986 -40,762,913 4,352,180 Tons n/aTurkmenistan 9,000,705 9,000,705 18,711,500 Tons 481Kazakhstan 1,956,818 1,466,640 16,550,235 Tons 118Uzbekistan 1,166,014 1,166,014 3,762,509 Tons 310Azerbaijan 701,980 701,978 2,187,892 Tons 321Armenia 10,340 -561,426 40,223 Tons 257
Natural gas in (gaseous state) export and import, export and import unit value
Value imported in 2013 (USD thousand)
Trade balance in 2013 (USD thousand)
Quantity imported in 2013
Quantity Unit
Unit value (USD/unit)
World 229,527,999 412,705,190 Tons 556Germany 50,229,052 -36,169,784 98,087,015 Tons 512Italy 24,837,440 -24,706,141 40,625,550 Tons 611France 18,374,347 -16,171,627 30,481,122 Tons 603Belgium 17,138,751 -7,075,332 28,431,398 Tons 603Other EU 52,993,664 -23,803,050 83,544,964 Tons n/aUkraine 11,538,192 -11,538,192 18,909,096 Tons 610Armenia 571,766 -561,426 1,718,171 Tons 333Kazakhstan 490,178 1,466,640 3,915,784 Tons 125Georgia 288,392 -288,392 1,447,920 Tons 199Kyrgyzstan 64,158 -64,158 106,432 Tons 603
Other basic organic chemicalsRaw materials in the selected Region/Countries - Natural gas

© 2015 KPMG Georgia LLC, a company incorporated under the Laws of Georgia, a member firm of the KPMG network of independent member firms affiliated with KPMG International Cooperative (“KPMG International”), a Swiss entity.
All rights reserved. 234
This report was commissioned by the LEPL “Georgian National Investment Agency” www.investingeorgia.org
02468
1012141618
2003 2004 2005 2006 2007 2008 2009 2010 2011 2012 2013
US
D p
er m
illio
n B
tu
Japancif
Average GermanImport Price
UK(Heren NBP Index)
USHenry Hub
Canada(Alberta)
Price of Natural gas for various countries
Source: BP Statistical Review of World Energy June 2014, International Energy Statistics, KMPG analysis
In the 2003-2013 period the German import priceof natural gas has increased while the price inthe US has decreased.
The availability of domestic reserve of naturalgas is decisive factor for the price thus thecountries with natural gas reserves havecompetitive advantage in industries which usenatural gases heavily (e.g. nitrogen fertilizerproduction).
Other basic organic chemicals Raw materials in the selected Region/Countries - Natural gas
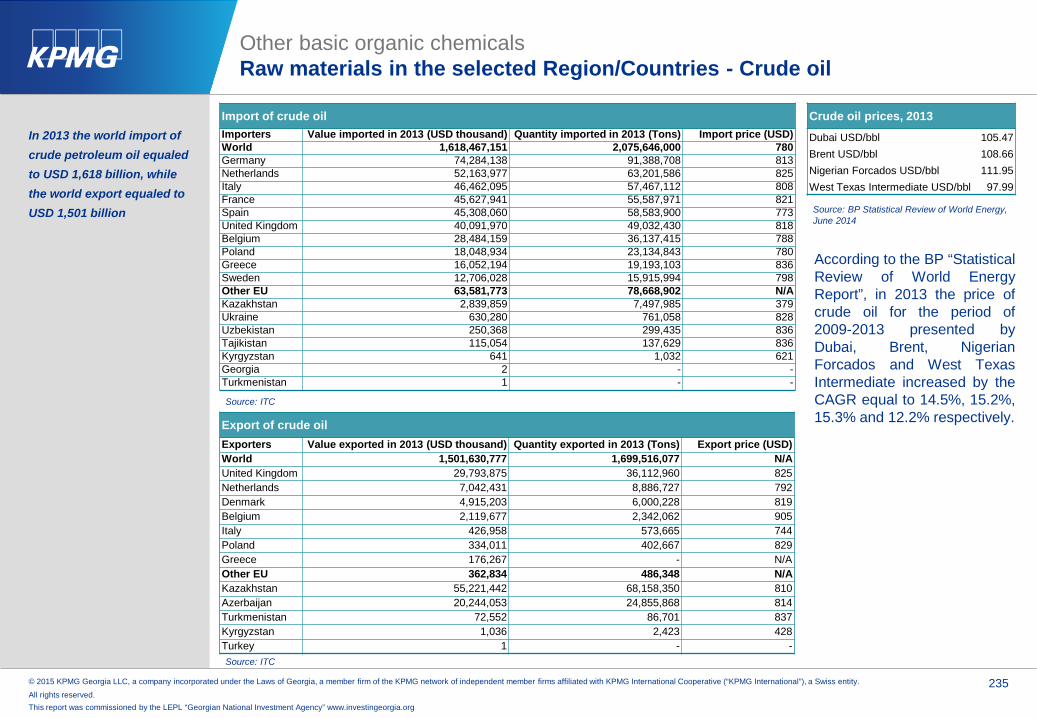
© 2015 KPMG Georgia LLC, a company incorporated under the Laws of Georgia, a member firm of the KPMG network of independent member firms affiliated with KPMG International Cooperative (“KPMG International”), a Swiss entity.
All rights reserved. 235
This report was commissioned by the LEPL “Georgian National Investment Agency” www.investingeorgia.org
In 2013 the world import of crude petroleum oil equaled to USD 1,618 billion, while the world export equaled to USD 1,501 billion
Other basic organic chemicalsRaw materials in the selected Region/Countries - Crude oil
Source: ITC
Import of crude oilImporters Value imported in 2013 (USD thousand) Quantity imported in 2013 (Tons) Import price (USD)World 1,618,467,151 2,075,646,000 780Germany 74,284,138 91,388,708 813Netherlands 52,163,977 63,201,586 825Italy 46,462,095 57,467,112 808France 45,627,941 55,587,971 821Spain 45,308,060 58,583,900 773United Kingdom 40,091,970 49,032,430 818Belgium 28,484,159 36,137,415 788Poland 18,048,934 23,134,843 780Greece 16,052,194 19,193,103 836Sweden 12,706,028 15,915,994 798Other EU 63,581,773 78,668,902 N/AKazakhstan 2,839,859 7,497,985 379Ukraine 630,280 761,058 828Uzbekistan 250,368 299,435 836Tajikistan 115,054 137,629 836Kyrgyzstan 641 1,032 621Georgia 2 - -Turkmenistan 1 - -
Export of crude oilExporters Value exported in 2013 (USD thousand) Quantity exported in 2013 (Tons) Export price (USD)World 1,501,630,777 1,699,516,077 N/AUnited Kingdom 29,793,875 36,112,960 825Netherlands 7,042,431 8,886,727 792Denmark 4,915,203 6,000,228 819Belgium 2,119,677 2,342,062 905Italy 426,958 573,665 744Poland 334,011 402,667 829Greece 176,267 - N/AOther EU 362,834 486,348 N/AKazakhstan 55,221,442 68,158,350 810Azerbaijan 20,244,053 24,855,868 814Turkmenistan 72,552 86,701 837Kyrgyzstan 1,036 2,423 428Turkey 1 - -Source: ITC
Crude oil prices, 2013
Dubai USD/bbl 105.47Brent USD/bbl 108.66Nigerian Forcados USD/bbl 111.95West Texas Intermediate USD/bbl 97.99
According to the BP “StatisticalReview of World EnergyReport”, in 2013 the price ofcrude oil for the period of2009-2013 presented byDubai, Brent, NigerianForcados and West TexasIntermediate increased by theCAGR equal to 14.5%, 15.2%,15.3% and 12.2% respectively.
Source: BP Statistical Review of World Energy, June 2014

© 2015 KPMG Georgia LLC, a company incorporated under the Laws of Georgia, a member firm of the KPMG network of independent member firms affiliated with KPMG International Cooperative (“KPMG International”), a Swiss entity.
All rights reserved. 236
This report was commissioned by the LEPL “Georgian National Investment Agency” www.investingeorgia.org
35
51.119.9
109.417.3 5.6 238.3
0
50
100
150
200
250
300
Total NorthAmerica
Total S.and Cent.America
TotalEurope and
Eurasia
TotalMiddleEast
Total Africa Total AsiaPacific
Total World
Bill
ion
tone
s
World proved reserves of crude oil*In 2013 the value of total world proved oil reserves was equal to 238.3 billion tones, while the value of the total world refinery capacity was equal to 94,928 thousand barrels daily
In 2013 Venezuela had the biggest share in the total world proved oil reserves equal to 19.6% (46.6 billion tones), while US had the biggest share in the total world refinery capacity equal to 18.8% (17,818 thousand barrels daily)
According to the “OPEC Annual Statistical Bulletin” in2013 Ukraine had crude oil reserves equal to 395million barrels. According to the same bulletin in 2013Ukraine, Kazakhstan and Azerbaijan had refinerycapacities equal to 879.8 thousand barrels percalendar day, 345.1 thousand barrels per calendar dayand 399 thousand barrels per calendar dayrespectively.
According to the BP “Statistical Review of WorldEnergy Report”, in 2013 the oil reserves of RussianFederation comprised 63.8% (6,027 thousand barrelsdaily) of the total oil reserves of Europe and Eurasiaproved oil reserves while the refinery capacities ofRussian Federation comprised 63.8% (12.7 billiontones) of the total refinery capacities of Europe andEurasia refinery capacities.
Source: BP Statistical Review of World Energy, June 2014Note: * Proved reserves of crude oil - Generally taken to be those quantities that geological and engineering information indicates with reasonable certainty can be recovered in the future from known reservoirs under existing economic and operating conditions.
** Atmospheric distillation capacity on a calendar-day basis.
Europe and Eurasia proved reserves of crude oil*Billion tonesTotal EU 28 0.8Denmark 0.1Romania 0.1Italy 0.2United Kingdom 0.4Total Central Asial 4.1Turkmenistan 0.1Uzbekistan 0.1Kazakhstan 3.9Total Other countries 15.0Azerbaijan 1.0Other Europe and Eurasia 14.0Total Europe and Eurasia 19.9
Europe and Eurasia refinery capacities**Thousand barrelsTotal EU 28 12,335.0Belgium 810France 1,520Germany 2,061Greece 498Netherlands 1,274Spain 1,537Sweden 434Turkey 613Italy 2,062United Kingdom 1,526Total Other countries 11,551Other Europe and Eurasia 11,551Total Europe and Eurasia 23,886
21,389
6,029
23,887
8,822
3,517
31,284
94,928
0 20,000 40,000 60,000 80,000 100,000
Total North America
Total S. and Cent. America
Total Europe and Eurasia
Total Middle East
Total Africa
Total Asia Pacific
Total World
Thousand barrels daily
World refinery capacity**
Other basic organic chemicalsRaw materials in the selected Region/Countries - Crude oil
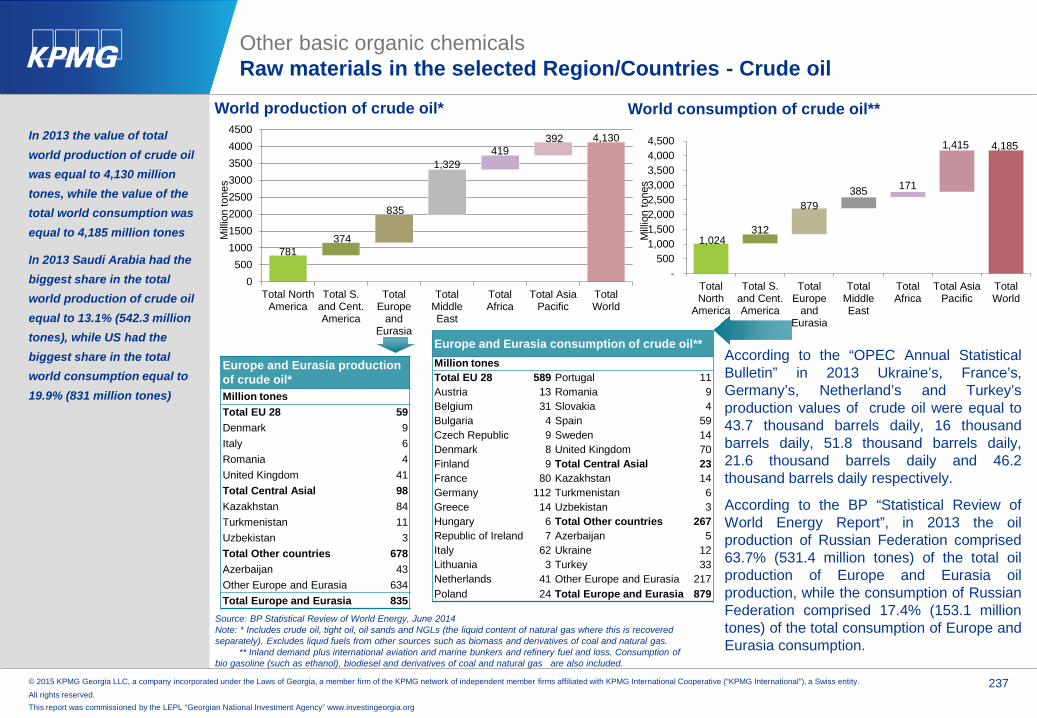
© 2015 KPMG Georgia LLC, a company incorporated under the Laws of Georgia, a member firm of the KPMG network of independent member firms affiliated with KPMG International Cooperative (“KPMG International”), a Swiss entity.
All rights reserved. 237
This report was commissioned by the LEPL “Georgian National Investment Agency” www.investingeorgia.org
781 374
835
1,329 419
392 4,130
0500
10001500200025003000350040004500
Total NorthAmerica
Total S.and Cent.America
TotalEurope
andEurasia
TotalMiddleEast
TotalAfrica
Total AsiaPacific
TotalWorld
Mill
ion
tone
s
World production of crude oil*In 2013 the value of total world production of crude oil was equal to 4,130 million tones, while the value of the total world consumption was equal to 4,185 million tones
In 2013 Saudi Arabia had the biggest share in the total world production of crude oil equal to 13.1% (542.3 million tones), while US had the biggest share in the total world consumption equal to 19.9% (831 million tones)
Source: BP Statistical Review of World Energy, June 2014Note: * Includes crude oil, tight oil, oil sands and NGLs (the liquid content of natural gas where this is recovered separately). Excludes liquid fuels from other sources such as biomass and derivatives of coal and natural gas.
** Inland demand plus international aviation and marine bunkers and refinery fuel and loss. Consumption of bio gasoline (such as ethanol), biodiesel and derivatives of coal and natural gas are also included.
Europe and Eurasia production of crude oil*Million tonesTotal EU 28 59Denmark 9Italy 6Romania 4United Kingdom 41Total Central Asial 98Kazakhstan 84Turkmenistan 11Uzbekistan 3Total Other countries 678Azerbaijan 43Other Europe and Eurasia 634Total Europe and Eurasia 835
1,024 312
879 385 171
1,415 4,185
-500
1,0001,5002,0002,5003,0003,5004,0004,500
TotalNorth
America
Total S.and Cent.America
TotalEurope
andEurasia
TotalMiddleEast
TotalAfrica
Total AsiaPacific
TotalWorld
Mill
ion
tone
s
World consumption of crude oil**
Europe and Eurasia consumption of crude oil**Million tonesTotal EU 28 589 Portugal 11Austria 13 Romania 9Belgium 31 Slovakia 4Bulgaria 4 Spain 59Czech Republic 9 Sweden 14Denmark 8 United Kingdom 70Finland 9 Total Central Asial 23France 80 Kazakhstan 14Germany 112 Turkmenistan 6Greece 14 Uzbekistan 3Hungary 6 Total Other countries 267Republic of Ireland 7 Azerbaijan 5Italy 62 Ukraine 12Lithuania 3 Turkey 33Netherlands 41 Other Europe and Eurasia 217Poland 24 Total Europe and Eurasia 879
According to the “OPEC Annual StatisticalBulletin” in 2013 Ukraine’s, France’s,Germany’s, Netherland’s and Turkey’sproduction values of crude oil were equal to43.7 thousand barrels daily, 16 thousandbarrels daily, 51.8 thousand barrels daily,21.6 thousand barrels daily and 46.2thousand barrels daily respectively.
According to the BP “Statistical Review ofWorld Energy Report”, in 2013 the oilproduction of Russian Federation comprised63.7% (531.4 million tones) of the total oilproduction of Europe and Eurasia oilproduction, while the consumption of RussianFederation comprised 17.4% (153.1 milliontones) of the total consumption of Europe andEurasia consumption.
Other basic organic chemicalsRaw materials in the selected Region/Countries - Crude oil

© 2015 KPMG Georgia LLC, a company incorporated under the Laws of Georgia, a member firm of the KPMG network of independent member firms affiliated with KPMG International Cooperative (“KPMG International”), a Swiss entity.
All rights reserved. 238
This report was commissioned by the LEPL “Georgian National Investment Agency” www.investingeorgia.org
Other basic organic chemicalsMain factors of successful functionality of the factory
Main factors Description
Buyer power The sector includes a large variety of products, which are mainly bought by different large scaleindustries such as metal working, food and beverages, energy, etc. The markets of most sectors ofthe other basic organic chemicals have high concentration and supply to a huge amount of buyersthus weakening the buyers’ power.
Raw materialsavailability (supplier power)
Other basic organic chemicals are extracted from various types of plants and animals, as well as,are made from natural oil and gas. The prices of the crude oil and natural gas are one of the keyfactors impacting on the prices of the other basic organic chemicals. Natural gas and crude oil arecommodities and supplier companies have relatively similar extraction (drilling) and productionprocesses. This leads the players of the other basic organic chemical market to seek lower pricesand better contract terms with the suppliers.
Production scale For being cost effective a large scale production (to achieve the economies of scale) is required.
Intellectual property The sector of other basic organic chemicals is composed of different sub-sectors each of which produces specific products demanding special production processes and qualifications. As the sector is specific, the intellectual property is a key asset for the companies processing in the sector. Therefore investments in the intellectual property, as well as, in the research and development (R&D) are required.
Degree of regulation There is a large scale of environmental regulations, which are applied to the production, storage and transportation of other basic organic chemicals. The sector is highly regulated in some countries andmany businesses need special licenses for their operations.
Demand drivers The other basic organic chemicals include large variety of products which are used in different industries for producing the final product, for instance aromatics are used to make products in the sectors of medicine, transport, telecommunications, fashion and sports, etc. Therefore, the existence of the large scale industries using other basic organic chemicals in their production processes influences on the demand of other basic organic chemicals.
Other factors Most of the sectors of the other basic organic chemicals need significant capital investments, as wellas, development logistics, thus having high barriers for exiting the market.

The KPMG name, logo and “cutting through complexity” are registered trademarks or trademarks of KPMG International.
© 2015 KPMG Georgia LLC, a company incorporated under the Laws of Georgia, a member firm of the KPMG network of independent member firms affiliated with KPMG International Cooperative (“KPMG International”), a Swiss entity. All rights reserved.


