Georgia’s Tax Credit Scholarship Program Robert Buschman David L. Sjoquist Fiscal Research Center Andrew Young School of Policy Studies Georgia State University Atlanta, GA FRC Report No. 268 November 2014
Transcript
Georgia’s Tax Credit Scholarship Program Robert Buschman David L. Sjoquist
Fiscal Research Center Andrew Young School of Policy Studies Georgia State University Atlanta, GA FRC Report No. 268 November 2014
GEORGIA’S TAX CREDIT SCHOLARSHIP PROGRAM
Robert Buschman David L. Sjoquist
Fiscal Research Center Andrew Young School of Policy Studies Georgia State University Atlanta, GA FRC Report No. 268 November 2014
Georgia’s Tax Credit Scholarship Program
ii
Table of Contents
I. Introduction ................................................................................................................... 1
II. History of Tax Credit Scholarship Programs in Georgia and Other States................... 2
III. Current Law and Regulations for Georgia’s Tax Credit Scholarship Program ............ 3
IV. Participation in Georgia’s Tax Credit Scholarship Program ........................................ 6
V. Pros and Cons of Tax Credit Scholarship Programs ..................................................... 9
VI. Existing Evaluations of Tax Credit Scholarship Programs ......................................... 10
VII. Fiscal Effects of Georgia’s Tax Credit Scholarship Program ..................................... 12
VIII. Proposal for an Additional Tax Credit Scholarship Program ..................................... 21
IX. Evaluating the Efficacy of the Tax Credit Scholarship Program ................................ 25
X. Summary and Conclusions ......................................................................................... 27
About the Authors ................................................................................................................... 30
About the Fiscal Research Center ........................................................................................... 30
Georgia’s Tax Credit Scholarship Program
1
I. Introduction
In 2008, Georgia adopted legislation that allows tax credits, officially the Qualified
Education Tax Credit (QETC), for donations that are used to fund scholarships for students
enrolled in private schools. This report presents an overview of this program. We start with
some background, including the history, legislation, and data on participation. Next we the
list the arguments for and against the program and provide a summary of a few existing
studies of tax credit scholarship programs. Section VII provides an analysis of the fiscal
effects of the program and in Section VIII we turn to an analysis of a proposed second tax
credit scholarship program. Finally, we discuss the need for a more extensive evaluation of
the program.
Georgia’s Tax Credit Scholarship Program
2
II. History of Tax Credit Scholarship Programs in Georgia and Other States
According to the Friedman Foundation for Educational Choice, as of 2014 there are
14 states that offer tax credit funded scholarship programs; Alabama, Arizona, Florida,
Georgia, Indiana, Iowa, Kansas, Louisiana, New Hampshire, Oklahoma, Pennsylvania,
Rhode Island, South Carolina, and Virginia. The oldest is Arizona’s, having been enacted in
1997, and the most recently enacted programs are in Alabama and South Carolina in 2013
and Kansas in 2014. Several states also offer voucher programs or narrowly-tailored
scholarship programs for foster children and children with disabilities, but those programs are
beyond the scope of this report.
The scholarship programs differ in many ways, among them the value of the credit
(i.e., as a percentage of the amount donated), the maximum allowable credit to any donor, the
maximum total credits allowed, the maximum scholarship, and eligibility criteria for
scholarship recipients, including means testing. Credit values range from 50 percent of the
amount donated in Indiana and Oklahoma to 100 percent in Georgia and five other states.
Four states—Florida, Kansas, New Hampshire, and Rhode Island—offer tax credits only to
business donors while the remaining ten states offer credits to both businesses and individual
taxpayers. Caps on the total tax credits available annually range from $1.5 million in Rhode
Island to $385 million in Florida; Louisiana has no aggregate limit. Eligibility rules in most
states include means-testing, though the criteria vary widely. Two exceptions are Georgia,
which does not means-test recipients, and Arizona, which does so only for scholarships
funded through its corporate tax credit program. Finally, the programs differ across the states
in terms of regulation, particularly governance and reporting requirements for scholarship-
granting organizations.1
1 For detailed surveys of existing programs, see the Friedman Foundation for Educational Choice website, www.edchoice.org, and Education Tax Credit Programs: An Analysis of Provisions by State (2013) from the Foundation for Opportunity in Education, available at www.opportunityined.org.
Georgia’s Tax Credit Scholarship Program
3
III. Current Law and Regulations for Georgia’s Tax Credit Scholarship Program
Tax Credits
Under O.C.G.A. §48-7-29.16, a credit against income taxes is allowed for
contributions to qualified student scholarship organizations to fund scholarships for eligible
students to attend a qualified school or program. Credits are 100 percent of the amount
contributed, subject to preapproval by the Department of Revenue (DOR), with caps for
individual taxpayers, corporations, fiduciaries, and pass-through entities as follows:
● Individuals filing as: Single or Head of Household $1,000 Married Filing Joint $2,500 Married Filing Separately $1,250
● Corporations and Fiduciaries 75 percent of tax liability for the year.
● Pass-Through Entity Owner/Partner 6 percent of Georgia income from selected pass through interests, but not more than $10,000 per taxpayer.
For the latter two categories, limits for preapprovals are based on the above
calculations using estimated tax liability or pass-through income, while the final allowed
credit amounts are based on actual tax liability or pass-through income. As a result, allowed
credits for these taxpayers may be less than preapproved amounts, even if less than the
amount of contributions.
Credits are non-refundable, but any portion of the final allowed credit amount that is
unused in the tax year of the contribution may be carried forward for up to five years. No
credit is allowed if the taxpayer designates his or her contribution for the benefit of any
particular individual. No credit is allowed with respect to contributions that are taken as a
deduction from taxable income as a charitable contribution; if such a deduction is taken by
the taxpayer on his or her federal return, the amount deducted must be added back to Georgia
taxable income to qualify for the credit.
The total amount of credits available for any tax year is currently capped under the
law at $58 million, an increase effective for tax year 2013 from $50 million. Applications for
Georgia’s Tax Credit Scholarship Program
4
credit preapproval must be submitted electronically to the Department of Revenue (DOR)
and are approved on a first come, first served basis beginning on the first of each year and
continuing until the aggregate annual limit is reached. The DOR must provide notice of
preapproval or denial within 30 days of filing of the preapproval request form and, if
preapproved, contributions must be made within 60 days of the date of the preapproval
Number of Scholarships 11,292 13,285 13,268 Total Awarded ($ thousands) $39,457 $45,006 $46,660 Average Scholarship Award $3,494 $3,388 $3,517
Source: Georgia Department of Revenue.
Georgia’s Tax Credit Scholarship Program
8
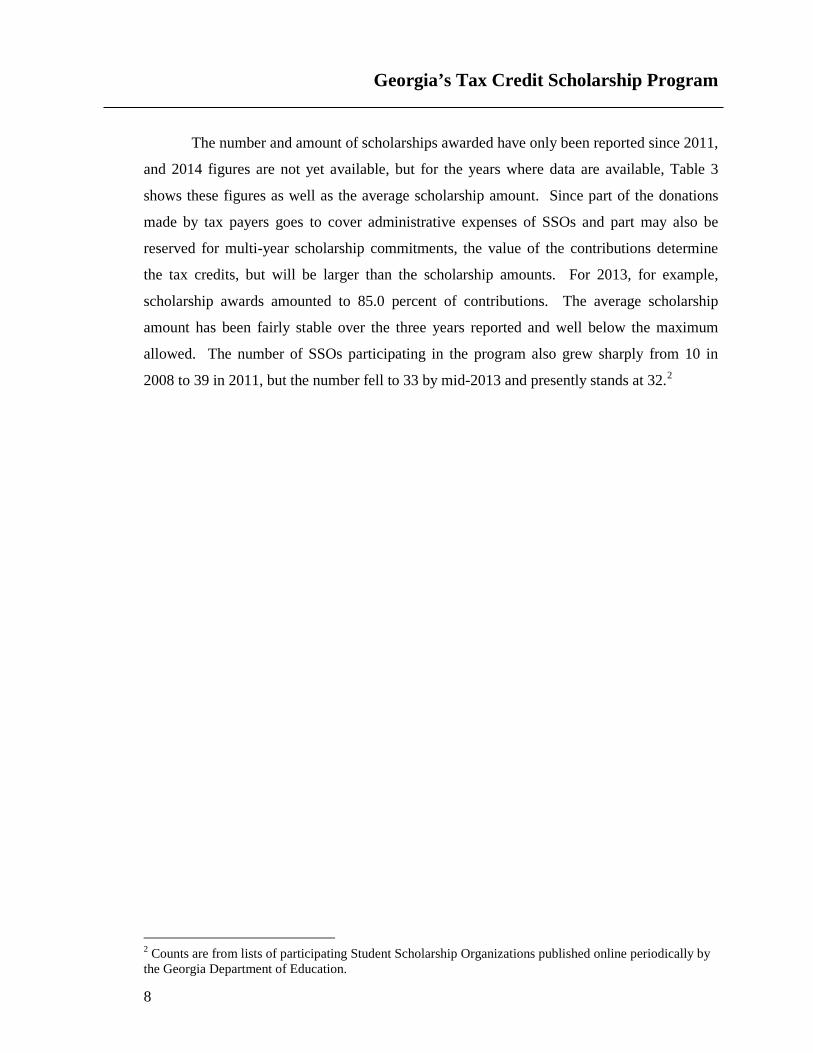
The number and amount of scholarships awarded have only been reported since 2011,
and 2014 figures are not yet available, but for the years where data are available, Table 3
shows these figures as well as the average scholarship amount. Since part of the donations
made by tax payers goes to cover administrative expenses of SSOs and part may also be
reserved for multi-year scholarship commitments, the value of the contributions determine
the tax credits, but will be larger than the scholarship amounts. For 2013, for example,
scholarship awards amounted to 85.0 percent of contributions. The average scholarship
amount has been fairly stable over the three years reported and well below the maximum
allowed. The number of SSOs participating in the program also grew sharply from 10 in
2008 to 39 in 2011, but the number fell to 33 by mid-2013 and presently stands at 32.2
2 Counts are from lists of participating Student Scholarship Organizations published online periodically by the Georgia Department of Education.
Georgia’s Tax Credit Scholarship Program
9
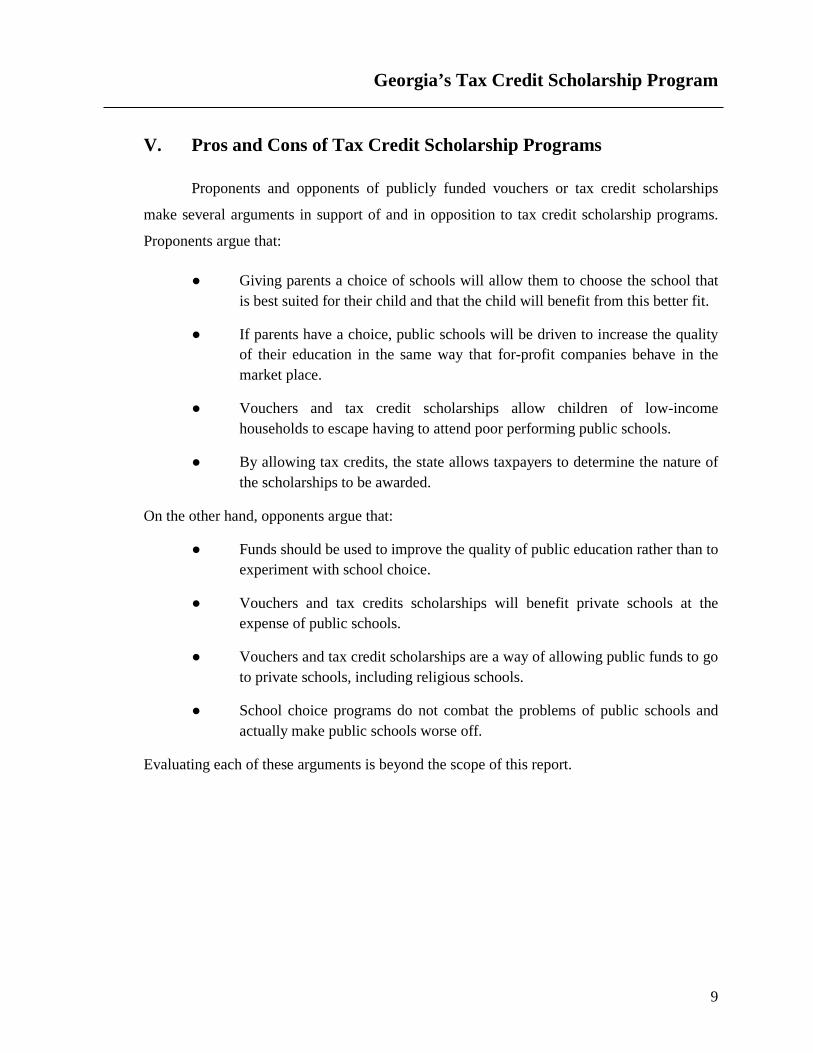
V. Pros and Cons of Tax Credit Scholarship Programs
Proponents and opponents of publicly funded vouchers or tax credit scholarships
make several arguments in support of and in opposition to tax credit scholarship programs.
Proponents argue that:
● Giving parents a choice of schools will allow them to choose the school that is best suited for their child and that the child will benefit from this better fit.
● If parents have a choice, public schools will be driven to increase the quality of their education in the same way that for-profit companies behave in the market place.
● Vouchers and tax credit scholarships allow children of low-income households to escape having to attend poor performing public schools.
● By allowing tax credits, the state allows taxpayers to determine the nature of the scholarships to be awarded.
On the other hand, opponents argue that:
● Funds should be used to improve the quality of public education rather than to experiment with school choice.
● Vouchers and tax credits scholarships will benefit private schools at the expense of public schools.
● Vouchers and tax credit scholarships are a way of allowing public funds to go to private schools, including religious schools.
● School choice programs do not combat the problems of public schools and actually make public schools worse off.
Evaluating each of these arguments is beyond the scope of this report.
Georgia’s Tax Credit Scholarship Program
10
VI. Existing Evaluations of Tax Credit Scholarship Programs
There has been very little analysis of any of the tax credit funded scholarship
programs other than analyses of their fiscal effects. Though there is a vast literature that
explores the effects of other school choice programs such as voucher programs and charter
schools, there has been no analysis of the effect of tax credit scholarship programs on
academic performance. A review of the literature on performance effects of school choice
programs is beyond the scope of this report.
As to fiscal impact, Gottlob (2008) conducted an analysis of the potential impact of a
tax credit scholarship program in Georgia before Georgia had implemented the program. He
first develops an estimate of the reduction in expenditures per student if public school
students transfer to a private school. Gottlob then estimates the number of public school
students that would be expected to transfer to private school for different values of
scholarships. He refers to this as the demand for scholarships. He estimated this demand for
different levels of income, measured by percent of poverty level. If the scholarship amount is
low, few students would take a scholarship, i.e., would transfer from the public schools to a
private school. If eligibility is limited to lower income students, even fewer students would
transfer.
Given the expected donations, he calculates the number of scholarships that could be
offered for different values of the scholarship. He refers to this as the supply of scholarships.
Then for each scholarship level he calculates the minimum of the demand and supply, which
is the actual number of scholarships that would be taken. He then calculates the difference
between the total scholarship funds and the reduction in total public school spending due to
students transferring from a public to a private school. If the number of students who transfer
is small, for example if the scholarship value is small, the state would provide more in tax
credits than the reduction in school expenditures. Gottlob assumes that all scholarship
recipients would have gone to the public school in the absence of the scholarship. This is an
assumption that is made in most other fiscal analysis studies for other states; as we note
below, that assumption is probably incorrect.
Lips and Jacoby (2001) conducted a fiscal evaluation of Arizona’s tax credit
scholarship program for the CATO Institute. They report that 70 to 80 percent of the
scholarships are distributed to low-income families. The average scholarship was $846.
Georgia’s Tax Credit Scholarship Program
11
They also explored the percentage of scholarship students who were previously enrolled in
public schools or would probably have to leave private school if they did not receive a
scholarship. They concluded that between 15 and 30 percent of the scholarships were
dedicated to students who would have otherwise attended public school. They estimate that
the scholarship program was “essentially revenue neutral.”
In addition to Gottlob, the only other report that provides any evaluation of Georgia’s
tax credit scholarship program was done by the Southern Education Foundation (SEF,
undated). In the report, SEF first presents a brief history of the program as of 2012 and then
details the various ways that the operation of the program is, according to SEF, in violation of
the law and associated regulations. For example, SEF presents evidence that some SSOs
allow a parent to earmark their donation to fund a scholarship for a particular child.3 The
SEF report also raises questions as to whether the schools participating in the program are
actually eligible and whether the SSOs have allocated the required percentage of the
donations to scholarships. Finally, the report provides data on the likely characteristics of the
students, such as income, race, and religion, and on student performance. However, since
state law restricts the information that can be collected on the program and that can be made
available publicly, the SEF report had to rely on more general data to draw any conclusions.
3 In January 2013, the SEF submitted a document to the Georgia Department of Revenue that contains the evidence the SEF collected regarding this issue and requested an investigation.
Georgia’s Tax Credit Scholarship Program
12
VII. Fiscal Effects of Georgia’s Tax Credit Scholarship Program
This section presents an analysis of the fiscal impact of the tax credit scholarship
program, which depends on the amount of tax credits taken and the reduction in spending on
public education. The value of tax credits taken is the gross reduction in state revenue.
However, if scholarship students switch from a public to a private school, the state and the
local school system can each reduce their spending by the amount of the variable cost of
educating that student. Thus, the net fiscal effect of the tax credit scholarship on the state’s
budget equals the value of the tax credits that are taken less any reduction in state education
grants due to the scholarship program.
There are four variables that determine the fiscal impact: the tax credits per
scholarship recipient, the number of recipients, the reduction in spending on education if a
student switches from public school to private school as a result of the scholarship, and the
share of scholarship recipients who switch. We discuss each of these variables in turn.
Consider first the tax credits per scholarship recipient. The legislation caps the
amount of tax credits that can be taken and preapproved credits reached the cap in each of the
last four years. However, taxpayers apply to take the tax credit and subsequently make the
donation, so some taxpayers who have been approved for the tax credit may not actually
make the donation (see Table 1) and thus do not get a tax credit. In addition, credits earned
in a given year may not be fully used to offset tax liability in the same year; some may be
carried forward to subsequent years. For these reasons, we would ideally use the actual tax
credit taken, and not the credits approved or donations received by SSOs, in calculating the
revenue loss to the state.
Additionally, some of the donations are used for administrative expense, and thus on
a per scholarship recipient basis, the cost to state revenue is the total tax credits taken per
scholarship recipient, not the value of the scholarship per recipient. For simplicity, we
assume for the analysis that follows that tax credits taken equals $50 million. Note that the
number of scholarships times the tax credit per scholarship thus equals $50 million.
The third variable is the reduction in public school education expenditures if a student
leaves the public school system. We first discuss the fiscal effect on just the state
government, and thus consider the reduction in the state education grant to the local school
Georgia’s Tax Credit Scholarship Program
13
system. There are several factors that have to be considered in determining the value of this
change in state education grant.
First, state grants for K-12 education are based largely on a per student (full time
equivalent) basis, and thus the reduction in the state grant if the school system loses a student
is approximately equal to the average grant per student. Only the categorical grants in the
Quality Basic Education (QBE) program are not based on full time equivalent (FTE) counts
and these are a very small percentage of the total grant.4 Thus, while the average grant per
FTE may overstate the reduction in state expenditure, it is very close to the actual reduction.
Second, the reduction in the state grant for K-12 education depends on which school
system the student is from and the grade or programs the student is in. State grants vary
across school systems due to variations in property tax wealth for two reasons: the QBE
grant to a school system is reduced by the amount of property taxes that 5 mills will raise,
and the equalization grant depends on the property wealth per student.
Third, the state grant also depends on the experience and education of the teachers in
the system. A system with more experienced teachers and with teachers holding higher
academic degrees will get more revenue from the state, so the savings to the state from a
student shifting from public to private school will be larger for these systems than for those
with less experienced and less highly educated teachers.
Fourth, under QBE the size of the state grant per student depends on the program or
grade the student is in. A student in basic high school courses earns the school system the
smallest grant, while a student in special education earns the school system a larger grant.
Table 4 and Figure 2 provide information on how the size of the state grant per
student (FTE) varies across school systems, and across grade levels and programs. As can be
seen, there is substantial variation in the size of the grant per student; mean values, weighted
by FTE students, range from $3,223 for high school grades to $6,580 for special education,
gifted, ESOL, and other programs. For all programs, the FTE weighted mean is $4,066 while
the low and high for all districts are $1,458 and $7,098, respectively.
4 While not calculated based on FTE, the grant for school busing is related to enrollment.
Georgia’s Tax Credit Scholarship Program
14
TABLE 4. TOTAL STATE GRANT PER FTE BY SCHOOL DISTRICT (FY2013)
Grades/Programs: K-8 High School Sp. Ed./Other All Programs
Mean (unweighted) $4,265 $3,561 $7,122 $4,490 Median $4,268 $3,590 $7,483 $4,552 Minimum $1,361 $1,202 $2,406 $1,458 Maximum $6,696 $6,060 $12,941 $7,098
FTE Weighted Mean $3,804 $3,223 $6,580 $4,066 Source: Georgia Department of Education.
FIGURE 2. DISTRIBUTION OF STATE EDUCATION GRANTS PER FTE (FY2013)
0%
5%
10%
15%
20%
25%
30%
35%
40%
Perc
ent o
f Tot
al F
TE
State QBE Grants per FTE ($ thousands)
K-8 High School All Programs
Source: Georgia Department of Education.
Thus, to determine how much the state saves from a student switching from public to
private school, it is necessary to know from what school system and program the student was
switching. The Southern Education Foundation (undated) reports that Cobb, DeKalb, Fulton,
and Gwinnett counties in metropolitan Atlanta are home to 43.5 percent of the private
schools that enroll scholarship program students; these four counties have 28 percent of
public school students. Since these school systems tend to have higher wealth per student,
their grant per student are less than the average for the state; the weighted average QBE grant
to these counties in 2013 was $3,587, compared to the state average of $4,066. For our
Georgia’s Tax Credit Scholarship Program
15
calculations we assume that the state would save $4,066 per student, on average, but we test
the sensitivity of the fiscal effects using the lower QBE grant average for these Metro Atlanta
counties.
Finally, in addition to knowing how much the state would save from a student
transferring from public to private school, we need to know the percentage of scholarship
students who in the absence of the scholarship would have attended public schools. For
convenience we call this percentage the switching rate. That information is not available, nor
do we have the data necessary to estimate it.5 Consequently, we rely on estimates presented
in other studies, though the literature is limited.
Lips and Jacoby (2001) suggest that for Arizona’s program, which like Georgia’s is
not restricted to low-income students, the switching rate ranges from 15 percent to 30 percent
of scholarship recipients, with a breakeven fiscal impact (revenue loss from 1999 tax credits
equal to cost savings in 2000-2001 school year) at about 20 percent. Their range estimate of
switching rates, however, is derived from interviews with the private schools rather than from
hard data.
Among the literature on voucher programs, Ferreyra (2007) develops a general
equilibrium model of school choice in the Chicago area based on 1990 Census and other data.
Absent a voucher program, she estimates equilibrium private school enrollment at about 16
percent of households with children in school. With a $1,000 voucher (a little more than 1/8
of the public school per student spending in her model) that can be used for either religious or
non-religious schools, her model predicts that an additional 6 percent of households will shift
to private schools, bringing the private share to 22 percent. This equates to about 27 percent
of voucher recipients being public-to-private switchers. This switching rate assumes that all
families of students already enrolled in private schools would utilize the vouchers, which
results in a much larger cost than would be the case when those already enrolled in private
schools are not eligible. To the extent that scholarships are awarded on a need basis, the
switch rate would likely be higher and the cost from subsidizing students who would have
attended private schools even in the absence of a scholarship would be lower. In general, the
switching rate will be higher the more restrictions the state imposes on scholarship eligibility.
5 Theoretically, one could compare the change in the public school enrollment to the number of scholarships. However, public school enrollment is not a constant and the number of scholarships is small, and thus it would be nearly impossible to estimate that relationship.
Georgia’s Tax Credit Scholarship Program
16
Other studies of the fiscal effects of tax credit scholarship programs such as Gottlob
(2008) assume a switching rate of 100 percent, but they present no evidence regarding the
veracity of the assumption. However, there are several reasons why the switching rate would
not be 100 percent even with a prior public school enrollment requirement. Parents might
simply enroll their child in a public school for the sole purpose of making him or her eligible
for a scholarship, and thus in the absence of the scholarship would not have attended public
school. Some parents may also have intended to enroll their children in public schools for
the lower grades and move them to a private school later, regardless of the availability of
scholarships. These students would be eligible for a scholarship, but would not count as
switchers. In addition, the public school enrollment restriction on scholarship eligibility does
not apply to private school students who start private school by the first grade. As a result,
those qualifying at that stage will include those who would have enrolled in private school
anyway, in addition to those who would have gone to public school if not for the scholarship.
We have been unable to find data on when private school students tend to first enroll, but if
these students receive scholarships the actual switching rate will be lower. In addition, home
schooled children are also eligible for scholarships in Georgia if they have been home
schooled for at least a year. The probability that such a child would switch from home school
to a public school is likely to be small. Thus, providing a scholarship for such a student is
not likely to reduce enrollment in public schools.
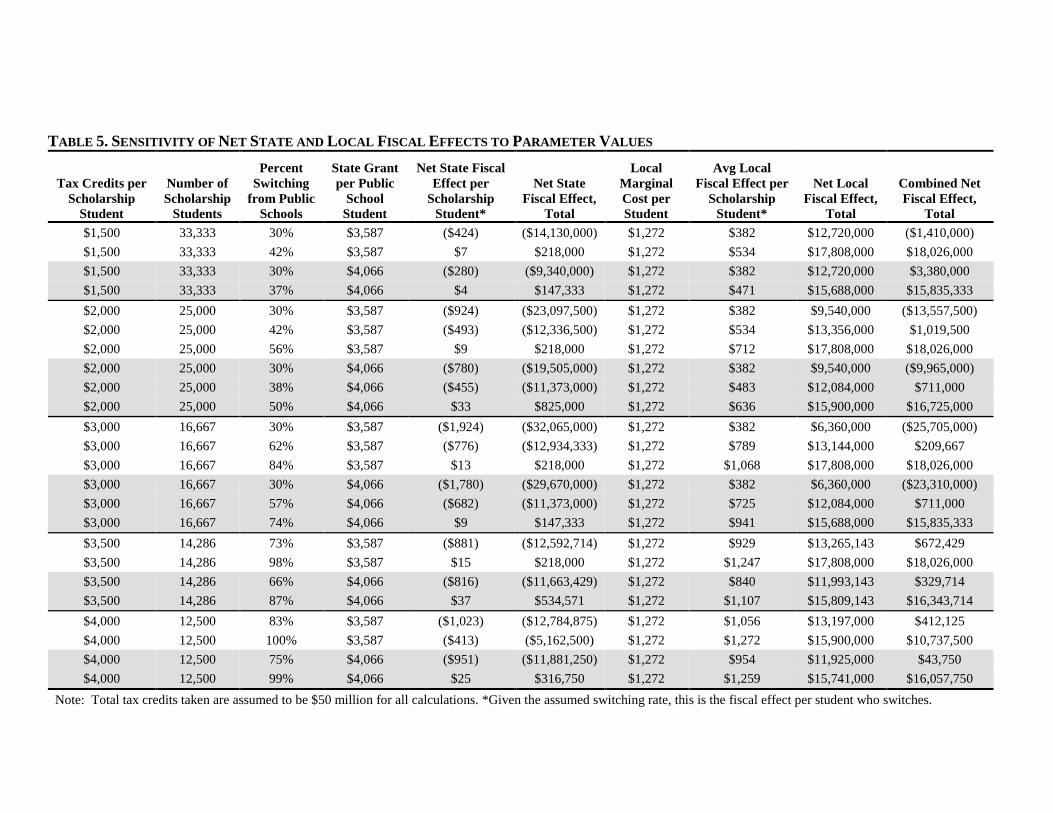
In the analysis presented in Table 5, we use switching rates of 30 percent or higher to
illustrate the sensitivity of the fiscal impact to differences in this and other parameter values.
For higher levels of assumed tax credits per scholarship student, we calculated the switching
rate that would be required for the state to break even, that is to have a zero or small positive
net fiscal effect. For simplicity, we assume $50 million of tax credits for all calculations and
vary the tax credits per scholarship student, the switching rate, and the state grant per student.
For the state grant, again, we use the overall (all grades/programs) weighted mean grant per
full-time equivalent student for the high and the mean grant for students in four metropolitan
Atlanta county systems for the low, that is, $4,066 and $3,587, respectively. For tax credits
per scholarship student, we use a low of $1,500 and higher levels up to $4,000.
TABLE 5. SENSITIVITY OF NET STATE AND LOCAL FISCAL EFFECTS TO PARAMETER VALUES
Note: Total tax credits taken are assumed to be $50 million for all calculations. *Given the assumed switching rate, this is the fiscal effect per student who switches.
Georgia’s Tax Credit Scholarship Program
18
If the average QBE grant is $4,066, the tax credit scholarship program would have a
negative net fiscal effect at the state level at a switching rate of 30 percent and tax credits per
student of $1,500, but would break even at the state level with a switching rate of 37 percent.
If scholarships awarded are 90 percent of contributions received, this implies that the average
scholarship would be about $1,350 for a 37 percent switching rate to result in a net positive
budget effect at the state level. If tax credits per scholarship recipient were $2,000, the
switching rate would have to be 50 percent for the program to be budget neutral at the state
level, assuming an average QBE state grant of $4,066, and 56 percent if the average QBE
grant was $3,587. If tax credits per scholarship recipient were $3,500, which is a little less
than the average scholarship in 2013, the breakeven switching rates rise to 87 percent and 98
percent, respectively, for the high and low QBE grant assumptions. Given published
estimates of the switching rate, an 87 percent breakeven switching rate raises doubts that the
program is fiscally neutral for state government.
However, the above analysis considers only the net fiscal effect on the state
government. Reducing the number of public school students may also reduce expenditures
funded by the local school system. The amount of revenue per student provided by local
school systems varies widely, as shown in Table 6 and Figure 3.
TABLE 6. LOCAL SOURCE REVENUE PER FTE (FY2013)
All Grades
Median $2,872 Minimum $648 Maximum $10,902 FTE Weighted Mean $3,477 Source: Georgia Department of Education.
Georgia’s Tax Credit Scholarship Program
19
FIGURE 3. DISTRIBUTION OF LOCAL REVENUE PER FTE (FY2013)
0%
5%
10%
15%
20%
25%
30%
Perc
ent o
f FTE
Stu
dent
s
Local Revenue per FTE ($ thousands)
All Grades
Source: Georgia Department of Education.
In the short run and for small reductions in the number of students, it is not likely that
local expenditures would decrease by the average expenditures per student if a student
switched to a private school. Consider, for example, a reduction of one student, i.e., 5
percent of a class of 20. The local school system would not be able to reduce the number of
teachers or classrooms. A reduction of one student may in fact result in an increase in
expenditures from local funds because of the reduction in the state QBE grant. Since the
school system will have to retain the teacher, the school system will have to cover a larger
share of the salary because the state contribution will be reduced by 5 percent. Of course, the
remaining 19 students may get more attention from the teacher and other local resources will
likewise be spread across fewer students. On the other hand, if a larger number, say 20 or 30
students or more from a given school, were to transfer to private schools, then the local
system may be able to reduce staffing and other variable costs and, in the long run for the
district as a whole, reduce facilities costs as well.
In recent years, the number of scholarships awarded under the existing scholarship
program has been about 13,000 each year. While not a trivial number, it is small relative to
the total number of students in public schools. Considering just Cobb, DeKalb, Fulton, and
Georgia’s Tax Credit Scholarship Program
20
Gwinnett, scholarship program students statewide are about 3 percent of the students in those
school systems.
Gottlob (2008) estimates a regression equation relating the change in total
expenditures per student to changes in the number of students between 1999-2000 and 2006-
07 for Georgia. He finds that the total expenditure per student changes, on average, by
$6,299 for a marginal change of one student. This change in expenditures equals the change
in state grant, federal grants, and local revenue. In 2006-07, state revenue per student was
$4,352. Federal aid is comprised of a number of programs, the largest of which is Title I; we
assume that Federal Aid would decrease by the per student average, which was $628 in 2006-
07. Thus, the marginal decline in local spending as a result of a reduction of one student in
2006-07 would be, on average, about $1,319. This represents 36.6 percent of the average
local revenue per student at the time. We apply this percentage to the 2012-13 local revenue
per student as reported in Table 6, and thus assume that local school systems will save, on
average, $1,272 for each student who switches from the public schools to a private school.
We refer to this figure as the local marginal cost per student. The net fiscal effects at the
local level are also dependent on the switching rate, just as at the state level, so this amount is
multiplied by the switching rate to estimate the local fiscal effect per scholarship student.
Local, and combined state and local fiscal effects for the various combinations of
parameter values are shown in the final four columns of Table 5. Switching rates necessary
for combined state and local budget neutrality are also estimated. For example, with tax
credits per scholarship student at $2,000 and state grants per student at $4,066, a switching
rate of 38 percent would result in an $11.4 million net fiscal cost at the state level, but a $12.1
million net fiscal gain at the local level. At the lower level of tax credits per scholarship,
$1,500, and the 37 percent switching rate necessary to break even at the state level, the
combined fiscal effect is a $15.8 million budget gain. At the $3,500 level of tax credits per
scholarship student and $4,066 for state QBE grants, the combined state and local budget
effect would be slightly positive at a switching rate of 66 percent. A switching rate of 66
percent is greater than the 30 percent switching rate reported by Lips and Jacoby (2001), but
we do not have the information to determine how likely or unlikely it is that the actual
switching rate is at least 66 percent.
Georgia’s Tax Credit Scholarship Program
21
VIII. Proposal for an Additional Tax Credit Scholarship Program
Recently, a draft legislative proposal has been developed that would be a new tax
credit scholarship program in Georgia, referred to as the BEST (Business and Education
Succeeding Together) program, which would be in addition to the existing program. The
proposed new program is similar in many ways to the existing QETC program, but differs
from the current program in the following ways:
● Only C-corporations would be eligible to take the tax credit. ● Limit the aggregate amount of BEST tax credits to $25 million. ● Donations from individual corporations would be limited to $2.5 million
each. ● Scholarships would be restricted to students eligible for free or reduced lunch
(FRL), namely a household income of less than 185 percent of the poverty level.
These differences will affect the fiscal impact of the BEST program relative to the
existing program. First, the tax credit cap of $25 million means that for any switching rate,
the net fiscal impact will be half as large as the amounts shown in Table 5 for any given set
of other parameter values. However, the switching rate that results in zero net fiscal impact
is the same as those reported in Table 5.
Second, the switching rate will likely be higher given the income requirement. In its
analysis of the fiscal effect of the Florida tax credit scholarship program, which is limited to
low-income students, the Florida Office of Program Analysis and Government
Accountability (OPAGA) assumed that students eligible for free and reduced lunch would be
very unlikely to enroll in private schools in the absence of a scholarship. OPAGA used a
switching rate of 90 percent in their analysis, but do not explain how they arrived at that
assumption.
The notion that low-income students do not enroll in private school is not correct.
Using Census data, we find that there are 36,025 FRL students in Georgia private schools,
which is more than 4.7 percent of Georgia children who are eligible for free and reduced
lunch. This compares to 15.6 percent for K-12 students from families with incomes above
185 percent of the poverty level who are in private school. Of course some of these low-
Georgia’s Tax Credit Scholarship Program
22
income students in private schools may have tax credit funded scholarships or other financial
aid now, in the absence of which they would not attend private school, but this number is
almost three times the total number of scholarships awarded under the current QETC
scholarship program. Note further that only 17.9 percent (44.2 percent) of families with
scholarship students are in the first (first and second) quartile of Georgia adjusted gross
income.
While we believe that the switching rate will be higher for the proposed new program
than for the existing program, we do not have a way of independently estimating what it
might be. There are several studies that find that the likelihood of private school attendance
increases with increases in income and decreases in tuition, although Buddin, Cordes, and
Kirby (1998) find no effect of marginal changes in tuition on private school enrollment. This
leads to the concern that if scholarship amounts are too low, few students will switch and the
program will not have the desired impact.
Gottlob (2008) estimates that the total number of Georgia FRL students who would
take a $2,000 scholarship is 5,567 students (and assumes that all of these students would be
switchers from public to private school), but $2,000 would cover only a small portion of
tuition to most private schools, even where need-based tuition discounts are offered.
Nationally, private school tuition averaged $10,740 in 2011-2012, though it was lower on
average for religious schools (National Center for Education Statistics, undated).
Ferreyra (2007), though she does not give a baseline for low-income households in
private schools absent the vouchers, reports 13 percent low-income household enrollment in
private schools for a $1,000 universal voucher and 53 percent for a $3,000 universal voucher.
If the voucher program is restricted to nonsectarian private schools, the low-income
enrollment rate drops to 3 percent for the $1,000 voucher, but rises to 20 percent if the
voucher is increased to $3,000. The higher response by low-income households to universal
than to nonsectarian vouchers may be an artifact of the market, Chicago, where the majority
of private school enrollments at the time were to Catholic schools, which are usually
subsidized by a parish or diocese of the church, and thus charge significantly lower tuition.
In 1993-1994, around the time covered by her data, average tuition at Catholic parochial and
diocesan schools nationally were $1,610 and $1,913, respectively, compared to $3,084 for all
private schools and $6,822 for nonsectarian schools (National Center for Education Statistics
Georgia’s Tax Credit Scholarship Program
23
1997). Achieving similar private school enrollment rates for low-income families in Georgia
may be difficult if scholarship amounts are too small relative to tuition costs.
To explore the fiscal implication of the proposed BEST program, consider first the
case in which no current FRL private school student gets a BEST scholarship, meaning that
the actual switching rate is 100 percent. In this case, the state breaks even if 6,149
scholarships are awarded, resulting in $25 million of reduced QBE funding grants ($4,066
times 6,149). At the lower QBE grant level of $3,587, the breakeven number of scholarships
would be 6,970. In the event that SSOs are unable to place the requisite number (or more) of
scholarship students, the savings in QBE funding would be less than the total credits allowed.
This could occur, for example, if the scholarships offered are too small relative to private
school tuition costs to attract enough FRL-eligible students. Alternatively, if the average
scholarship is too large, the $25 million of donations would be absorbed by fewer than the
breakeven 6,149 students and again the savings to the state would fall short of the cost in
credits.
To support 6,149 students while being budget neutral at the state level, tax credits per
scholarship cannot be more than $4,066 since a larger amount would result in a net negative
budget impact for the state. If 90 percent of donations fund scholarships, this would equate
to a maximum average scholarship amount of about $3,659 for the state to break even.
This breakeven number of scholarships, 6,149, would represent about a 17 percent
increase in the number of FRL-eligible students in private schools, and is about 0.6 percent of
the total number of Georgia’s FRL-eligible public school students. It is also only 582
students or about 10.5 percent larger than the number of FRL students that Gottlob (2008)
estimated would switch to private school in response to a $2,000 scholarship. If we include
the reduction in local education expenditures (the local marginal cost per student in public
schools), the breakeven number of scholarships, counting both state and local fiscal effects,
would be 4,683.
Second, consider the case in which not all of the scholarship recipients are switchers
from public school. As noted above, there are far more FRL-eligible students currently in
private school than can be explained by the QETC scholarship program, so it cannot be
assumed that 100 percent of BEST scholarship recipients would not attend private school in
the absence of the BEST program. In this case, to break even the BEST program would still
need to fund 6,149 true switchers (or 6,970 if the lower average QBE grant is assumed).
Georgia’s Tax Credit Scholarship Program
24
However, because some scholarship recipients would have enrolled in private school
anyway, the total number of scholarships awarded out of the $25 million of donations would
have to be larger than 6,149 and the average scholarship amount must be smaller. As in the
case of the QETC program, at $3,000 per scholarship student and an average QBE grant of
$4,066, the state level breakeven switch rate would be 74 percent (6,149 switchers out of
8,333 scholarship recipients). The required switching rate would be 57 percent if the
reduction in local education expenditures is also considered. Lower average scholarship
amounts, as before, result in lower breakeven switch rates, but lower average scholarship
amounts also may make it more difficult to attract sufficient new FRL students to reach
breakeven. Nevertheless, a 74 percent switch rate is more likely in a means-tested program
than in a program that is not means-tested, and is below what OPAGA and others have
assumed in evaluating means-tested programs in other states.
Georgia’s Tax Credit Scholarship Program
25
IX. Evaluating the Efficacy of the Tax Credit Scholarship Program
Other than attempts to measure the fiscal impact, there has not been a thorough
evaluation of the effectiveness of tax credit scholarship programs in meeting other goals,
either in Georgia or elsewhere. There are many questions that such an evaluation might want
to address, including:
● What percentage of scholarships go to students who switch from low-performing public schools?
● Do the scholarships result in improved student performance? ● What is the income, gender, race/ethnicity, grade level of scholarship
recipients? ● What is the quality of the private schools that the scholarship recipients
attend? However, with the limited data that is available, it is not feasible to conduct an
evaluation that addresses these questions for Georgia. We recognize the desire to maintain
confidentiality of scholarship recipients, but with appropriate precautions and controls,
additional data could be made available that would be useful to policymakers in
understanding the costs and benefits of the program.
The data that would be necessary, or at least very useful, to conduct an evaluation
include:
● The public schools attended by scholarship recipients prior to award of the scholarship. These data would be used to estimate the switching rate and to evaluate the quality of the public schools the students are leaving.
● To explore the improvement in student performance, it would be useful to
have scores on comparable standardized tests for the private and previously attended public schools. Private schools are not required to use the same standardized tests that public schools use, but available performance information could be used to judge the benefits in terms of quality of the private schools relative to the public schools the scholarship students had been attending.
● The characteristics of scholarship recipients is an important aspect of any
evaluation of the program. Thus, the distribution by race, gender, family income, and age (grade) of the scholarship recipients would be important data to report.
Georgia’s Tax Credit Scholarship Program
26
Regarding income, SSOs currently report the number of families receiving
scholarships, but not the total number or amount of scholarships, by quartile of Georgia
adjusted gross income. This reporting provides little detail regarding the income distribution
of scholarship recipients and no information on the distribution of scholarship dollars.
Reporting by decile, and including the numbers of scholarship students and the total amounts
awarded for each decile, would provide a better understanding of the distribution and would
not require any additional effort. In addition, a broader income measure than Georgia AGI
would be preferable as it is a much narrower income definition than is used in delineating the
poverty level or in determining eligibility for FRL and other income-based programs.
However, the household income measure used to determine eligibility for FRL has many
components and it would be difficult to collect that much information for children who are
not likely to apply for FRL. A simple alternative is to report by total income from the federal
income tax return; that is, income on line 22 of the 2013 Form 1040. It would be reasonable
to assume that total income from Form 1040 is approximately equal to the income used to
measure poverty.
The federal poverty threshold, and thus the eligibility threshold for free or reduced
price lunch, varies by the number of adults and children in the household, but using total
income does not allow a differentiation by size of the family. Information on the numbers of
parents and of children under 18 years of age in the household would allow reporting by
income groups defined as a percent of the poverty threshold, perhaps corresponding to FRL
eligibility levels and then higher multiples of poverty level income.
Georgia’s Tax Credit Scholarship Program
27
X. Summary and Conclusions
In 2008, Georgia adopted legislation that allows tax credits for donations that are
used to fund scholarships for students enrolled in private schools. Georgia is one of 14 states
that offer a tax credit funded scholarship program. In this report we first present an overview
of this program, including its history, legislation, and data on participation, and a summary of
the arguments for and against the program. However, the main focus of the report is an
analysis of the fiscal effects of the current program and of a proposed second tax credit
scholarship program.
The fiscal impact of the tax credit scholarship program depends on the amount of tax
credits taken and the reduction in spending on public education. The value of tax credits
taken is the gross reduction in state revenue. However, if scholarship students switch from a
public to a private school, the state and the local school system can each reduce their
spending by the amount of the variable cost of educating that student. Thus, the net fiscal
effect of the tax credit scholarship on the state’s budget equals the value of the tax credits that
are taken less any reduction in state education grants due to the scholarship program. Local
savings may partially offset or even exceed any net cost at the state level.
There are four variables that determine the fiscal impact: the tax credits per
scholarship recipient, the number of recipients, the reduction in spending on education if a
student switches from public school to private school as a result of the scholarship, and the
share of scholarship recipients who switch, which we refer to as the switching rate. While
the reduction in spending on education depends on several factors, we are able to identify the
mean reduction within a small range.
The variable about which we have very little information is the share of scholarship
recipients who, in the absence of the scholarship, would attend public schools. That
information is not available, nor do we have the data necessary to estimate it. There are
several reasons why the switching rate would not be 100 percent even with a prior public
school enrollment requirement. For example, parents might simply enroll their child in a
public school for the sole purpose of making him or her eligible for a scholarship, and thus in
the absence of the scholarship would not have attended public school. In addition, the public
school enrollment restriction on scholarship eligibility does not apply to private school
students who start private school by the first grade.
Georgia’s Tax Credit Scholarship Program
28
Since we don’t know the percentage of scholarship recipients who would have
switched from public schools, we determine the switching rate required for the state
government to break even. For example, if tax credits per scholarship recipient were $3,500,
which is a little less than the average scholarship in 2013, breakeven requires that 87 percent
of the scholarship recipients would not have been in private school in the absence of the
scholarship, assuming each switcher saved the state the average per student QBE grant. If
savings in local education spending in included, the required rate of switching is 66 percent.
Recently, a new tax credit scholarship program has been proposed. The proposed
new program, BEST, is similar in many ways to the existing QETC program, but differs from
the current program in that only C-corporations would be eligible to take the tax credit, total
tax credits would be capped at $25 million, and scholarships would be restricted to students
eligible for free or reduced price lunch (FRL). If the actual switching rate was 100 percent,
then at least 6,149 scholarships would have to be awarded to FRL-eligible students eligible in
order to the total reduction in QBE funding to be at least equal to the total of $25 million in
tax credits. This breakeven number of scholarships, 6,149, would represent about a 17
percent increase in the number of FRL-eligible students in private schools and is about 0.6
percent of the total number of Georgia’s FRL-eligible public school students. We are unable
to predict whether at least 6,149 scholarships would be taken, but note that this number is
comparable to the 5,567 Georgia FRL students that Gottlob (2008) estimated would switch to
private school in response to a $2,000 scholarship.
We cannot assume that 100 percent of BEST scholarship recipients would not attend
private school in the absence of the program. But regardless of the switching rate, to break
even the BEST program would still need to fund 6,149 true switchers. However, because
some scholarship recipients would have enrolled in private school anyway, the total number
of scholarships awarded out of the $25 million of donations must be larger than 6,149 and the
average scholarship amount must be smaller than would be possible if the switch rate was
100 percent. Lower average scholarship amounts result in lower breakeven switch rates, but
also may make it more difficult to attract sufficient new FRL students to reach breakeven.
Nevertheless, achieving the breakeven switch rate is more likely in a means-tested program
than in a similar program that is not means-tested.
Georgia’s Tax Credit Scholarship Program
29
References
Buddin, Richard J., Joseph J. Cordes, and Sheila Nataraj Kirby (1998). "School Choice in California: Who Chooses Private Schools?" Journal of Urban Economics 44(1): 110-34.
Ferreyra, Maria Marta (2007). "Estimating the Effects of Private School Vouchers in Multidistrict Economies." American Economic Review 97(3): 789-817.
Foundation for Opportunity in Education (2013). Education Tax Credit Programs: An Analysis of Provisions by State. Latham NY: Foundation for Opportunity in Education.
Gottlob, Brian (2008). “The Fiscal Impacts of Tax-Credit Scholarships in Georgia.” School Choice Issues in the State, The Friedman Foundation for Educational Choice. Available at: files.eric.ed.gov/fulltext/ ED508488.pdf.
Lips, Carrie and Jennifer Jacoby (2001). “The Arizona Scholarship Tax Credit: Giving Parents Choices, Saving Taxpayers Money.” Policy Analysis #414. Washington DC: Cato Institute.
National Center for Education Statistics (Undated). “Advance Release of Selected 2013 Digest Tables.” Digest of Education Statistics, U.S. Department of Education. Available at: nces.ed.gov/programs/digest/2013menu_tables.asp.
National Center for Education Statistics (1997). “Private Schools in the United States: A Statistical Profile, 1993-94.” Survey Report NCES 97-459, U.S. Department of Education. Available at: nces.ed.gov/pubsearch/pubsinfo.asp?pubid=97459.
Southern Education Foundation (Undated). “A Failed Experiment: Georgia’s Tax Credit Scholarship for Private Schools.” Atlanta, GA: Southern Education Foundation.
Georgia’s Tax Credit Scholarship Program
30
About the Authors Robert Buschman is a Senior Research Associate with the Fiscal Research Center.
His research interests include corporate and personal taxation, public expenditures,
macroeconomic policy, history of economic thought and economic history. Prior to joining
the Andrew Young School, Bob worked for several years in corporate banking and corporate
financial management. Bob holds a BA in Economics from Duke University, an MBA in
Finance from the Goizueta Business School at Emory University, and a MA and PhD in
Economics from the Andrew Young School of Policy Studies at Georgia State University
David L. Sjoquist is Professor of Economics, holder of the Dan E. Sweat
Distinguished Scholar Chair in Educational and Community Policy at the Andrew Young
School of Policy Studies at Georgia State University. He has published widely on topics
related to state and local public finance and urban economics. He holds a Ph.D from the
University of Minnesota.
About The Fiscal Research Center
The Fiscal Research Center (FRC) provides nonpartisan research, technical
assistance, and education in the evaluation and design of state and local fiscal and economic
policy. FRC Reports, Policy Briefs, and other publications maintain a position of neutrality
on public policy issues in order to safeguard the academic freedom of the authors. Thus,
interpretations or conclusion in FRC publications should be understood to be solely those of
the author(s).
For more information on the Fiscal Research Center, call 404.413.0249 or visit our
website at http://frc.gsu.edu.
Georgia’s Tax Credit Scholarship Program
31
FISCAL RESEARCH CENTER STAFF Sally Wallace, Director (FRC), Chair and Professor
of Economics Carolyn Bourdeaux, Associate Director (FRC) and
Associate Professor (PMAP) Peter Bluestone, Senior Research Associate Robert Buschman, Senior Research Associate Margo Doers, Senior Administrative Coordinator Huiping Du, Research Associate Jaiwan M. Harris, Business Manager
Kenneth J. Heaghney, Research Professor of
Economics Kim Hoyt, Program Coordinator Lakshmi Pandey, Senior Research Associate Dorie Taylor, Assistant Director Arthur D. Turner, Microcomputer Software
Technical Specialist Nick Warner, Research Associate Laura A. Wheeler, Senior Research Associate
ASSOCIATED GSU FACULTY
Roy W. Bahl, Regents Professor of Economics H. Spencer Banzhaf, Associate Professor of
Economics Pam Scholder Ellen, Associate Professor of
Marketing Paul Ferraro, Professor of Economics Martin F. Grace, Professor of Risk Management
and Insurance Shiferaw Gurmu, Professor of Economics W. Bartley Hildreth, Professor of PMAP Charles Jaret, Professor of Sociology Nancy Knopf, Associate Dean for Research and
Strategic Planning and Professor of PMAP Gregory B. Lewis, Chair and Professor of PMAP Cathy Yang Liu, Assistant Professor of PMAP Jorge L. Martinez-Vazquez, Director (ICPP) and
Regents Professor of Economics
John W. Matthews, Part-Time Instructor, PMAP Harvey Newman, Professor of PMAP Theodore H. Poister, Professor of PMAP Mark Rider, Associate Professor of Economics Glenwood Ross, Clinical Associate Professor of
Economics Bruce A. Seaman, Associate Professor of Economics Cynthia S. Searcy, Assistant Dean for Academic
Programs and Professor of PMAP David L. Sjoquist, Director (DPO) and Professor of
Economics Rusty Tchernis, Associate Professor of Economics Erdal Tekin, Associate Professor of Economics Neven Valev, Associate Professor of Economics Mary Beth Walker, Dean (AYSPS) and Professor of
Economics Katherine G. Willoughby, Professor of PMAP
FORMER FRC STAFF/GSU FACULTY
James Alm, Tulane University Richard M. Bird, University of Toronto Tamoya A. L. Christie, University of West Indies Kelly D. Edmiston, Federal Reserve Bank of
Kansas City Robert Eger, Florida State University Nevbahar Ertas, University of Alabama/Birmingham Alan Essig, Georgia Budget and Policy Institute Dagney G. Faulk, Ball State University Catherine Freeman, HCM Strategists Richard R. Hawkins, University of West Florida Zackary Hawley, Texas Christian University Gary Henry, University of North Carolina,
Chapel Hall Julie Hotchkiss, Federal Reserve Bank of Atlanta
Mary Matthewes Kassis, University of West Georgia Stacie Kershner, Center for Disease Control Nara Monkam, University of Pretoria Ross H. Rubenstein, Syracuse University Michael J. Rushton, Indiana University Rob Salvino, Coastal Carolina University Benjamin P. Scafidi, Georgia College & State
University Edward Sennoga, Makerere University, Uganda William J. Smith, University of West Georgia Jeanie J. Thomas, Consultant Kathleen Thomas, Mississippi State University Geoffrey K. Turnbull, University of Central Florida Thomas L. Weyandt, Atlanta Regional Commission Matthew Wooten, University of Georgia
AFFILIATED EXPERTS AND SCHOLARS
Kyle Borders, Federal Reserve Bank of Dallas David Boldt, State University of West Georgia Gary Cornia, Brigham Young University
William Duncombe, Syracuse University Ray D. Nelson, Brigham Young University
KEY: PMAP: Public Management and Policy. FRC: Fiscal Research Center. ICPP: International Center for Public Policy. DPO: Domestic Programs. AYSPS: Andrew Young School of Policy Studies.
Georgia’s Tax Credit Scholarship Program
32
RECENT PUBLICATIONS (All publications listed are available at http://frc.gsu.edu or call the Fiscal Research Center at 404/413-0249, or fax us at 404/413-0248.) Georgia’s Tax Credit Scholarship Program (Robert Buschman and David L. Sjoquist). This report presents an overview of Georgia’s Qualified Education Tax Credit program since its inception in 2008 and provides an analysis of the program’s fiscal effects. The report also describes how a proposed new tax credit scholarship program may, under certain conditions, have positive fiscal effects as a result of targeting students from lower-income families. FRC Report 268 (November 2014) Geographic Dispersion of SNAP Enrollment in Georgia (Peter Bluestone). This brief, with the aid of maps, illustrates the variations in SNAP enrollment as a share of county population as well as the changes that have occurred in those shares from 2000 to 2012. FRC Brief 267 (February 2014) Trends in Georgia School Staffing 2001-2012 (Nicholas Warner). This brief examines the changes in teacher and administrator education, experience, and compensation over the last 10 years with a focus on the possible effect of the Great Recession. FRC Brief 266 (January 2014) School District Education Expenditures in Response to the Great Recession (Nicholas Warner and Carolyn Bourdeaux). This report examines the structure of school district expenditures between 2001 and 2012 with a particular focus on changes in instructional expenditures during the recession. FRC Report 265 (January 2014) Georgia's Taxes: A Summary of Major State and Local Government Taxes, 20th Edition (Carolyn Bourdeaux, Robert Buschman, and Richard Hawkins). A handbook on taxation that provides a quick overview of all state and local taxes in Georgia. FRC Annual Publication A(20) (January 2014) Geographic Dispersion of Federal Funds in Georgia and Its Major Urban Regions (Peter Bluestone). This brief examines the geographic distribution of federal spending in Georgia. FRC Brief 264 (October 2013) Population, Employment, and Income Trends for Georgia and Atlanta (David L. Sjoquist). This report explores the growth in population, employment, and income over the previous 50 years in Georgia and Atlanta. FRC Report 263 (September 2013) Georgia’s High-Technology Industry and Innovation Capacity (Cathy Yang Liu). This report describes the demographic composition of the high-technology industry workforce and the innovation capacity of Georgia in comparison to peer Southeastern states between 2000 and 2011. FRC Report 262 (September 2013)
Georgia’s Tax Credit Scholarship Program
33
The Department of Defense Budget Cuts: Economic Impact on Georgia and Selected Counties (Peter Bluestone). This brief examines the economic impact Department of Defense procurement contracts, grants, and civilian wages have on the state of Georgia as well as selected counties. FRC Brief 261 (February 2013) Zero-Base Budgeting for the 21st Century Public Administrator (Ron Shelby). This report discusses the history of Zero-Base Budgeting (ZBB) reform, how to implement classic 1970s style ZBB reform and strengths and weaknesses of the reform. FRC Report 260 (March 2013) The Structure and History of Georgia’s Job Tax Credit Program (David L. Sjoquist and Laura Wheeler). This report describes the provisions of Georgia’s job tax credit program and how the program has evolved since its inception in 1990. FRC Report 259 (February 2013) The Incentives Created by the Tax-Benefit System Facing Low-Income Families in Georgia (Chelsea Coleman, Kendon Darlington, Mark Rider, and Morgan Sinclair). This report describes the incentives created by the major taxes and public assistance programs facing low income-families in Georgia. FRC Report/Brief 258 (February 2013) Georgia Taxpayers and Federal “Pease” Limitations on Itemized Deductions (Robert Buschman). This brief analyzes the effects of federal limits on itemized deductions and the state income tax liabilities of Georgia taxpayers. FRC Brief 257 (January 2013) Lessons for Georgia: Telecommunications Tax Reform in Some of the Other Southeastern States (Richard Hawkins). This report reviews telecommunications tax reform in other states, discusses four major policy issues and looks at the health of the industry in the other states after reform. FRC Report 256 (January 2013) Property Tax and Education: Have We Reached the Limit? (David L. Sjoquist and Sohani Fatehin). This report explores changes over the past decade in property taxes used to fund K-12 education and discusses the future of the property tax for education. FRC Report 255 (January 2013) Georgia’s Revenue and Expenditure Portfolio in Brief, 1989-2010 (Carolyn Bourdeaux, Nicholas Warner, Sandy Zook, and Sungman Jun). This brief uses Census data to examine how Georgia ranks in terms of spending and revenue by functions and objects and examines how Georgia's portfolio has changed over time compared to national peers. FRC Brief 254 (January 2012) (All publications listed are available at http://frc.gsu.edu or call the Fiscal Research Center at 404.413.0249.)