LOS ANGELES DMA The Designated Market Area (DMA) of Los Angeles, California with a population of 17,916,027 stretches from Ventura County all the way down the Pacific Coast through Orange County and as far east as the Arizona and Nevada borders. It comprises an area of 27,500 square miles, making it the largest DMA in the US. The city of Los Angeles is one of the most populous metropolitan areas in the world and the second largest in the United States. It is also the largest manufacturing center in the western United States. The contiguous ports of Los Angeles and Long Beach comprise the fifth-busiest port in the world and the most significant port in the Western Hemisphere, vital to trade within the Pacific Rim. Los Angeles County, the capital of Asian America, has the largest number of Asian immigrants of any county in the nation. It is home to people from more than 140 countries speaking 224 different identified languages. Within the Asian population, 24.5% are Filipino, 22.9% Chinese and Taiwanese, 14.9% Korean, 13.1% Vietnamese, 10.5% Japanese, and 13.9% other Asian. Approximately 67% of Asians are fluent in English and more than 55% are considered bi-lingual. Ethnic enclaves such as Chinatown, Filipinotown, Koreatown, Little Tokyo, and Thai Town provide examples of the polyglot character of Los Angeles. Population 2014 Ranking 2014 Population Total 2 17,916,027 Hispanic 1 8,298,461 White non-Hispanic 2 5,665,587 Black non-Hispanic 6 1,149,187 Asian non-Hispanic 1 2,323,390 1990 2000 2010 2014 2019 Hispanic 4,635,170 6,466,855 7,835,183 8,298,461 8,935,580 White-Non Hispanic 7,197,529 6,275,758 5,886,787 5,665,587 5,474,496 Black Non-Hispanic 1,168,997 1,181,524 1,170,372 1,149,187 1,131,666 Asian Non-Hispanic 1,294,204 1,672,959 2,154,085 2,323,390 2,572,027 0 1,000,000 2,000,000 3,000,000 4,000,000 5,000,000 6,000,000 7,000,000 8,000,000 9,000,000 10,000,000 Population 28% -10% -3% 39% Hispanic White-Non Hispanic Black Non- Hispanic Asian Non- Hispanic
Transcript
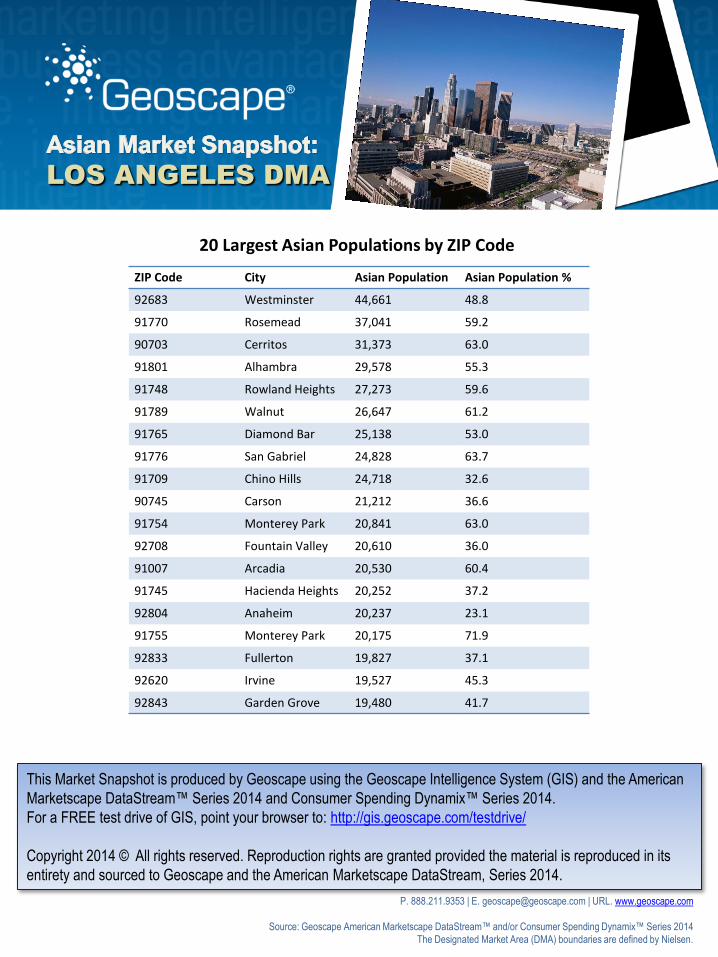
LOS ANGELES DMA
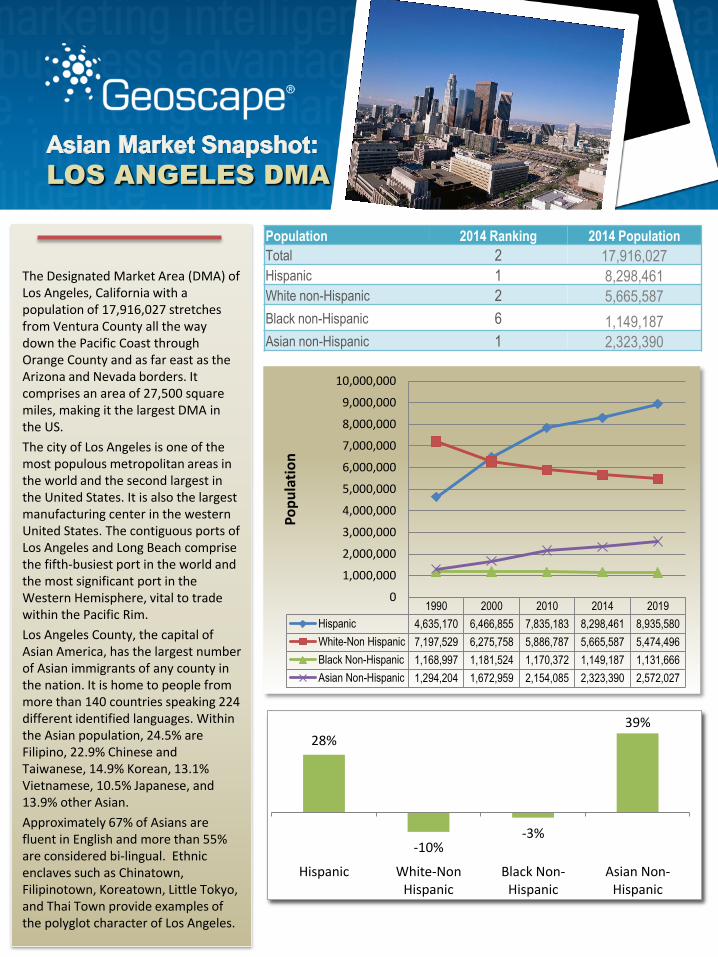
The Designated Market Area (DMA) of Los Angeles, California with a population of 17,916,027 stretches from Ventura County all the way down the Pacific Coast through Orange County and as far east as the Arizona and Nevada borders. It comprises an area of 27,500 square miles, making it the largest DMA in the US.
The city of Los Angeles is one of the most populous metropolitan areas in the world and the second largest in the United States. It is also the largest manufacturing center in the western United States. The contiguous ports of Los Angeles and Long Beach comprise the fifth-busiest port in the world and the most significant port in the Western Hemisphere, vital to trade within the Pacific Rim.
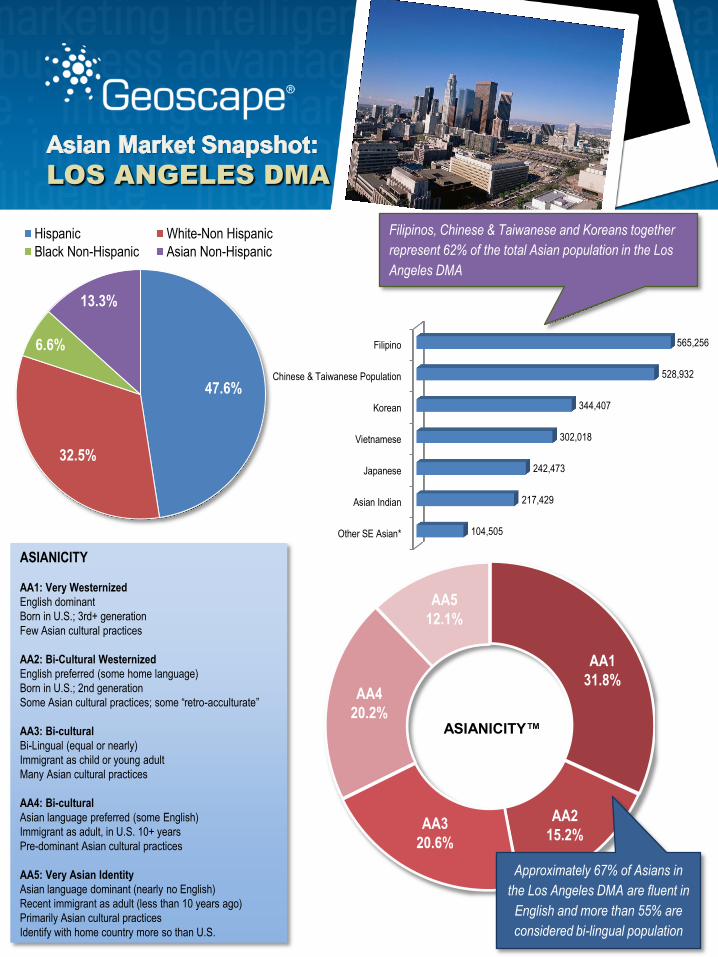
Los Angeles County, the capital of Asian America, has the largest number of Asian immigrants of any county in the nation. It is home to people from more than 140 countries speaking 224 different identified languages. Within the Asian population, 24.5% are Filipino, 22.9% Chinese and Taiwanese, 14.9% Korean, 13.1% Vietnamese, 10.5% Japanese, and 13.9% other Asian.
Approximately 67% of Asians are fluent in English and more than 55% are considered bi-lingual. Ethnic enclaves such as Chinatown, Filipinotown, Koreatown, Little Tokyo, and Thai Town provide examples of the polyglot character of Los Angeles.
Source: Geoscape American Marketscape DataStream™ and/or Consumer Spending Dynamix™ Series 2014
The Designated Market Area (DMA) boundaries are defined by Nielsen.
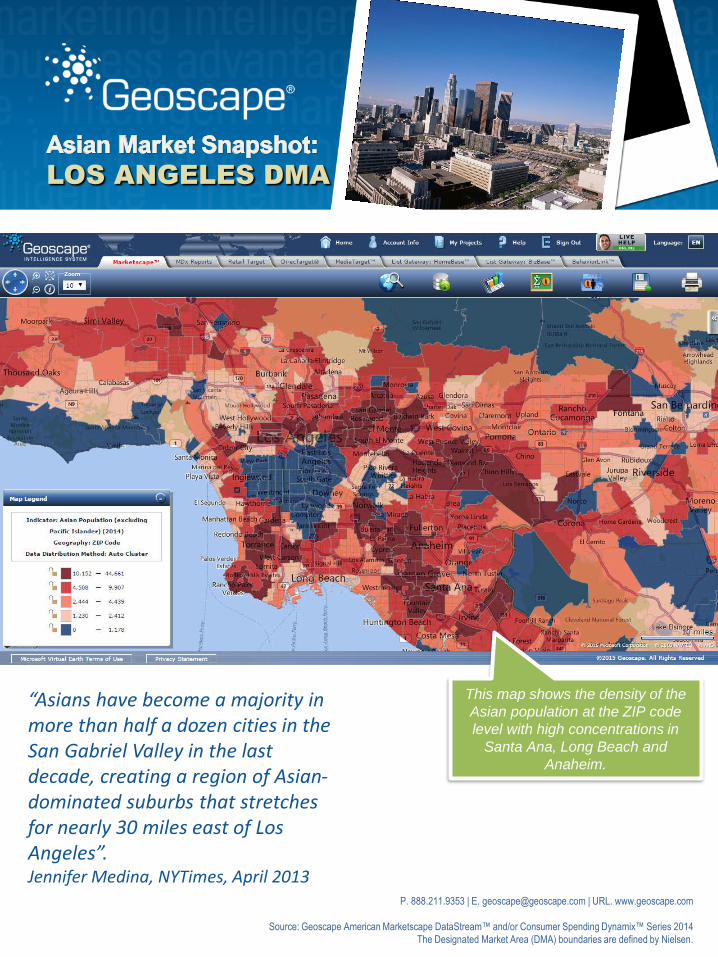
This map shows the density of the
Asian population at the ZIP code
level with high concentrations in
Santa Ana, Long Beach and
Anaheim.
“Asians have become a majority in more than half a dozen cities in the San Gabriel Valley in the last decade, creating a region of Asian-dominated suburbs that stretches for nearly 30 miles east of Los Angeles”. Jennifer Medina, NYTimes, April 2013