GeoConvention 2012: Vision 1 Geostatistical Inversion in Carbonate and Clastic Reservoirs: Oilfield Case Studies from Kuwait Osman Al-Khaled, Yousef Al-Zuabi, Keith Edwards, Mohammad Hafez (Kuwait Oil Co.) Denny Sulistiono (Fugro-Jason) Summary This paper demonstrates the use of deterministic vs. geostatistical inversion, and illustrates the benefits of using geostatistical seismic inversion for reservoir characterization of two oil reservoirs in Kuwait: 1) the Ratawi Limestone carbonate reservoir and 2) the Wara sandstone clastic reservoir. In deterministic inversion, the inverted results are derived from integration of well data, interpolated for low frequency elastic impedance and the seismic data for the band-limited parts. This allows for capturing of reservoir bodies within one eighth of the wavelength. When the reservoir layers are thinner, the uncertainty of predicting the reservoir becomes higher due to the limitation of seismic bandwidth. Geostatistical inversion methods integrate the well log data, geological constraints, geostatistical parameters and seismic data (using Bayesian inference followed by Markov Chain Monte Carlo “MCMC” sampling) to produce a highly detailed reservoir description. The examples in this paper are from the Umm Gudair and Burgan Fields in southern Kuwait. Introduction The Umm Gudair Field is composed of two elongate north-south-trending anticlines, called East and West Umm Gudair (figure 1). The main Cretaceous reservoir in Umm Gudair Field is the Minagish Oolite. Porosity development may also be found in the Ratawi Limestone, which is composed of argillaceous mudstone to clean packstone deposited in an inner ramp carbonate environment. The middle section in the Ratawi is composed mainly of packstone grading to wackestone which may be bioturbated. A few wells were identified and found to have good porosity development in parts of the East Umm Gudair area. Modeling porosity distribution within the Ratawi Limestone is difficult due to its heterogeneity and relatively thin porous interval (Carman, 1996). The Burgan Field is one of the largest oil fields in the world. It is an ovate dome covering 500 km 2 with slight elongation striking north-south. The main oil producer in Burgan Field is the Burgan Formation, a thick layer, composed of well-sorted, rounded, medium to coarse grained sandstones and siltstones (Carman, 1996). A secondary reservoir in the Burgan Field is the Wara Formation, composed of quartzose sand, but finer-grained, less well-sorted, with greater amounts of interbedded siltstones and shales. The lower part of the Wara consists of gray, glauconitic and lignitic shale that encloses a single, prominent, lenticular body of fine-grained glauconitic sand. The upper part of the Wara consists of interbedded fine-grained sandstones, siltstones and gray shales, with glauconite, amber, and lignite (Brennan, 1990). Hundreds of wells have been drilled in Burgan Field, targeting the Burgan and Wara formations typically encountering thick intervals of sand with small amounts of shale in the Burgan Formation and thinner sands interbedded with shales in the Wara Formation. Identification of the target reservoirs in the Wara and Burgan formations in Burgan Field is difficult using full stack seismic data due to the low contrast in P-impedance at the sand-shale interface (Al-Zuabi et al., 2011).
Transcript
GeoConvention 2012: Vision 1
Geostatistical Inversion in Carbonate and Clastic Reservoirs: Oilfield Case Studies from Kuwait
Osman Al-Khaled, Yousef Al-Zuabi, Keith Edwards, Mohammad Hafez (Kuwait Oil Co.)
Denny Sulistiono (Fugro-Jason)
Summary
This paper demonstrates the use of deterministic vs. geostatistical inversion, and illustrates the benefits of using geostatistical seismic inversion for reservoir characterization of two oil reservoirs in Kuwait: 1) the Ratawi Limestone carbonate reservoir and 2) the Wara sandstone clastic reservoir. In deterministic inversion, the inverted results are derived from integration of well data, interpolated for low frequency elastic impedance and the seismic data for the band-limited parts. This allows for capturing of reservoir bodies within one eighth of the wavelength. When the reservoir layers are thinner, the uncertainty of predicting the reservoir becomes higher due to the limitation of seismic bandwidth. Geostatistical inversion methods integrate the well log data, geological constraints, geostatistical parameters and seismic data (using Bayesian inference followed by Markov Chain Monte Carlo “MCMC” sampling) to produce a highly detailed reservoir description. The examples in this paper are from the Umm Gudair and Burgan Fields in southern Kuwait.
Introduction
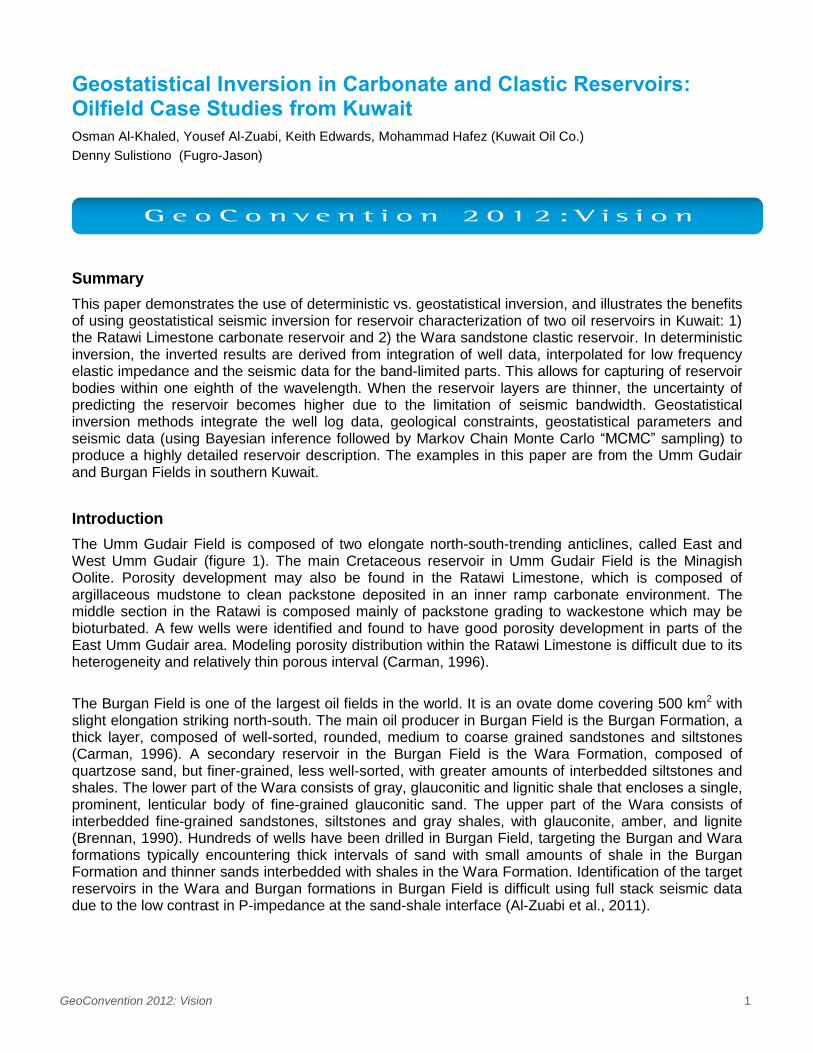
The Umm Gudair Field is composed of two elongate north-south-trending anticlines, called East and West Umm Gudair (figure 1). The main Cretaceous reservoir in Umm Gudair Field is the Minagish Oolite. Porosity development may also be found in the Ratawi Limestone, which is composed of argillaceous mudstone to clean packstone deposited in an inner ramp carbonate environment. The middle section in the Ratawi is composed mainly of packstone grading to wackestone which may be bioturbated. A few wells were identified and found to have good porosity development in parts of the East Umm Gudair area. Modeling porosity distribution within the Ratawi Limestone is difficult due to its heterogeneity and relatively thin porous interval (Carman, 1996).
The Burgan Field is one of the largest oil fields in the world. It is an ovate dome covering 500 km2 with slight elongation striking north-south. The main oil producer in Burgan Field is the Burgan Formation, a thick layer, composed of well-sorted, rounded, medium to coarse grained sandstones and siltstones (Carman, 1996). A secondary reservoir in the Burgan Field is the Wara Formation, composed of quartzose sand, but finer-grained, less well-sorted, with greater amounts of interbedded siltstones and shales. The lower part of the Wara consists of gray, glauconitic and lignitic shale that encloses a single, prominent, lenticular body of fine-grained glauconitic sand. The upper part of the Wara consists of interbedded fine-grained sandstones, siltstones and gray shales, with glauconite, amber, and lignite (Brennan, 1990). Hundreds of wells have been drilled in Burgan Field, targeting the Burgan and Wara formations typically encountering thick intervals of sand with small amounts of shale in the Burgan Formation and thinner sands interbedded with shales in the Wara Formation. Identification of the target reservoirs in the Wara and Burgan formations in Burgan Field is difficult using full stack seismic data due to the low contrast in P-impedance at the sand-shale interface (Al-Zuabi et al., 2011).
GeoConvention 2012: Vision 2
Figure 1: The studied areas are Umm Gudair (black rectangle) and Burgan fields (red rectangle) shown in the generalized Cretaceous stratigraphic chart (right figure) where the intervals of interest are Wara and Ratawi Limestone formations.
Data analysis and methodology
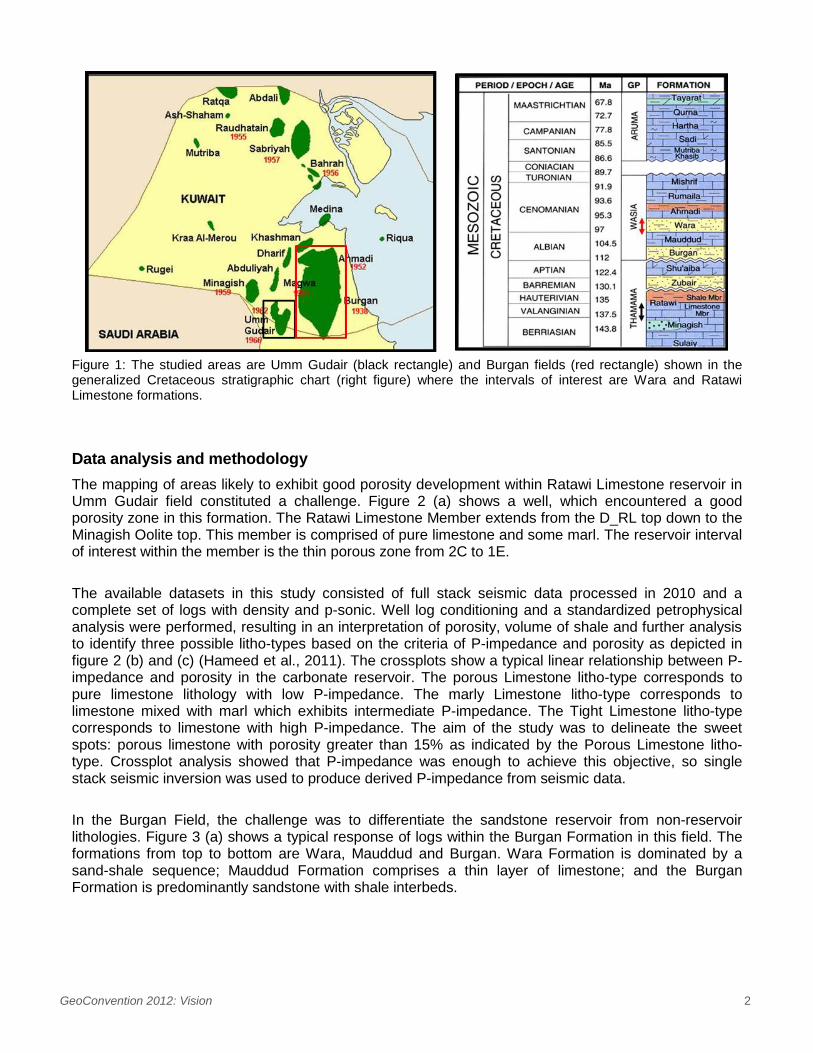
The mapping of areas likely to exhibit good porosity development within Ratawi Limestone reservoir in Umm Gudair field constituted a challenge. Figure 2 (a) shows a well, which encountered a good porosity zone in this formation. The Ratawi Limestone Member extends from the D_RL top down to the Minagish Oolite top. This member is comprised of pure limestone and some marl. The reservoir interval of interest within the member is the thin porous zone from 2C to 1E.
The available datasets in this study consisted of full stack seismic data processed in 2010 and a complete set of logs with density and p-sonic. Well log conditioning and a standardized petrophysical analysis were performed, resulting in an interpretation of porosity, volume of shale and further analysis to identify three possible litho-types based on the criteria of P-impedance and porosity as depicted in figure 2 (b) and (c) (Hameed et al., 2011). The crossplots show a typical linear relationship between P-impedance and porosity in the carbonate reservoir. The porous Limestone litho-type corresponds to pure limestone lithology with low P-impedance. The marly Limestone litho-type corresponds to limestone mixed with marl which exhibits intermediate P-impedance. The Tight Limestone litho-type corresponds to limestone with high P-impedance. The aim of the study was to delineate the sweet spots: porous limestone with porosity greater than 15% as indicated by the Porous Limestone litho-type. Crossplot analysis showed that P-impedance was enough to achieve this objective, so single stack seismic inversion was used to produce derived P-impedance from seismic data.
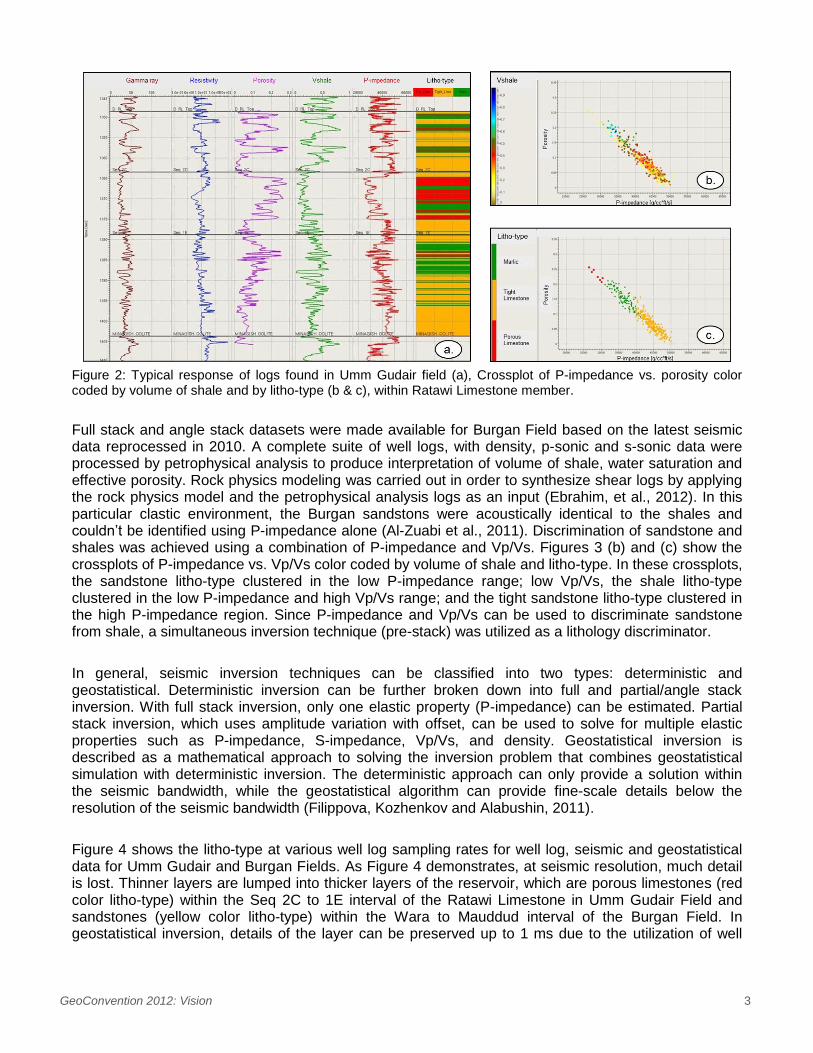
In the Burgan Field, the challenge was to differentiate the sandstone reservoir from non-reservoir lithologies. Figure 3 (a) shows a typical response of logs within the Burgan Formation in this field. The formations from top to bottom are Wara, Mauddud and Burgan. Wara Formation is dominated by a sand-shale sequence; Mauddud Formation comprises a thin layer of limestone; and the Burgan Formation is predominantly sandstone with shale interbeds.
GeoConvention 2012: Vision 3
Figure 2: Typical response of logs found in Umm Gudair field (a), Crossplot of P-impedance vs. porosity color coded by volume of shale and by litho-type (b & c), within Ratawi Limestone member.
Full stack and angle stack datasets were made available for Burgan Field based on the latest seismic data reprocessed in 2010. A complete suite of well logs, with density, p-sonic and s-sonic data were processed by petrophysical analysis to produce interpretation of volume of shale, water saturation and effective porosity. Rock physics modeling was carried out in order to synthesize shear logs by applying the rock physics model and the petrophysical analysis logs as an input (Ebrahim, et al., 2012). In this particular clastic environment, the Burgan sandstons were acoustically identical to the shales and couldn’t be identified using P-impedance alone (Al-Zuabi et al., 2011). Discrimination of sandstone and shales was achieved using a combination of P-impedance and Vp/Vs. Figures 3 (b) and (c) show the crossplots of P-impedance vs. Vp/Vs color coded by volume of shale and litho-type. In these crossplots, the sandstone litho-type clustered in the low P-impedance range; low Vp/Vs, the shale litho-type clustered in the low P-impedance and high Vp/Vs range; and the tight sandstone litho-type clustered in the high P-impedance region. Since P-impedance and Vp/Vs can be used to discriminate sandstone from shale, a simultaneous inversion technique (pre-stack) was utilized as a lithology discriminator.
In general, seismic inversion techniques can be classified into two types: deterministic and geostatistical. Deterministic inversion can be further broken down into full and partial/angle stack inversion. With full stack inversion, only one elastic property (P-impedance) can be estimated. Partial stack inversion, which uses amplitude variation with offset, can be used to solve for multiple elastic properties such as P-impedance, S-impedance, Vp/Vs, and density. Geostatistical inversion is described as a mathematical approach to solving the inversion problem that combines geostatistical simulation with deterministic inversion. The deterministic approach can only provide a solution within the seismic bandwidth, while the geostatistical algorithm can provide fine-scale details below the resolution of the seismic bandwidth (Filippova, Kozhenkov and Alabushin, 2011).
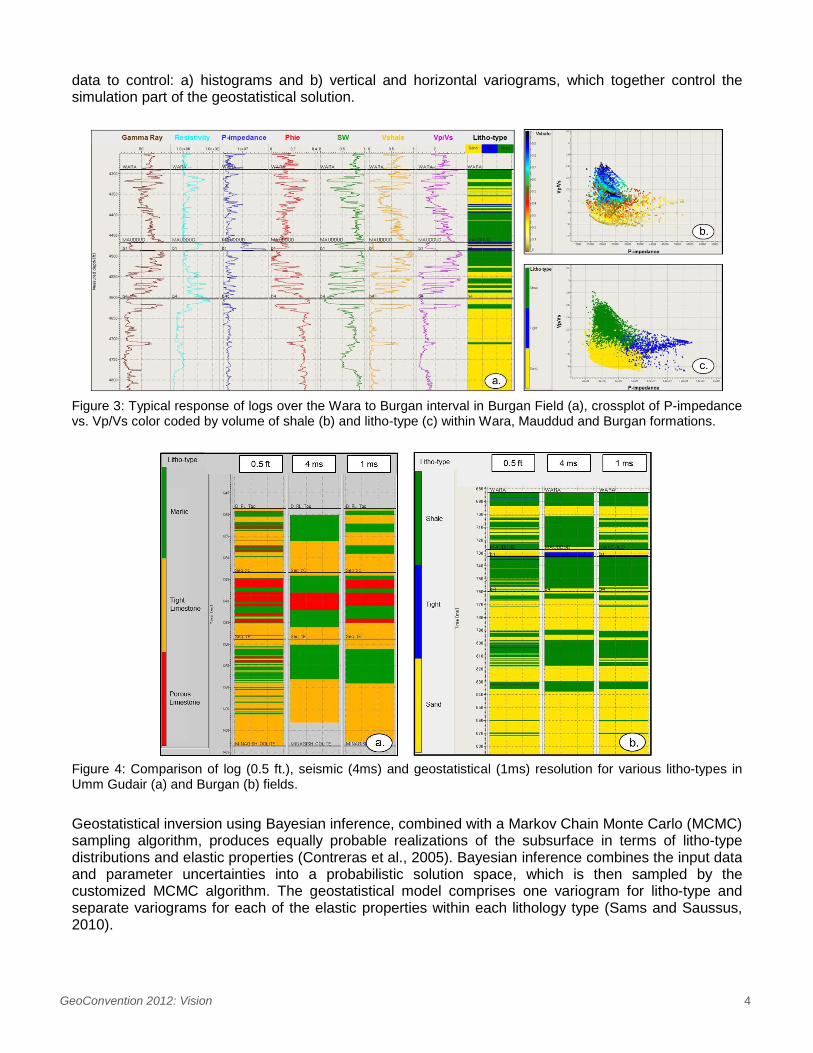
Figure 4 shows the litho-type at various well log sampling rates for well log, seismic and geostatistical data for Umm Gudair and Burgan Fields. As Figure 4 demonstrates, at seismic resolution, much detail is lost. Thinner layers are lumped into thicker layers of the reservoir, which are porous limestones (red color litho-type) within the Seq 2C to 1E interval of the Ratawi Limestone in Umm Gudair Field and sandstones (yellow color litho-type) within the Wara to Mauddud interval of the Burgan Field. In geostatistical inversion, details of the layer can be preserved up to 1 ms due to the utilization of well
GeoConvention 2012: Vision 4
data to control: a) histograms and b) vertical and horizontal variograms, which together control the simulation part of the geostatistical solution.
Figure 3: Typical response of logs over the Wara to Burgan interval in Burgan Field (a), crossplot of P-impedance vs. Vp/Vs color coded by volume of shale (b) and litho-type (c) within Wara, Mauddud and Burgan formations.
Figure 4: Comparison of log (0.5 ft.), seismic (4ms) and geostatistical (1ms) resolution for various litho-types in Umm Gudair (a) and Burgan (b) fields.
Geostatistical inversion using Bayesian inference, combined with a Markov Chain Monte Carlo (MCMC) sampling algorithm, produces equally probable realizations of the subsurface in terms of litho-type distributions and elastic properties (Contreras et al., 2005). Bayesian inference combines the input data and parameter uncertainties into a probabilistic solution space, which is then sampled by the customized MCMC algorithm. The geostatistical model comprises one variogram for litho-type and separate variograms for each of the elastic properties within each lithology type (Sams and Saussus, 2010).
GeoConvention 2012: Vision 5
Results and discussion
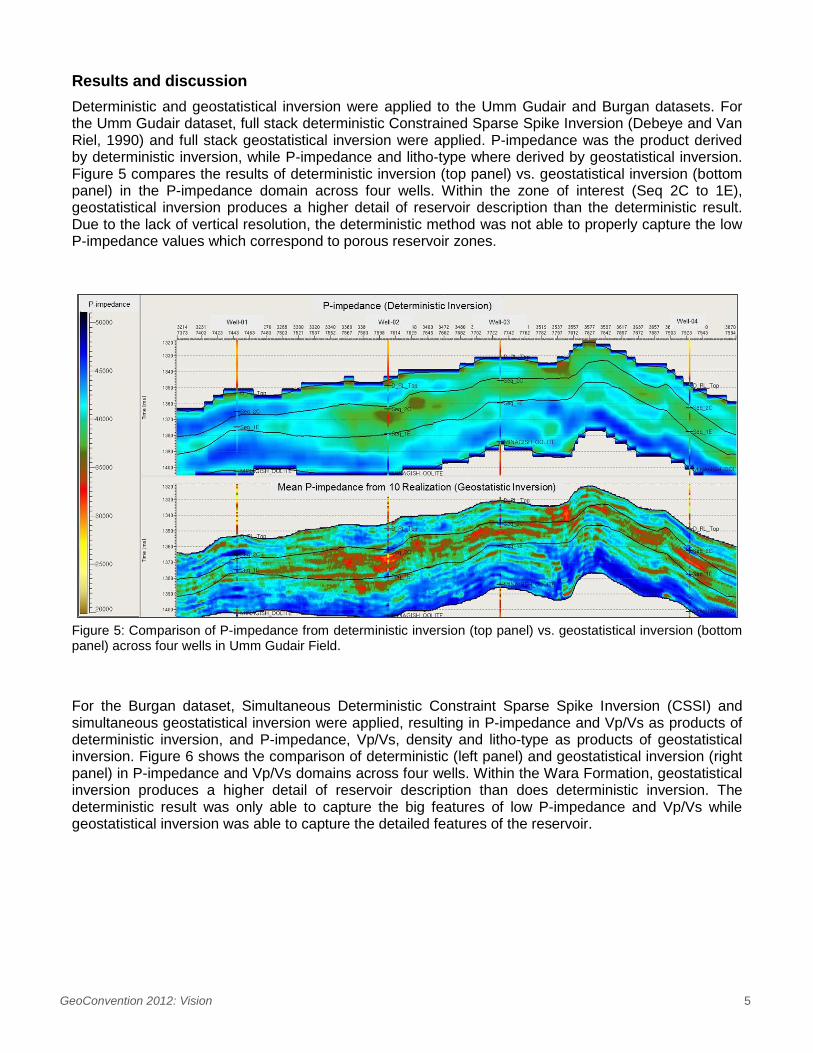
Deterministic and geostatistical inversion were applied to the Umm Gudair and Burgan datasets. For the Umm Gudair dataset, full stack deterministic Constrained Sparse Spike Inversion (Debeye and Van Riel, 1990) and full stack geostatistical inversion were applied. P-impedance was the product derived by deterministic inversion, while P-impedance and litho-type where derived by geostatistical inversion. Figure 5 compares the results of deterministic inversion (top panel) vs. geostatistical inversion (bottom panel) in the P-impedance domain across four wells. Within the zone of interest (Seq 2C to 1E), geostatistical inversion produces a higher detail of reservoir description than the deterministic result. Due to the lack of vertical resolution, the deterministic method was not able to properly capture the low P-impedance values which correspond to porous reservoir zones.
Figure 5: Comparison of P-impedance from deterministic inversion (top panel) vs. geostatistical inversion (bottom panel) across four wells in Umm Gudair Field.
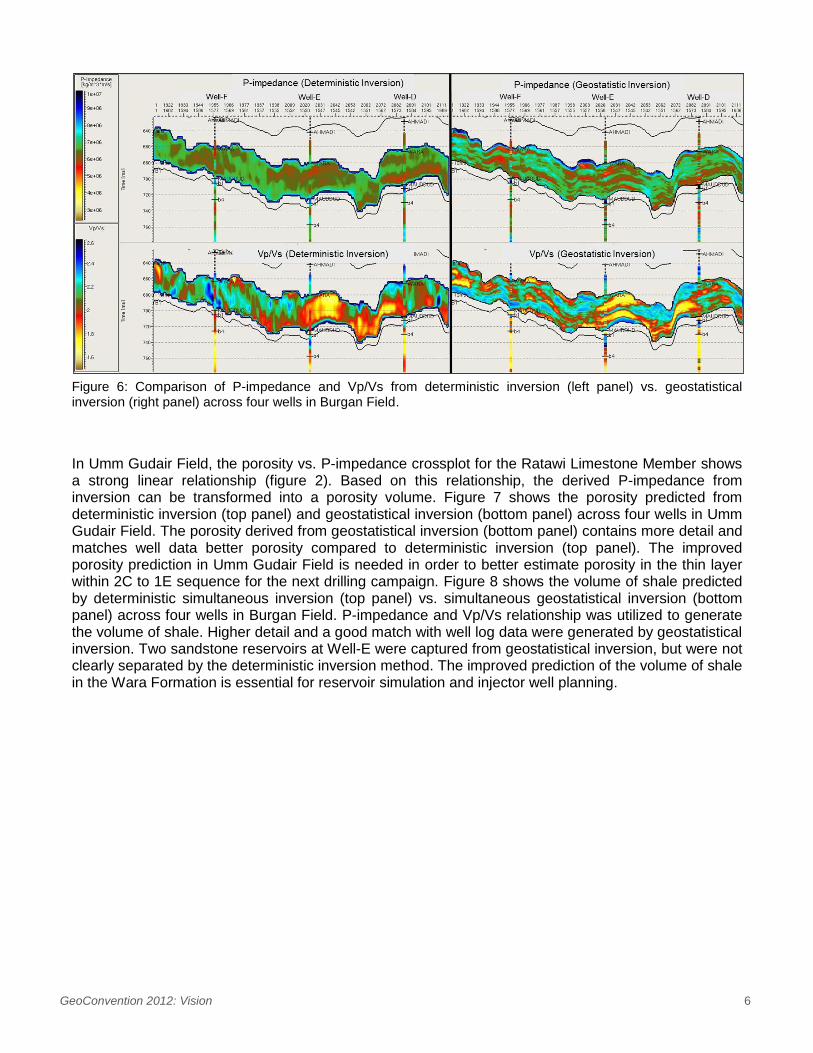
For the Burgan dataset, Simultaneous Deterministic Constraint Sparse Spike Inversion (CSSI) and simultaneous geostatistical inversion were applied, resulting in P-impedance and Vp/Vs as products of deterministic inversion, and P-impedance, Vp/Vs, density and litho-type as products of geostatistical inversion. Figure 6 shows the comparison of deterministic (left panel) and geostatistical inversion (right panel) in P-impedance and Vp/Vs domains across four wells. Within the Wara Formation, geostatistical inversion produces a higher detail of reservoir description than does deterministic inversion. The deterministic result was only able to capture the big features of low P-impedance and Vp/Vs while geostatistical inversion was able to capture the detailed features of the reservoir.
GeoConvention 2012: Vision 6
Figure 6: Comparison of P-impedance and Vp/Vs from deterministic inversion (left panel) vs. geostatistical inversion (right panel) across four wells in Burgan Field.
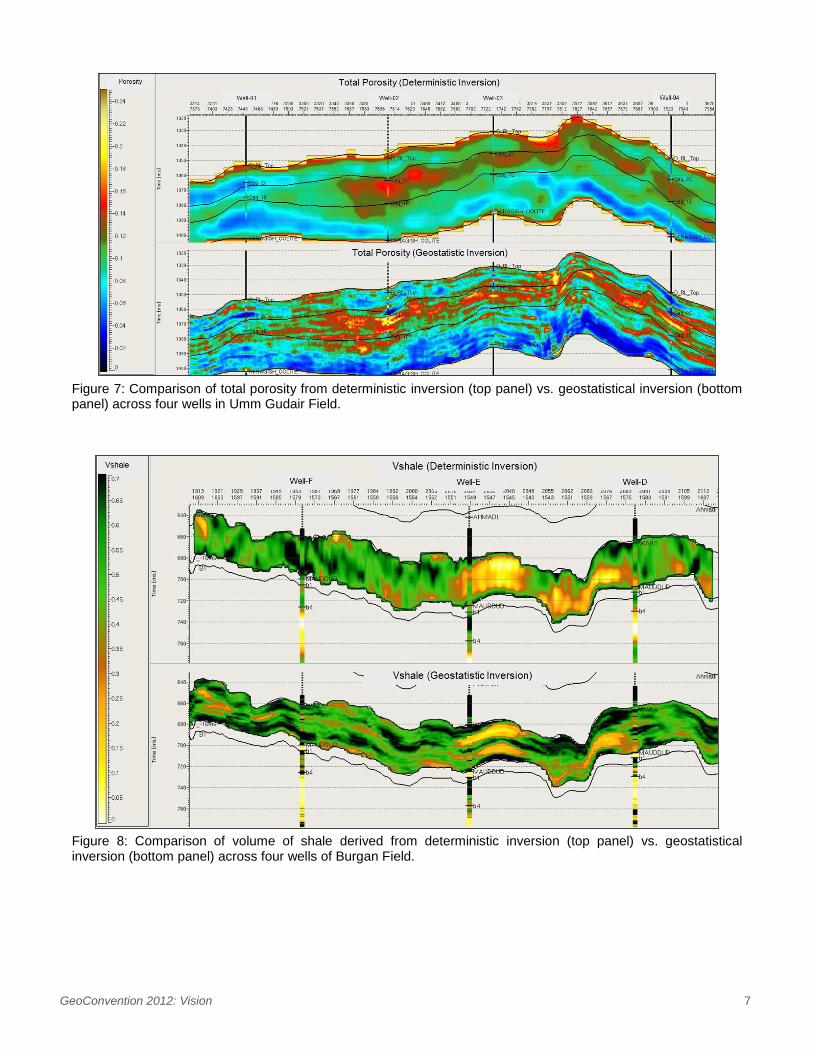
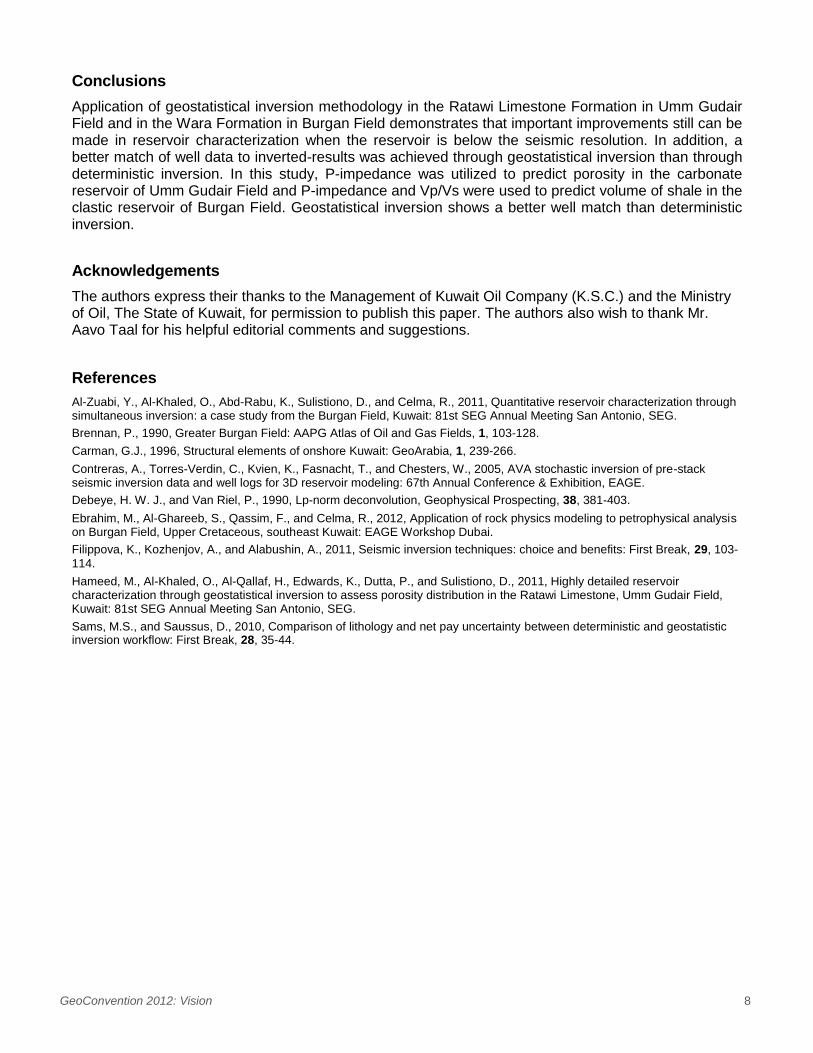
In Umm Gudair Field, the porosity vs. P-impedance crossplot for the Ratawi Limestone Member shows a strong linear relationship (figure 2). Based on this relationship, the derived P-impedance from inversion can be transformed into a porosity volume. Figure 7 shows the porosity predicted from deterministic inversion (top panel) and geostatistical inversion (bottom panel) across four wells in Umm Gudair Field. The porosity derived from geostatistical inversion (bottom panel) contains more detail and matches well data better porosity compared to deterministic inversion (top panel). The improved porosity prediction in Umm Gudair Field is needed in order to better estimate porosity in the thin layer within 2C to 1E sequence for the next drilling campaign. Figure 8 shows the volume of shale predicted by deterministic simultaneous inversion (top panel) vs. simultaneous geostatistical inversion (bottom panel) across four wells in Burgan Field. P-impedance and Vp/Vs relationship was utilized to generate the volume of shale. Higher detail and a good match with well log data were generated by geostatistical inversion. Two sandstone reservoirs at Well-E were captured from geostatistical inversion, but were not clearly separated by the deterministic inversion method. The improved prediction of the volume of shale in the Wara Formation is essential for reservoir simulation and injector well planning.
GeoConvention 2012: Vision 7
Figure 7: Comparison of total porosity from deterministic inversion (top panel) vs. geostatistical inversion (bottom panel) across four wells in Umm Gudair Field.
Figure 8: Comparison of volume of shale derived from deterministic inversion (top panel) vs. geostatistical inversion (bottom panel) across four wells of Burgan Field.
GeoConvention 2012: Vision 8
Conclusions
Application of geostatistical inversion methodology in the Ratawi Limestone Formation in Umm Gudair Field and in the Wara Formation in Burgan Field demonstrates that important improvements still can be made in reservoir characterization when the reservoir is below the seismic resolution. In addition, a better match of well data to inverted-results was achieved through geostatistical inversion than through deterministic inversion. In this study, P-impedance was utilized to predict porosity in the carbonate reservoir of Umm Gudair Field and P-impedance and Vp/Vs were used to predict volume of shale in the clastic reservoir of Burgan Field. Geostatistical inversion shows a better well match than deterministic inversion.
Acknowledgements
The authors express their thanks to the Management of Kuwait Oil Company (K.S.C.) and the Ministry of Oil, The State of Kuwait, for permission to publish this paper. The authors also wish to thank Mr. Aavo Taal for his helpful editorial comments and suggestions.
References
Al-Zuabi, Y., Al-Khaled, O., Abd-Rabu, K., Sulistiono, D., and Celma, R., 2011, Quantitative reservoir characterization through simultaneous inversion: a case study from the Burgan Field, Kuwait: 81st SEG Annual Meeting San Antonio, SEG.
Brennan, P., 1990, Greater Burgan Field: AAPG Atlas of Oil and Gas Fields, 1, 103-128.
Carman, G.J., 1996, Structural elements of onshore Kuwait: GeoArabia, 1, 239-266.
Contreras, A., Torres-Verdin, C., Kvien, K., Fasnacht, T., and Chesters, W., 2005, AVA stochastic inversion of pre-stack seismic inversion data and well logs for 3D reservoir modeling: 67th Annual Conference & Exhibition, EAGE.
Debeye, H. W. J., and Van Riel, P., 1990, Lp-norm deconvolution, Geophysical Prospecting, 38, 381-403.
Ebrahim, M., Al-Ghareeb, S., Qassim, F., and Celma, R., 2012, Application of rock physics modeling to petrophysical analysis on Burgan Field, Upper Cretaceous, southeast Kuwait: EAGE Workshop Dubai.
Filippova, K., Kozhenjov, A., and Alabushin, A., 2011, Seismic inversion techniques: choice and benefits: First Break, 29, 103-
114.
Hameed, M., Al-Khaled, O., Al-Qallaf, H., Edwards, K., Dutta, P., and Sulistiono, D., 2011, Highly detailed reservoir characterization through geostatistical inversion to assess porosity distribution in the Ratawi Limestone, Umm Gudair Field, Kuwait: 81st SEG Annual Meeting San Antonio, SEG.
Sams, M.S., and Saussus, D., 2010, Comparison of lithology and net pay uncertainty between deterministic and geostatistic inversion workflow: First Break, 28, 35-44.


![Joint AVO Inversion with Geostatistical Simulation · 2013-03-23 · Geostatistical Inversion (for example Pendrel et al., CSEG 2004, [1] and Van der Laan & Pendrel, SEG 2001 [2]).](https://static.documents.pub/doc/80x56/5edab0f0ea30a273770f4bbc/joint-avo-inversion-with-geostatistical-simulation-2013-03-23-geostatistical-inversion.jpg)


