GEOTHERMAL ELECTRIC POWER PRODUCTION IN THE UNITED STATES: A SURVEY AND UPDATE FOR 1995-1999 Alex Sifford Sifford Energy 48390 Breakers Boulevard Neskowin, Oregon 97149 USA R. Gordon Bloomquist, Ph.D. Washington State University Energy Program P.O. Box 43165 Olympia, Washington 98504-3165 USA KEW WORDS: Geothermal Power Plants, Well Drilling, Development Potential Resource Areas, United States, Personnel ABSTRACT This survey summarizes geothermal development activity in the United States during the years 1995 - 1999. Geothermal power production in this country is first compared to other sources. State-by-state reviews of geothermal power production are presented. These indicate the continuing dominance of California and Nevada in geothermal power production. Other producing states include Hawaii and Utah. Growth in development has slowed considerably from 18 percent between1980 and 1989 to less than one half percent for the period 1990-1999. By the year 2000, the United States installed capacity is forecast to be at slightly less than 2,400 MW of operating capacity. 1. INTRODUCTION The United States continues to lead the world in installed geothermal power capacity as well as in electrical generation. Geothermal energy is a small contributor to the electric power capacity and generation in the United States. In 1998, geothermal plants constituted about 0.25 percent of the total operable power capacity. In 1998, those plants contributed 0.38 percent of the total generation and, for the first two months in 1999, it stands at 0.38 percent. On a state level, geothermal is a major player in California and Nevada. It is a minor source of power in Hawaii and Utah. Further, it has the potential to become significant on the Big Island of Hawaii and perhaps, in the future, the Pacific Northwest. The most impressive geothermal growth in the United States occurred during the 1980s, with an average annual increase in capacity of about 11 percent. In contrast, from 1990-1998, it has averaged only 0.14 percent due to a leveling off of new plant construction. This recent period also saw a reduction at The Geysers in California to an operating capacity of about 1,140 MW, down from a total installed capacity of 1,875 MW in 1990. Contributing to the capacity stagnation is the retirement and shut down of six units at The Geysers in California. These include the four original units (78 MW), both the Central California Power Agency (CCPA) units (130 MW), and the 55 MW Bottle Rock plant. Table 1 shows the historical development of geothermal capacity installed in the United States from 1960-2005 broken out by state. 2. TOTAL PRODUCTION OF ELECTRICITY: ALL SOURCES Table 2 presents operable electric production capacity and power generation in the United States from all sources for 1995-2005. For 1999 only, data for January to June were available at the time of writing. All data in this table, except those footnoted, came from the USDOE Energy Information Administration (website: www.eia.doe.gov). Geothermal power production fell from 1995 to 1999, but the steepness of the decline has been slowed by reinjection activities at The Geysers. This is discussed further below. It should be noted that EIA data for geothermal energy are conservatively estimated. We use our own estimates of operable geothermal capacity, and they are higher than EIA data. Much of any discrepancy can be traced to load factors that vary each year for many of the plants. Capacity variations are due to both contract and resource conditions. Geothermal capacity for all years was calculated using the data compiled for this paper. We project year 2005 values based on gaining all of the California planned capacity additions. 3. GEOTHERMAL DEVELOPMENTS BY STATE 3.1 California California accounts for over 90 percent of the installed geothermal power capacity in the country. The major areas of development are The Geysers, Imperial Valley, and Coso. Other areas with geothermal plants are Casa Diablo (Mono-Long Valley or Mammoth) and the Honey Lake Valley including Wendel and Amedee. Glass Mountain is scheduled for development. The locations of all of these areas are shown in Figure 1. The Geysers There have been no new plants installed since 1989 when the 2x10 MW J.W. Aidlin plant came on-line. The four original PG&E units were officially retired in 1992; all surface equipment for Units 1 through 4 has been dismantled. Supply wells have been redirected to other units. Unit 1 was designated a National Historic Mechanical Engineering Landmark in 1985 by the American Society of Mechanical Engineers. Other plants no longer in service include PG&E Unit 15 (59 MW, retired in 1989), DWR Bottle Rock plant (55 MW, closed in 1990), and the CCPA Units 1&2 (130 MW, retired in 1996). Figure 2 shows the power plant locations at The Geysers. Table 3 gives data on the plants, including the rating and the actual output for the years 1996, 1997, and 1998 (CDOG, 1997, 1998). Owing to a shortfall of steam, the difference between rated and 441
Transcript
GEOTHERMAL ELECTRIC POWER PRODUCTION IN THE UNITED STATES:A SURVEY AND UPDATE FOR 1995-1999
Alex SiffordSifford Energy
48390 Breakers BoulevardNeskowin, Oregon 97149
USA
R. Gordon Bloomquist, Ph.D.Washington State University Energy Program
P.O. Box 43165Olympia, Washington 98504-3165
USA
KEW WORDS: Geothermal Power Plants, Well Drilling,Development Potential Resource Areas, United States, Personnel
ABSTRACTThis survey summarizes geothermal development activity in theUnited States during the years 1995 - 1999. Geothermal powerproduction in this country is first compared to other sources.State-by-state reviews of geothermal power production arepresented. These indicate the continuing dominance of Californiaand Nevada in geothermal power production. Other producingstates include Hawaii and Utah. Growth in development hasslowed considerably from 18 percent between1980 and 1989 toless than one half percent for the period 1990-1999. By the year2000, the United States installed capacity is forecast to be atslightly less than 2,400 MW of operating capacity.
1. INTRODUCTIONThe United States continues to lead the world in installedgeothermal power capacity as well as in electrical generation.
Geothermal energy is a small contributor to the electric powercapacity and generation in the United States. In 1998,geothermal plants constituted about 0.25 percent of the totaloperable power capacity. In 1998, those plants contributed 0.38percent of the total generation and, for the first two months in1999, it stands at 0.38 percent.
On a state level, geothermal is a major player in California andNevada. It is a minor source of power in Hawaii and Utah.Further, it has the potential to become significant on the BigIsland of Hawaii and perhaps, in the future, the PacificNorthwest.
The most impressive geothermal growth in the United Statesoccurred during the 1980s, with an average annual increase incapacity of about 11 percent. In contrast, from 1990-1998, it hasaveraged only 0.14 percent due to a leveling off of new plantconstruction. This recent period also saw a reduction at TheGeysers in California to an operating capacity of about 1,140MW, down from a total installed capacity of 1,875 MW in 1990.Contributing to the capacity stagnation is the retirement and shutdown of six units at The Geysers in California. These include thefour original units (78 MW), both the Central California PowerAgency (CCPA) units (130 MW), and the 55 MW Bottle Rockplant.
Table 1 shows the historical development of geothermal capacityinstalled in the United States from 1960-2005 broken out bystate.
2. TOTAL PRODUCTION OF ELECTRICITY: ALLSOURCES
Table 2 presents operable electric production capacity and powergeneration in the United States from all sources for 1995-2005.For 1999 only, data for January to June were available at the timeof writing. All data in this table, except those footnoted, camefrom the USDOE Energy Information Administration (website:www.eia.doe.gov).
Geothermal power production fell from 1995 to 1999, but thesteepness of the decline has been slowed by reinjection activitiesat The Geysers. This is discussed further below.
It should be noted that EIA data for geothermal energy areconservatively estimated. We use our own estimates of operablegeothermal capacity, and they are higher than EIA data. Much ofany discrepancy can be traced to load factors that vary each yearfor many of the plants. Capacity variations are due to bothcontract and resource conditions.
Geothermal capacity for all years was calculated using the datacompiled for this paper. We project year 2005 values based ongaining all of the California planned capacity additions.
3. GEOTHERMAL DEVELOPMENTS BY STATE
3.1 CaliforniaCalifornia accounts for over 90 percent of the installedgeothermal power capacity in the country. The major areas ofdevelopment are The Geysers, Imperial Valley, and Coso. Otherareas with geothermal plants are Casa Diablo (Mono-LongValley or Mammoth) and the Honey Lake Valley includingWendel and Amedee. Glass Mountain is scheduled fordevelopment. The locations of all of these areas are shown inFigure 1.
The GeysersThere have been no new plants installed since 1989 when the2x10 MW J.W. Aidlin plant came on-line. The four originalPG&E units were officially retired in 1992; all surface equipmentfor Units 1 through 4 has been dismantled. Supply wells havebeen redirected to other units. Unit 1 was designated a NationalHistoric Mechanical Engineering Landmark in 1985 by theAmerican Society of Mechanical Engineers. Other plants nolonger in service include PG&E Unit 15 (59 MW, retired in1989), DWR Bottle Rock plant (55 MW, closed in 1990), and theCCPA Units 1&2 (130 MW, retired in 1996).
Figure 2 shows the power plant locations at The Geysers. Table3 gives data on the plants, including the rating and the actualoutput for the years 1996, 1997, and 1998 (CDOG, 1997, 1998).Owing to a shortfall of steam, the difference between rated and
441
actual power capacity is significant, e.g., 1,137 MW in 1998.However, this shortfall is being reversed in several units by thesoutheast Geysers effluent recycling system discussed below.
What has changed in the last five years at The Geysers isownership: Calpine Corp. now owns over 800 MW of steamreserves and power plants in The Geysers. Calpine firstexpanded its ownership there in 1998 with the purchase of the 72MW SMUD No. 1 plant for $13 million (GRC, 1998a). Up to 50MW of off-peak power from the renamed Sonoma plant is sold toSMUD, terminating in 2001. In addition, SMUD has the optionto purchase up to an additional 10 MW of peak power productionthrough 2005. Calpine markets the excess electricity into theCalifornia power market.
PG&E and Unocal Corp., for different reasons, put theirrespective assets at The Geysers up for sale. On May 10, 1999,Calpine acquired 2 PG&E plants in Lake County, and 12 plantsin Sonoma County for $212.8 million (GRC, 1999c). The 14geothermal facilities have a combined capacity of 699 MW.
Calpine purchased the steam fields supplying the Sonoma Countyplants from Unocal Corp. on March 19, 1999, for $101 million(GRC, 1999b). The company already owned the steam fieldssupplying the Lake County plants.
The latest development at The Geysers is injecting recycledwastewater into the reservoir. Two projects are underway, withthe first system operational. The Southeast Geysers EffluentRecycling project is the world’s first wastewater-to-electricitysystem (www.geysers-pipeline.org). It transports treatedwastewater effluent from the California communities ofClearlake, Lower Lake, and Middletown to The Geysersgeothermal steamfield for injection and recovery as steam forpower generation. In Phase 1 of that system, a 30 mile (48 km)pipeline transports 5,400 gpm (20,500 L/min) of effluent to TheGeysers. Power generation has increased 39 MW betweenJanuary 1998 and January 1999. Plans are underway for Phase 2of that system.
In addition, the city of Santa Rosa plans to send its treatedwastewater 41 mi. (66km) to The Geysers (GRC, 1999d). The$163 million project is slated to go on-line in 2002, providingrouting issues can be settled. Together, these two projects areexpected to make The Geysers production sustainable andprovide local cities with wastewater disposal solutions.
Imperial ValleyThe Imperial Valley consists of facilities in the Salton Sea,Heber, and East Mesa Known Geothermal Resource Areas(KGRA) in southern California. Development of Imperial Valleygeothermal resources slowed during 1995-1999. One plant wasexpanded in 1996 and another plant added at Salton Sea. Sitemaps and plant data for these two areas plus the East Mesa areaare given in Figures 3-5 and Table 4.
The Salton Sea Unit 1 was expanded through the addition of a20-MW unit, (originally called Unit 1 Expansion), and came on-line in 1996. The steam gathering system incorporates the pH-control method to alleviate scaling.
Salton Sea Unit V is a 49-MW (net) geothermal power plantlocated at CalEnergy's Imperial Valley operations. Amodification of the current technology will be used at Unit V,and additional energy will be extracted from brine alreadybrought to the surface. Salton Sea Unit V will provide the powerneeded to operate CalEnergy's Zinc Recovery Project (GRC,1999b). The project should be operating by the time of thisCongress.
The CE Turbo LLC project is a new 10-MW (net) geothermalplant located at CalEnergy's Imperial Valley plants(www.midamerican.com/calenergy). This plant is designed tooptimize the conversion of geothermal energy into electricalenergy.
Honey Lake ValleyThere has been no new activity in this area since 1989 when the30-MW hybrid geothermal-wood products plant went intooperation (DiPippo, 1995). Geothermal hot water is used for itsdirect heat value to augment the efficiency of the wood-waste-fueled unit and contributes about 1.5 MWe of the total plantoutput. See Figure 6 and Table 5 for more details.
CosoPower plants at Coso were sold by CalEnergy (operator andminority owner) to Caithness Energy LLC for $277 million inJanuary 1999 (GRC, 1999a). See Figure 7 and Table 6 for moredetails. The plants were rerated to higher capacity levels due tooperational efficiencies.
Planned AdditionsNew plants are under development at Glass Mountain. BothCalEnergy and Calpine are proposing plants at this site innortheastern California (Table 7) (www.calpine.com,www.midamerican.com/calenergy). Each of these plants isproposed for 49.9 MWe capacity.
3.2 HawaiiA 25-MW hybrid, single-flash/binary plant was commissioned in1993 at Puna in the Kilauea East Rift Zone on the Big Island ofHawaii (DiPippo, 1995). The plant is located at the easternmostpoint of the island, about 5.6 km (3.5 mi) west of the Kapohocrater and the same distance southeast of the town of Pahoa.
3.3 NevadaAs of 1999, there were power plants operating at ten differentsites in Nevada with a total power capacity of 195.7 MW. Fourplants have come on-line this decade: Soda Lake II (15 MW,1990), Steamboat 2 (12 MW, 1992), and Brady Hot Springs (24MW, 1992). The plants in Nevada include flash and binaryenergy conversion systems. Figure 8 and Table 8 have moredetails.
One change in the last five years in Nevada has also beenownership. U.S. Energy Systems, Inc. in July 1999, acquired FarWest Capital subsidiary Steamboat Development Corp. of Reno,Nevada, which includes the 40-MW Steamboat 2 and 3geothermal power plants and rights to the 600 acres of underlyinggeothermal resource fields. The Steamboat 2 and 3 plants areadjacent to the smaller Steamboat 1 and 1A power plants alreadyowned by U.S. Energy Systems.
In a related agreement, Trigen-Cinergy Solutions will operate thefour Steamboat plants under contract. Additionally, Trigen-Cinergy will acquire other energy assets of Reno-basedgeothermal companies including the development rights to theReno Energy Geothermal District heating project and WesternPower Investments. Western Power holds a license for utilizingthe Kalina Cycle in geothermal power applications.
Plans to develop power projects at Fish Lake Valley, Rye Patch,and Sulfur Hot Springs have not materialized. The absence ofcommercial resources and favorable power sales agreementscontinues to discourage development.
442
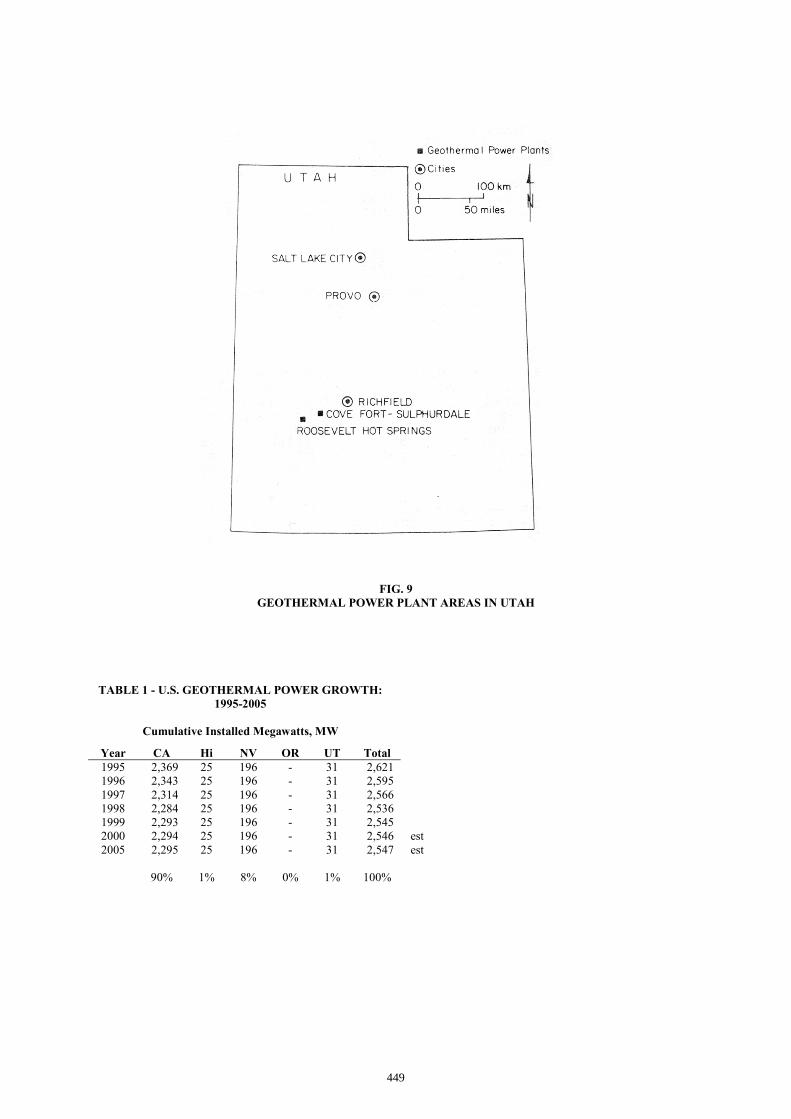
3.4 UtahIn the 1990s, the Bud L. Bonnett power plant came on-line at theSulphurdale/Cove Fort geothermal field (DiPippo, 1995). Theunit is rated at 7 MW, and is the latest addition to the powercomplex at that site. There are also a 2-MW backpressure steamturbine and four binary units (with a total rating of 2 MW) thatare located downstream of the steam turbine. Figure 9 and Table9 give more details.
3.5 Other Plants Planned for the United StatesOregonPlans to develop plants at Vale and Newberry Volcano were bothcancelled during the 1990s due to unsuccessful reservoirconfirmation projects.
4. GEOTHERMAL WELL DRILLINGThe drilling of wells to support geothermal power generation hastapered off since the 1980s and early 1990s.
4.1 CaliforniaThe vast majority of geothermal power wells in the United Statesare in California. For the period 1995-1999 (for which completedata exist), the number of exploration, production, injection, andobservation wells drilled fell from 38 in 1990 to 26 in 1995.During the period 1996-1998, only 20 new wells were drilled inall of California's many fields. This includes 13 productionswells and 7 injection wells (Hodgson, 1998; Thomas, 1999;Johnson, 1999). The Salton Sea and Cosa are currently the mostactively-drilled areas in the state. Table 10 gives moreinformation on geothermal wells drilled in California.
4.2 NevadaGeothermal well drilling in Nevada peaked in 1992 when 31wells of all types were completed. Over the period 1995-1999, atotal of 28 production wells were drilled (Wells, 1999).
4.3 HawaiiThe primary drilling activity in Hawaii occurred in the early1990s in support of the 25-MW Puna geothermal Venture powerplant. All drilling has been confined to the active Kilauea EastRift zone where very high temperatures have been encountered.Unfortunately, permeability in the high temperature part of thereservoir has been unpredictable and not always sufficient toyield commercial productivity. Only one well has been drilled inHawaii since 1995 (Tanaka, 1999; Hawaii Dept. of Land andNatural Resources).
4.4 Other StatesThere were few wells drilled in the other states that might havehigh-grade geothermal prospects.
AlaskaThe only site under serious consideration is Unalaska Island inthe Aleutians, but there was no drilling from 1995-1999. Therewere plans to drill five wells to support the proposed 15-MWpower plant�three for production and two for injection, but theproject never materialized (Liss, 1994; Schochet, 1994).
IdahoThe field at Raft River has been idle since the 5-MW pilot binaryplant was shut down in 1982 (Bliem and Walrath, 1983). Nodrilling took place from 1995-1999, although some attempts weremade to market the site.
New MexicoNo drilling was done from 1995-1999 at either the Valles Calderaor the Fenton Hill site. Both areas had been actively developedstarting in the mid 1970s; the former area was abandoned due tolow well productivity (poor permeability) and the latter area was
used as a test facility for Hot Dry Rock technology. Flow testswere carried out at the HDR site during the early 1990s (Brown,1993). The project was terminated in 1997.
OregonNo new deep wells were drilled during 1995-1999 (Olmstead,1999). Several wells that had been drilled in the early 1990swere plugged and abandoned during this period.
UtahOnly one well was drilled from 1995-1999, a production well atthe Sulphurdale/Cove Fort area by Mother Earth Industries in1996 (Blackett, 1999).
5. GEOTHERMAL LOCALITIESThe U.S. Geological Survey published an extensive compendiumof the geothermal resources in the United States in 1978(Muffler, 1978). This document, U.S.G.S. circular 790, remainsthe accepted reference work on this subject.
The state of Nevada has recently revised and reclassified itsgeothermal prospects (DOE, 1993; Hoops, 1994). The followingfour areas have been newly designated as KGRAs for the purposeof competitive bidding for leases on federal lands:
Fish Lake Valley (Esmeralda County)New York Canyon (Pershing County)Round Mountain (Nye County)Salt Wells (Churchill County).
The following four areas have been reclassified as individualKGRAs; the upper pair were originally grouped together as werethe lower pair:
Brady HazenSoda Lake Stillwater
The following six areas remain as KGRAs:
Beowawe Rye PatchDixie Valley San Emidio DesertGerlach Steamboat Springs
Although Circular 790 lists additional areas in Nevada notmentioned above, those areas have failed to attract any interestand may be considered unattractive for development at this time.
6. PROFESSIONAL GEOTHERMAL PERSONNELThere are certainly many more individuals working ongeothermal projects than those who belong to the GeothermalResources Council (GRC), but we can use the GRC membershipas a conservative measure of those engaged in geothermal workof all kinds. This would include scientists, engineers,technicians, drillers, managers, analysts, etc.
Data on GRC membership for the last five years is given in Table11 (Smith, 1999). The membership varies cyclically, with peakscorrelated with the quinquennial international meetings. Theaverage U.S. membership for the period 1995-1999 is 661, theaverage non-U.S. membership is 128, and the average total is790. This shows a considerable down turn in GRC membershipand reflects, to a large extent, the low level of activity in theindustry as well as the numbers of active geothermists due to thelarge number of mergers that have significantly reduced thenumber of companies involved in geothermal and thusemployment. The fall-off in membership in the years followingan international meeting does not necessarily indicate a loss ofjobs in the geothermal industry, but more likely is caused by thenatural tendency of people to lose touch with their professional
443
societies' affiliation. If this hypotheses is correct, one wouldexpect another surge in membership associated with the 2000World Geothermal Congress.
Assuming that there could be as many as two or three peopleworking on geothermal projects for each one who belongs to theGRC, then there could be as many as 3,000-4,000 people in theU.S. doing work related to geothermal energy.
7. OUTLOOK AND CONCLUSIONSIf all the planned new capacity comes on-line during the next fiveyears, the installed geothermal electric power capacity wouldincrease by 578 MW and reach a total of 3,395 MW. This wouldrepresent an average annual growth rate of about 42.5 percent.Most of the growth will be in the states of California and Nevada.For more details, see Table 12 (values have been rounded to thenearest megawatt).
A more realistic assessment, based on the current actual capacityand assuming that only half of the planned additions appear overthe next five years, would lead to the prediction of about 3,106MW of operable geothermal capacity in the year 2005.
It will be interesting to see how the industry will fare when someof the power sales agreements that were negotiated in times ofrelatively high avoided costs go out of existence. Several ofthese apply to plants in the Imperial Valley and are scheduled tochange during the next four years. The price paid for the energywill become the then-current avoided cost, a much lower valuethan that paid during the early stage of the contract.
When the present excess capacity in the western states begins todisappear, and when the present low price of fossil fuel,particularly natural gas, begins to increase, geothermal energycan be expected to resume its once strong growth.
REFERENCESBenoit, R., 1999. Oxbow Geothermal, personal communication.
Blackett, R.E., 1999. Utah Geological Survey, Cedar City, Utah.Personal communication.
CDOG 1997-1998. California Div. of Oil, Gas & Geothermal,1997 Annual Report, pp. 255-271.
DiPippo, R., 1995. Geothermal Electric Power Production in theUnited States: A Survey and Update for 1990-1994.Proceedings of the World Geothermal Congress, IGA Vol. 1,pp.s 353-362.
DOE (1993). Nevada KGRAs Reclassified. Geoth. ProgressMonitor, Rep. No. 15, DOE/EE-0014, Wash., DC, pp. 43-44.
GRC, 1999d. Santa Rosa/Geysers Pipeline Update. GRC Bull.,Vol. 28 (5), p. 145.Hawaii Department of Land and Natural Resources, 1999.Personal communication.
Hodgson, S.F., 2000. Personal communication, January 19.
Johnson, L., 2000. California Division of Oil and Gas,Sacramento, CA. Personal communication, January 19.
Muffler, L.J.P., ed. (1978). Assessment of GeothermalResources of the United States - 1978. U.S. Geol. Surv. Circ.790, USDOI, Arlington, VA.
U.S. Energy Systems web site: www.usenergysystems.com
ACKNOWLEDGEMENTSThe authors thank those sources cited and particularly CharGruessing of the Washington State University Energy Programfor her editorial expertise.
444
FIG. 1GEOTHERMAL POWER PLANT AREAS IN CALIFORNIA
FIG. 2THE GEYSERS POWER PLANTS
445
FIG. 3SALTON SEA GEOTHERMAL POWER PLANTS
FIG. 4EAST MESA GEOTHERMAL POWER PLANTS
446
FIG. 5HEBER GEOTHERMAL POWER PLANTS
FIG. 6HONEY LAKE VALLEY GEOTHERMAL POWER PLANTS
447
FIG. 7COSO GEOTHERMAL POWER PLANTS
FIG. 8GEOTHERMAL POWER PLANT AREAS IN NEVADA
448
FIG. 9GEOTHERMAL POWER PLANT AREAS IN UTAH
TABLE 1 - U.S. GEOTHERMAL POWER GROWTH:1995-2005
Cumulative Installed Megawatts, MW
Year CA Hi NV OR UT Total1995 2,369 25 196 - 31 2,6211996 2,343 25 196 - 31 2,5951997 2,314 25 196 - 31 2,5661998 2,284 25 196 - 31 2,5361999 2,293 25 196 - 31 2,5452000 2,294 25 196 - 31 2,546 est2005 2,295 25 196 - 31 2,547 est
90% 1% 8% 0% 1% 100%
449
TABLE 2 - PRESENT AND PLANNED PRODUCTION OF ELECTRICITY
0.38% 70.31% 9.07% 18.60% 100% 100%Sources: Energy Information Administration, USDOE Annual Energy Review 1998Annual Energy Outlook 1999 (AEO99) Report DOE/EIA-0383(99) Authors for 1999 estimatesElectric Power Annual, 1998, Vol. II, December 1999, Report DOE/EIA-0348(98)/2