34
German Association of the Automotive Industry
German Association of the Automotive Industry
European CO2 approach and possible transfer to
South Korea
Dr. Martin Koers
Head of Economic Policy and Climate Protection
German Association of the Automotive Industry
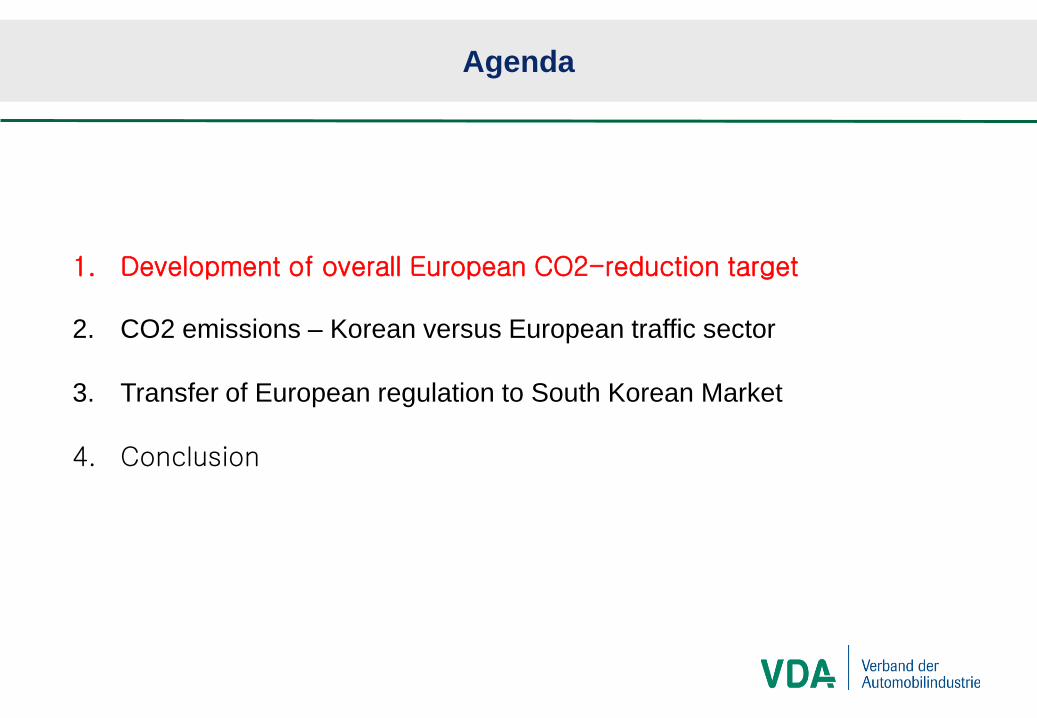
Agenda
1. Development of overall European CO2-reduction target
2. CO2 emissions – Korean versus European traffic sector
3. Transfer of European regulation to South Korean Market
4. Conclusion
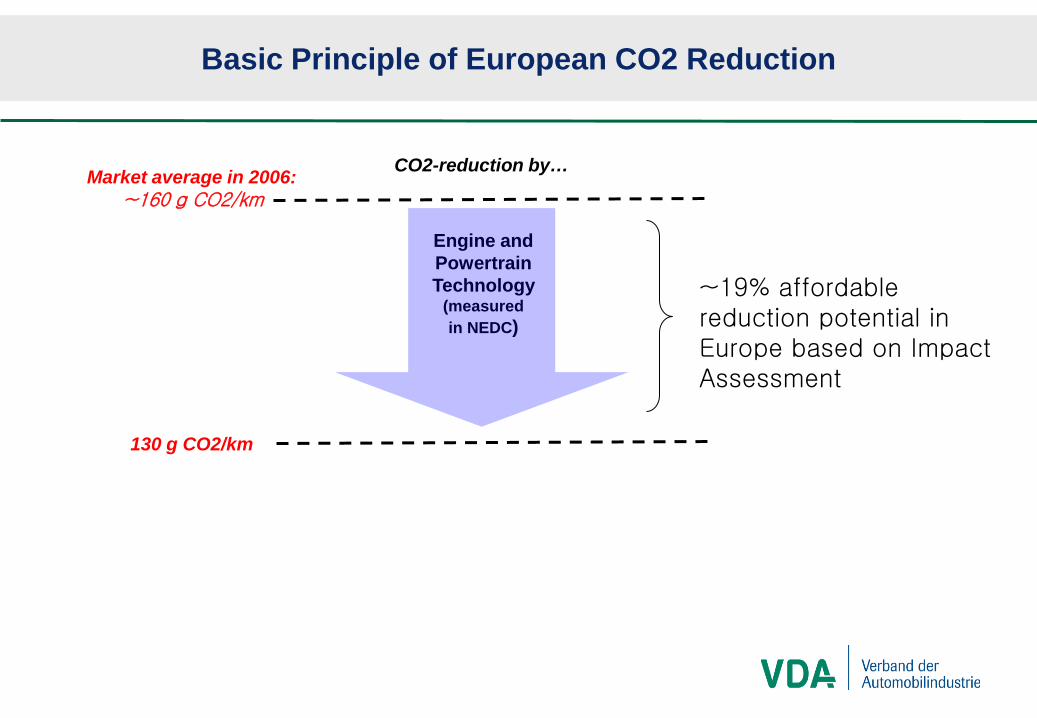
CO2-reduction by…
Engine and Powertrain Technology
(measured in NEDC)
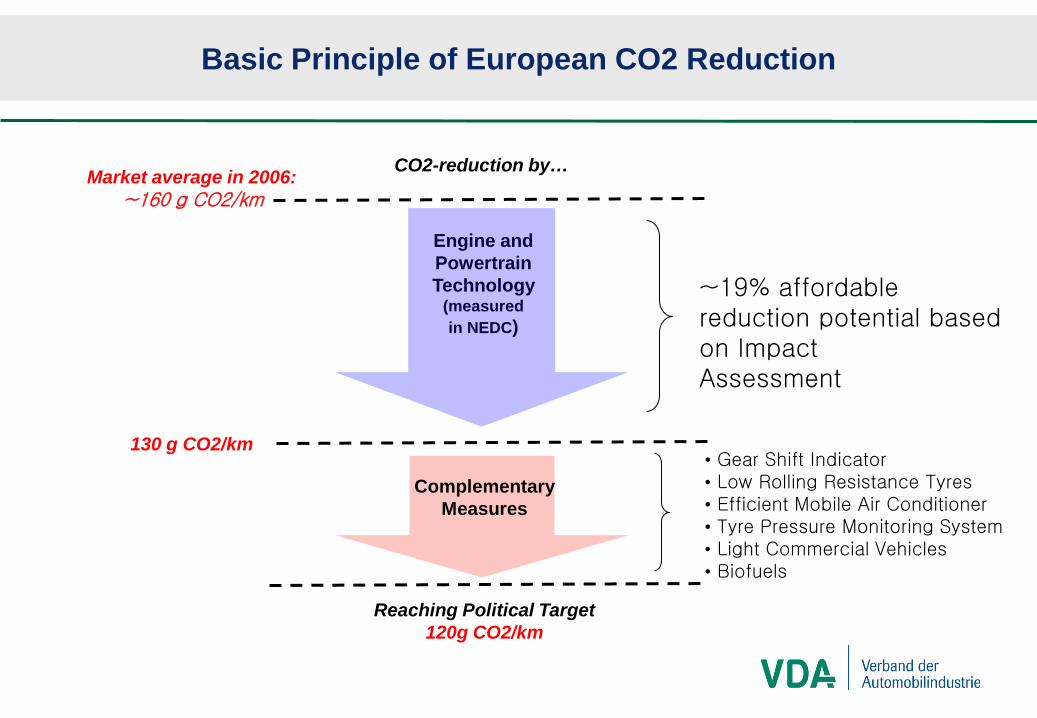
Basic Principle of European CO2 Reduction
130 g CO2/km
~19% affordable reduction potential in Europe based on Impact Assessment
Market average in 2006:~160 g CO2/km
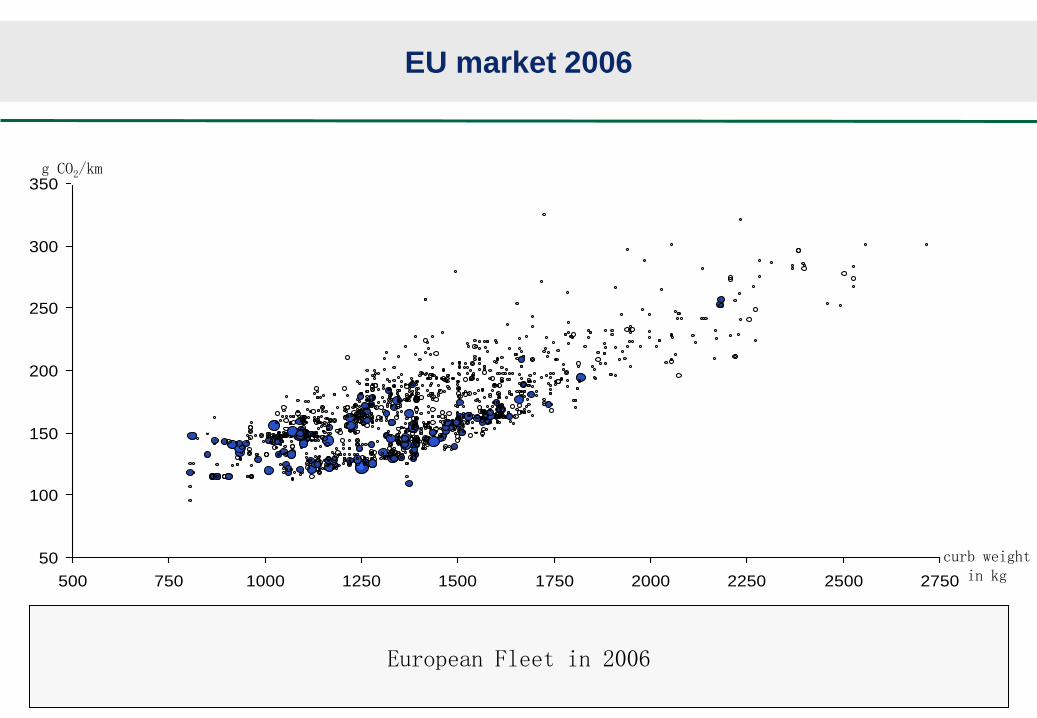
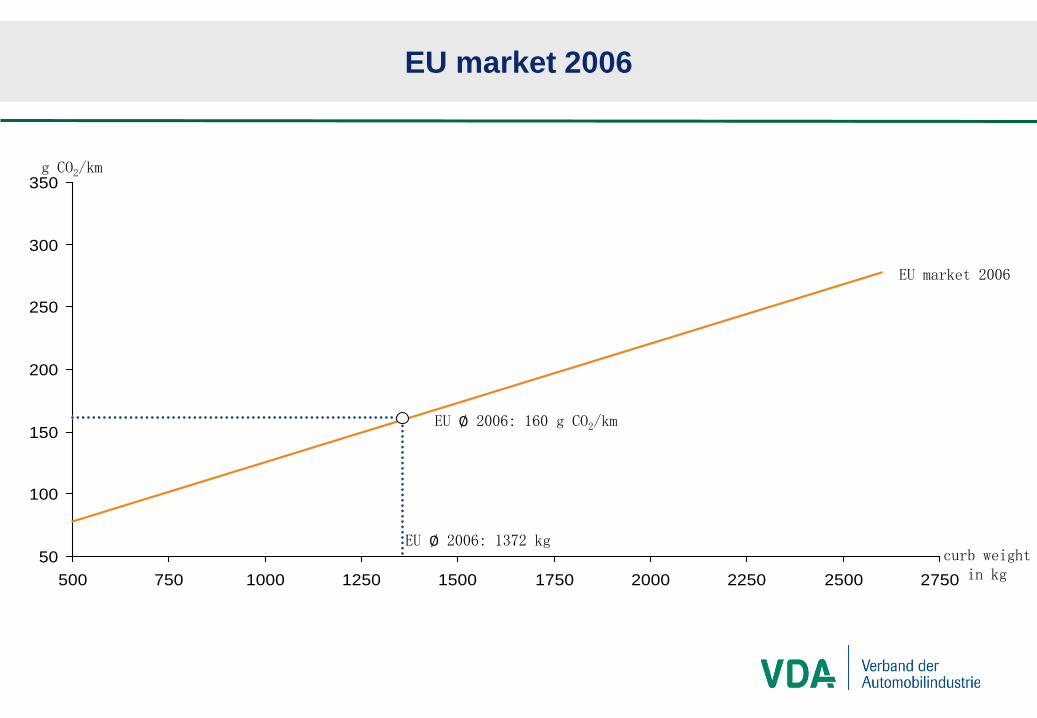
EU market 2006
50
100
150
200
250
300
350
500 750 1000 1250 1500 1750 2000 2250 2500 2750
g CO2/km
curb weightin kg
European Fleet in 2006
EU market 2006: Market Line
50
100
150
200
250
300
350
500 750 1000 1250 1500 1750 2000 2250 2500 2750
EU market 2006
Average emissions per km in the EU 2006: 160 g CO2/km
∅ 2006: 160 g CO2/km
g CO2/km
curb weightin kg
∅ 2006: 1372 kg
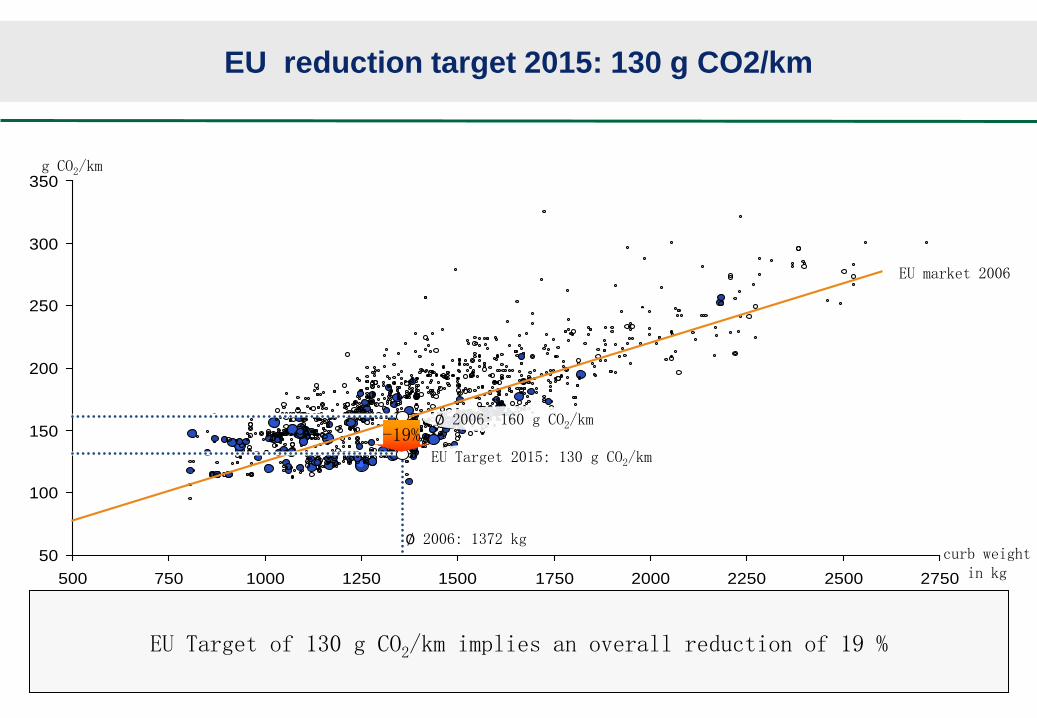
EU reduction target 2015: 130 g CO2/km
50
100
150
200
250
300
350
500 750 1000 1250 1500 1750 2000 2250 2500 2750
EU market 2006
EU Target of 130 g CO2/km implies an overall reduction of 19 %
∅ 2006: 160 g CO2/km
EU Target 2015: 130 g CO2/km
g CO2/km
curb weightin kg
∅ 2006: 1372 kg
-19%
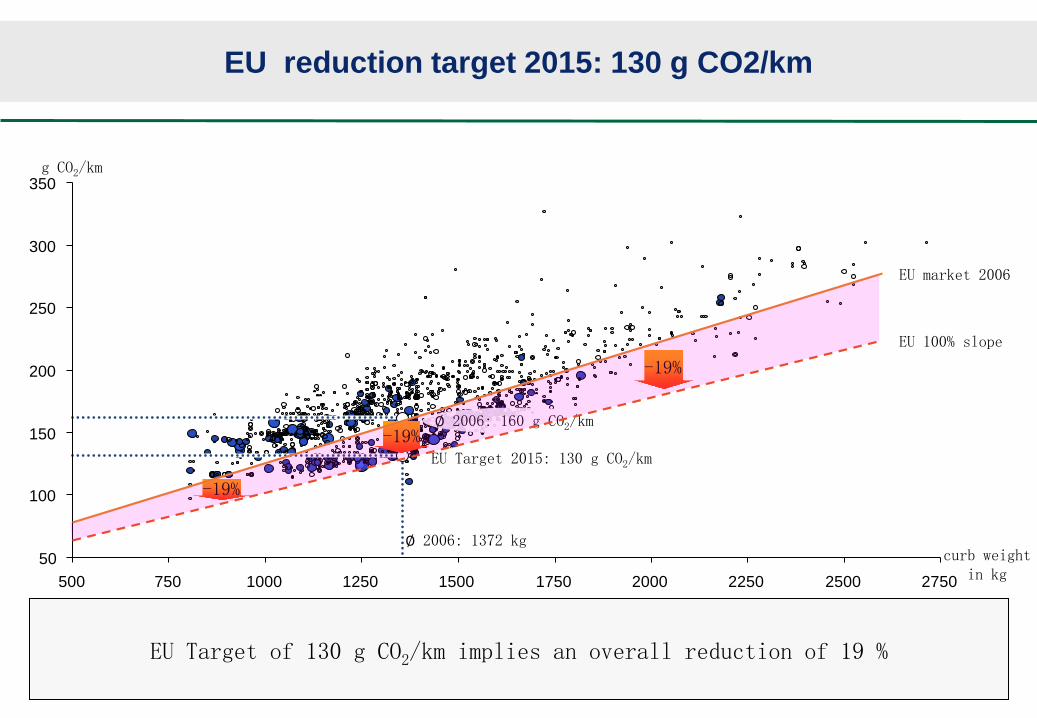
EU reduction target 2015: 130 g CO2/km
EU 100% slope
EU market 2006
EU Target of 130 g CO2/km implies an overall reduction of 19 %
∅ 2006: 160 g CO2/km
EU Target 2015: 130 g CO2/km
g CO2/km
curb weightin kg
∅ 2006: 1372 kg
-19%
-19%
-19%
50
100
150
200
250
300
350
500 750 1000 1250 1500 1750 2000 2250 2500 2750
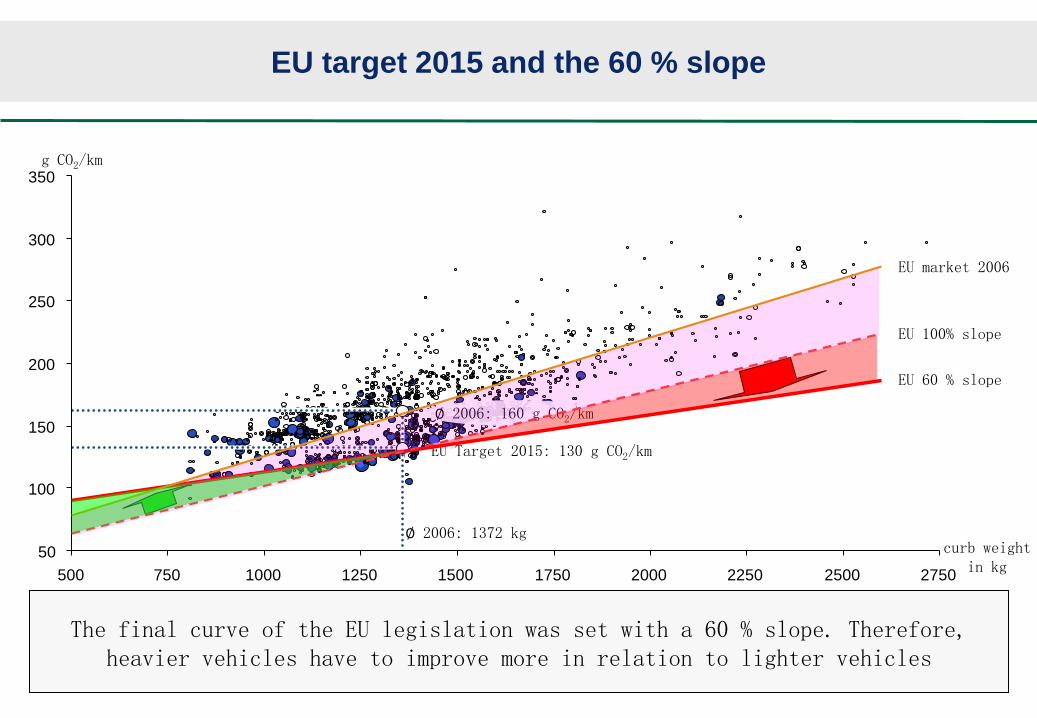
EU target 2015 and the 60 % slope
EU 60 % slope
EU 100% slope
EU market 2006
The final curve of the EU legislation was set with a 60 % slope. Therefore, heavier vehicles have to improve more in relation to lighter vehicles
∅ 2006: 160 g CO2/km
EU Target 2015: 130 g CO2/km
g CO2/km
curb weightin kg
∅ 2006: 1372 kg50
100
150
200
250
300
350
500 750 1000 1250 1500 1750 2000 2250 2500 2750
100
120
140
160
180
200
1.000 1.100 1.200 1.300 1.400 1.500Curb weight [kg/vehicle]
CO
2fle
et v
alue
in 2
006
[g/k
m]
-25%-24%
BMW GroupDaimler
VW Group
Ford
Fiat
GM
PSARenault
- 19%-14%
-12%-16%
Size equals market share
-20%
EU Goal130 g/km
-17%
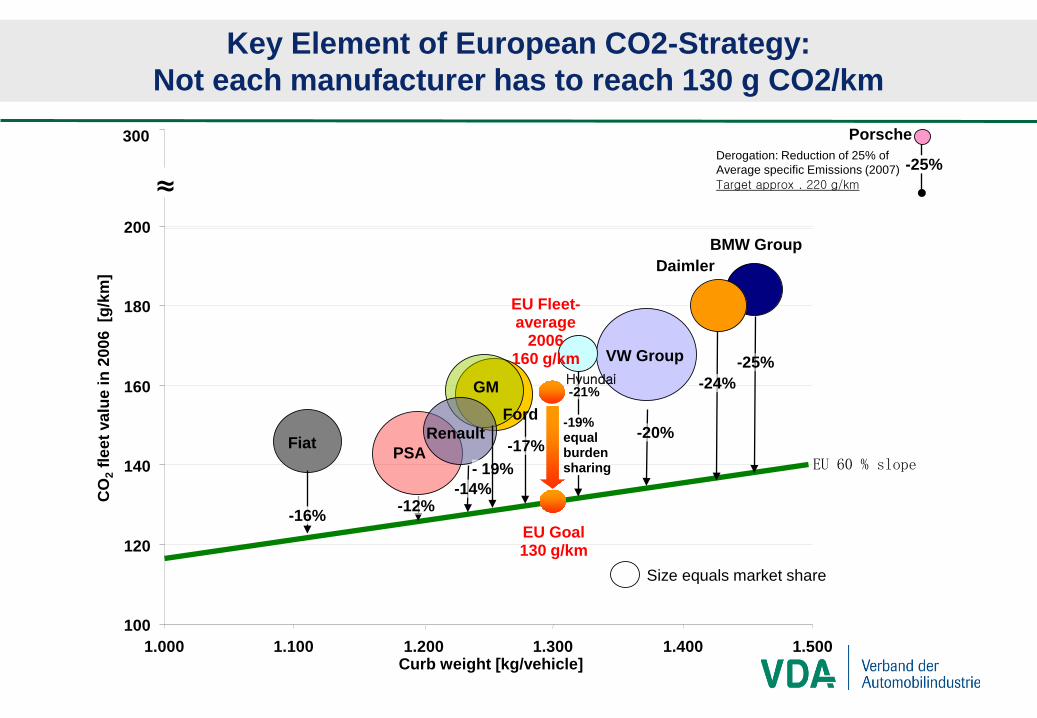
Key Element of European CO2-Strategy:Not each manufacturer has to reach 130 g CO2/km
PorscheDerogation: Reduction of 25% of Average specific Emissions (2007)Target approx . 220 g/km
-25%≈
300
Hyundai-21%
-19%equal burdensharing
EU Fleet-average
2006160 g/km
EU 60 % slope
CO2-reduction by…
Engine and Powertrain Technology
(measured in NEDC)
Basic Principle of European CO2 Reduction
130 g CO2/km
~19% affordable reduction potential based on Impact Assessment
Market average in 2006:~160 g CO2/km
Complementary Measures
Reaching Political Target120g CO2/km
• Gear Shift Indicator• Low Rolling Resistance Tyres• Efficient Mobile Air Conditioner• Tyre Pressure Monitoring System• Light Commercial Vehicles• Biofuels
Summary CO2 target finding
Weight based approach is recommended. The target formula should use curb weight as parameter.
In Europe, not each car has to reach 130 g CO2/km. This is the fleet average of the overall European market.
Each car gets an individual target based on the calculated target function. The addition of the CO2 values of all cars sums up to 130 g CO2/km.
European reduction target was based on an Impact Assessment. Based on this assessment, a reasonable reduction target of 19% via in-cycle technology was derived.
To meet political target, further mandatory complementary measures will be introduced.
Agenda
1. Development of overall European CO2-reduction target
2. CO2 emissions – Korean versus European traffic sector
3. Transfer of European regulation to South Korean Market
4. Conclusion
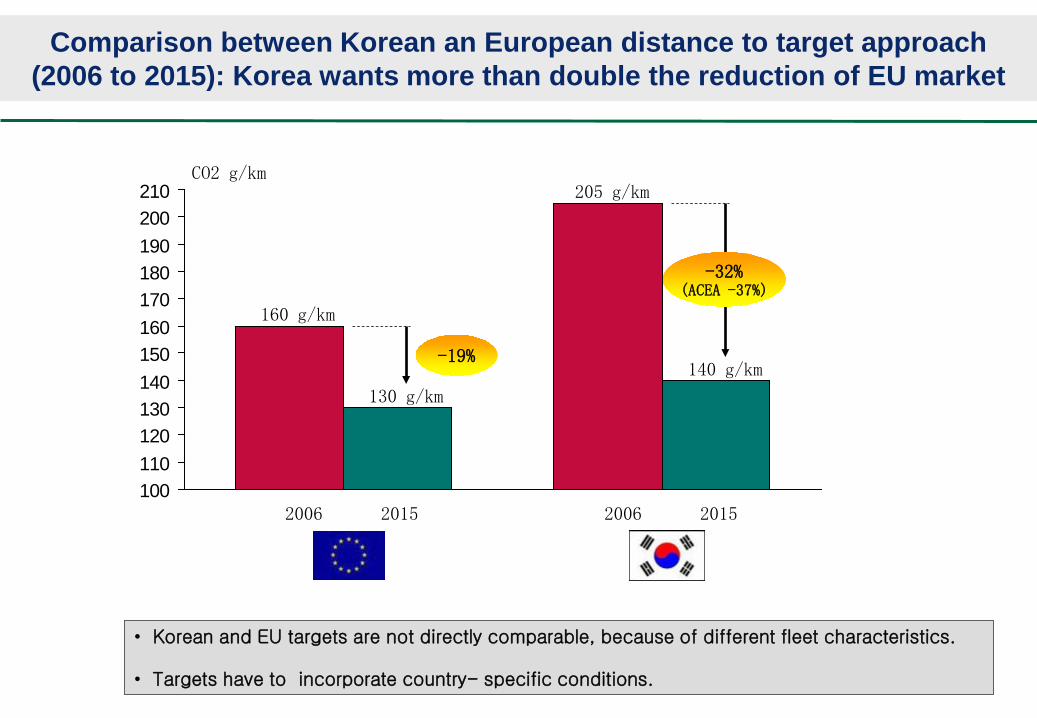
Comparison between Korean an European distance to target approach (2006 to 2015): Korea wants more than double the reduction of EU market
• Korean and EU targets are not directly comparable, because of different fleet characteristics.
• Targets have to incorporate country- specific conditions.
190 g/km
CO2 g/km
(2008)
100110120130140150160170180190200210
160 g/km
2006 2015
205 g/km
2006 2015
130 g/km
140 g/km-19%
-32%(ACEA -37%)
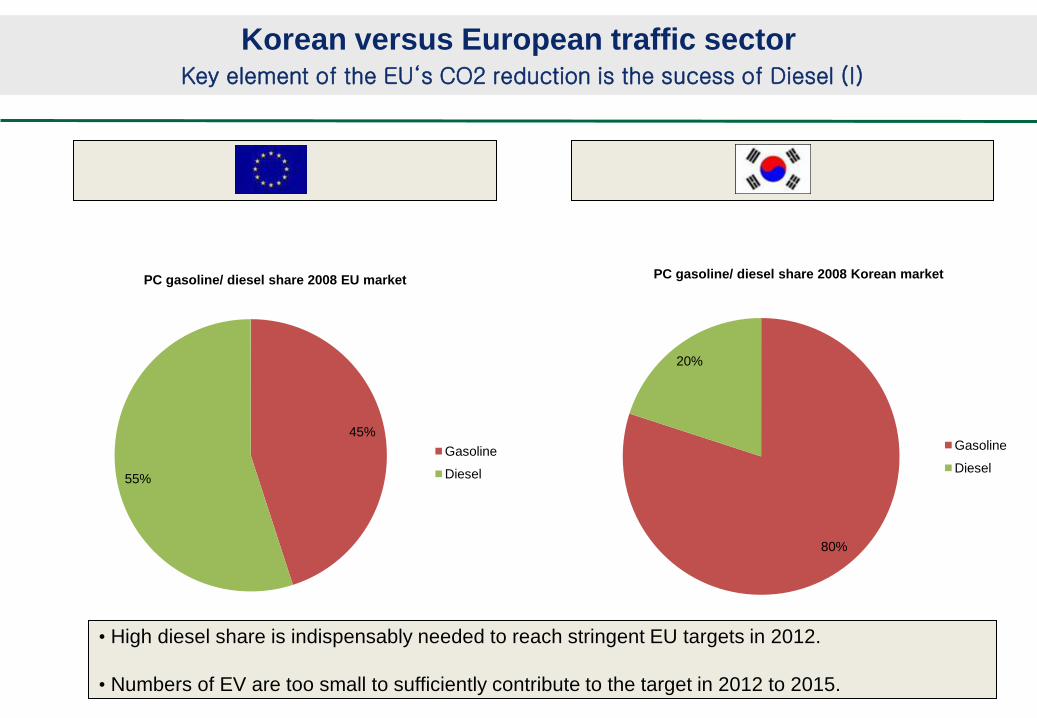
80%
20%
PC gasoline/ diesel share 2008 Korean market
Gasoline
Diesel
45%
55%
PC gasoline/ diesel share 2008 EU market
Gasoline
Diesel
Korean versus European traffic sectorKey element of the EU‘s CO2 reduction is the sucess of Diesel (I)
• High diesel share is indispensably needed to reach stringent EU targets in 2012.
• Numbers of EV are too small to sufficiently contribute to the target in 2012 to 2015.
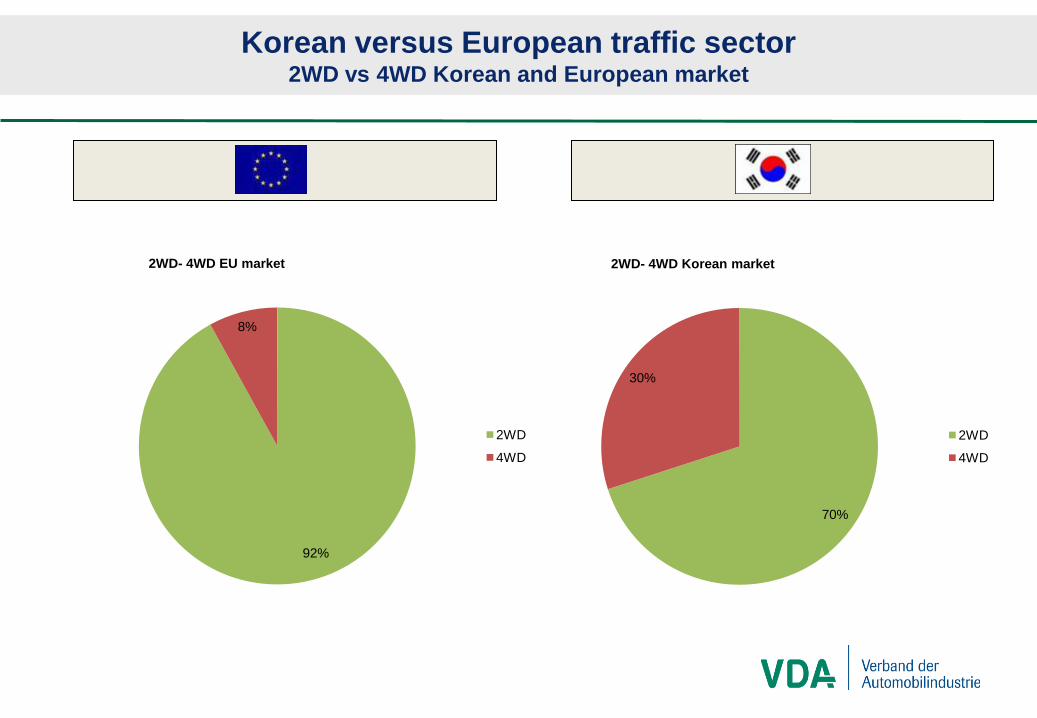
70%
30%
2WD- 4WD Korean market
2WD
4WD
92%
8%
2WD- 4WD EU market
2WD
4WD
Korean versus European traffic sector2WD vs 4WD Korean and European market
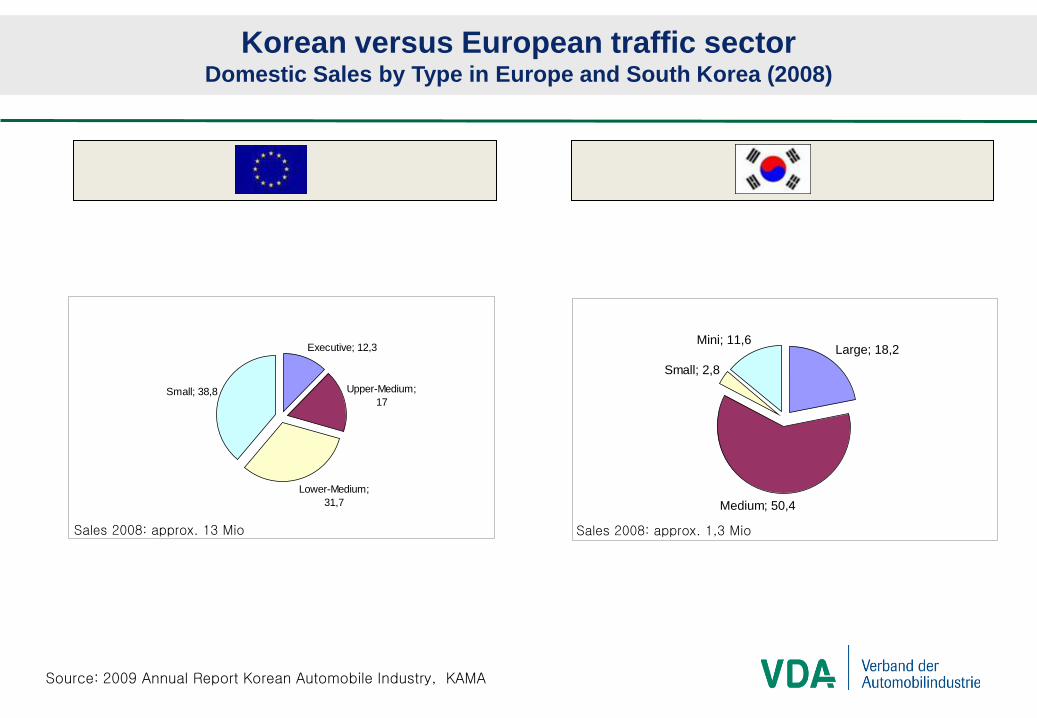
Korean versus European traffic sectorDomestic Sales by Type in Europe and South Korea (2008)
Source: 2009 Annual Report Korean Automobile Industry, KAMA
Large; 18,2
Medium; 50,4
Small; 2,8
Mini; 11,6Executive; 12,3
Upper-Medium; 17
Lower-Medium; 31,7
Small; 38,8
Sales 2008: approx. 13 Mio Sales 2008: approx. 1,3 Mio
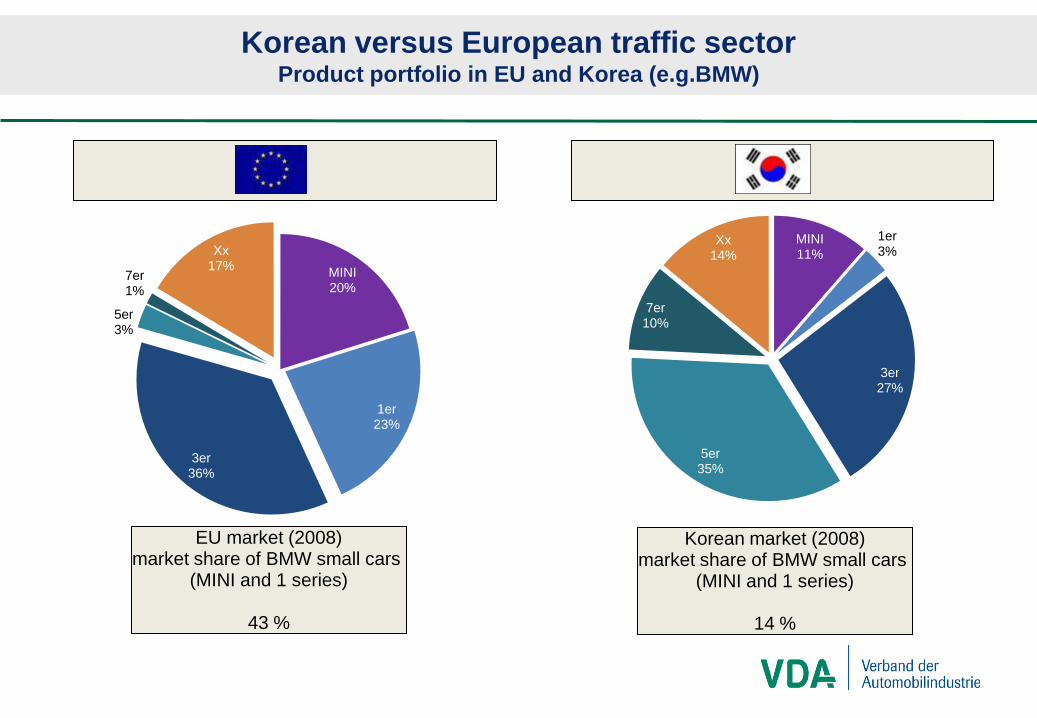
EU market (2008)market share of BMW small cars
(MINI and 1 series)
43 %
Korean market (2008)market share of BMW small cars
(MINI and 1 series)
14 %
MINI11%
1er3%
3er27%
5er35%
7er10%
Xx14%
MINI20%
1er23%
3er36%
5er3%
7er1%
Xx17%
Korean versus European traffic sectorProduct portfolio in EU and Korea (e.g.BMW)
Summary market comparison of European and Korean market
Harmonization is required with respect to country-specific conditions
The fleet characteristic of the European and the South Korean market is totally different. The South Korean market shows significantly higher gasoline share significantly more 4WD cars significantly more large cars
Due to the different fleet characteristic the starting point of finding a feasable reduction target is different Europe starts with an actual value of 160 g CO2/km in 2006 South Korea starts with an actual value of 205 g CO2/km
The different market structure has to be taken into account when calculating the target to avoid market distortions
Agenda
1. Development of overall European CO2-reduction target
2. CO2 emissions – Korean versus European traffic sector
3. Transfer of European regulation to South Korean Market
4. Conclusion
EU market 2006
50
100
150
200
250
300
350
500 750 1000 1250 1500 1750 2000 2250 2500 2750
EU market 2006
g CO2/km
curb weightin kg
EU ∅ 2006: 160 g CO2/km
EU ∅ 2006: 1372 kg
50
100
150
200
250
300
350
500 750 1000 1250 1500 1750 2000 2250 2500 2750
EU market 2006
g CO2/km
curb weightin kg
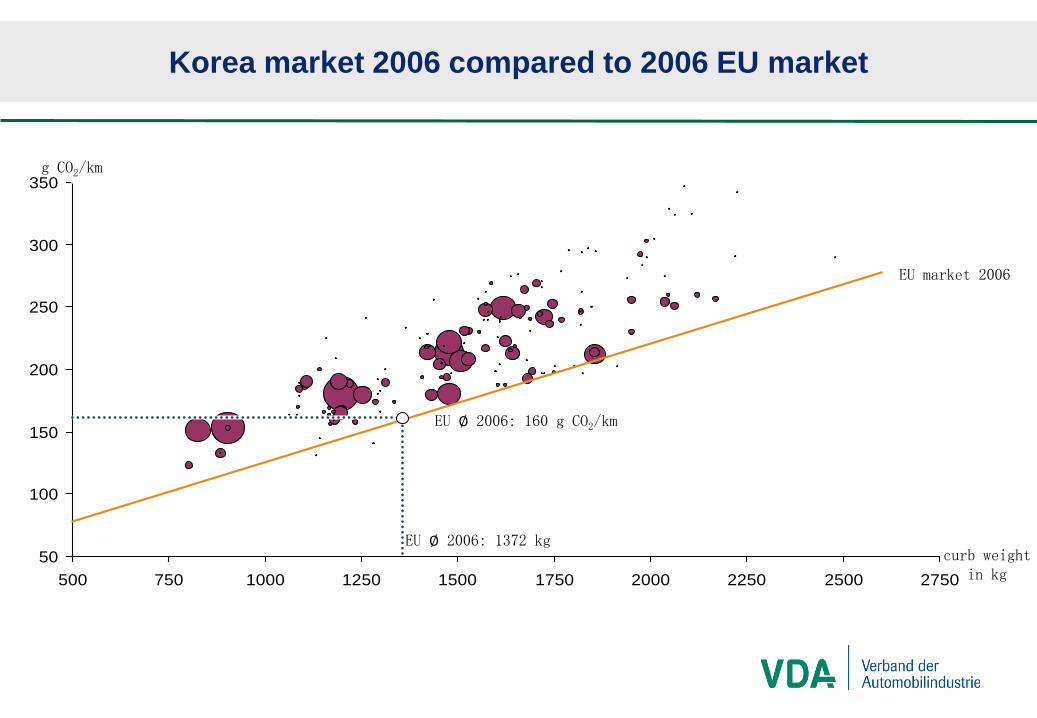
Korea market 2006 compared to 2006 EU market
EU ∅ 2006: 160 g CO2/km
EU ∅ 2006: 1372 kg
Korea market 2006 compared to 2006 EU market
50
100
150
200
250
300
350
500 750 1000 1250 1500 1750 2000 2250 2500 2750
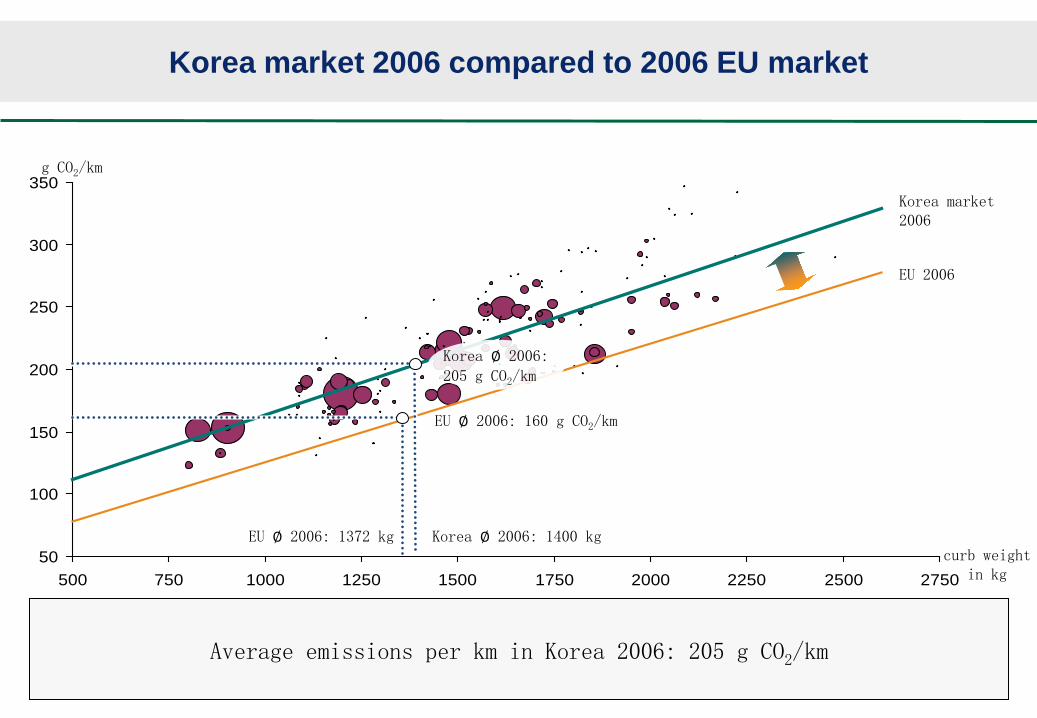
Korea market2006
EU 2006
Average emissions per km in Korea 2006: 205 g CO2/km
EU ∅ 2006: 160 g CO2/km
Korea ∅ 2006:
205 g CO2/km
g CO2/km
curb weightin kg
EU ∅ 2006: 1372 kg Korea ∅ 2006: 1400 kg

CO2-reduction by…
Engine and Powertrain Technology
Conclusion: Transfer of European regulation to South Korean Market
166 g CO2/km
~19% reduction
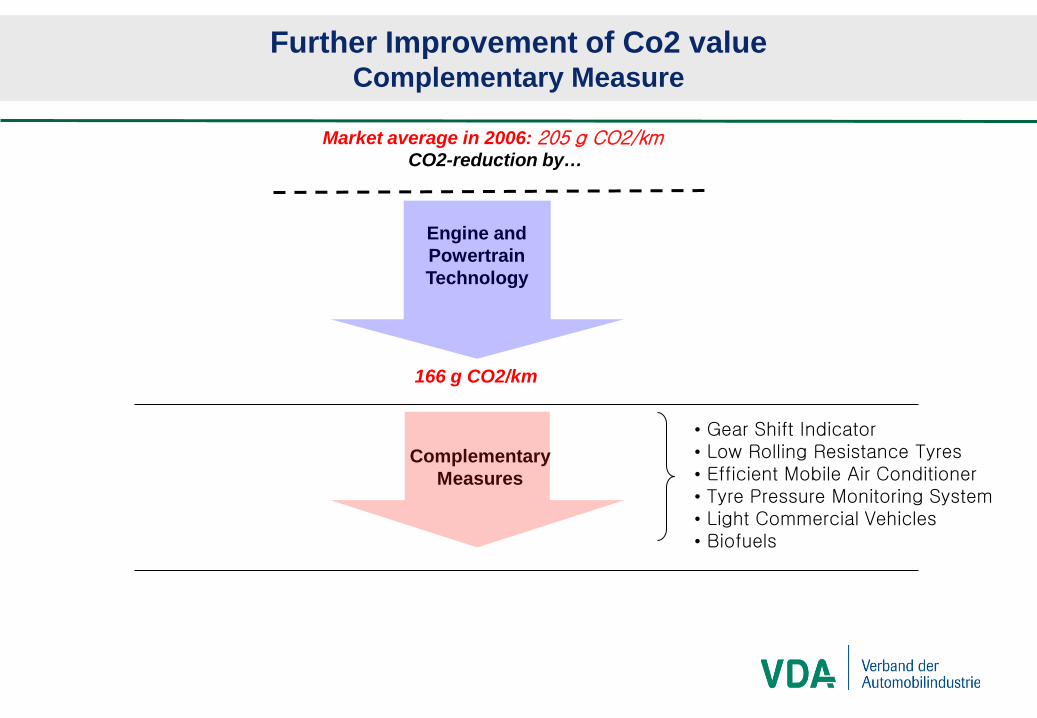
Market average in 2006: 205 g CO2/km
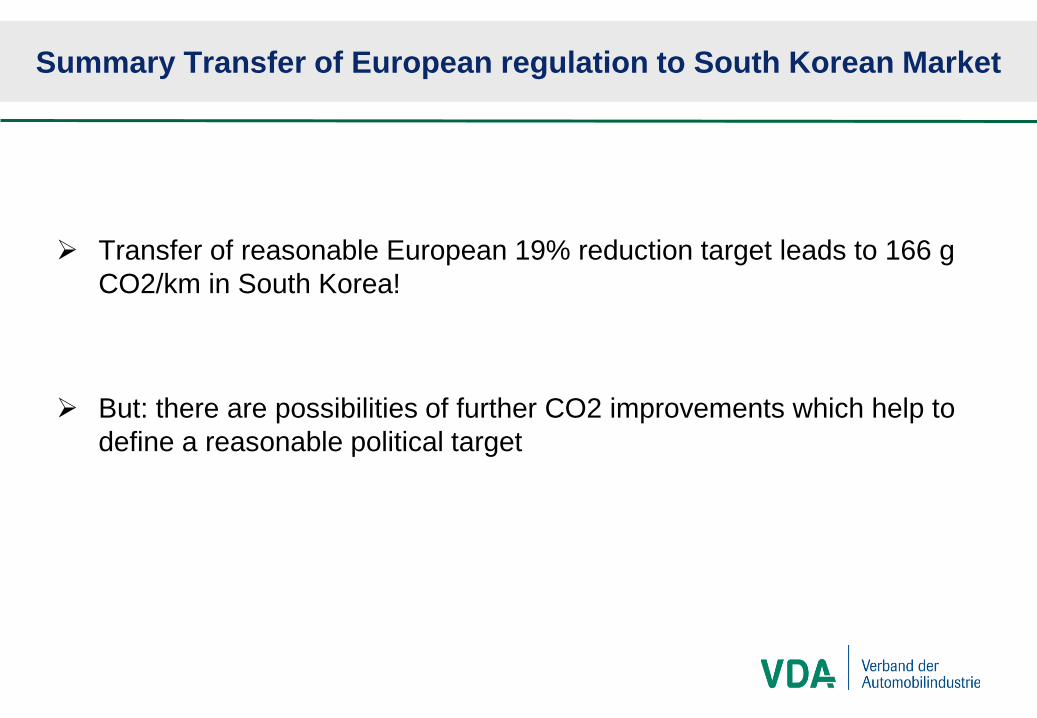
Summary Transfer of European regulation to South Korean Market
Transfer of reasonable European 19% reduction target leads to 166 g CO2/km in South Korea!
But: there are possibilities of further CO2 improvements which help to define a reasonable political target
Market average in 2006: 205 g CO2/kmCO2-reduction by…
Engine and Powertrain Technology
Further Improvement of Co2 valueComplementary Measure
166 g CO2/km
• Gear Shift Indicator• Low Rolling Resistance Tyres• Efficient Mobile Air Conditioner• Tyre Pressure Monitoring System• Light Commercial Vehicles• Biofuels
Complementary Measures
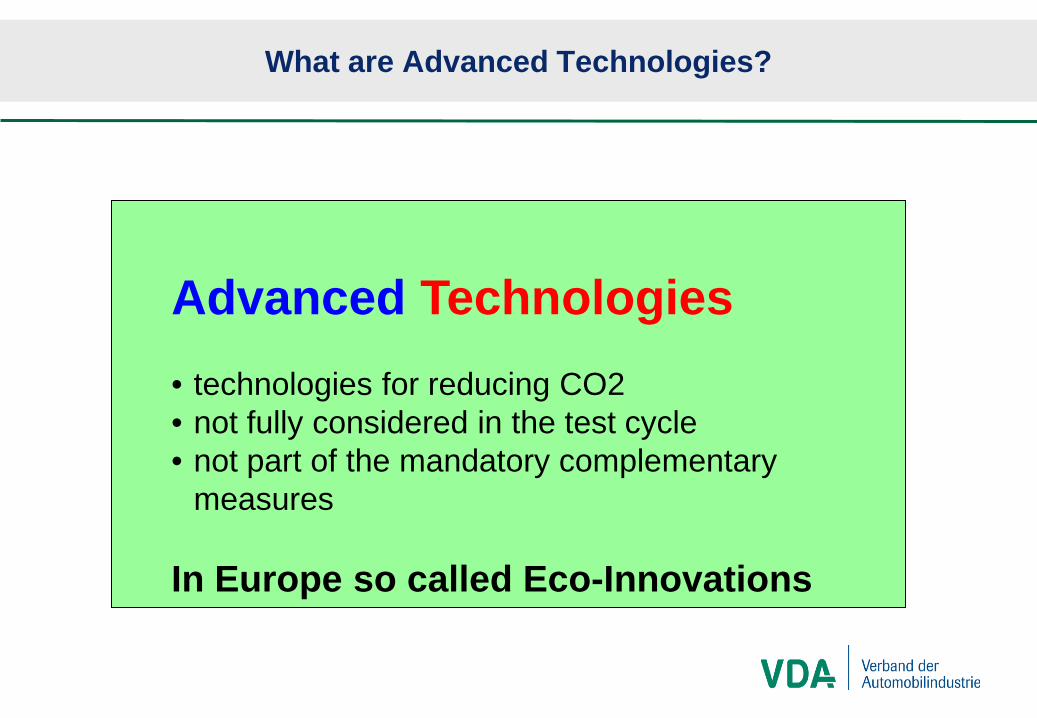
What are Advanced Technologies?
Advanced Technologies• technologies for reducing CO2• not fully considered in the test cycle• not part of the mandatory complementary
measures
In Europe so called Eco-Innovations
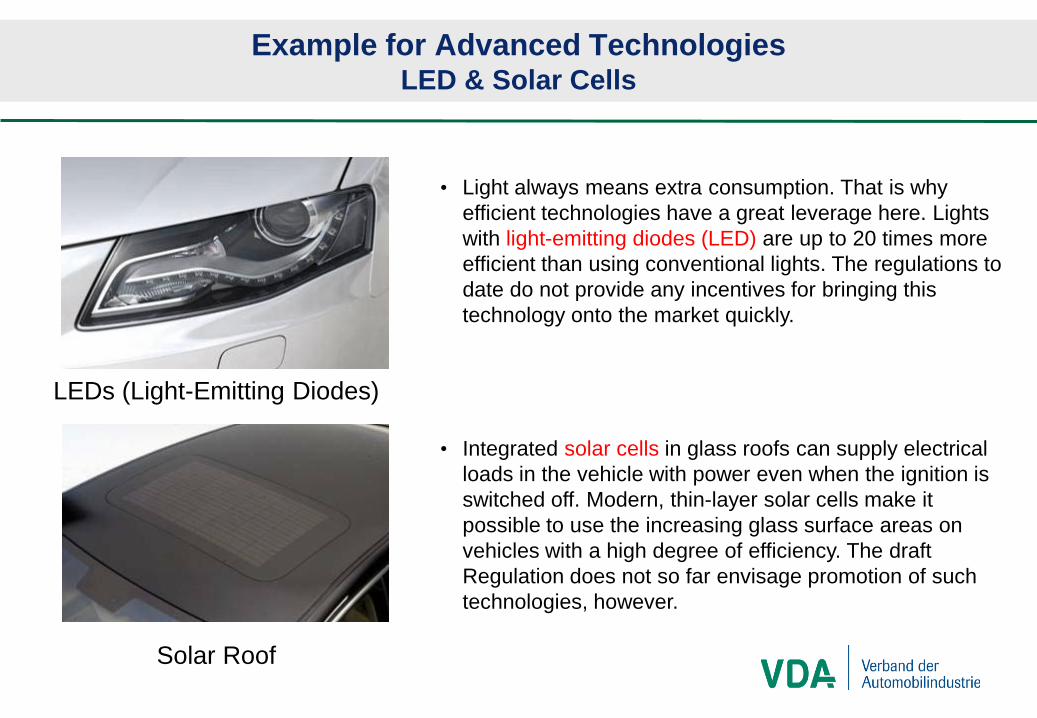
Example for Advanced TechnologiesLED & Solar Cells
LEDs (Light-Emitting Diodes)
Solar Roof
• Light always means extra consumption. That is why efficient technologies have a great leverage here. Lights with light-emitting diodes (LED) are up to 20 times more efficient than using conventional lights. The regulations to date do not provide any incentives for bringing this technology onto the market quickly.
• Integrated solar cells in glass roofs can supply electrical loads in the vehicle with power even when the ignition is switched off. Modern, thin-layer solar cells make it possible to use the increasing glass surface areas on vehicles with a high degree of efficiency. The draft Regulation does not so far envisage promotion of such technologies, however.
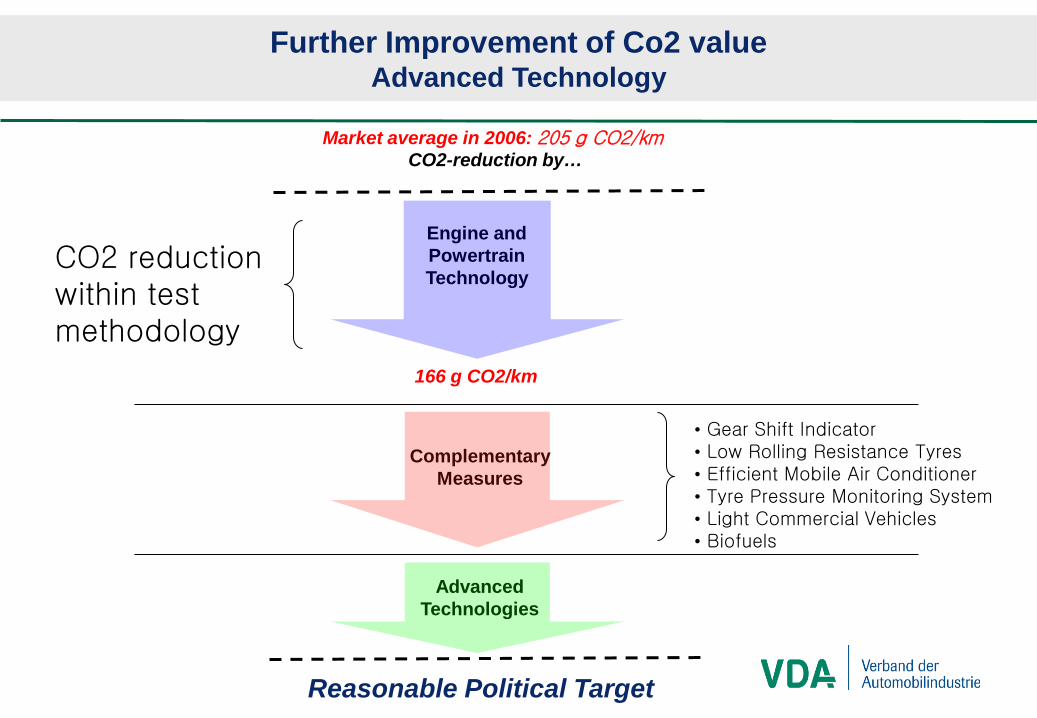
Market average in 2006: 205 g CO2/kmCO2-reduction by…
Engine and Powertrain Technology
166 g CO2/km
CO2 reduction within test methodology
• Gear Shift Indicator• Low Rolling Resistance Tyres• Efficient Mobile Air Conditioner• Tyre Pressure Monitoring System• Light Commercial Vehicles• Biofuels
Complementary Measures
Advanced Technologies
Reasonable Political Target
Further Improvement of Co2 valueAdvanced Technology
Agenda
1. Development of overall European CO2-reduction target
2. CO2 emissions – Korean versus European traffic sector
3. Transfer of European regulation to South Korean Market
4. Conclusion
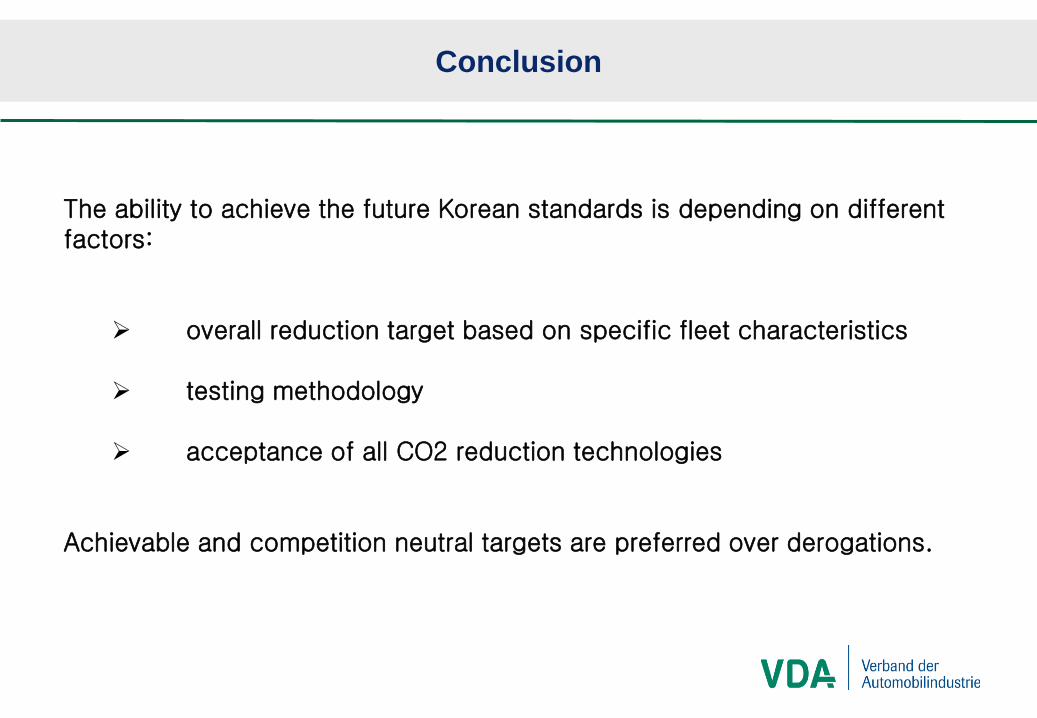
Conclusion
The ability to achieve the future Korean standards is depending on different factors:
overall reduction target based on specific fleet characteristics
testing methodology
acceptance of all CO2 reduction technologies
Achievable and competition neutral targets are preferred over derogations.
Change of test-cycle
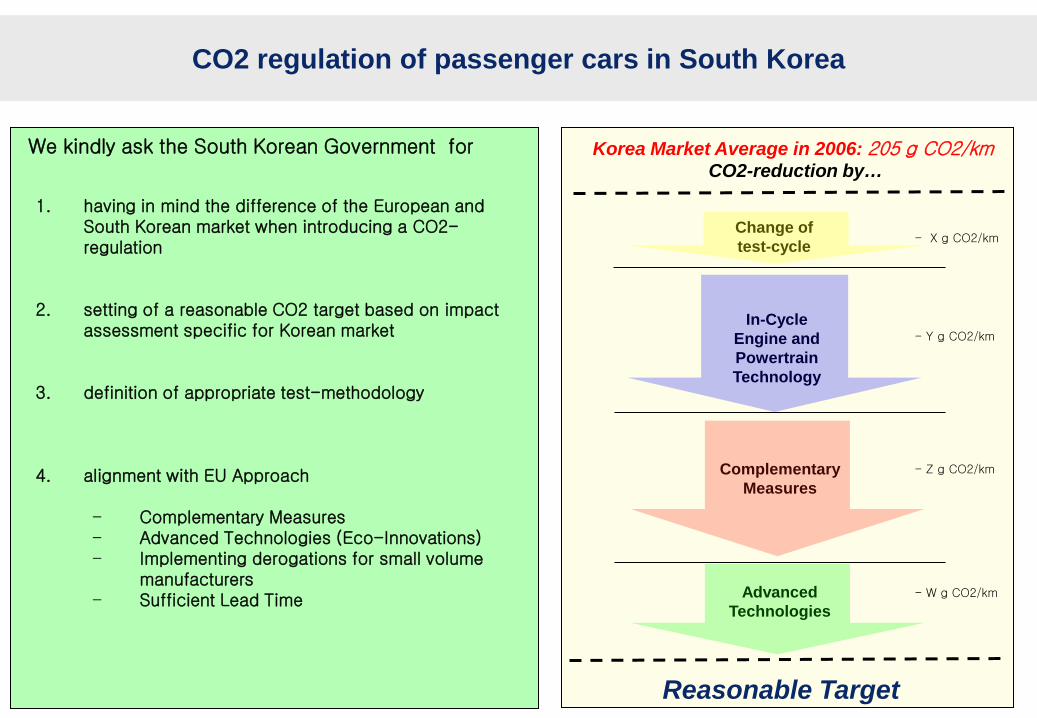
CO2 regulation of passenger cars in South Korea
We kindly ask the South Korean Government for
1. having in mind the difference of the European and South Korean market when introducing a CO2-regulation
2. setting of a reasonable CO2 target based on impact assessment specific for Korean market
3. definition of appropriate test-methodology
4. alignment with EU Approach
- Complementary Measures- Advanced Technologies (Eco-Innovations)- Implementing derogations for small volume
manufacturers- Sufficient Lead Time
Korea Market Average in 2006: 205 g CO2/kmCO2-reduction by…
In-Cycle Engine and Powertrain Technology
Complementary Measures
Advanced Technologies
Reasonable Target
- X g CO2/km
- Y g CO2/km
- Z g CO2/km
- W g CO2/km
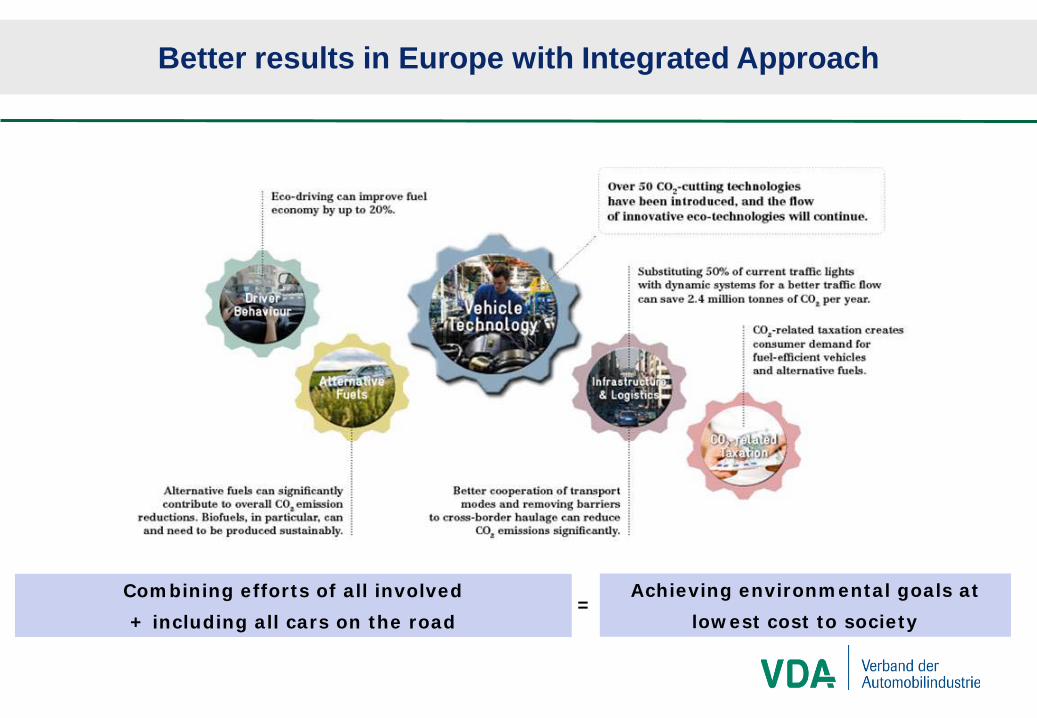
Better results in Europe with Integrated Approach
Achieving environmental goals at
lowest cost to society
Combining efforts of all involved
+ including all cars on the road=

Thank you for your attention!


