Analytics for the Rest of Us Ben Pruden, Product Marketing Director Salesforce Wave @ben_pruden Judy Ko, SVP Marketing, Informatica @judyiko Llana Giovara, Sr. Director Marketing Operations @MarketingonWave Justin Lombardelli, Salesforce Marketing Director Analytics & Events @jlombardelli
Transcript
Analytics for the Rest of Us Ben Pruden, Product Marketing Director Salesforce Wave @ben_pruden Judy Ko, SVP Marketing, Informatica @judyiko Llana Giovara, Sr. Director Marketing Operations @MarketingonWave Justin Lombardelli, Salesforce Marketing Director Analytics & Events @jlombardelli
Safe harbor statement under the Private Securities Litigation Reform Act of 1995:
This presentation may contain forward-looking statements that involve risks, uncertainties, and assumptions. If any such uncertainties materialize or if any of the assumptions proves incorrect, the results of salesforce.com, inc. could differ materially from the results expressed or implied by the forward-looking statements we make. All statements other than statements of historical fact could be deemed forward-looking, including any projections of product or service availability, subscriber growth, earnings, revenues, or other financial items and any statements regarding strategies or plans of management for future operations, statements of belief, any statements concerning new, planned, or upgraded services or technology developments and customer contracts or use of our services.
The risks and uncertainties referred to above include – but are not limited to – risks associated with developing and delivering new functionality for our service, new products and services, our new business model, our past operating losses, possible fluctuations in our operating results and rate of growth, interruptions or delays in our Web hosting, breach of our security measures, the outcome of any litigation, risks associated with completed and any possible mergers and acquisitions, the immature market in which we operate, our relatively limited operating history, our ability to expand, retain, and motivate our employees and manage our growth, new releases of our service and successful customer deployment, our limited history reselling non-salesforce.com products, and utilization and selling to larger enterprise customers. Further information on potential factors that could affect the financial results of salesforce.com, inc. is included in our annual report on Form 10-K for the most recent fiscal year and in our quarterly report on Form 10-Q for the most recent fiscal quarter. These documents and others containing important disclosures are available on the SEC Filings section of the Investor Information section of our Web site.
Any unreleased services or features referenced in this or other presentations, press releases or public statements are not currently available and may not be delivered on time or at all. Customers who purchase our services should make the purchase decisions based upon features that are currently available. Salesforce.com, inc. assumes no obligation and does not intend to update these forward-looking statements.
Safe Harbor
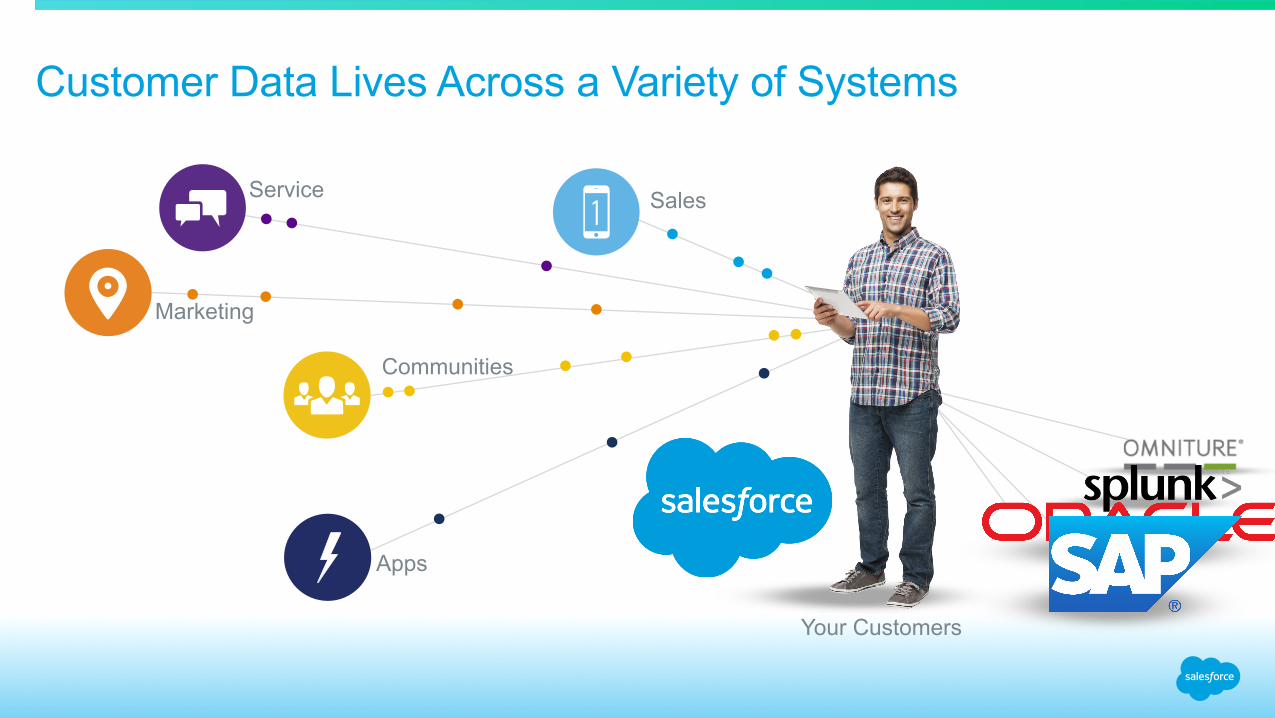
Sales Service
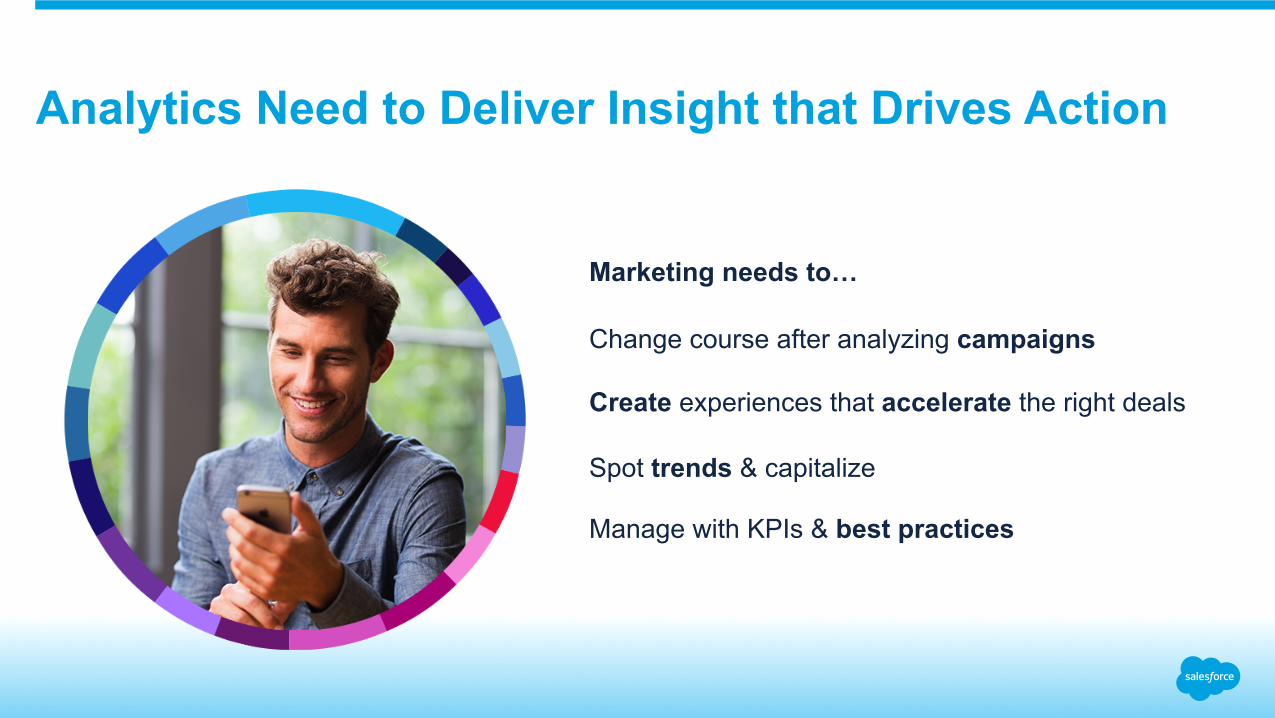
Marketing
Community Apps
Analytics
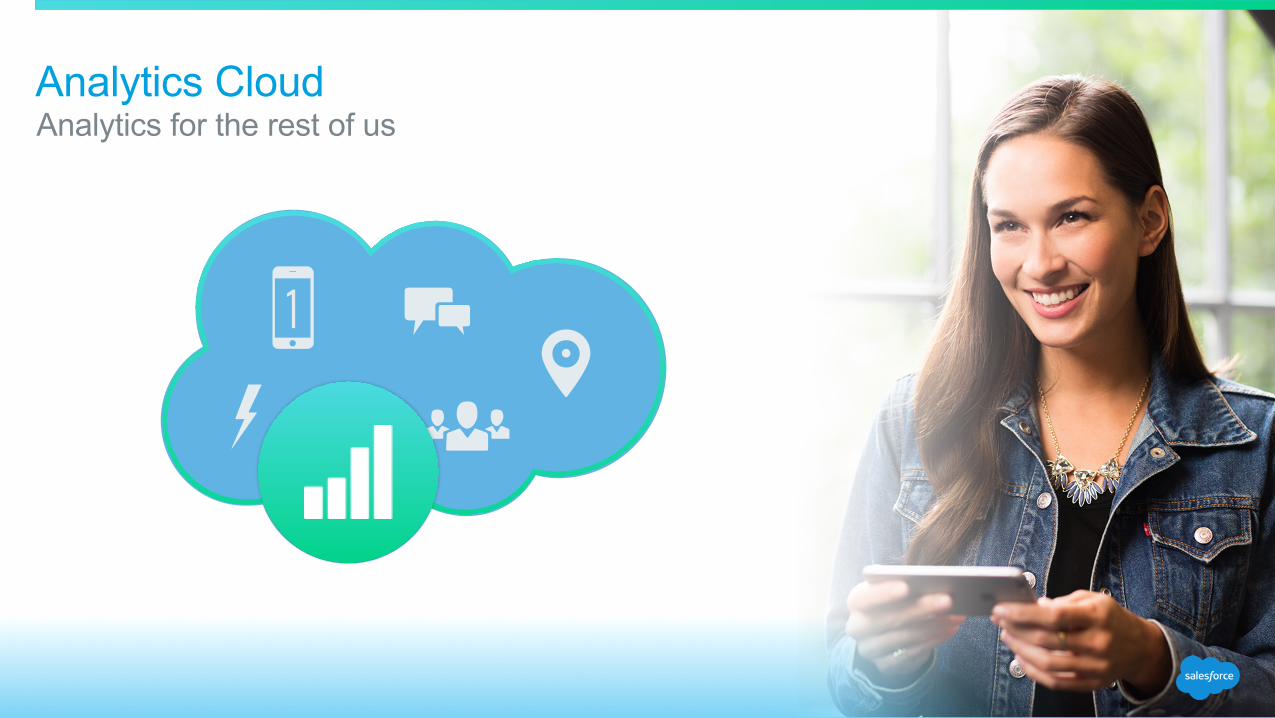
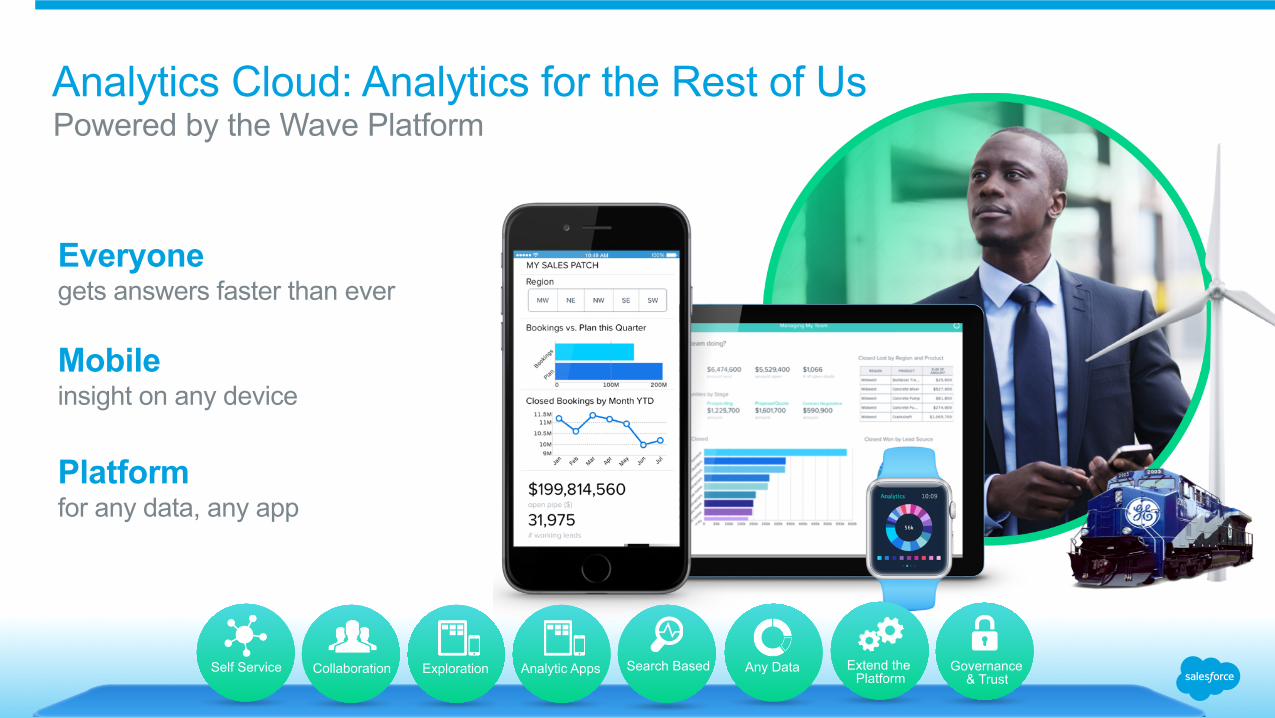
Analytics for the rest of us Analytics Cloud
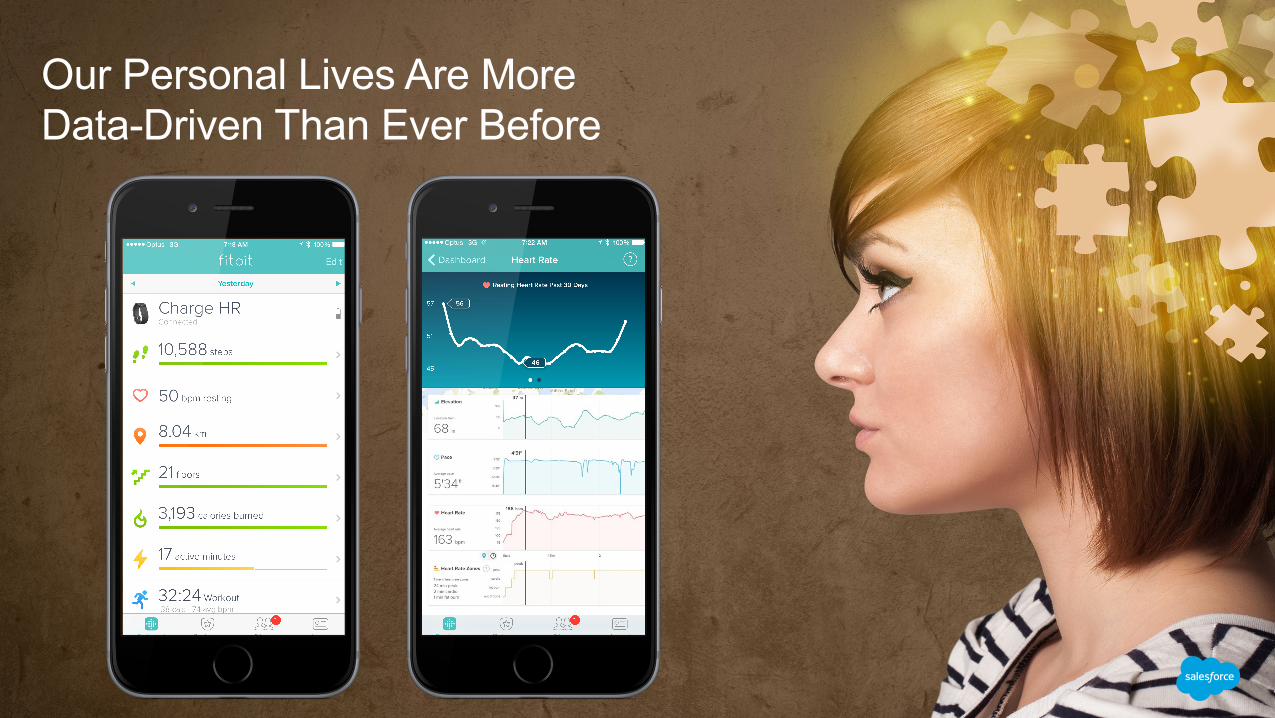
Our Personal Lives Are More Data-Driven Than Ever Before
Your Customers
Customer Data Lives Across a Variety of Systems
Apps
Service Sales
Communities
Marketing
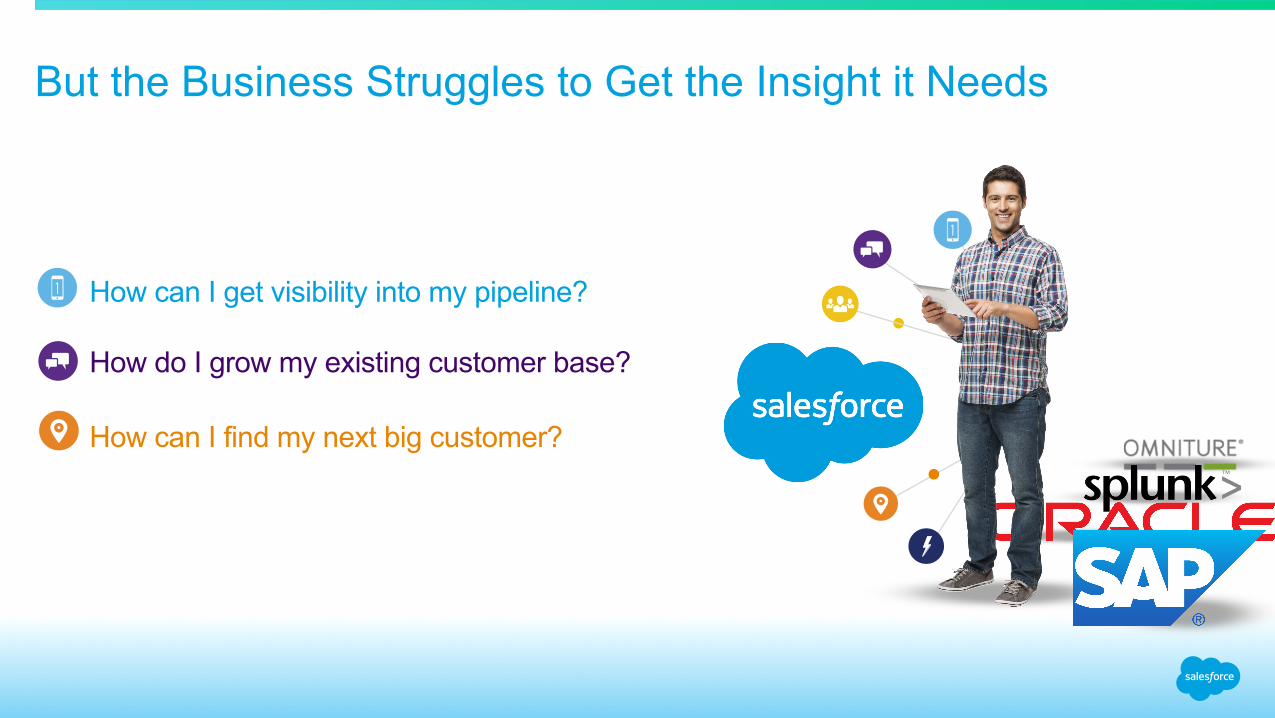
But the Business Struggles to Get the Insight it Needs
How can I get visibility into my pipeline?
How do I grow my existing customer base?
How can I find my next big customer?
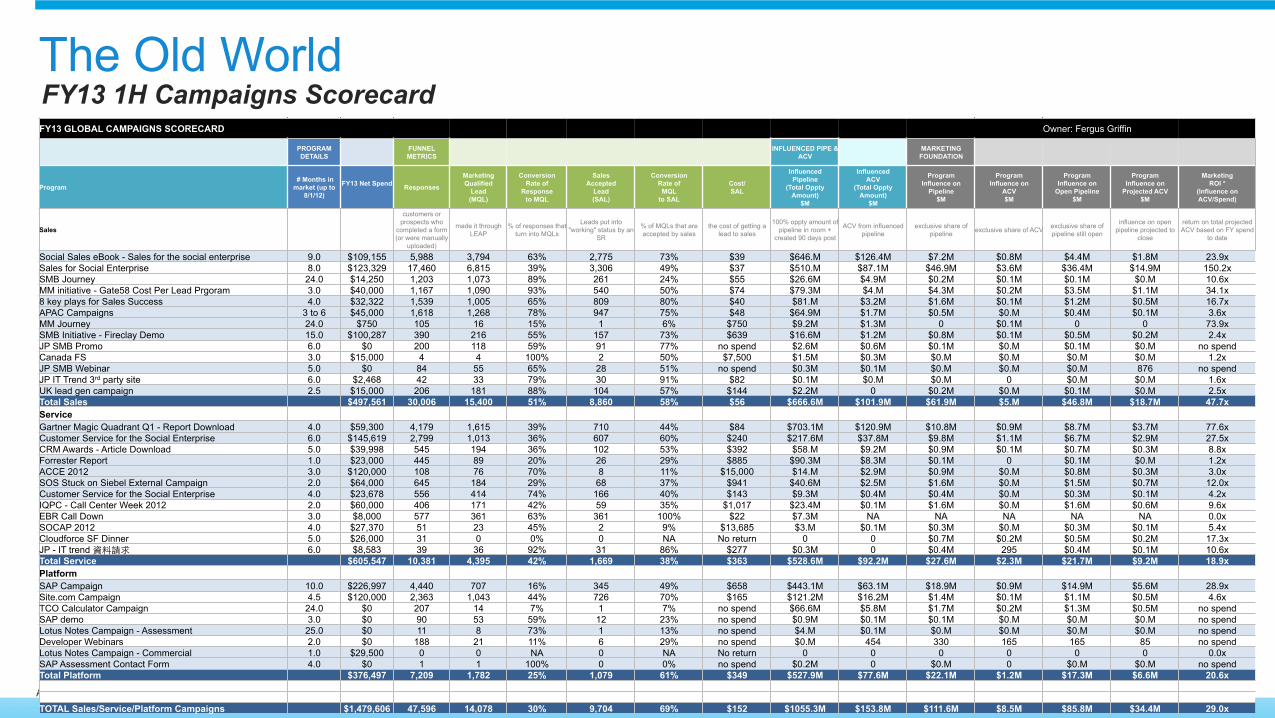
Legacy BI Was Not Designed for You and Me
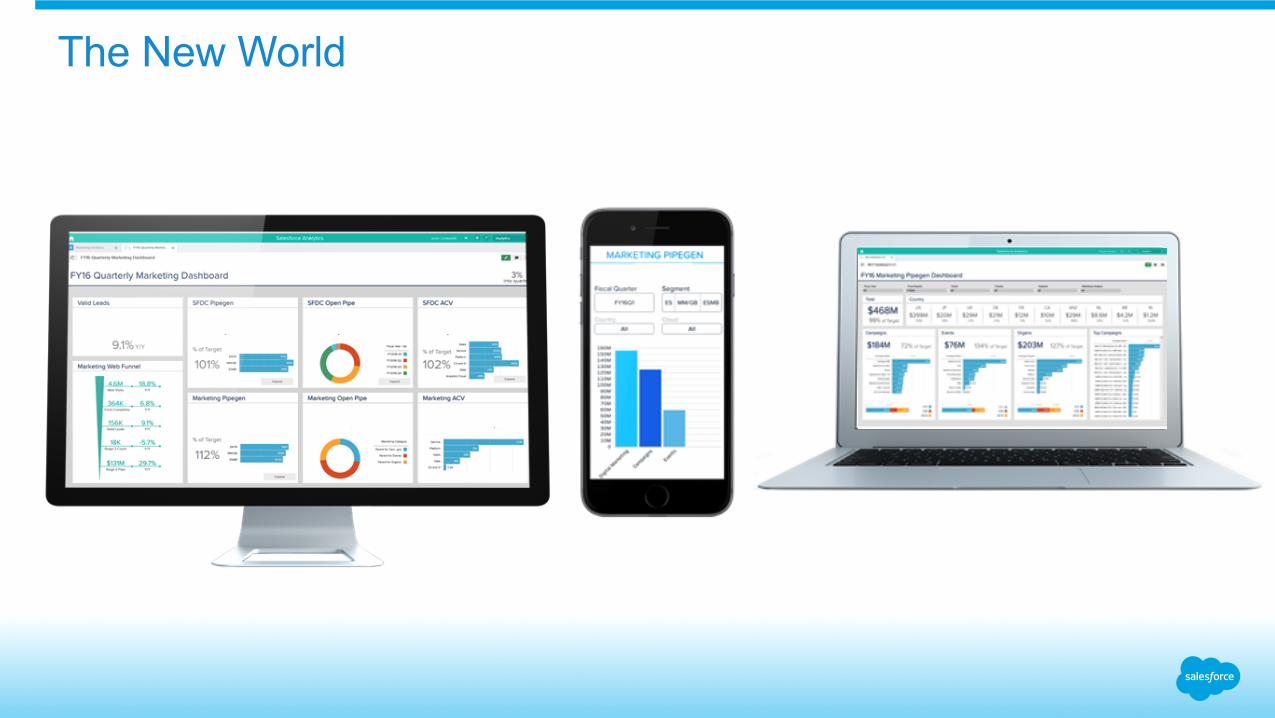
Powered by the Wave Platform Analytics Cloud: Analytics for the Rest of Us
Mobile insight on any device
Everyone gets answers faster than ever
Platform for any data, any app
Extend the Platform
Self Service Collaboration Exploration Analytic Apps Search Based Any Data Governance & Trust
Judy Ko SVP Marketing, Informatica @judyiko
We make great data ready to use.
Your Customers
Customer Data Lives Across a Variety of Systems
Apps
Service Sales
Communities
Marketing
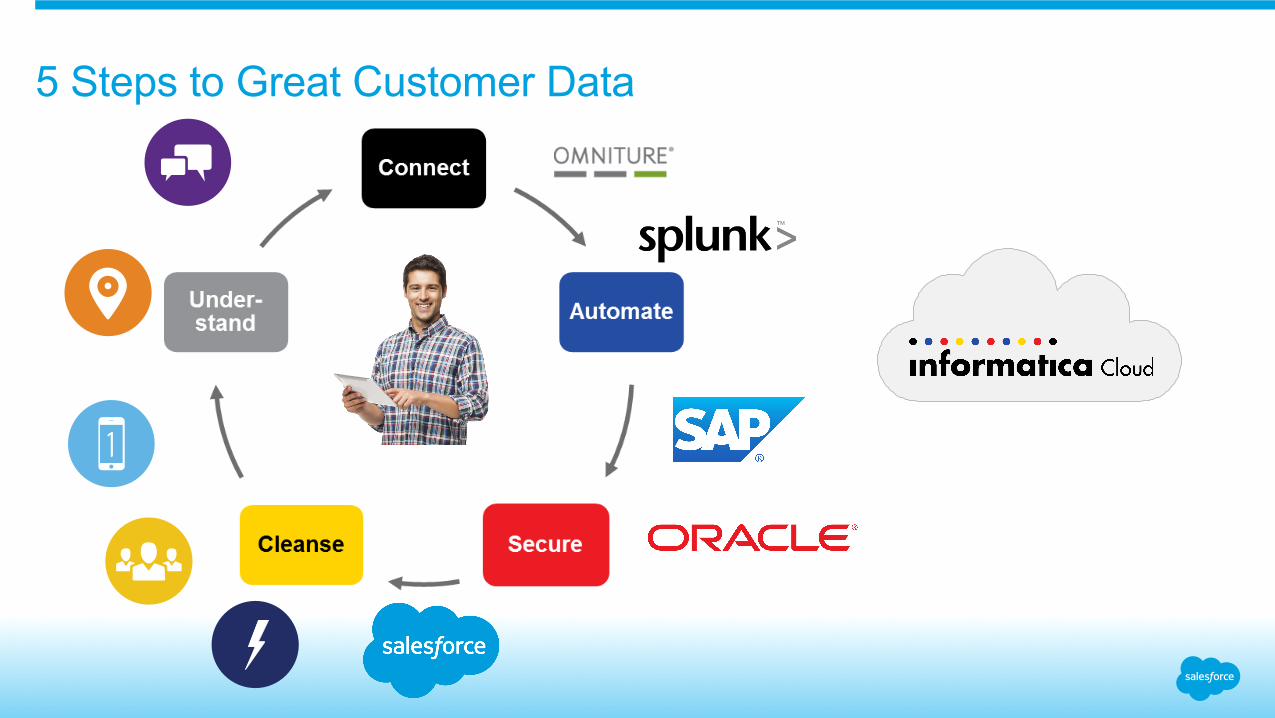
5 Steps to Great Customer Data
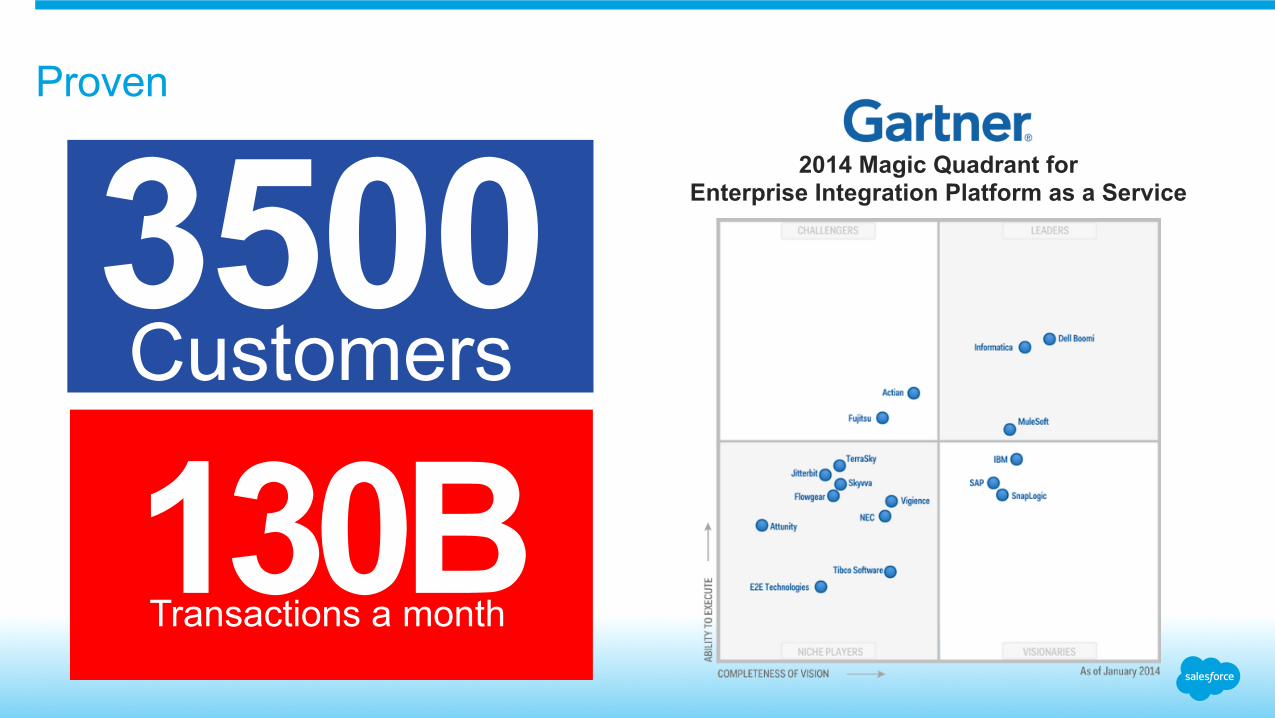
Proven
3500 Customers
130B Transactions a month
2014 Magic Quadrant for Enterprise Integration Platform as a Service
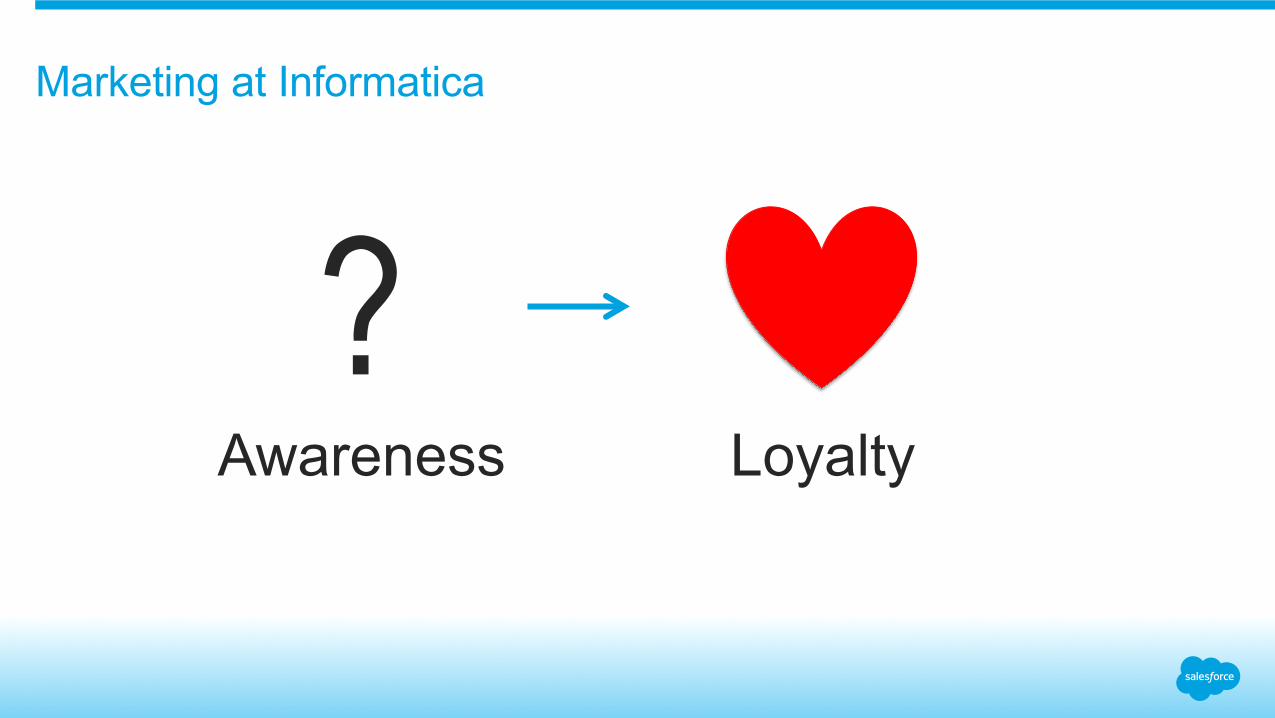
Marketing at Informatica
Loyalty
? Awareness
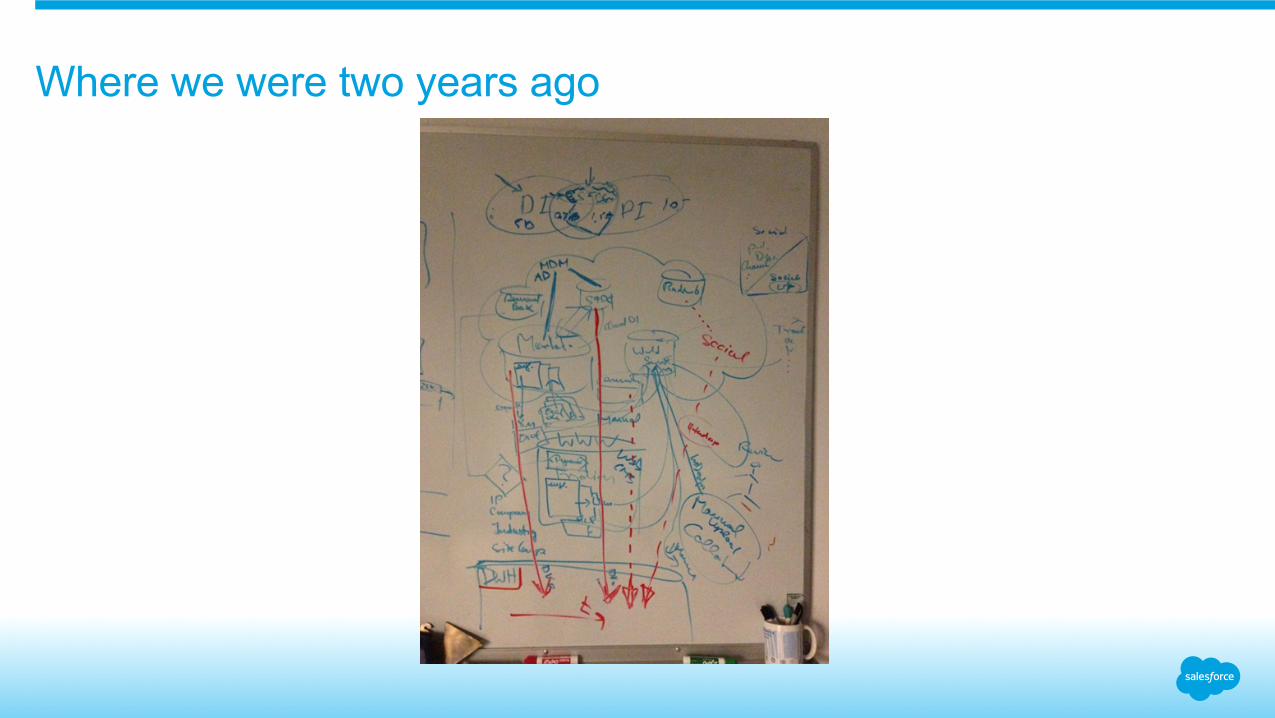
Where we were two years ago
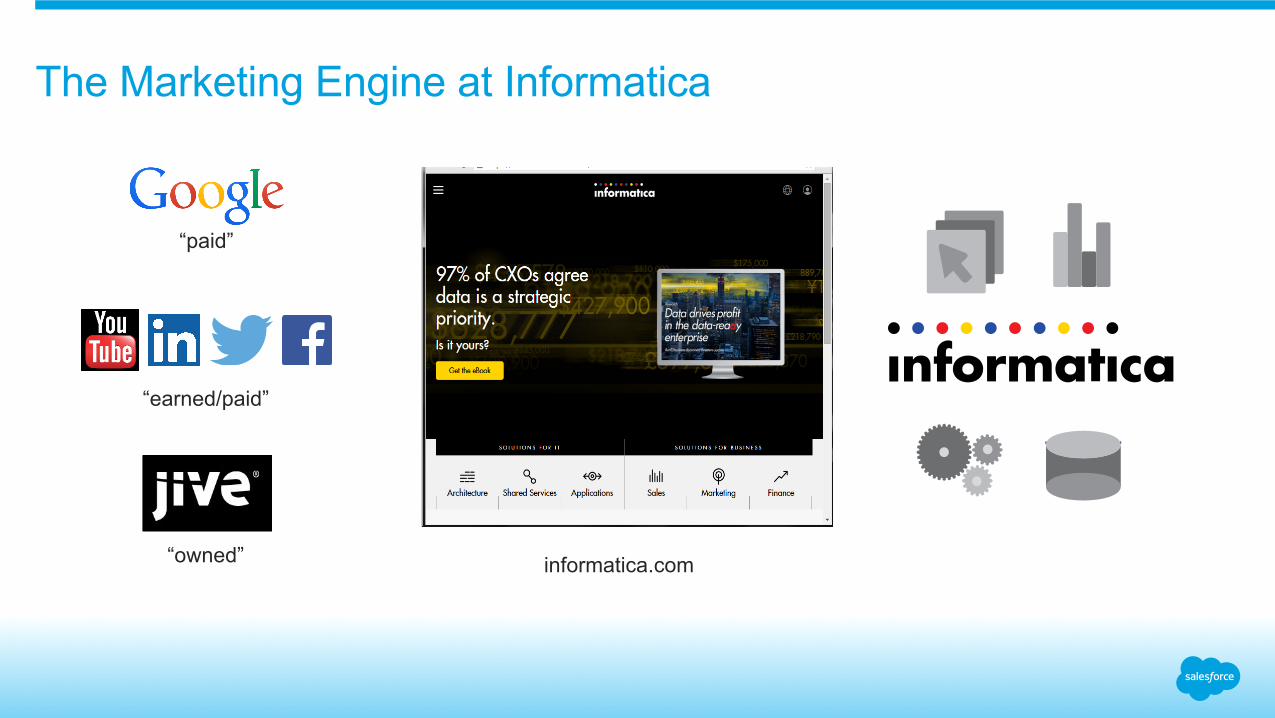
The Marketing Engine at Informatica
informatica.com
“paid”
“earned/paid”
“owned”
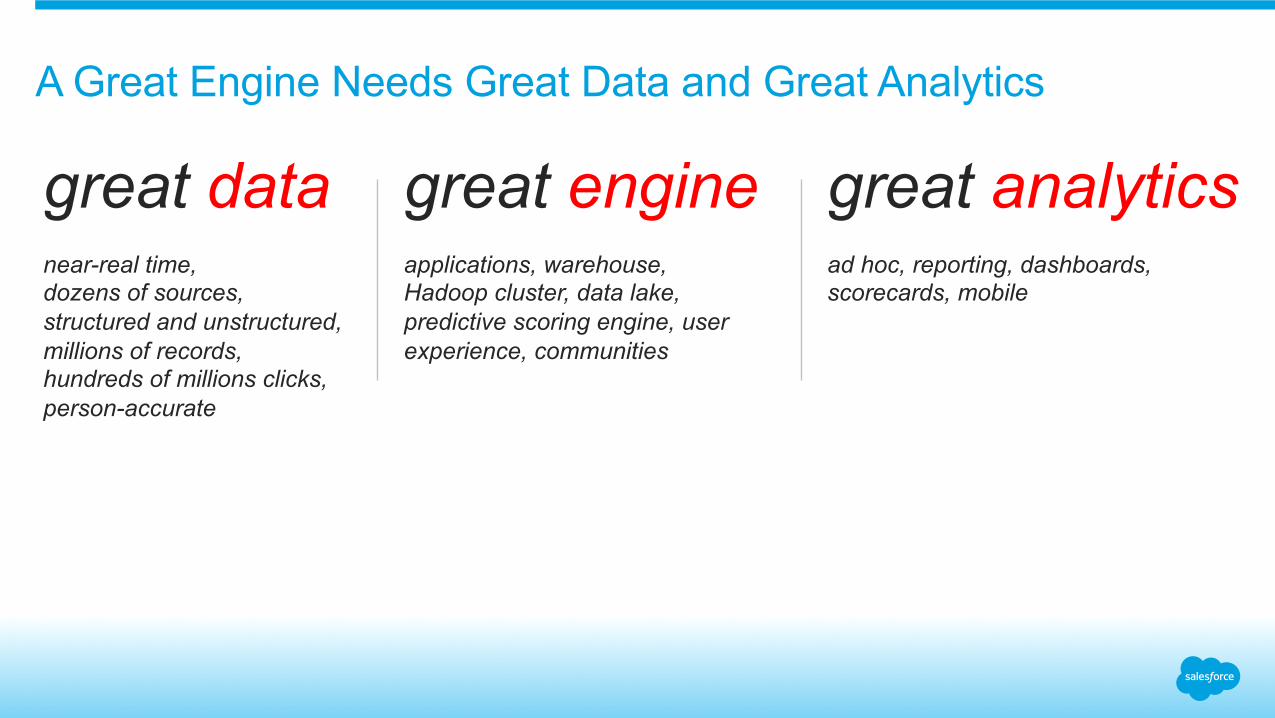
A Great Engine Needs Great Data and Great Analytics
great data near-real time, dozens of sources, structured and unstructured, millions of records, hundreds of millions clicks, person-accurate
great analytics ad hoc, reporting, dashboards, scorecards, mobile
great engine applications, warehouse, Hadoop cluster, data lake, predictive scoring engine, user experience, communities
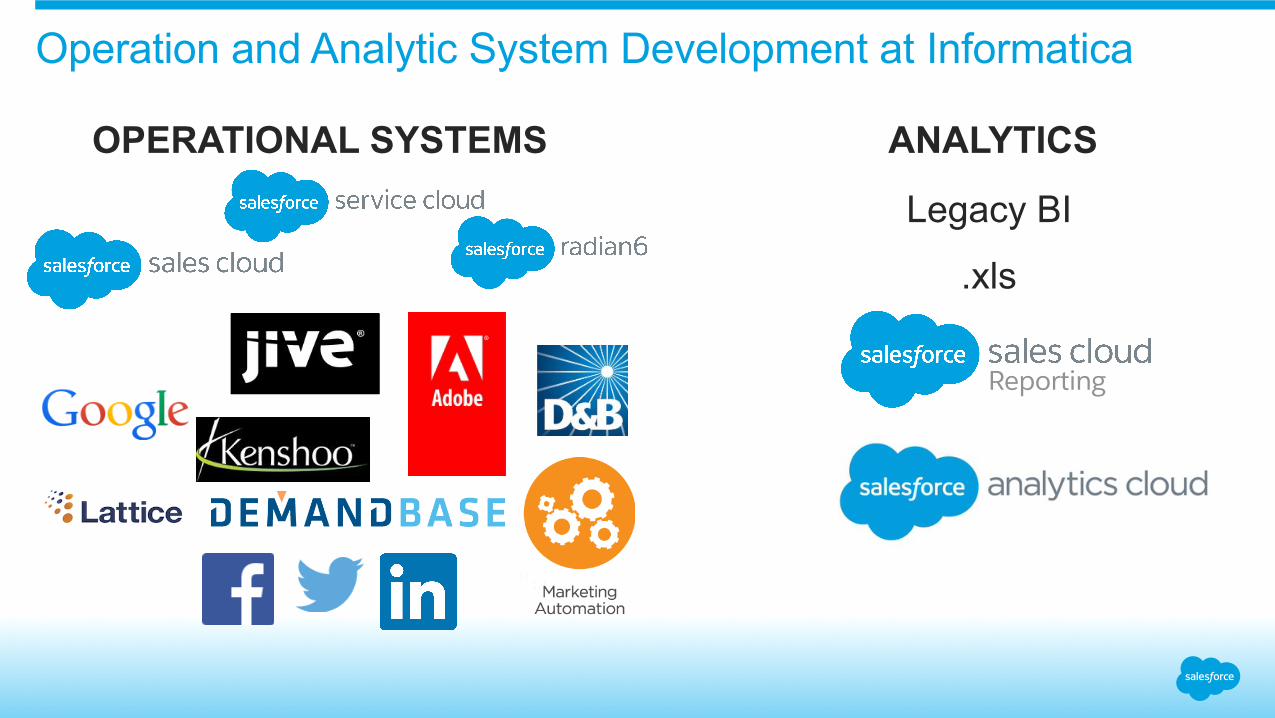
Operation and Analytic System Development at Informatica