1 Get on board: Assessing an all-door boarding pilot project in Montreal, Canada Ahmed El-Geneidy, Dea van Lierop, Emily Grisé, Geneviève Boisjoly, Derrick Swallow, Lesley Fordham & Thomas Herrmann McGill University: School of Urban Planning Suite 400, 815 Sherbrooke St. W. Montréal, Québec, H3A 2K6 Canada Tel.: 514-398-4058 Fax: 514-398-8376 E-mail: [email protected]For Citation Please use: El-Geneidy, A., van Lierop, D., Grisé, E., Boisjoly, G., Swallow, D., Fordham, L., & Herrmann, T. (2017). Get on board: Assessing an all-door boarding pilot project in Montreal, Canada. Transportation Research Part A: Policy and Practice, 99, 114–124.
Transcript
1
Get on board: Assessing an all-door boarding pilot project in Montreal, Canada
Ahmed El-Geneidy, Dea van Lierop, Emily Grisé, Geneviève Boisjoly, Derrick Swallow, Lesley Fordham & Thomas Herrmann
McGill University: School of Urban Planning Suite 400, 815 Sherbrooke St. W. Montréal, Québec, H3A 2K6 Canada Tel.: 514-398-4058 Fax: 514-398-8376 E-mail: [email protected]
For Citation Please use: El-Geneidy, A., van Lierop, D., Grisé, E., Boisjoly, G., Swallow, D., Fordham, L., & Herrmann, T. (2017). Get on board: Assessing an all-door boarding pilot project in Montreal, Canada. Transportation Research Part A: Policy and Practice, 99, 114–124.
2
ABSTRACT
Transit agencies often focus on developing strategies aimed at reducing travel time to increase passengers’ satisfaction. One strategy used by transit agencies to reduce passenger activity time, and accordingly travel times, is the implementation of all-door boarding – a service allowing transit users to board and alight vehicles through any door. The present study uses data collected in Montreal, Canada, to assess the impacts of an all-door boarding pilot project from two points of view: (1) operationally through passenger activity time, and (2) by assessing passenger satisfaction. Operationally, the results reveal that when compared to a similar bus route that does not allow all-door boarding, the all-door boarding strategy shows a savings of five percent in passenger activity time at regular stops, while time savings at high passenger activity stops such as metro stations experienced time savings of around 19 percent. Thus, savings are maximized at stops with high passenger demand. Additionally, with regard to user perceptions, the results reveal that passengers who use the all-door boarding service are more satisfied with bus service, particularly with on time performance. Overall, the results of this study demonstrate that all-door boarding is an effective strategy to improve the quality of service due to the associated time savings and increased customer satisfaction. Finally, the study offers important recommendations to transit planners and policy makers to effectively implement and maximize the benefits of an all-door boarding policy based on statistical analysis and on-site observations.
3
INTRODUCTION
Transit agencies often focus on developing strategies aimed at increasing ridership by attracting
new passengers and retaining existing ones. One way to increase overall ridership is by focusing
on how to keep existing passengers satisfied with the system. Accordingly, because it has been
well-documented that overall travel time and speed influence transit users’ level of satisfaction
with the overall service (dell’Olio, Ibeas, & Cecín, 2011; Mouwen, 2015), transit agencies are
constantly looking to implement strategies that improve transit users’ actual and perceived
satisfaction with overall travel time and speed. One such strategy is to decrease transit users’
boarding and alighting times.
In most countries, where the bus driver is the only transit employee on-board, passengers
board at the front of the vehicle, through a single door, so they can interact with and purchase
tickets from the driver. Today, one-door boarding continues to be popular throughout the world,
even though researchers have found that it is not the most efficient way for users to board vehicles
as it is associated with slow overall boarding times (Jara-Diaz & Tirachini, 2013; C. Stewart & El-
Geneidy, 2014; Tirachini, Camus, & Cruz, 2016). In contrast, all-door boarding is a strategy that
allows passengers to board through any of the bus doors. This strategy allows for multiple flows
of passengers boarding at the same time, leading to an expedited boarding process that can decrease
overall travel times and improve route efficiency (Larwin & Koprowski, 2012). Furthermore,
although the reductions are in passenger activity per door, they can be reflected by reductions in
overall running time. This can be economically beneficial for transit agencies, particularly if the
time savings are sufficient enough to reduce the number of buses serving a route while providing
the same frequency of service (C. Stewart & El-Geneidy, 2014).
Reducing bus running time is therefore beneficial for both improving the efficiency of the
bus system (Levine & Torng, 1994), and for increasing overall user satisfaction. However, most
research has focused solely on analyzing improvements to the efficiency of routes, and few studies
have assessed riders’ perceptions and levels of satisfaction with a particular bus operation
improvement strategy (Diab & El-Geneidy, 2012a). With this in mind, the purpose of this paper is
to assess the impacts of an all-door boarding pilot project in Montreal, Canada from two points of
view: (1) operationally through passenger activity time, and (2) by assessing passenger
satisfaction. We combine operations and customer satisfaction data with the intention of
understanding how operational strategies affect customers’ perceptions of service. Furthermore,
4
this study can be helpful to researchers and transit agencies wishing to better understand the
impacts of all-door boarding policies, and provides insights on implementation strategies of such
policies.
This study begins with a review of the relevant literature of all-door boarding and customer
satisfaction. Next, in the first phase of the analysis, we use manually collected operations data to
estimate time savings from all-door boarding. In the second phase, we use data derived from
customer satisfaction questionnaires to evaluate bus passenger satisfaction with the new service as
well as their perceptions pertaining to changes in travel times. The next phase of the analysis
concentrates on observations made by the authors during the data collection process. Finally, based
on the field observations as well as the results of the statistical analyses, the paper concludes with
a discussion of strategies which can be implemented to achieve the maximum benefits from an all-
door boarding service.
LITERATURE REVIEW
All-Door Boarding
Dwell time is a major factor affecting the running time of a bus and is defined as the time spent at
a bus stop to service passengers – from door open to door close (Dueker, Kimpel, Strathman, &
Callas, 2004; El-Geneidy & Vijayakumar, 2011). According to Levinson (1983), dwell time
generally accounts for 9 to 26 percent of the total running time of a bus route. Accordingly,
significant running time savings can be achieved through a reduction in dwell times (Abkowitz &
Engelstein, 1982). Passenger activity time, the time consumed by all passengers to board and alight
from a bus, is the main contributor to dwell time. While passenger activity times are shorter than
overall dwell times, they are highly correlated (Cundill & Watts, 1973; Levine & Torng, 1994;
Vandebona & Richardson, 1985). However, when a bus arrives at a time point early, dwell time,
door open to door close, is usually considerably longer than passenger activity time. This is
because the driver will wait at the bus stop with the door open after passenger activity has ended
and before it is time to depart from the stop. Such additional time is known as excess dwell. Excess
dwell time can lead to a bias in dwell time models showing higher boarding and alighting times
per passenger. Accordingly, to carefully study the impacts of any improvement strategy, a detailed
analysis of passenger activity time is needed to avoid any bias imposed from excess dwell time.
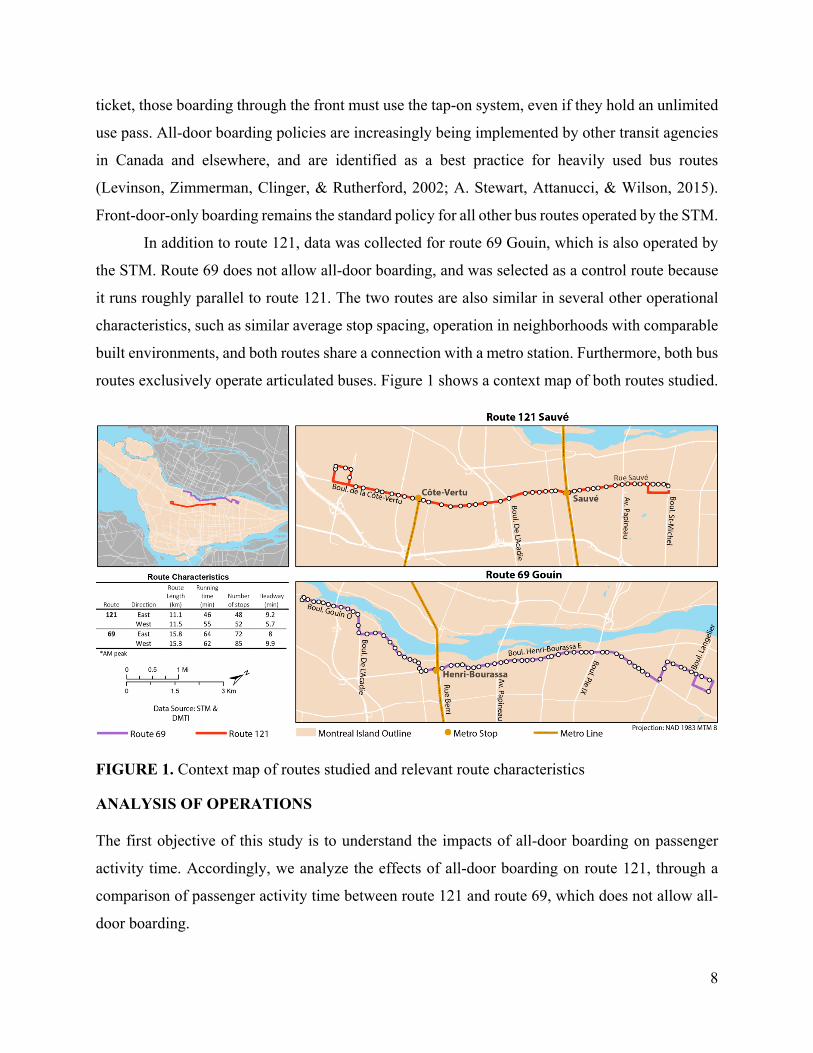
5
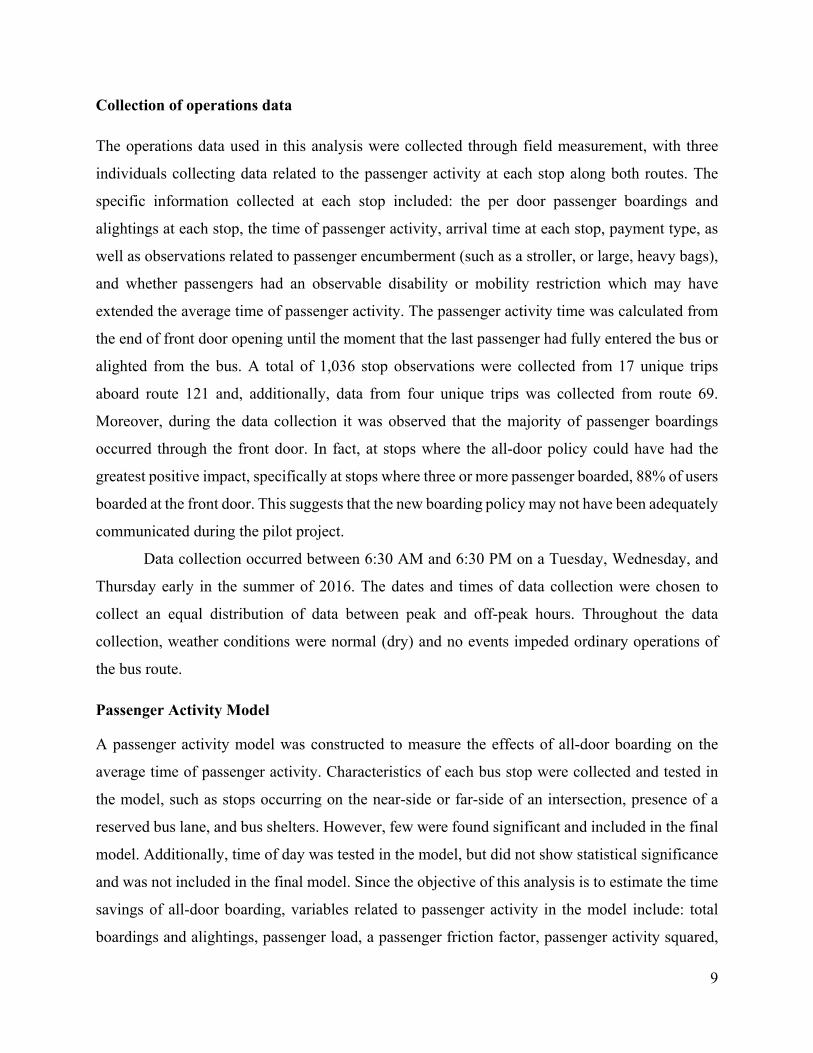
One way to reduce dwell times (and associated passenger activity times) is by
implementing an all-door boarding strategy as it leads to shorter boarding times at bus stops
(Larwin & Koprowski, 2012). Three main aspects explain the shorter passenger activity time that
results from multiple-door boarding. The first is that multiple streams of passengers can board the
bus at the same time, thus reducing the number of passengers boarding at the front door. The
second is that all-door boarding results in a more balanced distribution of passengers in the bus
and accordingly, reduces the crowding at each door. Passenger friction, which is contingent on the
crowding at each door, has been shown to increase passenger activity time (Sun, Tirachini,
Axhausen, Erath, & Lee, 2014). When crowding is reduced at the doors, especially the front door,
boarding time per passenger is significantly reduced, by up to 0.5 seconds (Larwin & Koprowski,
2012). Another study, based on real-scale experiments, also found a negative, linear relationship
between crowding and boarding time (Fernandez, 2011). Interestingly, crowding was found to
exponentially affect alighting time. Finally, in some cases, all-door boarding provides passengers
waiting at a bus stop with a closer boarding option than the front door, which reduces the boarding
time (Jaiswal, Bunker, & Ferreira, 2010). Overall, multiple-door boarding thus reduces the amount
of time spent at a bus stop, as a function of passenger activity. However, the relationship between
stop time and passenger activity is non-linear, indicating that each additional passenger requires
less time to board than the passenger ahead, and a passenger activity squared term accurately
captures this relationship (Dueker et al., 2004; El-Geneidy & Vijayakumar, 2011; Rajbhandari,
Chien, & Daniel, 2003).
With regard to time savings, all-door boarding strategies implemented on articulated buses
with three doors can result in running time savings of between 4.6 and 13.3 percent (Larwin &
Koprowski, 2012). In the case of Montreal, C. Stewart and El-Geneidy (2014) estimated time
savings of up to 15.9 percent during morning peak hours along some routes that use articulated
buses. Alternatively, in the case of two-door boarding systems, running time savings of 1.8 to 9.6
percent are estimated (Larwin & Koprowski, 2012).
A concern related to the implementation of all-door boarding systems is fare evasion. If
passengers boarding at the back doors are not validating their ticket or pass, and if the bus includes
a validation machine, ticket validation is left to an honor system. Yet, several studies have found
that actual fare evasion rates are much lower than what is perceived (Larwin & Koprowski, 2012;
Lee, 2011). For example, Ottawa and San Francisco use all-door boarding systems and have
6
relatively low to average evasion rates at only 2.4 percent and 4.7 percent respectively. In
comparison, Bonfanti and Wagenknecht (2010) found an average of 4.2 percent reported fare
evasion in a large sample of 31 bus routes in 18 countries. Although it is highly improbable to
completely eliminate fare evasion on all-door boarding systems, evasion rates can be controlled
by hiring more fare inspectors or through the use of turnstiles.
Operations data
The emergence of intelligent transport system technologies has allowed in-depth research on bus
operations, including dwell time models (Berkow, El-Geneidy, Bertini, & Crout, 2009), which are
heavily used in the literature to evaluate different operational improvement strategies.
Determinants of dwell times have been found to include passenger activity (boardings and
alightings), passenger load, lift/ramp usage for disabled persons, the use of bicycle racks, delay,
time of day, and weather conditions (Abkowitz & Engelstein, 1982; Levinson, 1983; Rajbhandari
et al., 2003; Strathman et al., 2000). Most recent bus operations models use archived automatic-
vehicle-location (AVL) and automatic-passenger-counter (APC) systems data (El-Geneidy,
were not able to fully complete the survey, generally because a bus arrived before completing the
survey.
Respondents were asked to answer thirteen questions about their usage and experience
regarding route 121. With regard to satisfaction, respondents were asked to rate their experience
of using route 121 on a Likert-scale ranging from 1 (‘very unsatisfied’) to 5 (‘very satisfied’), for
three aspects of the service: (a) overall satisfaction; (b) on-time arrival; and (c) travel time.
Respondents were subsequently asked whether their level of satisfaction had changed since the
introduction of the all-door boarding policy for the same three aspects of service and were given
the following options: (a) decreased; (b) stayed the same; and (c) increased. Furthermore,
respondents were asked questions regarding the characteristics of their trip (e.g.: door used, trip
15
purpose, fare type), and their personal characteristics (e.g.: age, sex, car ownership). At the end of
the survey, respondents were also given an option to leave comments if interested.
A total of 642 surveys were administered, 192 of which were incomplete, leaving 450 fully
completed surveys. Additional surveys were omitted if the respondent indicated they were under
the age of 16 or if the respondent indicated that they did not use route 121 before the
implementation of the all-door boarding policy. In total, 53 surveys were omitted on this basis
leaving 397 surveys included in the analysis. This number exceeds the 380 surveys necessary for
a representative sample size, based on the daily passenger activity aboard the route with a
confidence interval of +/-5 at the 95% confidence level.
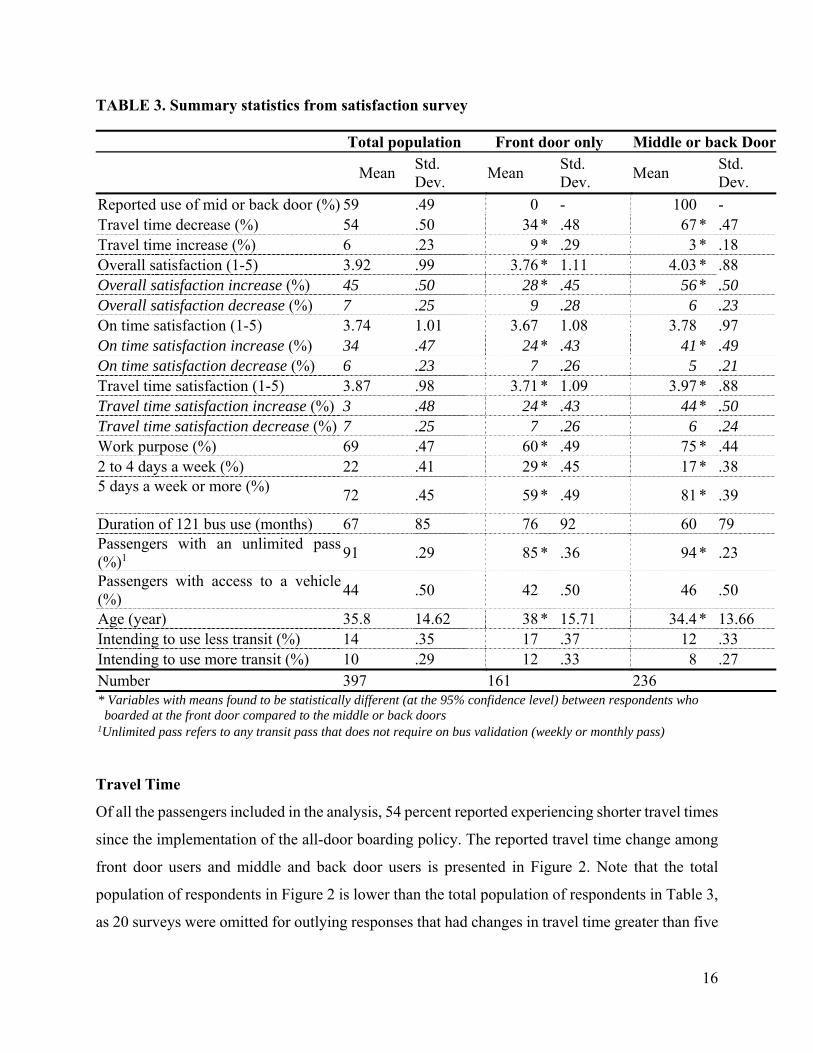
Customer satisfaction survey summary statistics
A summary of survey responses from the customer satisfaction survey is presented in Table 3,
where survey respondents are segmented by whether they boarded at the front door or either the
middle or back doors on their most recent trip. A series of t-tests were conducted to determine the
statistical significance of the observed differences between segmented groups. In total, 59 percent
reported boarding via the middle or back doors on their most recent trip. This group indicated
higher overall satisfaction on a five point scale with the current service (4.03) than front door users
(3.76). Additionally, passengers using the middle or back door were, on average, approximately
four years younger and were significantly more likely to use route 121 five days or more per week.
Considering that 81 percent of middle and back door users reported taking route 121 five or more
days per week, in contrast to 59 percent of front door users, this indicates the importance of
communicating the new service to irregular users. Although the STM implemented a campaign to
advertise the new service during the first month of implementation, similar campaigns need to be
conducted more frequently to ensure that all users are comfortable boarding through all doors.
Finally, 85 percent of front door users had an unlimited pass, which indicates that many front door
users were eligible for back-door boarding but either chose not to, or were not aware of the
opportunity.
16
TABLE 3. Summary statistics from satisfaction survey
Total population Front door only Middle or back Door
Mean Std. Dev.
Mean Std. Dev.
Mean Std. Dev.
Reported use of mid or back door (%) 59 .49 0 - 100 - Travel time decrease (%) 54 .50 34* .48 67* .47 Travel time increase (%) 6 .23 9* .29 3* .18 Overall satisfaction (1-5) 3.92 .99 3.76* 1.11 4.03* .88 Overall satisfaction increase (%) 45 .50 28* .45 56* .50 Overall satisfaction decrease (%) 7 .25 9 .28 6 .23 On time satisfaction (1-5) 3.74 1.01 3.67 1.08 3.78 .97 On time satisfaction increase (%) 34 .47 24* .43 41* .49 On time satisfaction decrease (%) 6 .23 7 .26 5 .21 Travel time satisfaction (1-5) 3.87 .98 3.71* 1.09 3.97* .88 Travel time satisfaction increase (%) 3 .48 24* .43 44* .50 Travel time satisfaction decrease (%) 7 .25 7 .26 6 .24 Work purpose (%) 69 .47 60* .49 75* .44 2 to 4 days a week (%) 22 .41 29* .45 17* .38 5 days a week or more (%)
72 .45
59* .49
81* .39
Duration of 121 bus use (months) 67 85 76 92 60 79 Passengers with an unlimited pass(%)1
91 .29
85* .36
94* .23
Passengers with access to a vehicle(%)
44 .50
42 .50
46 .50
Age (year) 35.8 14.62 38* 15.71 34.4* 13.66 Intending to use less transit (%) 14 .35 17 .37 12 .33 Intending to use more transit (%) 10 .29 12 .33 8 .27 Number 397 161 236 * Variables with means found to be statistically different (at the 95% confidence level) between respondents who boarded at the front door compared to the middle or back doors 1Unlimited pass refers to any transit pass that does not require on bus validation (weekly or monthly pass)
Travel Time
Of all the passengers included in the analysis, 54 percent reported experiencing shorter travel times
since the implementation of the all-door boarding policy. The reported travel time change among
front door users and middle and back door users is presented in Figure 2. Note that the total
population of respondents in Figure 2 is lower than the total population of respondents in Table 3,
as 20 surveys were omitted for outlying responses that had changes in travel time greater than five
17
minutes. The majority (67%) of middle and back door users reported a decrease in travel time of
two and a half minutes on average, and 34 percent of front door users reported an average time
savings of two minutes. This is an important finding as it shows that users are overestimating the
travel time savings compared to the numbers observed in the analysis of the operations data.
FIGURE 2. Perceived travel time changes among different door users
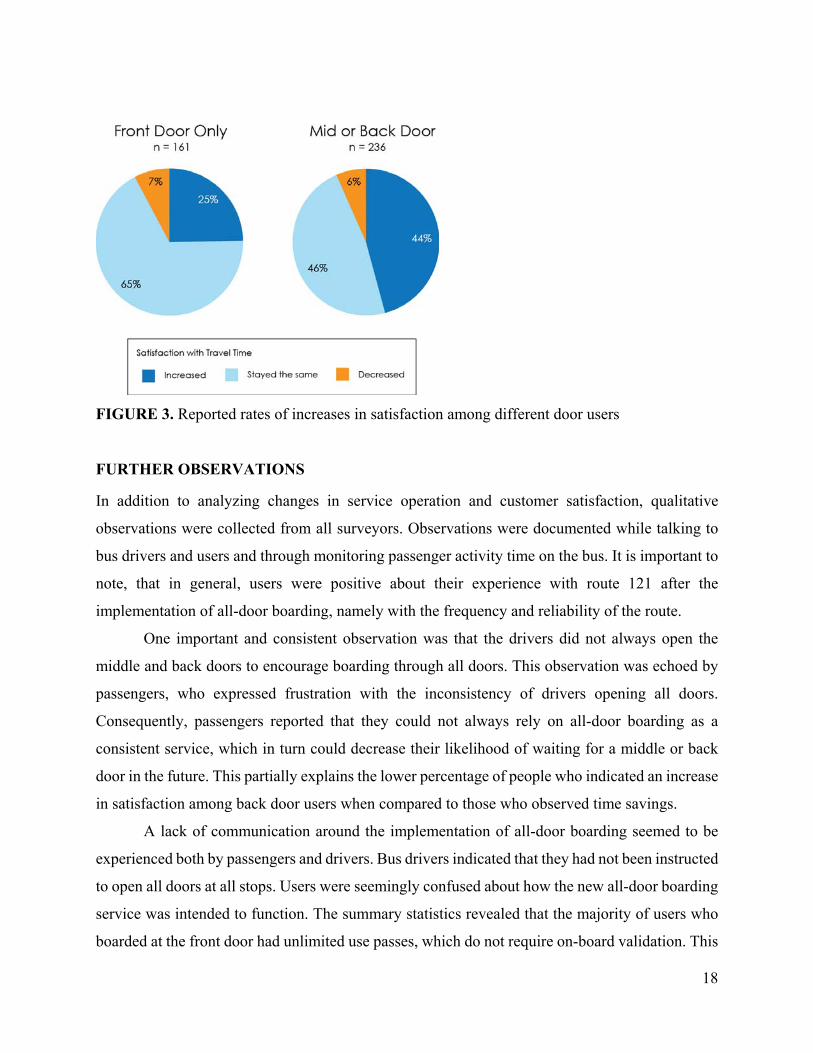
To further illustrate changes in satisfaction, Figure 3 demonstrates the percentage of
respondents who reported increases in travel time satisfaction among different door users. This
finding suggests that middle or back door users are more likely to perceive benefits. However, the
perceived decreases in travel time among middle or back door users did not always result in
increases in satisfaction, as a higher percentage of middle or back door users reported decreases in
travel time (67%) compared to increases in travel time satisfaction (44%). This will be elaborated
on in the discussion of this manuscript.
Overall, given that middle and back door users reported higher levels of satisfaction with
travel time, this finding suggests that these users are more receptive to improvements in service,
which means that small changes in operations can have a large impact on customers who benefit
from the change.
18
FIGURE 3. Reported rates of increases in satisfaction among different door users
FURTHER OBSERVATIONS
In addition to analyzing changes in service operation and customer satisfaction, qualitative
observations were collected from all surveyors. Observations were documented while talking to
bus drivers and users and through monitoring passenger activity time on the bus. It is important to
note, that in general, users were positive about their experience with route 121 after the
implementation of all-door boarding, namely with the frequency and reliability of the route.
One important and consistent observation was that the drivers did not always open the
middle and back doors to encourage boarding through all doors. This observation was echoed by
passengers, who expressed frustration with the inconsistency of drivers opening all doors.
Consequently, passengers reported that they could not always rely on all-door boarding as a
consistent service, which in turn could decrease their likelihood of waiting for a middle or back
door in the future. This partially explains the lower percentage of people who indicated an increase
in satisfaction among back door users when compared to those who observed time savings.
A lack of communication around the implementation of all-door boarding seemed to be
experienced both by passengers and drivers. Bus drivers indicated that they had not been instructed
to open all doors at all stops. Users were seemingly confused about how the new all-door boarding
service was intended to function. The summary statistics revealed that the majority of users who
boarded at the front door had unlimited use passes, which do not require on-board validation. This
19
means that the reduced boarding times that are possible when users activate payment prior to
boarding were not being achieved (Jara-Diaz & Tirachini, 2013).
In addition, several passengers reported that they believed that those using the middle and
back doors were boarding the bus without paying, causing frustration among users who felt that
these people were acting unfairly. Furthermore, during the observation period there were no
representatives of the transit agency verifying fares or encouraging passengers to board through
the rear doors. However, previous studies found that fare evasion is usually lower than it is
perceived to be (Larwin & Koprowski, 2012; Lee, 2011). Therefore, fare evasion is not expected
to be problematic for the implementation of all-door boarding on route 121. These findings suggest
that it is important for the transit agency, STM in this case, to continue communicating the all-
door boarding service to passengers beyond the first month of implementation as our findings
reveal that not all users were aware of the service.
Another observation made by surveyors is that, at stops with high user activity, users
organized themselves into separate lines for each door while waiting for the 121. This worked
especially well in locations where there was a large platform for passengers to wait and lines had
been painted on the ground to indicate where the doors would be when the bus arrived.
A final observation was the amount of excess dwell time, especially at bus stops serving
metro stations. Buses would often stand at the station for several minutes after all the passengers
had boarded with the door open. This excess dwell caused any time gains from quicker boarding
to be lost through long dwell times. Accordingly, the 121 is not currently reaching the time savings
predicted by C. Stewart and El-Geneidy (2014) with this excess dwell time. This finding suggests
that additional modifications to the schedules are needed as the drivers were operating these buses
ahead of schedule.
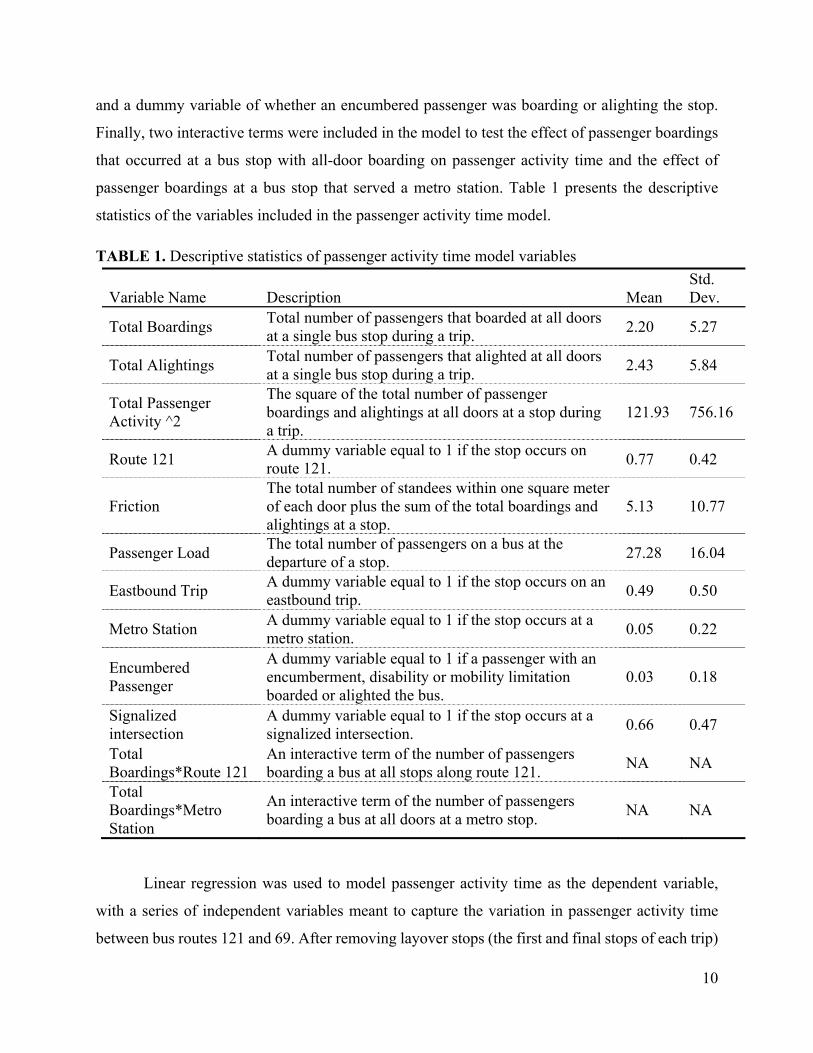
DISCUSSION & CONCLUSION
Using both quantitative and qualitative measures, this study has revealed the operational
and customer satisfaction benefits of implementing an all-door boarding system. The results of the
passenger activity time model revealed moderate time savings associated with the service (1.2%
time savings for the overall route cycle time). These findings are lower than previous research
which forecasted a time savings from the implementation of all-door boarding along route 121 (C.
Stewart & El-Geneidy, 2014). These authors predicted time savings of 3.3 percent of the route
20
cycle time based on an all-door boarding system implemented at major stops along the route. This
difference is likely because the estimated time savings predicted by C. Stewart and El-Geneidy
(2014) were based on the assumption that passengers would board equally between the three doors.
However, our operational data showed that the average boarding rate for the front, middle and
back door was 88 percent, 6.4 percent and 5.6 percent respectively, when considering stops where
three or more passengers boarded, and multiple doors could have been used. The lower than
anticipated time savings observed in our study is therefore likely because the majority of boardings
occurred through the front-door. If boardings were distributed equally, STM could experience
higher time savings. Furthermore, passengers should be encouraged to alight the bus at the back
doors for a smoother flow of passenger activity and to make space for passengers who need to
board through the front doors in order to validate tickets. Our study therefore highlights the
importance of effective communication strategies to achieve the maximum potential time savings
of an all-door boarding policy.
Another reason that the time savings were lower than predicted is because, while the model
results indicate a modest time savings at regular passenger activity stops (5%), significantly higher
time savings at metro stations (19%) were observed. A sensitivity analysis was used to estimate
the time savings from bus stops with varying levels of passenger demand using the passenger
activity time model. The findings show that for a similar bus route with an average passenger
boarding of five riders per stop along the route, time savings of 2.7 percent of the route cycle time
are expected. Furthermore, time savings of 5 percent of the route cycle time are expected for bus
routes serving eight passengers on average at each stop. Therefore, while we do see time savings
attributable to all-door boarding, substantial time savings can be expected on bus routes with
consistently high passenger activity along the entire route. Accordingly, public transit agencies
should be more strategic when selecting appropriate bus routes for the implementation of an all-
door boarding system in order to benefit from savings in operating costs. Routes similar to route
121, but with an average of 3 passengers per regular stop, are expected to show time savings in the
range of 1.5 to 3 percent.
While the operational benefits associated with the implementation of the all-door boarding
service were modest, this study found that users’ perceptions of the service were positive, with
many passengers stating that their overall travel time decreased and that their satisfaction
increased. Satisfaction for middle and back door users was found to be higher than front door users,
21
demonstrating that they were receptive to the service improvements. The increases in satisfaction
are positive, and demonstrate that a small operational change can have an important impact on
increasing customer satisfaction. This is in line with previous research which has found that users
who have a positive image of public transport tend to be more satisfied (Minser & Webb, 2010)
While the implementation of the all-door boarding service had a positive effect on both
operations and customer satisfaction, the qualitative observations made on the street, on the bus
and by talking to drivers and users indicated that there was a lack of effective communication
during the implementation of all-door boarding for the 121 bus route. This resulted in a discrepancy
between what users expected and what was provided, and revealed the fact that there was an
unawareness of how the all-door boarding service is intended to function. Furthermore, the time
gained through line formation and more efficient boarding was lost as a result of excess dwell
times, meaning that the 121 is not currently maximizing the potential of all-door boarding.
Schedule readjustments are thus needed to fully maximize the benefits of implementing the all-
door boarding service, and boarding times and dwell times could be decreased further by allowing
all passengers with activated tickets to board through any of the doors. Additionally, greater
communication to customers of the all-door boarding system and more encouragement for drivers
to open all doors and for passengers to use all doors while boarding will likely improve the
effectiveness of the service change. Overall, the results of this study have demonstrated that all-
door boarding is an effective strategy to improve the quality of service due to the associated time
savings and increased customer satisfaction. These findings are generalizable and applicable to
different boarding and alighting payment schemes, including tap-on and tap-off systems as well as
off-board fare payment systems. Furthermore, as this was a pilot project, it is expected that
introducing all-door boarding along successive bus routes will increase customer familiarity with
the service, which in turn will positively influence the operational time savings and overall
satisfaction of bus users.
ACKNOWLEGEMENTS
We would like to acknowledge the financial support received from the Social Sciences and
Humanities Research Council (SSHRC) and the Natural Sciences and Engineering Research
22
Council of Canada (NSERC). We would also like to thank the surveyors who helped collect the
data, as well as all of the users of route 121 Sauvé who took the time to participate in the study.
Lastly, we would like to thank the anonymous reviewers for their invaluable input on the paper.
REFERENCES
Abkowitz, M., & Engelstein, I. (1982). Factors affecting running time on transit routes. Transportation Research, 17(2), 6.
Berkow, M., El-Geneidy, A., Bertini, R., & Crout, D. (2009). Beyond generating transit performance measures: Visualizations and statistical analysis with historical data. Transportation Research Record(2111), 158-168.
Bonfanti, G., & Wagenknecht, T. (2010). Human factors reduce aggression and fare evasion. Public Transport International, 59(1).
Cundill, M., & Watts, P. (1973). Bus boarding and alighting times: Transport and Road Research Laboratory. dell’Olio, L., Ibeas, A., & Cecín, P. (2011). The quality of service desired by public transport users. Transport Policy,
18(1), 217-227. Diab, E., & El-Geneidy, A. (2012a). Understanding the impacts of a combination of service improvement strategies
on bus running time and passenger’s perception. Transportation Research Part A: Policy and Practice, 46(3), 614-625.
Diab, E., & El-Geneidy, A. (2012b). Understanding the impacts of a combination of service improvement strategies on bus running time and passengers' perceptions. Transportation Research Part A: Policy and Practice, 46(3), 614-625.
Diab, E., & El-Geneidy, A. (2014). Transitory optimism: Changes in passenger perception following bus service improvement over time. Transportation Research Record, 2415, 97-106.
Diab, E., & El-Geneidy, A. (2015). The far side story: Measuring the benefits of bus stop location on transit performance. Transportation Research Record, 2538, 1-10.
Dueker, K., Kimpel, T., Strathman, J., & Callas, S. (2004). Determinants of bus dwell time. Journal of Public Transportation, 7(1), 2.
El-Geneidy, A., Strathman, J., Kimpel, T., & Crout, D. (2006). The effects of bus stop consolidation on passenger activity and transit operations. Transportation Research Record, 1971, 32-41.
El-Geneidy, A., & Vijayakumar, N. (2011). The effects of articulated buses on dwell and running times. Journal of Public Transportation, 14(3), 4.
Fernandez, R. (2011). Experimental study of bus boarding and alighting times. Paper presented at the European Transport Conference, Glasgow.
Gibson, J., Munizaga, M., Schneider, C., & Tirachini, A. (2015). Estimating the bus user time benefits of implementing a median busway: Methodology and case study. Transportation Research Part A: Policy and Practice.
Hess, D., Brown, J., & Shoup, D. (2004). Waiting for the bus. Journal of Public Transportation, 7(4), 67-84. Jaiswal, S., Bunker, J., & Ferreira, L. (2010). Influence of platform walking on BRT station bus dwell time estimation:
Australian analysis. Journal of Transportation Engineering, 136, 6. doi: 10.1061/ ASCE TE.1943-5436.0000174
Jara-Diaz, S., & Tirachini, A. (2013). Open all doors for boarding. Journal of Transport Economics and Policy, 47(1), 15.
Kimpel, T. (2001). Time point-level analysis of transit service reliability and passenger demand. (Doctor of Philosophy), Portland State University, Portland.
Kimpel, T., Strathman, J., Bertini, R., Bender, P., & Callas, S. (2005). Analysis of transit signal priority using archived TriMet bus dispatch system data. Transportation Research Record, 1925(156-166).
Lai, W., & Chen, C. (2011). Behavioral intentions of public transit passengers—The roles of service quality, perceived value, satisfaction and involvement. Transport Policy, 18(2), 318-325.
Larwin, T., & Koprowski, Y. (2012). Off-board fare payment using proof-of-payment verification. Washington: Transportation Research Board.
Lee, J. (2011). Uncovering San Francisco, California, muni’s proof-of-payment patterns to help reduce fare evasion. Transportation Research Record: Journal of the Transportation Research Board, 2216, 9.
23
Levine, J., & Torng, G. (1994). Dwell time effects of low-floor bus design. Journal of Transportation Engineering, 120(6), 829-914.
Levinson, H. (1983). Analyzing transit travel time performance. Transportation Research Record, 915, 1-6. Levinson, H., Zimmerman, S., Clinger, J., & Rutherford, G. (2002). Bus rapid transit: An overview. Journal of Public
Transportation, 5(2), 1-30. Lin, T., & Wilson, N. (1992). Dwell time relationships for light rail systems. Transportation Research Record(1361),
287-205. Milkovits, M. (2008). Modeling the factors affecting bus stop dwell time: Use of automatic passenger counting,
automatic fare counting, and automatic vehicle location data. Transportation Research Record, 2072, 125-130.
Minser, J., & Webb, V. (2010). Quantifying the Benefits: Application of customer loyalty modeling in public transportation context. Transportation Research Record: Journal of the Transportation Research Board, 2144(1), 111-120.
Mishalani, R., McCord, M., & Wirtz, J. (2006). Passenger wait time perceptions at bus stops: Empirical results and impact on evaluating real-time bus arrival information. Journal of Public Transportation, 9(2), 89-106.
Mouwen, A. (2015). Drivers of customer satisfaction with public transport services. Transportation Research Part A: Policy and Practice, 78, 1-20.
Psarros, I., Kepaptsoglou, K., & Karlaftis, M. (2011). An empirical investigation of passenger wait time perceptions. Journal of Public Transportation, 14(3), 109-122.
Rajbhandari, R., Chien, S., & Daniel, J. (2003). Estimation of bus dwell time with automatic passenger counter information. Transportation Research Record, 1841, 120-127.
Şimşekoğlu, Ö., Nordfjærn, T., & Rundmo, T. (2015). The role of attitudes, transport priorities, and car use habit for travel mode use and intentions to use public transportation in an urban Norwegian public. Transport Policy, 42, 113-120.
Stewart, A., Attanucci, J., & Wilson, N. (2015). Ridership response to incremental Bus Rapid Transit upgrades in North America: Demographic and network effects. Transportation Research Record: Journal of the Transportation Research Board, 2538, 37-43.
Stewart, C., & El-Geneidy, A. (2014). All aboard at all doors: Route selection and running-time savings estimation for multiscenario all-door bus boarding. Transportation Research Record: Journal of the Transportation Research Board(2418), 39-48.
Strathman, J., Dueker, K., Kimpel, T., Gerhart, R., Turner, K., Taylor, P., . . . Griffin, D. (2000). Service reliability impacts of computer-aided dispatching and automatic vehicle location technology: A Tri-Met case study. Transportation Quarterly, 54(3), 85-102.
Sun, L., Tirachini, A., Axhausen, K., Erath, A., & Lee, D. (2014). Models of bus boarding and alighting dynamics. Transportation Research Part A: Policy and Practice, 69, 447-460.
Tirachini, A. (2013). Estimation of travel time and the benefits of upgrading the fare payment technology in urban bus services. Transportation Research Part C: Emerging Technologies, 30, 239-256.
Tirachini, A., Camus, L., & Cruz, D. (2016). Modelación de tiempos de detención de buses en paraderos de Santiago y Valparaíso-Viña del Mar. Ingeniería de Transporte, 19(2).
Vandebona, U., & Richardson, A. (1985). The effects of fare-collection strategies on transit level of service. Transportation Research Record(1036).
Walker, J. (2012). Human transit: How clearer thinking about public transit can enrich our communities and our lives. Washington, DC: Island Press.
Zhao, J., Webb, V., & Shah, P. (2014). Customer loyalty differences between captive and choice transit riders. Transportation Research Record: Journal of the Transportation Research Board(2415), 80-88.