16
GETTING READY FOR THE FUTURE
GETTING READY FOR THE FUTURE

The world is in the midst of a major transformation affecting all countries in the developed, transition and developing worlds. The trends driving this transformation are set to continue, but their economic and social impact will vary from country to country, and outcomes will very much depend on what action countries take to seize the opportunities and address the challenges they bring with them. It is the time to rethink and redesign our future strategies bearing in mind these global developments and their implications for local contexts.

2
This note is the first of a series of working papers reflecting on how global trends are affecting the countries where the European Training Foundation works in the wider neighbourhood of the European Union and what impact they will have on labour markets and consequently on skills. It sets out a framework for analysing the ongoing economic and labour market transfor-mation in these countries with a view to future skills policies.
Are the ETF’s partner countries ready to face the challenges and profit from the opportunities of the future?
“Panta rhei”. As the ancient Greek philosopher Heraclitus said, everything is in flux. We are entering a new stage of global evolution, but what is different this time is the revolutionary pace of change and its disruptive nature. The global macroeconomic and political environment is becoming more and more dynamic, interconnected and unpredictable. Policy makers need to act in the knowledge that our predictions of the future are partial and imperfect, and subject to multiple disruptive factors. However, we can already identify a number of global trends affecting all the ETF partner countries.
Globalisation is a common denominator for many trends affecting all countries in the developed, transition and developing world. The Fourth Industrial Revolution blurs the lines between the physical, digital and biological spheres. Digitalisation, internet technology, automation, robotics and artificial intelligence are displacing, replacing, reshaping and complementing many jobs. Climate change, demographic shifts and migration flows further contribute to the world’s transformation.
The starting point and the national context matter. Where a country stands today in any area is key to shaping what happens in that area in the future (so-called ‘path-dependency’). The impact of change depends on economic structures, involvement in international trade, the degree of technological and digital penetration, demographics and the impact of migration flows. Another important factor is the education system, its structure and its capacity to provide qualified labour to drive innovation and productivity growth.
Besides where it starts from, the future of a country is also shaped by the choices it makes. The ability of countries to take advantage of global trends by seizing opportunities and transforming challenges into assets rests on their institutional capacity to make the right choices and implement them, on one hand, and to pro-vide access to technological advances and equip citizens with adequate education and skills, on the other.
To manage transition towards the future, it is crucial to refine strategies beyond 2020 and define specific national development paths from the perspective of the economy, employment and education.
Economic integration. ETF partner countries are very integrated into the global economy and their economic inter-dependency is on the rise. Most of them participate increasingly in Global Value Chains (GVC), with an estimated 80% of global trade associated with GVCs being conducted through transnational corporations and their FDI flows. Foreign investment has driven technological transformation and integration with the global economy. The share of net FDI flows is quite high in Albania, Azerbaijan, Georgia, Montenegro, Serbia and Turkmenistan in relation to their size.

3
Among ETF partner countries, Russia, Turkey, Israel, Egypt, Morocco, Tunisia and Serbia show relatively higher participation in GVC. Sectors with high GVC participation are agriculture, processed food products, plastics and rubber, textiles, metal products, electrical and electronic equipment and motor vehicles (automotive). The services sector is increasingly integrated too, including financial and banking services. As GVC activity is organised around large manufacturing hubs –Europe, North America, and Asia – there is a premium in locating close to large “headquarter” economies. For most ETF partner countries, Europe is the main hub of manufacturing and headquarters for GVCs.
A HIGH LEVEL OF INTEGRATION IN THE GLOBAL ECONOMY
Source: Data on exports as a % of GDP is retrieved from the World Bank database, 2017 or the latest available year. Data on others retrieved from UNDP (2018), Human Development Indices and Indicators: 2018 Statistical Update, http://www.hdr.undp.org/sites/default/files/2018_human_development_statistical_update.pdf
The share of exports varies from over 50% of GDP in Ukraine, Belarus, the former Yugoslav Republic of Macedonia and Serbia, to 11% in Tajikistan and 13% in Egypt. In Montenegro, Moldova, Georgia, and Tunisia exports generate close to 50% of GDP. The share of exports is gradually increasing in most countries, though there has been moving in the opposite direction in Egypt, Israel, Jordan, Lebanon, Tunisia and Russia.
Remittances are very high in countries of emigration, reaching one third of GDP in Kyrgyzstan (33%) and Tajikistan (32%) and one-fifth in Moldova (20%), followed by Lebanon (15%), Armenia (13%), Albania, Bosnia and Herzegovina, Egypt, Jordan and Montenegro. Official Development Assistance (ODA) represents a very high share of GNI in Palestine 1 (16%), Kyrgyzstan (8%) and Jordan (7%).
There is a positive correlation between integration with GVCs and growth in GDP per capita. Moreover, the economic decisions of countries depend on external factors, not only domestic ones. They can upgrade their economic structures, by participating in GVCs, but this makes them highly vulnerable to external shocks (positive or negative). This points to the need to develop internal resilience to external shocks and direct investment (financial and human capital, innovation) towards moving up in the value chain.
CONSIDERABLE INTEGRATION IN GLOBAL ECONOMY
0
10
20
30
40
50
60
UA MK RS MD ME TN AZ JO BA MA AM LB AL PS EG TJ
Exports (% of GDP) FDI flows (% of GDP) Remittances (% of GDP)
1 This designation shall not be construed as recognition of a State of Palestine and is without prejudice to the individual position of the Member States on this issue.

4
Building internal resilience to bridge the gap. Overcoming structural and economic challenges is the first step towards profiting from global and technological change and shortening the distance to catch up with more developed economies. With the exception of Israel, which is a high-income country, the ETF partner countries are all middle-income countries in terms of GDP per capita. At the bottom end of the scale we find the lower-middle income countries of Kyrgyzstan, Tajikistan, Palestine, Moldova and Uzbekistan, followed by Ukraine, Armenia and Morocco. At the top end are the upper-middle income countries of Russia, Kazakhstan and Turkey. To bridge the wealth gap, they need to grow consistently faster than richer countries, while ensuring return on investment.
BRIDGING THE ECONOMIC GAP AND INCREASING WEALTH
Source: Data on the real GDP growth rate 2010-2017 is retrieved from the World Bank “GDP Growth (annual %) Data”. For the data on GDP (PPP) per capita in international dollars are extracted from IMF 2017
Currently, the majority of the countries suffer from low productivity and inefficient use of resources, especially human resources, with low rates of economic activity. The competitiveness2 of ETF partner countries remains rather low, with the economies that are more diversified and open to private sector involvement doing relatively better. Israel (20) and Russia (43) are the best performers, followed by Kazakhstan, Turkey, Serbia and Georgia. Tajikistan, Egypt, Bosnia and Herzegovina and Algeria are the worst performers. Innovation3 remains weak, with Israel by far the most innovative, followed by Ukraine, Russia, Moldova and Turkey with promising rankings, and Algeria, Tajikistan, Kyrgyzstan, Lebanon, Egypt, Belarus and the former Yugoslav Republic of Macedonia still lagging behind.
ALDZ
AM
AZ BY
BAEG
GE
IL
JO
KZXKKG
LBMK
MD
ME
MAPS
RURS
TJ
TN
TR
TM
UA
UZ
-1
0
1
2
3
4
5
6
7
8
90 5000 10000 15000 20000 25000 30000 35000 40000
GD
P ct
. 201
0 $
(% c
hang
e 20
10-2
017)
GDP per capita PPP crt. $ (2017)
2 WEF Global Competitiveness Index 4.0 (GCI) 2018, measures competitiveness with ranking among 140 economies.
3 Global Innovation Index (GII) 2018 provides a detailed metrics of the innovation performance in 126 countries by Cornell University, INSEAD and WIPO.
5
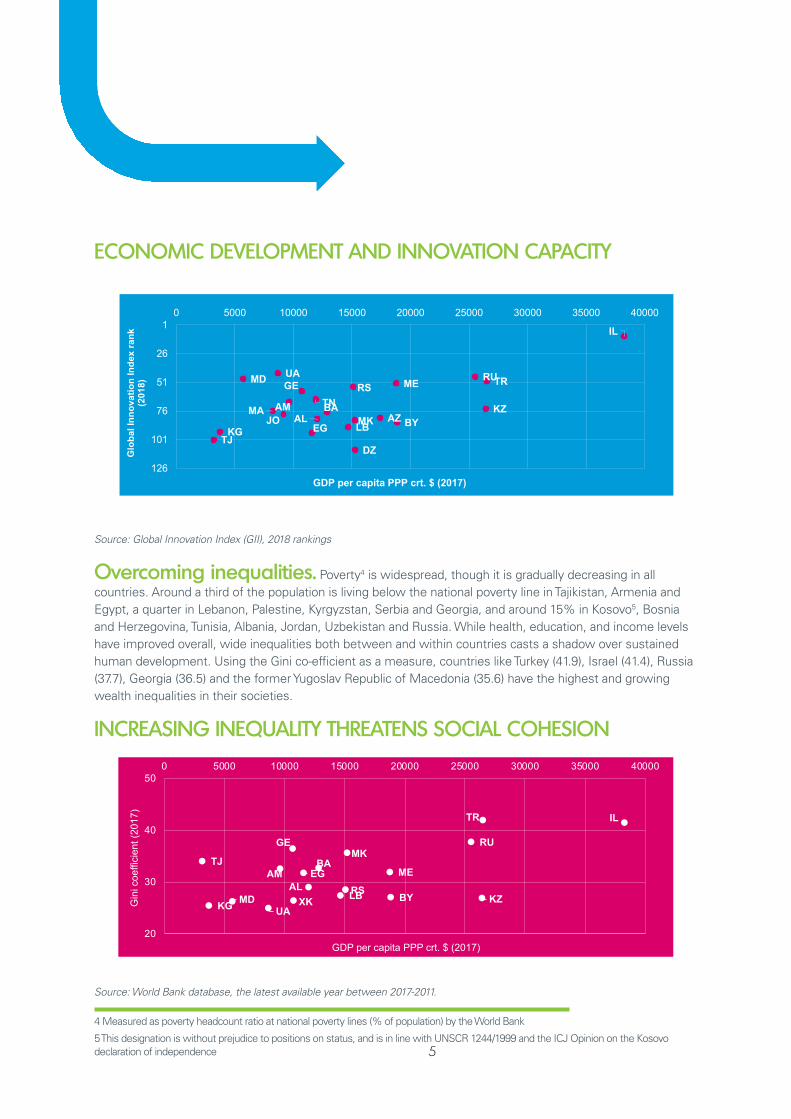
ECONOMIC DEVELOPMENT AND INNOVATION CAPACITY
Source: Global Innovation Index (GII), 2018 rankings
Overcoming inequalities. Poverty4 is widespread, though it is gradually decreasing in all countries. Around a third of the population is living below the national poverty line in Tajikistan, Armenia and Egypt, a quarter in Lebanon, Palestine, Kyrgyzstan, Serbia and Georgia, and around 15% in Kosovo5, Bosnia and Herzegovina, Tunisia, Albania, Jordan, Uzbekistan and Russia. While health, education, and income levels have improved overall, wide inequalities both between and within countries casts a shadow over sustained human development. Using the Gini co-efficient as a measure, countries like Turkey (41.9), Israel (41.4), Russia (37.7), Georgia (36.5) and the former Yugoslav Republic of Macedonia (35.6) have the highest and growing wealth inequalities in their societies.
INCREASING INEQUALITY THREATENS SOCIAL COHESION
Source: World Bank database, the latest available year between 2017-2011.
ECONOMIC DEVELOPMENT VS. INNOVATION CAPACITY
AL
DZ
AMAZ BY
BA
EG
GE
IL
JOKZ
KG LBMK
MD ME
MA
RURS
TJ
TN
TRUA
1
26
51
76
101
126
0 5000 10000 15000 20000 25000 30000 35000 40000
Glo
bal I
nnov
atio
n In
dex
rank
(2
018)
GDP per capita PPP crt. $ (2017)
ALAM
BY
BAEG
GE
IL
KZXKKGLB
MK
MD
ME
RU
RS
TJ
TR
UA
20
30
40
500 5000 10000 15000 20000 25000 30000 35000 40000
Gin
i coe
ffici
ent (
2017
)
GDP per capita PPP crt. $ (2017)
4 Measured as poverty headcount ratio at national poverty lines (% of population) by the World Bank
5 This designation is without prejudice to positions on status, and is in line with UNSCR 1244/1999 and the ICJ Opinion on the Kosovo declaration of independence
6
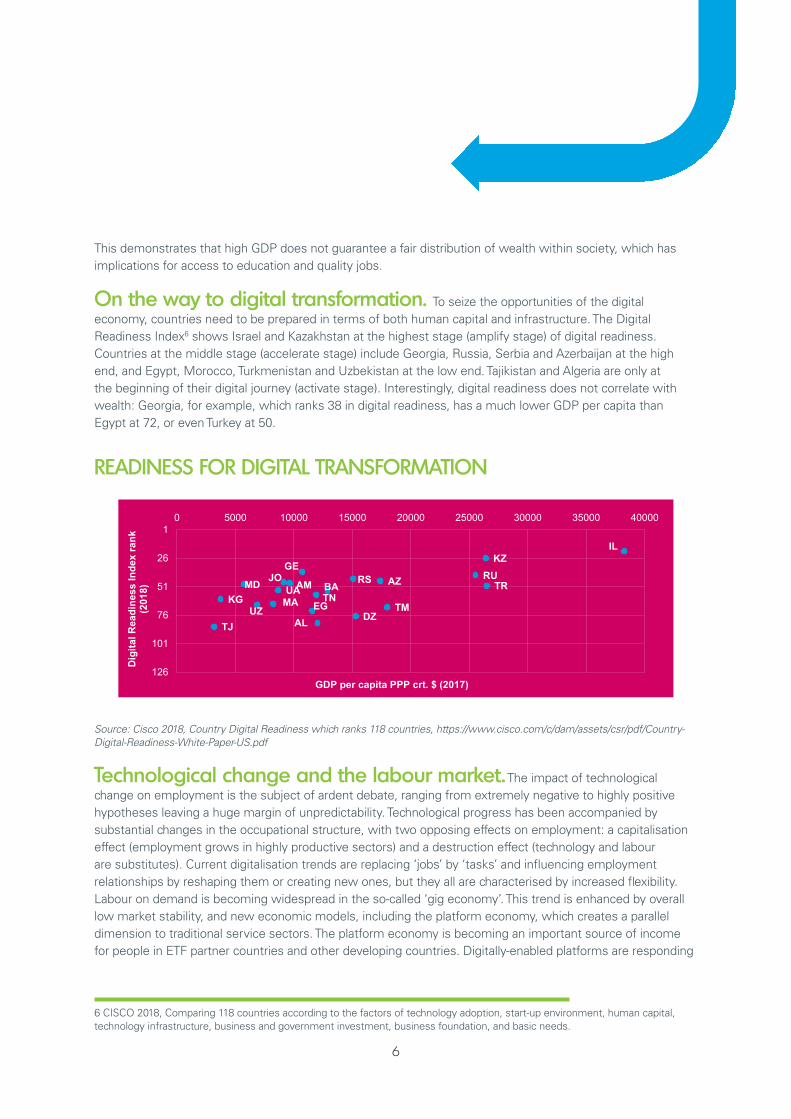
This demonstrates that high GDP does not guarantee a fair distribution of wealth within society, which has implications for access to education and quality jobs.
On the way to digital transformation. To seize the opportunities of the digital economy, countries need to be prepared in terms of both human capital and infrastructure. The Digital Readiness Index6 shows Israel and Kazakhstan at the highest stage (amplify stage) of digital readiness. Countries at the middle stage (accelerate stage) include Georgia, Russia, Serbia and Azerbaijan at the high end, and Egypt, Morocco, Turkmenistan and Uzbekistan at the low end. Tajikistan and Algeria are only at the beginning of their digital journey (activate stage). Interestingly, digital readiness does not correlate with wealth: Georgia, for example, which ranks 38 in digital readiness, has a much lower GDP per capita than Egypt at 72, or even Turkey at 50.
READINESS FOR DIGITAL TRANSFORMATION
Source: Cisco 2018, Country Digital Readiness which ranks 118 countries, https://www.cisco.com/c/dam/assets/csr/pdf/Country-Digital-Readiness-White-Paper-US.pdf
Technological change and the labour market. The impact of technological change on employment is the subject of ardent debate, ranging from extremely negative to highly positive hypotheses leaving a huge margin of unpredictability. Technological progress has been accompanied by substantial changes in the occupational structure, with two opposing effects on employment: a capitalisation effect (employment grows in highly productive sectors) and a destruction effect (technology and labour are substitutes). Current digitalisation trends are replacing ‘jobs’ by ‘tasks’ and influencing employment relationships by reshaping them or creating new ones, but they all are characterised by increased flexibility. Labour on demand is becoming widespread in the so-called ‘gig economy’. This trend is enhanced by overall low market stability, and new economic models, including the platform economy, which creates a parallel dimension to traditional service sectors. The platform economy is becoming an important source of income for people in ETF partner countries and other developing countries. Digitally-enabled platforms are responding
READINESS FOR DIGITAL TRANSFORMATION
AL DZ
AM AZBA
EG
GE
IL
JO
KZ
KGMD
MA
RURS
TJ
TNTR
TMUA
UZ
1
26
51
76
101
126
0 5000 10000 15000 20000 25000 30000 35000 40000
Dig
ital R
eadi
ness
Inde
x ra
nk
(201
8)
GDP per capita PPP crt. $ (2017)
6 CISCO 2018, Comparing 118 countries according to the factors of technology adoption, start-up environment, human capital, technology infrastructure, business and government investment, business foundation, and basic needs.

7
to current needs by quickly matching demand and supply. Ukrainian workers are the most numerous in platform service provision in Europe7, building on their high education level, ample IT and language skills and relatively lower salaries. Similarly, Egypt has become Uber’s fastest growing market in the world, following legalisation of the service in May 2018. E-commerce is also on the rise, especially in MENA countries, giving more choice and removing barriers of distance and gender.
New technologies are facilitating the shift in economic structure towards services, and this influences internal mobility towards urban-based jobs. The internet’s ability to reduce transaction costs increases opportunities for people who face barriers in finding jobs or opportunities to engage in productive activity, and may promote inclusion for women, persons with disabilities, and people in remote areas. It also helps digital businesses grow faster and facilitates the emergence of new occupations.
Facing demographic, migration and mobility trends. Enhanced life expectancy is a widespread global trend, reflecting efforts to improve health and quality of life. Against this background, there are major variations in demographic trends, migration and brain drain in the ETF partner countries. While Eastern European and Balkan countries already suffer from aging populations, shrinking workforces and increasing burdens of care, Southern Mediterranean and Central Asian countries are struggling to meet the needs of their booming young populations, which require significant public investment in education, health, employment, housing and infrastructure. For ageing societies, automation can be seen as an opportunity to cope with the shortage of labour, while growing populations put countries under pressure to create enough quality jobs for the new labour market entrants. Be this as it may, the share of young population is decreasing everywhere, demonstrating a global trend towards ageing.
Migration has become a persistent challenge in many ETF partner countries, with countries experiencing emigration, transit and immigration flows. Russia and Kazakhstan are important recipient countries, absorbing migrants from neighbouring countries. Armenia, Belarus, Georgia, Moldova and Ukraine experience net emigration. Migration towards Europe contributes to population ageing in the Balkans, since most emigrants are young and of working age. Jordan, Lebanon and Turkey host the highest number of refugees among the EU neighbouring countries, while Morocco and Tunisia have become transit countries for South-North legal and illegal migration.
Internal migration towards urban areas is another important trend. Increased urbanisation puts pressure on social services, infrastructure and energy supply in almost all ETF partner countries.
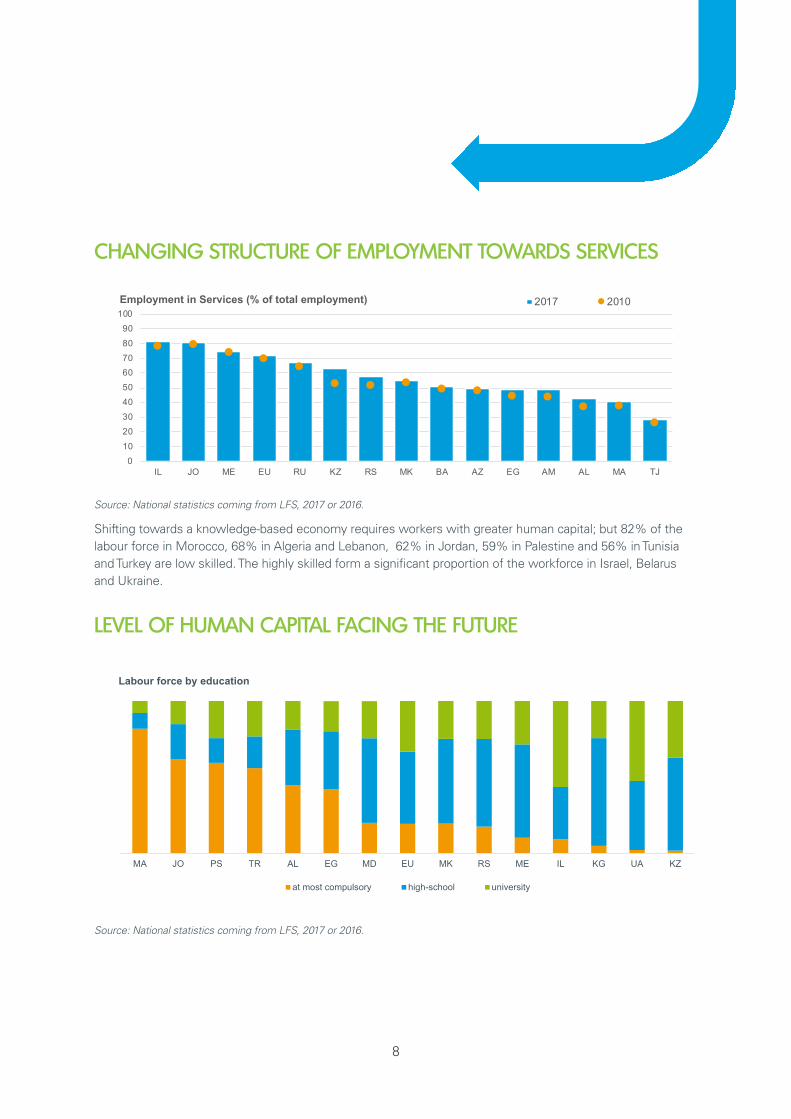
Tapping human capital potential. In line with the global demographic and technological trends, there are important shits in economic structure. The services sector has been gradually growing in all countries, while agriculture is decreasing. Industry (excluding construction) is not expanding, demonstrating a premature trend towards deindustrialisation. Services generate the largest share of employment, except in Tajikistan, where most employment is still in agriculture (52%) and urbanisation is lowest (27%). Employment in services ranges from 82% in Jordan and Israel to just 32% in Tajikistan. The share of agricultural employment has decreased in all countries, but it is still significant in Georgia, Albania, Morocco, Azerbaijan, Armenia, Moldova, Egypt, Kyrgyzstan, and Uzbekistan.
7 https://www.ilo.org/wcmsp5/groups/public/---ed_protect/---protrav/---travail/documents/publication/wcms_635370.pdf
8
CHANGING STRUCTURE OF EMPLOYMENT TOWARDS SERVICES
Source: National statistics coming from LFS, 2017 or 2016.
Shifting towards a knowledge-based economy requires workers with greater human capital; but 82% of the labour force in Morocco, 68% in Algeria and Lebanon, 62% in Jordan, 59% in Palestine and 56% in Tunisia and Turkey are low skilled. The highly skilled form a significant proportion of the workforce in Israel, Belarus and Ukraine.
LEVEL OF HUMAN CAPITAL FACING THE FUTURE
Source: National statistics coming from LFS, 2017 or 2016.
LOW EDUCATION ATTAINMENT IN SOME COUNTRIES
MA JO PS TR AL EG MD EU MK RS ME IL KG UA KZ
at most compulsory high-school university
Labour force by education
0102030405060708090100
IL JO ME EU RU KZ RS MK BA AZ EG AM AL MA TJ
Employment in Services (% of total employment) 2017 2010
9
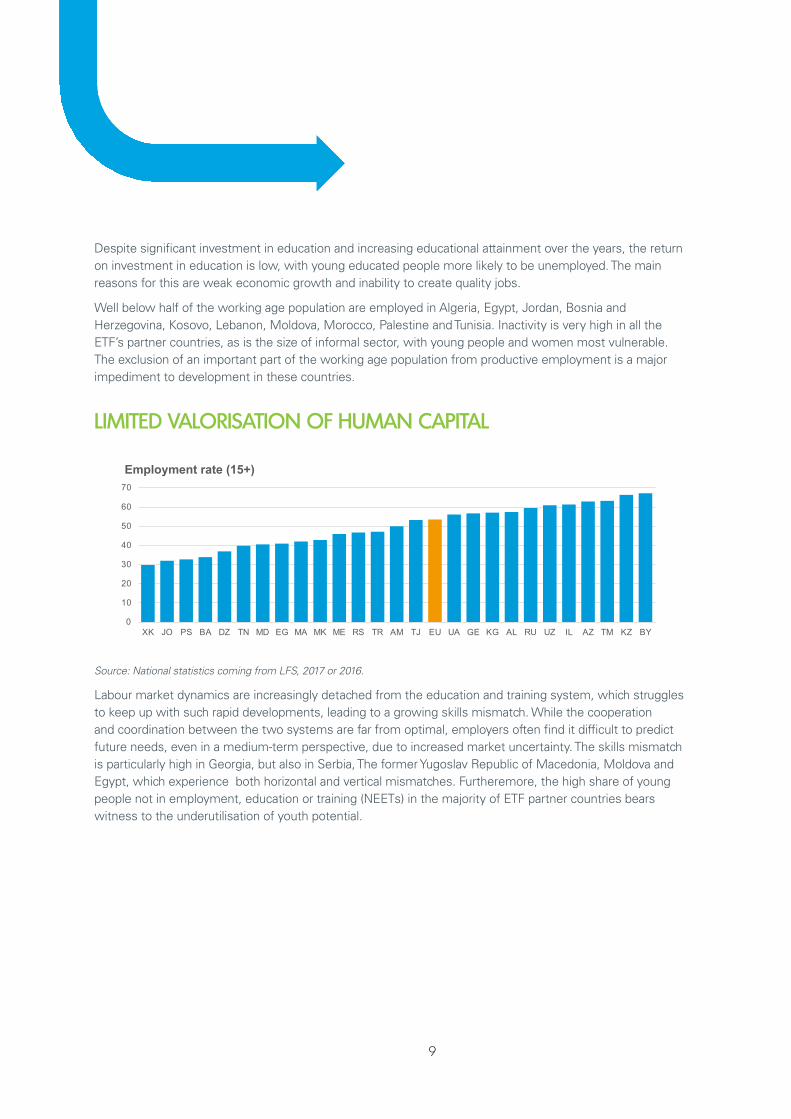
Despite significant investment in education and increasing educational attainment over the years, the return on investment in education is low, with young educated people more likely to be unemployed. The main reasons for this are weak economic growth and inability to create quality jobs.
Well below half of the working age population are employed in Algeria, Egypt, Jordan, Bosnia and Herzegovina, Kosovo, Lebanon, Moldova, Morocco, Palestine and Tunisia. Inactivity is very high in all the ETF’s partner countries, as is the size of informal sector, with young people and women most vulnerable. The exclusion of an important part of the working age population from productive employment is a major impediment to development in these countries.
LIMITED VALORISATION OF HUMAN CAPITAL
Source: National statistics coming from LFS, 2017 or 2016.
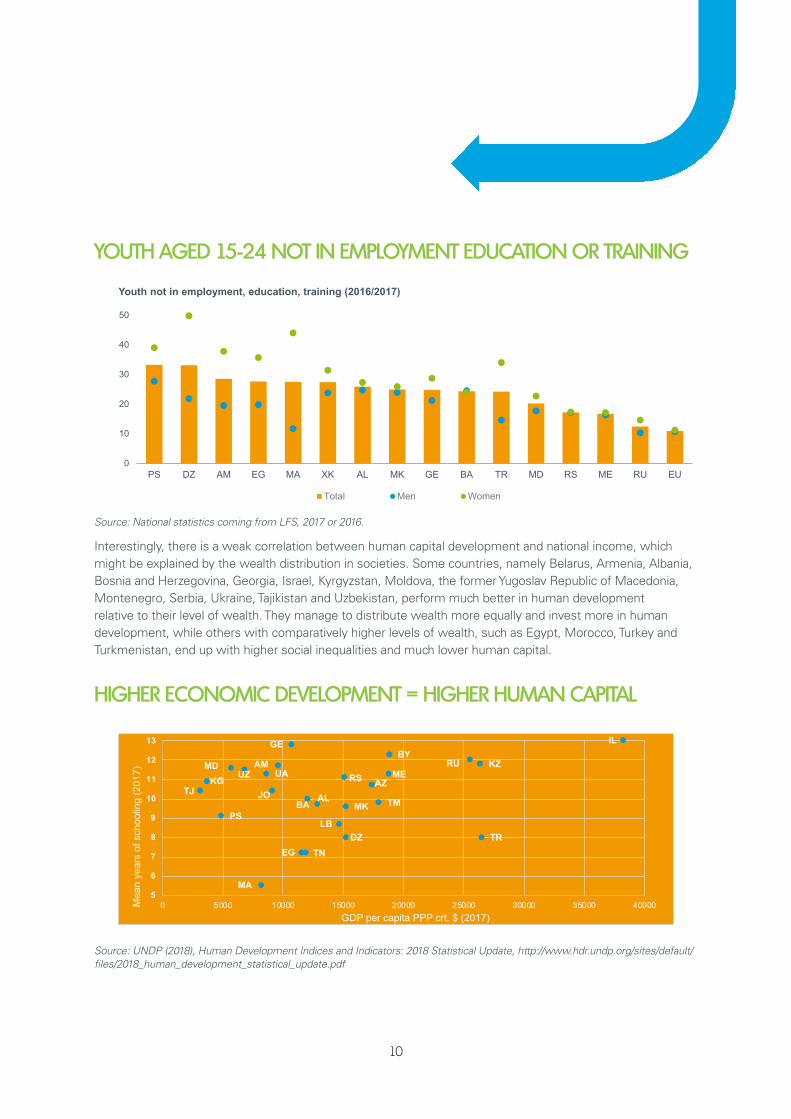
Labour market dynamics are increasingly detached from the education and training system, which struggles to keep up with such rapid developments, leading to a growing skills mismatch. While the cooperation and coordination between the two systems are far from optimal, employers often find it difficult to predict future needs, even in a medium-term perspective, due to increased market uncertainty. The skills mismatch is particularly high in Georgia, but also in Serbia, The former Yugoslav Republic of Macedonia, Moldova and Egypt, which experience both horizontal and vertical mismatches. Furtheremore, the high share of young people not in employment, education or training (NEETs) in the majority of ETF partner countries bears witness to the underutilisation of youth potential.
0
10
20
30
40
50
60
70
XK JO PS BA DZ TN MD EG MA MK ME RS TR AM TJ EU UA GE KG AL RU UZ IL AZ TM KZ BY
Employment rate (15+)
10
YOUTH AGED 15-24 NOT IN EMPLOYMENT EDUCATION OR TRAINING
Source: National statistics coming from LFS, 2017 or 2016.
Interestingly, there is a weak correlation between human capital development and national income, which might be explained by the wealth distribution in societies. Some countries, namely Belarus, Armenia, Albania, Bosnia and Herzegovina, Georgia, Israel, Kyrgyzstan, Moldova, the former Yugoslav Republic of Macedonia, Montenegro, Serbia, Ukraine, Tajikistan and Uzbekistan, perform much better in human development relative to their level of wealth. They manage to distribute wealth more equally and invest more in human development, while others with comparatively higher levels of wealth, such as Egypt, Morocco, Turkey and Turkmenistan, end up with higher social inequalities and much lower human capital.
HIGHER ECONOMIC DEVELOPMENT = HIGHER HUMAN CAPITAL
Source: UNDP (2018), Human Development Indices and Indicators: 2018 Statistical Update, http://www.hdr.undp.org/sites/default/files/2018_human_development_statistical_update.pdf
AL
DZ
AM
AZ
BY
BA
EG
GE IL
JO
KZ
KG
LB
MK
MDME
MA
PS
RURS
TJ
TNTR
TM
UAUZ
5
6
7
8
9
10
11
12
13
0 5000 10000 15000 20000 25000 30000 35000 40000Mea
n ye
ars
of s
choo
ling
(201
7)
GDP per capita PPP crt. $ (2017)
HIGH RATE OF YOUTH NEETS
0
10
20
30
40
50
PS DZ AM EG MA XK AL MK GE BA TR MD RS ME RU EU
Total Men Women
Youth not in employment, education, training (2016/2017)

11
According to the UNESCO World Inequality Database on Education (WIDE)8, Georgia, Ukraine, Kazakhstan and Israel have the highest upper secondary education completion rate with minimal wealth disparities in access to education. In contrast, Albania, Moldova, the former Yugoslav Republic of Macedonia and Serbia have the biggest wealth differences in access. However, wealth is not the only issue, and other factors play an important role. These include geography (with urban-rural disparities in Moldova and Albania, and regional disparities in Albania, Moldova and Tajikistan), gender (Tajikistan, Jordan, Palestine and Serbia), religion (Albania and Montenegro) and ethnic origin (Serbia, Moldova, the former Yugoslav Republic of Macedonia, Azerbaijan and Israel).
Institutions matter. Notwithstanding all the challenges, ETF partner countries are making efforts to improve policy responses, with many of them implementing ambitious reforms. In a globalised world, the experience of more developed countries offers the opportunity to learn from others and borrow from tried and tested solutions, including policy approaches, inventions, processes and technologies. These can be adapted to the local context without passing through the whole development process (so-called leap-frogging). Proximity to the European Union with its common platforms of cooperation is another important driver of policy reforms.
Unfortunately, despite ambitious plans, implementation of strategic frameworks is not the strongest point in many countries. One reason is frequent political changes and instability. Another is the need for institutional capacity and control of corruption as cornerstones of economic development and proper use of public funds. At the same time, new technologies and platforms are increasingly enabling citizens and new actors to engage with governments, voice their concerns about jobs and inequality.
A measure of the quality of governance systems is the Worldwide Governance Indicators (WGI) developed by the World Bank9, which rank countries on a scale from 1 (lowest) to 100 (highest). On this scale, Israel, Georgia, Albania, Montenegro, Serbia and the former Yugoslav Republic of Macedonia perform well overall (50 and above), while Turkmenistan, Tajikistan, Uzbekistan, Algeria, Egypt, Kyrgyzstan and Lebanon, come out rather poorly.
8 World Inequality Database on Education https://www.education-inequalities.org/
9 World Bank, the database of the Worldwide Governance Indicators (WGI) for over 200 countries, measuring 6 dimensions of governance: voice and accountability; political stability and absence of violence; government effectiveness; regulatory quality; rule of law; control of corruption. http://info.worldbank.org/governance/wgi/#home

12
THE WAY FORWARD: STRATEGIC CHOICES FOR MANAGING TRANSITION Our vision of the future is partial and imperfect, but global trends indicate the direction to some extent. Against this backdrop, the benefits for citizens, individually and collectively, should be at the heart of future policies and reforms. It is vital to ensure adequate standards of living and decent work in all types of employment, and enhance social value. To achieve this, countries will need to build a common vision and implement innovative and inclusive strategies to invest in skills, boost job creation, improve labour standards, and increase productivity, not least through economic diversification. The future brings risks as well as offering great opportunities. The ability of all actors at all levels to act in partnership will therefore be key to building the future together. Such partnerships should include governments, institutions, agencies, regions, social partners, civil society, businesses, citizens and other emerging actors, and must operate within and beyond existing governance structures.
The dynamic and disruptive nature of global trends will require more flexibility, resilience and agile solutions. Given the high degree of uncertainty, investing in people’s skills stands out as the best buffer to manage transition to the future. Anticipating tomorrow’s skills needs becomes increasingly challenging, requiring efficient use of traditional data sources, but also exploring new analytical methods and innovative methodologies on emerging occupations, including the use of big data.
Equally important is laying the foundation for education and skills to prepare for new occupations and changes when they happen. Competence requirements are changing, with more jobs subject to technological change, and digitalisation playing a bigger role in all areas of work and life. Entrepreneurial, social and civic competences are becoming more relevant to boost resilience and the ability to adapt to change. In the race of people against machine, whether people are displaced by automation and artificial intelligence will largely depend on their ability to take advantage of uniquely human characteristics that cannot be replaced by technology. These include common sense, empathy and creativity. Young people will need key competences to face the challenge of a fast changing world. These are the skills everyone needs for personal development, self-realisation, employability, social inclusion and active citizenship10. Key competences will need to be developed throughout the whole of education and working life through comprehensive lifelong learning, including non-formal and informal learning experiences. The need to learn throughout life and adapt to the changing requirements of the labour market becomes increasingly important as societies age.
10 Council Recommendation of 22 May 2018 on Key competences for lifelong learning (2018/C 189/01).
13
Current and future migration patterns point to the need for more open education and training systems. Curricula need to consider the international dimension to ensure that qualifications are transparent, comparable, readable and portable to possible new destinations. Such changes require structural adaptation of the entire education system and effective cooperation between national and international partners. An open and accessible system for the recognition and validation of existing skills and qualifications is another feature that can substantially improve matching between available jobs and skills.
Strategic choices for the future will also need to create favourable conditions for empowering individuals to fulfil their potential by ensuring equal opportunities in society. Investing in people is best achieved by creating the right conditions for learning and development through enhanced access to technological development and a stable governance framework. Governments and institutions are crucial to guiding change and making strategic choices, but they cannot act alone. They need to build supportive networks (ecosystems) to design and deliver effective and innovative skills and employment policies. Social partners and civil society are already increasingly involved in policymaking and implementation. Regional and local authorities, especially in cities, play and important role. Business leaders are key to defining workforce strategies that grasp the full potential of new trends. New actors, such as research organisations, bloggers, and influencers with millions of followers, are having an increasingly important role in shaping policies. All actors must take action today to manage change. And they must act collectively for a better future for all.
Ultimately, two things will shape the future of each country: their capacity to make a sound and realistic analysis of where they are today, and their ability to make the right choices and implement the right solutions to make the most of the opportunities and mitigate the challenges that change brings for sustainable and inclusive growth.

NOTES


