41
Getting Started with Pentaho Data Integration
Getting Started with Pentaho Data Integration
This document supports Pentaho Business Analytics Suite 4.8 GA and Pentaho Data Integration 4.4 GA,documentation revision November 30, 2012.
This document is copyright © 2012 Pentaho Corporation. No part may be reprinted without written permission fromPentaho Corporation. All trademarks are the property of their respective owners.
Help and Support ResourcesIf you have questions that are not covered in this guide, or if you would like to report errors in the documentation,please contact your Pentaho technical support representative.
Support-related questions should be submitted through the Pentaho Customer Support Portal athttp://support.pentaho.com.
For information about how to purchase support or enable an additional named support contact, please contact yoursales representative, or send an email to [email protected].
For information about instructor-led training on the topics covered in this guide, visithttp://www.pentaho.com/training.
Limits of Liability and Disclaimer of WarrantyThe author(s) of this document have used their best efforts in preparing the content and the programs containedin it. These efforts include the development, research, and testing of the theories and programs to determine theireffectiveness. The author and publisher make no warranty of any kind, express or implied, with regard to theseprograms or the documentation contained in this book.
The author(s) and Pentaho shall not be liable in the event of incidental or consequential damages in connectionwith, or arising out of, the furnishing, performance, or use of the programs, associated instructions, and/or claims.
TrademarksPentaho (TM) and the Pentaho logo are registered trademarks of Pentaho Corporation. All other trademarks are theproperty of their respective owners. Trademarked names may appear throughout this document. Rather than listthe names and entities that own the trademarks or insert a trademark symbol with each mention of the trademarkedname, Pentaho states that it is using the names for editorial purposes only and to the benefit of the trademarkowner, with no intention of infringing upon that trademark.
Company InformationPentaho CorporationCitadel International, Suite 3405950 Hazeltine National DriveOrlando, FL 32822Phone: +1 407 812-OPEN (6736)Fax: +1 407 517-4575http://www.pentaho.com
E-mail: [email protected]
Sales Inquiries: [email protected]
Documentation Suggestions: [email protected]
Sign-up for our newsletter: http://community.pentaho.com/newsletter/
| TOC | 3
Contents
Introduction................................................................................................................................4Pentaho Data Integration Architecture.......................................................................................6Downloading Pentaho Data Integration.....................................................................................7Installing Pentaho Data Integration............................................................................................8
Starting the Spoon Client Tool......................................................................................................................8Starting the Data Integration Server............................................................................................................. 8Pentaho Data Integration Folders and Scripts..............................................................................................8Adding a JDBC Driver...................................................................................................................................9
Connecting to the Enterprise Repository.................................................................................11Navigating through the Interface..............................................................................................12
Introducing Perspectives............................................................................................................................ 13Instaview Perspective...................................................................................................................... 14
Creating Transformations........................................................................................................ 18Retrieving Data from a Flat File (Text File Input Step)............................................................................... 18
Saving Your Transformation............................................................................................................ 20Filter Records with Missing Postal Codes (Filter Rows Step).....................................................................21Loading Your Data into a Relational Database (Table Output Step).......................................................... 22Retrieving Data from your Lookup File (Text File Input Step).....................................................................23Resolving Missing Zip Code Information (Stream Lookup Step)................................................................ 24Completing your Transformation (Select Values Step)...............................................................................25Running Your Transformation.....................................................................................................................26
Creating Jobs...........................................................................................................................29Scheduling Jobs...................................................................................................................... 31Building Business Intelligence Solutions Using Agile BI..........................................................32
Using Agile BI............................................................................................................................................. 32Correcting the Data Quality Issue...............................................................................................................33Creating a Top Ten Countries by Sales Chart............................................................................................34Breaking Down Your Chart by Deal Size....................................................................................................35Wrapping it Up............................................................................................................................................ 36
Getting Started with PDI and Hadoop......................................................................................38Pentaho, Big Data, and Hadoop.................................................................................................................38About Hadoop.............................................................................................................................................38Big Data Resources....................................................................................................................................38
Why Choose Enterprise Edition?.............................................................................................40Professional, Technical Support................................................................................................................. 40Enterprise Edition Features........................................................................................................................ 40Certified Software Releases....................................................................................................................... 40
Troubleshooting.......................................................................................................................41I don't know what the default login is for the DI Server, Enterprise Console, and/or Carte........................ 41

| Introduction | 4
Introduction
Pentaho Data Integration (PDI) is a an extract, transform, and load (ETL) solution that uses an innovative metadata-driven approach. It includes an easy to use, graphical design environment for building ETL jobs and transformations,resulting in faster development, lower maintenance costs, interactive debugging, and simplified deployment.
Common Uses
Pentaho Data Integration is an extremely flexible tool that addresses a broad number of use cases including:
• Data warehouse population with built-in support for slowly changing dimensions and surrogate key creation• Data migration between different databases and applications• Loading huge data sets into databases taking full advantage of cloud, clustered and massively parallel processing
environments• Data Cleansing with steps ranging from very simple to very complex transformations• Data Integration including the ability to leverage real-time ETL as a data source for Pentaho Reporting• Rapid prototyping of ROLAP schemas• Hadoop functions: Hadoop job execution and scheduling, simple Hadoop MapReduce design, Amazon EMR
integration
Key Benefits
Pentaho Data Integration features and benefits include:
• Installs in minutes; you can be productive in one afternoon• 100% Java with cross platform support for Windows, Linux and Macintosh• Easy to use, graphical designer with over 100 out-of-the-box mapping objects including inputs, transforms, and
outputs

| Introduction | 5
• Simple plug-in architecture for adding your own custom extensions• Enterprise Data Integration server providing security integration, scheduling, and robust content management
including full revision history for jobs and transformations• Integrated designer (Spoon) combining ETL with metadata modeling and data visualization, providing the perfect
environment for rapidly developing new Business Intelligence solutions• Streaming engine architecture provides the ability to work with extremely large data volumes• Enterprise-class performance and scalability with a broad range of deployment options including dedicated,
clustered, and/or cloud-based ETL servers

| Pentaho Data Integration Architecture | 6
Pentaho Data Integration Architecture
The diagram below depicts the core components of Pentaho Data Integration Enterprise Edition.
Spoon is the design interface for building ETL jobs and transformations. Spoon provides a drag and drop interfaceallowing you to graphically describe what you want to take place in your transformations which can then be executedlocally within Spoon, on a dedicated Data Integration Server, or a cluster of servers.
Enterprise Edition (EE) Data Integration Server is a dedicated ETL server whose primary functions are:
Execution Executes ETL jobs and transformations using the PentahoData Integration engine.
Security Allows you to manage users and roles (default security) orintegrate security to your existing security provider suchas LDAP or Active Directory
Content Management Provides the ability to centrally store and manage yourETL jobs and transformations. This includes full revisionhistory on content and features such as sharing andlocking for collaborative development environments.
Scheduling Provides the services allowing you to schedule activitiesand monitor scheduled activities on the Data Integrationserver from within the Spoon design environment.
The Enterprise Console provides a thin client for managing deployments of Pentaho Data Integration EnterpriseEdition including management of Enterprise Edition licenses, monitoring and controlling activity on a remote PentahoData Integration server and analyzing performance trends of registered jobs and transformations.

| Downloading Pentaho Data Integration | 7
Downloading Pentaho Data Integration
Before you begin to download Pentaho Data Integration, you must have Java 6.0 already installed.
1. Go to the Pentaho Product Download page.
2. Select the appropriate operating system requirements.
Note: The installation instructions in this document are based on the Windows Operating Systemexclusively.
3. Fill out the contact form and click Send. Your download starts automatically.

| Installing Pentaho Data Integration | 8
Installing Pentaho Data Integration
It is assumed that you will follow the default installation instructions and that you are installing to a local device(localhost).
1. Read and accept the License Agreement.
2. Specify the location where you want to install Pentaho Data Integration or click Next to accept the default.
3. Set the user name and password for the Administrator account. For the purposes of this evaluation, accept thedefault user name, "admin," and type "password" in Password and Confirm Password fields.
4. Click Next to accept the default installation options on the Summary page.
5. Click Next to begin installation.
Pentaho Data Integration is installed as a Window service. When installation is complete, the Spoon designer islaunched.
Starting the Spoon Client ToolIf you inadvertently exit Spoon, follow the instructions below to launch it again.
1. Navigate to the folder where you have installed Pentaho Data Integration; for example c:\Program Files\pentaho\design-tools\data-integration.
2. Double-click Spoon.bat to launch the designer.
Note: If you are using Linux, double-click spoon.sh. To start the Spoon Designer on a Mac, go to .../pdi-ee/data-integration and double click on the Data Integration 32-bit or Data Integration 64-biticon depending on your system.
3. Alternatively, in Windows, go to Start -> Pentaho Enterprise Edition -> Design Tools to launch the designer.
Starting the Data Integration ServerFollow the directions below to start the DI Server.
1. Navigate to the Pentaho Data Integration installation directory.
cd c:\Program Files\pentaho\server\data-integration-server\
2. Run the start-pentaho.bat script to start the DI Server.
3. Alternatively, you can use the Start menu. Go to the Server Control section of the Pentaho Enterprise EditionStart menu folder, then click on Start Data Integration Server.
Pentaho Data Integration Folders and ScriptsAfter installation, your pentaho folder contains the following files and directories:
File/Folder Name Description
\design-tools\data-integration Contains the Spoon designer and command line utilities
\server\data-integration-server Contains the data integration server including individualstart/stop scripts; contains the enterprise console serverincluding individual start/stop scripts
\design-tools\docs\English Contains this document
\server\data-integration-server\ start-pentaho.bat Script file for starting the Data Integration server onWindows
\server\data-integration-server\ start-pentaho.sh Script file for starting the Data Integration server on Linuxand Macintosh

| Installing Pentaho Data Integration | 9
File/Folder Name Description
\server\data-integration-server\ stop-pentaho.bat Script file for stopping the Data Integration server onWindows
\server\data-integration-server\ stop-pentaho.sh Script file for stopping the Data Integration server on Linuxand Macintosh
\design-tools\data-integration\Spoon.bat Script file for starting the Spoon Designer on Windows
\design-tools\data-integration\spoon.sh Script file for starting the Spoon Designer on Linux andMacintosh
Adding a JDBC DriverBefore you can connect to a data source in any Pentaho server or client tool, you must first install the appropriatedatabase driver. Your database administrator, Chief Intelligence Officer, or IT manager should be able to provideyou with the proper driver JAR. If not, you can download a JDBC driver JAR file from your database vendor or driverdeveloper's Web site. Once you have the JAR, follow the instructions below to copy it to the driver directories for all ofthe Business Analytics components that need to connect to this data source. See the Compatibility Matrix: SupportedComponents Compatibility Matrix: Supported Components in any of the Installation guides for current version numbers.
Note: Microsoft SQL Server users frequently use an alternative, non-vendor-supported driver called JTDS. Ifyou are adding an MSSQL data source, ensure that you are installing the correct driver.
Backing up old drivers
You must also ensure that there are no other versions of the same vendor's JDBC driver installed in these directories.If there are, you may have to back them up and remove them to avoid confusion and potential class loading problems.This is of particular concern when you are installing a driver JAR for a data source that is the same database typeas your Pentaho solution repository. If you have any doubts as to how to proceed, contact your Pentaho supportrepresentative for guidance.
Installing JDBC drivers
Copy the driver JAR file to the following directories, depending on which servers and client tools you are using(Dashboard Designer, ad hoc reporting, and Analyzer are all part of the BA Server):
Note: For the DI Server: before copying a new JDBC driver, ensure that there is not a different version of thesame JAR in the destination directory. If there is, you must remove the old JAR to avoid version conflicts.
• BA Server: /pentaho/server/biserver-ee/tomcat/lib/• Enterprise Console: /pentaho/server/enterprise-console/jdbc/• Data Integration Server: /pentaho/server/data-integration-server/tomcat/webapps/pentaho-di/
WEB-INF/lib/
• Data Integration client: /pentaho/design-tools/data-integration/libext/JDBC/• Report Designer: /pentaho/design-tools/report-designer/lib/jdbc/• Schema Workbench: /pentaho/design-tools/schema-workbench/drivers/• Aggregation Designer: /pentaho/design-tools/agg-designer/drivers/• Metadata Editor: /pentaho/design-tools/metadata-editor/libext/JDBC/
Note: To establish a data source in the Pentaho Enterprise Console, you must install the driver in both theEnterprise Console and the BA Server or Data Integration Server. If you are just adding a data source throughthe Pentaho User Console, you do not need to install the driver to Enterprise Console.
Restarting
Once the driver JAR is in place, you must restart the server or client tool that you added it to.

| Installing Pentaho Data Integration | 10
Connecting to a Microsoft SQL Server using Integrated or Windows Authentication
The JDBC driver supports Type 2 integrated authentication on Windows operating systems through theintegratedSecurity connection string property. To use integrated authentication, copy the sqljdbc_auth.dll file to allthe directories to which you copied the JDBC files.
The sqljdbc_auth.dll files are installed in the following location:
<installation directory>\sqljdbc_<version>\<language>\auth\
Note: Use the sqljdbc_auth.dll file, in the x86 folder, if you are running a 32-bit Java Virtual Machine (JVM)even if the operating system is version x64. Use the sqljdbc_auth.dll file in the x64 folder, if you are running a64-bit JVM on a x64 processor. Use the sqljdbc_auth.dll file in the IA64 folder, you are running a 64-bit JVM onan Itanium processor.
| Connecting to the Enterprise Repository | 11
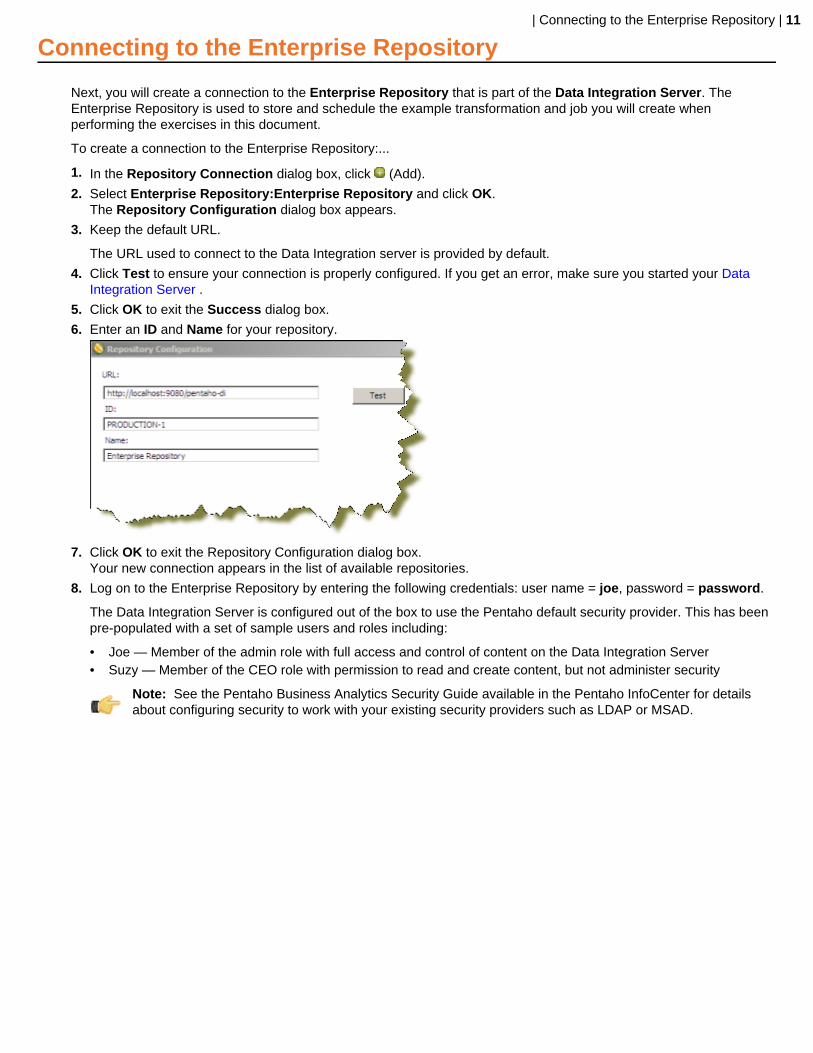
Connecting to the Enterprise Repository
Next, you will create a connection to the Enterprise Repository that is part of the Data Integration Server. TheEnterprise Repository is used to store and schedule the example transformation and job you will create whenperforming the exercises in this document.
To create a connection to the Enterprise Repository:...
1. In the Repository Connection dialog box, click (Add).
2. Select Enterprise Repository:Enterprise Repository and click OK.The Repository Configuration dialog box appears.
3. Keep the default URL.
The URL used to connect to the Data Integration server is provided by default.
4. Click Test to ensure your connection is properly configured. If you get an error, make sure you started your DataIntegration Server .
5. Click OK to exit the Success dialog box.
6. Enter an ID and Name for your repository.
7. Click OK to exit the Repository Configuration dialog box.Your new connection appears in the list of available repositories.
8. Log on to the Enterprise Repository by entering the following credentials: user name = joe, password = password.
The Data Integration Server is configured out of the box to use the Pentaho default security provider. This has beenpre-populated with a set of sample users and roles including:
• Joe — Member of the admin role with full access and control of content on the Data Integration Server• Suzy — Member of the CEO role with permission to read and create content, but not administer security
Note: See the Pentaho Business Analytics Security Guide available in the Pentaho InfoCenter for detailsabout configuring security to work with your existing security providers such as LDAP or MSAD.

| Navigating through the Interface | 12
Navigating through the Interface
The Welcome page contains useful links to documentation, community links for getting involved in the Pentaho DataIntegration project, and links to blogs from some of the top contributors to the Pentaho Data Integration project.
The Spoon Designer is organized into the components described in the table below:

| Navigating through the Interface | 13
Component Name Description
1-Menubar The Menubar provides access to common features suchas properties, actions and tools
2-Main Toolbar The Main Toolbar provides single-click access to commonactions such as create a new file, opening existingdocuments, save and save as. The right side of themain toolbar is also where you can switch betweenperspectives:
• Data Integration — This perspective (shown in theimage above) is used to create ETL transformationsand jobs
• Model — This perspective is used for designingreporting and OLAP metadata models which can betested right from within the Visualization perspective orpublished to the Pentaho BA Server
• Visualize — This perspective allows you to testreporting and OLAP metadata models created in theModel perspective using the Report Design Wizardand Analyzer clients respectively
• Schedule — This perspective is used to managescheduled ETL activities on a Data Integration Server
3-Design Palette While in the Data Integration perspective, the DesignPalette provides an organized list of transformationsteps or job entries used to build transformations andjobs. Transformations are created by simply draggingtransformation steps from the Design Palette onto theGraphical Workspace, or canvas, (4) and connecting themwith hops to describe the flow of data.
4-Graphical Workspace The Graphical Workspace, or canvas, is the main designarea for building transformations and jobs describing theETL activities you want to perform.
5-Sub-toolbar The Sub-toolbar provides buttons for quick access tocommon actions specific to the transformation or job suchas Run, Preview and Debug.
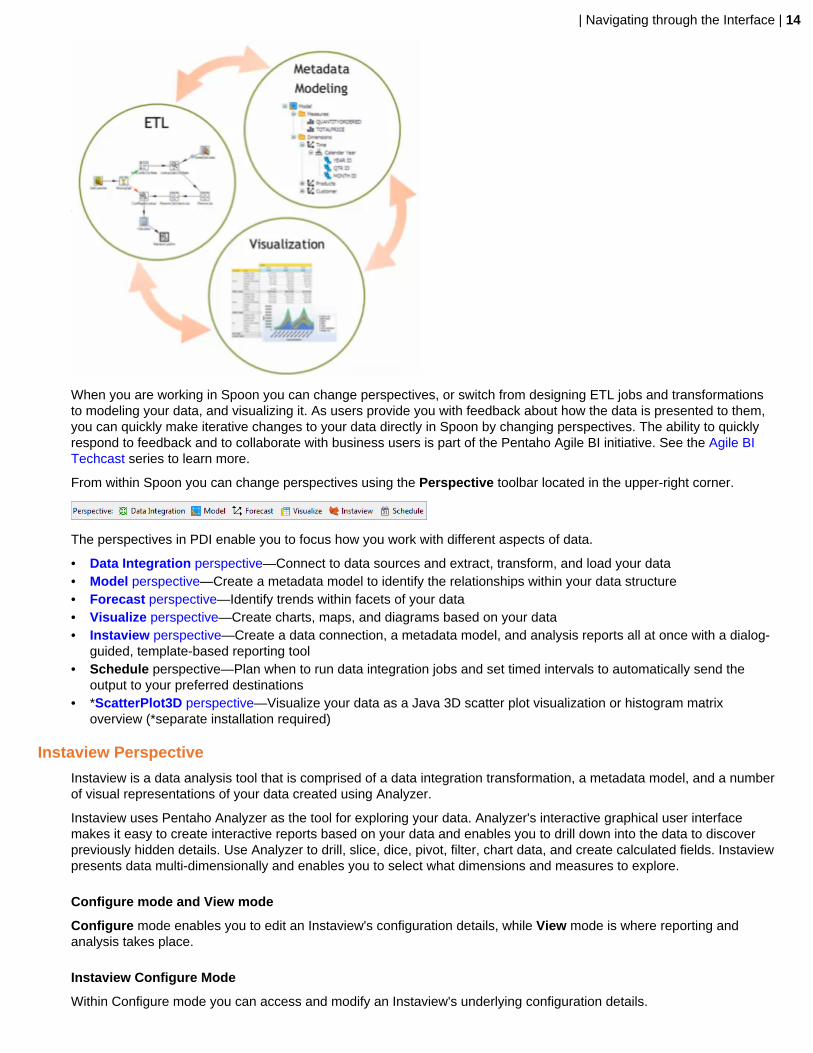
Introducing PerspectivesPentaho Data Integration provides you with tools that include ETL, modeling, and visualization in one unifiedenvironment — the Spoon interface. This integrated environment allows you, as BI developer, to work in closecooperation with business users to build business intelligence solutions more quickly and efficiently.
| Navigating through the Interface | 14
When you are working in Spoon you can change perspectives, or switch from designing ETL jobs and transformationsto modeling your data, and visualizing it. As users provide you with feedback about how the data is presented to them,you can quickly make iterative changes to your data directly in Spoon by changing perspectives. The ability to quicklyrespond to feedback and to collaborate with business users is part of the Pentaho Agile BI initiative. See the Agile BITechcast series to learn more.
From within Spoon you can change perspectives using the Perspective toolbar located in the upper-right corner.
The perspectives in PDI enable you to focus how you work with different aspects of data.
• Data Integration perspective—Connect to data sources and extract, transform, and load your data• Model perspective—Create a metadata model to identify the relationships within your data structure• Forecast perspective—Identify trends within facets of your data• Visualize perspective—Create charts, maps, and diagrams based on your data• Instaview perspective—Create a data connection, a metadata model, and analysis reports all at once with a dialog-
guided, template-based reporting tool• Schedule perspective—Plan when to run data integration jobs and set timed intervals to automatically send the
output to your preferred destinations• *ScatterPlot3D perspective—Visualize your data as a Java 3D scatter plot visualization or histogram matrix
overview (*separate installation required)
Instaview Perspective
Instaview is a data analysis tool that is comprised of a data integration transformation, a metadata model, and a numberof visual representations of your data created using Analyzer.
Instaview uses Pentaho Analyzer as the tool for exploring your data. Analyzer's interactive graphical user interfacemakes it easy to create interactive reports based on your data and enables you to drill down into the data to discoverpreviously hidden details. Use Analyzer to drill, slice, dice, pivot, filter, chart data, and create calculated fields. Instaviewpresents data multi-dimensionally and enables you to select what dimensions and measures to explore.
Configure mode and View mode
Configure mode enables you to edit an Instaview's configuration details, while View mode is where reporting andanalysis takes place.
Instaview Configure Mode
Within Configure mode you can access and modify an Instaview's underlying configuration details.
| Navigating through the Interface | 15
Basic actions
These actions are covered in this guide, and can be completed using the sample data provided in the procedures.
• Configure the data source settings• Clear the data cache• Open, delete, or rename existing Views• Create new Views• Run or refresh the Instaview data• Clear the data cache
Advanced actions
The advanced actions allow you to customize your Instaview for more specific use cases, but require a more technicalunderstanding of Pentaho Data Integration, Data Sources and Metadata.
• Switch to the full Pentaho Data Integration transformation perspective• Launch the model perspective
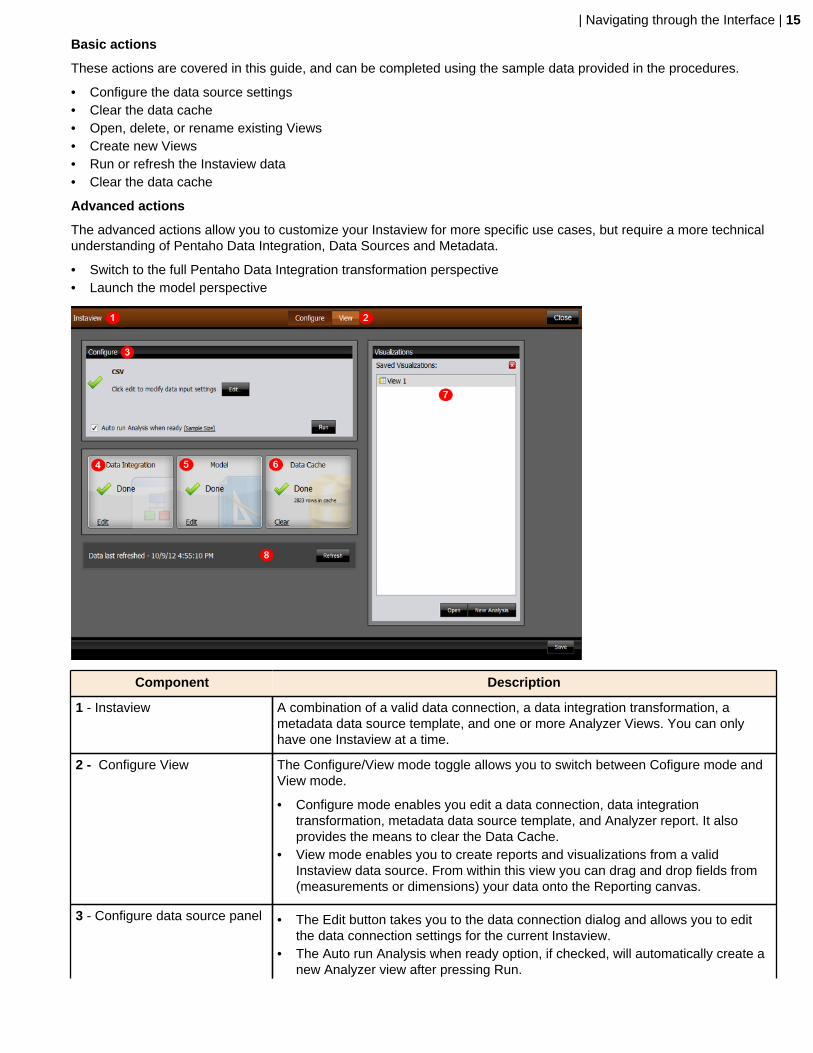
Component Description
1 - Instaview A combination of a valid data connection, a data integration transformation, ametadata data source template, and one or more Analyzer Views. You can onlyhave one Instaview at a time.
2 - Configure View The Configure/View mode toggle allows you to switch between Cofigure mode andView mode.
• Configure mode enables you edit a data connection, data integrationtransformation, metadata data source template, and Analyzer report. It alsoprovides the means to clear the Data Cache.
• View mode enables you to create reports and visualizations from a validInstaview data source. From within this view you can drag and drop fields from(measurements or dimensions) your data onto the Reporting canvas.
3 - Configure data source panel • The Edit button takes you to the data connection dialog and allows you to editthe data connection settings for the current Instaview.
• The Auto run Analysis when ready option, if checked, will automatically create anew Analyzer view after pressing Run.

| Navigating through the Interface | 16
Component Description
• The Run button lets you manually start the Instaview data transformation.Pressing Run will modify the data integration transformation or metadata modelif changes were made within the Configure panel, if necessary.
4 - Data Integration panel Provides the means to access and edit the data integration transformation for thecurrent Instaview. Editing will open the Data Integration perspective in PDI.
5 - Model panel Enables you to edit the metadata model for the current Instaview. Editing will openthe Model perspective in PDI.
6 - Data Cache panel Provides the means to clear the data cache.
7 - Visualizations panel Displays existing Views and provides the means to open existing, create new, anddelete Instaviews. You can also rename an existing visualization by right-clicking anitem within this panel.
8 - Refresh display Displays when the current Instaview was last run. If your data is connected to a livedata source this displays the last time the data was accessed by Instaview.
The Refresh button provides the means to manually refresh the current Instaview.
Instaview View Mode
Within View mode you are able to drag and drop data onto the Analyzer canvas to interactively explore your data.Instaview offers many ways to visually display data, such as maps, charts, and grids. You may have multiple Viewsopen for editing at a time, but you may only have one Instaview open at a time.
Component Description
1 - View A View relies on the data source connection, metadata model, and the Analyzercanvas (Pentaho Analyzer) to enable you to explore and visualize your data. Createtables from transformed data by dragging fields from the Available fields panel tothe Analyzer canvas (or Layout panel). Drill, slice, dice, pivot, filter, chart data, andcreate calculated fields to discover previously hidden details with the tools andmenus on the Analyzer toolbar.
2 - Available fields panel Displays fields within a connected data source.
• The thin yellow steps represent levels within the data hierarchy (text fields).Levels are hierarchical groups of dimensions, which are facets of your data thatcan be measured. For instance, within a time dimension there are different levelsof measurement such as year, quarter, month, or day.

| Navigating through the Interface | 17
Component Description
• The blue carpenter squares represent measurements within the data hierarchy(number fields). Measures are quantitative values about your data and are alsoreferred to as facts.
3 - Layout panel Enables you to drag levels and measures into the correct areas of a report.Displays which fields are in use within a View.
4 - Analyzer toolbar Enables you to specify how your data is displayed based on user-defined values.Applying filters changes the way the data is displayed on the Analyzer canvas. Youcan also drag and drop levels or dimensions onto this toolbar to filter your data.
5 - Switch to table/chart format Enables you to switch the format of your data as either a report or a chart.
6 - Analyzer canvas An interactive graphical workspace that serves as the main design area for buildingAnalyzer reports within Instaview.
7 - Properties panel Enables you to configure report and visualization properties to customize analysiscontent.
Supported formats and data sources
Instaview comes with pre-configured templates that give you instant connectivity to the most popular data sources.
• Local Files - Load existing Excel spreadsheets or CSV files.• Relational Databases - Working with JDBC 3 compliant databases in Instaview enables you to analyze your data
even without in-depth knowledge of how your database is structured.• Big Data - Cassandra, Hadoop, Hive, or MongoDB are easily integrated.

| Creating Transformations | 18
Creating Transformations
The Data Integration perspective of Spoon allows you to create two basic document types: transformations and jobs.Transformations are used to describe the data flows for ETL such as reading from a source, transforming data andloading it into a target location. Jobs are used to coordinate ETL activities such as defining the flow and dependenciesfor what order transformations should be run, or prepare for execution by checking conditions such as, "Is my sourcefile available?," or "Does a table exist in my database?"
This exercise will step you through building your first transformation with Pentaho Data Integration introducing commonconcepts along the way. The exercise scenario includes a flat file (CSV) of sales data that you will load into a databaseso that mailing lists can be generated. Several of the customer records are missing postal codes (zip codes) that mustbe resolved before loading into the database. The logic looks like this:
Retrieving Data from a Flat File (Text File Input Step)Follow the instructions below to retrieve data from a flat file.
1. Click New in the upper left corner of the Spoon graphical interface.
2. Select Transformation from the list.
3. Under the Design tab, expand the Input node; then, select and drag a Text File Input step onto the canvas on theright.
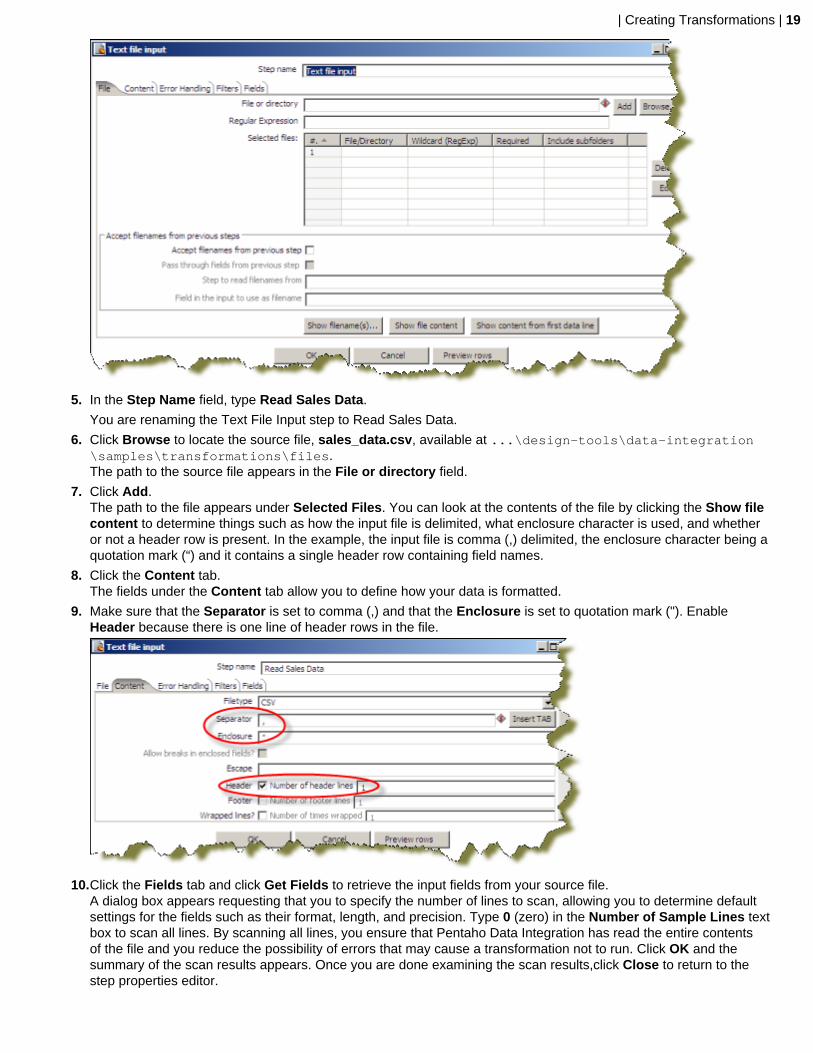
4. Double-click on the Text File input step.The edit properties dialog box associated with the Text File input step appears. In this dialog box, you specify theproperties related to a particular step.
| Creating Transformations | 19
5. In the Step Name field, type Read Sales Data.
You are renaming the Text File Input step to Read Sales Data.
6. Click Browse to locate the source file, sales_data.csv, available at ...\design-tools\data-integration\samples\transformations\files.The path to the source file appears in the File or directory field.
7. Click Add.The path to the file appears under Selected Files. You can look at the contents of the file by clicking the Show filecontent to determine things such as how the input file is delimited, what enclosure character is used, and whetheror not a header row is present. In the example, the input file is comma (,) delimited, the enclosure character being aquotation mark (“) and it contains a single header row containing field names.
8. Click the Content tab.The fields under the Content tab allow you to define how your data is formatted.
9. Make sure that the Separator is set to comma (,) and that the Enclosure is set to quotation mark ("). EnableHeader because there is one line of header rows in the file.
10.Click the Fields tab and click Get Fields to retrieve the input fields from your source file.A dialog box appears requesting that you to specify the number of lines to scan, allowing you to determine defaultsettings for the fields such as their format, length, and precision. Type 0 (zero) in the Number of Sample Lines textbox to scan all lines. By scanning all lines, you ensure that Pentaho Data Integration has read the entire contentsof the file and you reduce the possibility of errors that may cause a transformation not to run. Click OK and thesummary of the scan results appears. Once you are done examining the scan results,click Close to return to thestep properties editor.
| Creating Transformations | 20
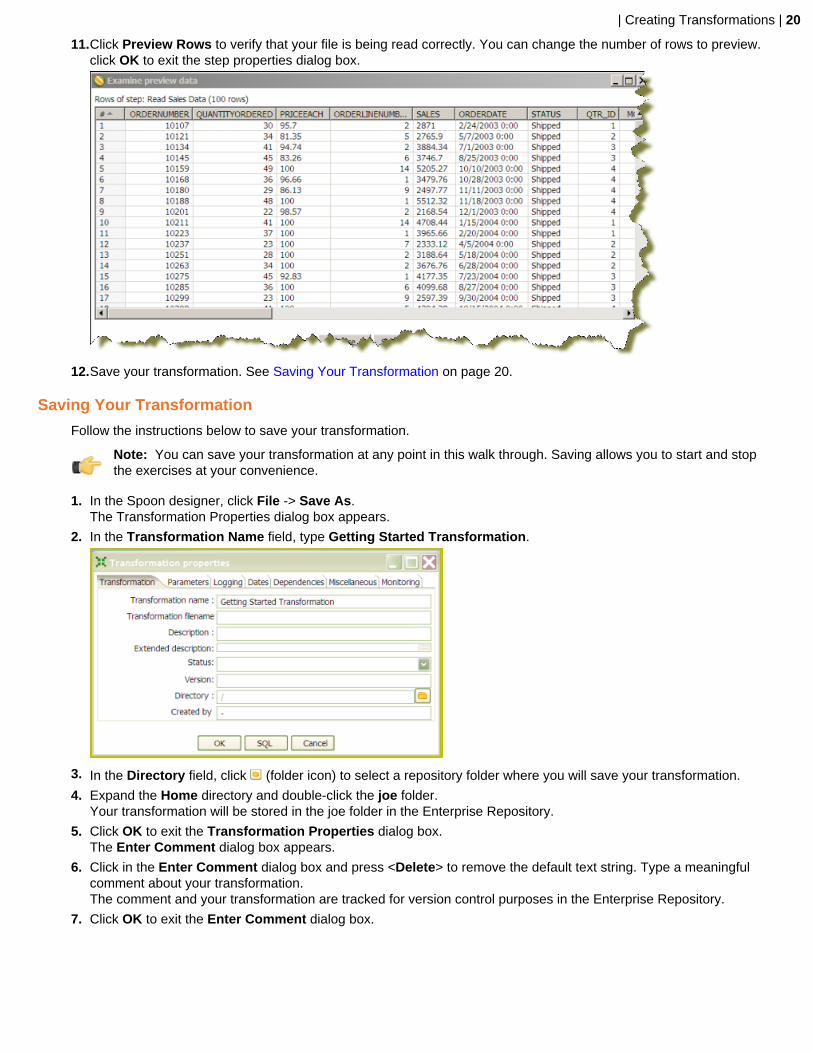
11.Click Preview Rows to verify that your file is being read correctly. You can change the number of rows to preview.click OK to exit the step properties dialog box.
12.Save your transformation. See Saving Your Transformation on page 20.
Saving Your Transformation
Follow the instructions below to save your transformation.
Note: You can save your transformation at any point in this walk through. Saving allows you to start and stopthe exercises at your convenience.
1. In the Spoon designer, click File -> Save As.The Transformation Properties dialog box appears.
2. In the Transformation Name field, type Getting Started Transformation.
3. In the Directory field, click (folder icon) to select a repository folder where you will save your transformation.
4. Expand the Home directory and double-click the joe folder.Your transformation will be stored in the joe folder in the Enterprise Repository.
5. Click OK to exit the Transformation Properties dialog box.The Enter Comment dialog box appears.
6. Click in the Enter Comment dialog box and press <Delete> to remove the default text string. Type a meaningfulcomment about your transformation.The comment and your transformation are tracked for version control purposes in the Enterprise Repository.
7. Click OK to exit the Enter Comment dialog box.
| Creating Transformations | 21
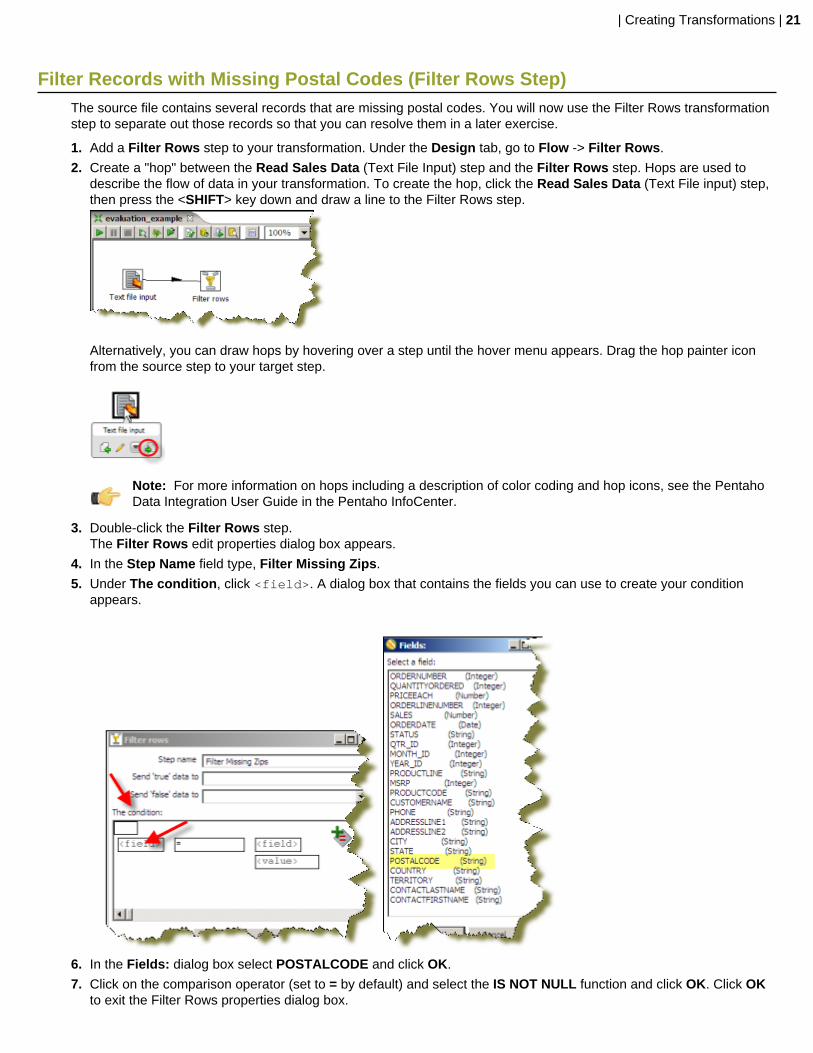
Filter Records with Missing Postal Codes (Filter Rows Step)The source file contains several records that are missing postal codes. You will now use the Filter Rows transformationstep to separate out those records so that you can resolve them in a later exercise.
1. Add a Filter Rows step to your transformation. Under the Design tab, go to Flow -> Filter Rows.
2. Create a "hop" between the Read Sales Data (Text File Input) step and the Filter Rows step. Hops are used todescribe the flow of data in your transformation. To create the hop, click the Read Sales Data (Text File input) step,then press the <SHIFT> key down and draw a line to the Filter Rows step.
Alternatively, you can draw hops by hovering over a step until the hover menu appears. Drag the hop painter iconfrom the source step to your target step.
Note: For more information on hops including a description of color coding and hop icons, see the PentahoData Integration User Guide in the Pentaho InfoCenter.
3. Double-click the Filter Rows step.The Filter Rows edit properties dialog box appears.
4. In the Step Name field type, Filter Missing Zips.
5. Under The condition, click <field>. A dialog box that contains the fields you can use to create your conditionappears.
6. In the Fields: dialog box select POSTALCODE and click OK.
7. Click on the comparison operator (set to = by default) and select the IS NOT NULL function and click OK. Click OKto exit the Filter Rows properties dialog box.

| Creating Transformations | 22
Note: You will return to this step later and configure the Send true data to step and Send false data tostep settings after adding their target steps to your transformation.
8. Save your transformation.
Loading Your Data into a Relational Database (Table Output Step)In this exercise you will take all records exiting the Filter rows step where the POSTALCODE was not null (the truecondition) and load them into a database table.
1. Under the Design tab, expand the contents of the Output node.
2. Click and drag a Table Output step into your transformation; create a hop between the Filter Missing Zips (FilterRows) and Table Output steps. Select Result is TRUE.
3. Double-click the Table Output step to open its edit properties dialog box.
4. Rename your Table Output Step to Write to Database.
5. Click New next to the Connection field. You must create a connection to the database.The Database Connection dialog box appears.
6. Provide the settings for connecting to the database as shown in the table below.
| Creating Transformations | 23
Connection Name Type, Sample Data
Connection Type: Choose, H2
Host Name localhost
Database Name Type sampledata
Port Number 9092
User Name sa
Password blank/no password
7. Click Test to make sure your entries are correct. A success message appears. Click OK.
Note: If you get an error when testing your connection, ensure that you have provided the correct settingsinformation as described in the table and that the sample database is running. See Starting Pentaho DataIntegration for information about how to start the Data Integration Servers.
8. Click OK, to exit the Database Connections dialog box.
9. Type SALES_DATA in the Target Table text field.
This table does not exist in the target database. In the next steps you will generate the Data Definition Language(DDL) to create the table and execute it. DDL are the SQL commands that define the different structures in adatabase such as CREATE TABLE.
10.In the Write to Database edit properties dialog box, enable the Truncate Table property.
11.Click SQL to generate the DDL for creating your target table.
12.Click Execute to run the SQL.A results dialog box apperas indicating that one SQL statement was executed. Click OK close the execution dialogbox. Click Close to close the Simple SQL editor dialog box. Click OK to close the Table Output edit properties dialogbox.
13.Save your transformation.
Retrieving Data from your Lookup File (Text File Input Step)You have been provided a second text file containing a list of cities, states, and postal codes that you will now use tolook up the postal codes for all of the records where they were missing (the ‘false’ branch of your Filter rows step).First, you will use a Text file input step to read from the source file, next you will use a Stream lookup step to bring theresolved Postal Codes into the stream.
1. Add a new Text File Input step to your transformation. In this step you will retrieve the records from your lookup file.
2. Rename your Text File input step to, Read Postal Codes.
3. Click Browse to locate the source file, Zipssortedbycitystate.csv, located at ...\design-tools\data-integration\samples\transformations\files.
4. Click Add.The path to the file appears under Selected Files.
Note: Click Show File Content to view the contents of the file. This file is comma (,) delimited, with anenclosure of quotation mark (“), and contains a single header row.
5. Under the Content tab, enable the Header option. Change the separator character to a comma (,). and confirm thatthe enclosure setting is correct.
6. Under the Fields tab, click Get Fields to retrieve the data from your .csv file.
7. Click Preview Rows to make sure your entries are correct and click OK to exit the Text File input properties dialogbox.

| Creating Transformations | 24
8. Save your transformation.
Resolving Missing Zip Code Information (Stream Lookup Step)In this exercise, you will begin to resolve the missing zip codes.
1. Add a Stream Lookup step to your transformation. Under the Design tab, expand the Lookup folder and chooseStream Lookup.
2. Draw a hop between the Filter Missing Zips (Filter rows) and Stream Lookup steps. Select the Result is FALSE.
3. Create a hop from the Read Postal Codes step (Text File input) to the Stream lookup step.
4. Double-click on the Stream lookup step to open its edit properties dialog box.
5. Rename Stream Lookup to Lookup Missing Zips.
6. Select the Read Postal Codes (Text File input) as the Lookup step.
7. Define the CITY and STATE fields in the key(s) to look up the value(s) table. Click the drop down in the Fieldcolumn and select CITY. Then, click in the LookupField column and select CITY. Perform the same actions todefine the second key based on the STATE fields coming in on the source and lookup streams:

| Creating Transformations | 25
8. Click Get Lookup Fields. POSTALCODE is the only field you want to retrieve. (To delete the extra CITY andSTATE lines, right-click in the line and select Delete Selected Line.) Give POSTALCODE a new name ofZIP_RESOLVED and make sure the Type is set to String. Click OK to close the Stream Lookup edit propertiesdialog box.
9. Save your transformation.
You can now select the Lookup Missing Zips step (Stream lookup ) in the graphical workspace. Right-click andselect Preview to display the preview/debugger dialog box. Click Quick Launch to preview the data flowing throughthis step. Notice that the new field, ZIP_RESOLVED, has been added to the stream containing your resolved postalcodes.
Completing your Transformation (Select Values Step)The last task is to clean up the field layout on your lookup stream so that it matches the format and layout of your otherstream going to the Write to Database (Table output) step. You will create a Select values step. This is a very usefulstep for renaming fields on the stream, removing unnecessary fields, and more.
1. Add a Select Values step to your transformation. Expand the Transform folder and choose Select Values.
2. Create a hop between the Lookup Missing Zips and Select Values steps.
3. Double-click the Select Values step to open its properties dialog box.
4. Rename the Select Values step to, Prepare Field Layout.
5. Click Get fields to select to retrieve all fields and begin modifying the stream layout.
6. Select the ZIP_RESOLVED field in the Fields list and use <CTRL><UP> to move it just below the POSTALCODEfield (the one that still contains null values).
7. Select the old POSTALCODE field in the list (line 20) and delete it.
8. The original POSTALCODE field was formatted as an 9-character string. You must modify your new field to matchthe form. Click the Meta-Data tab.
9. In the first row of the Fields to alter table, click in the Fieldname column and select ZIP_RESOLVED.
10.Type POSTALCODE in the Rename to column; select String in the Type column, and type 9 in the Length column.Click OK to exit the edit properties dialog box.
11.Draw a hop from the Prepare Field Layout (Select values) step to the Write to Database (Table output) step.
12.Save your transformation.

| Creating Transformations | 26
Running Your TransformationPentaho Data Integration provides a number of deployment options depending on the needs of your ETL project interms of performance, batch load window, and so on. The three most common approaches are:
Local execution Allows you to execute a transformation or job from withinthe Spoon design environment (on your local machine).This is ideal for designing and testing transformations orlightweight ETL activities
Execute remotely For more demanding ETL activities, consider setting up adedicated Enterprise Edition Data Integration Server andusing the Execute remotely option in the run dialog. TheEnterprise Edition Data Integration Server also enablesyou to schedule execution in the future or on a recurringbasis.
Execute clustered For even greater scalability or as an option to reduce yourexecution times, Pentaho Data Integration also supportsthe notion of clustered execution allowing you to distributethe load across a number of data integration servers.
This final part of the creating a transformation exercise focuses exclusively on the local execution option. For moreinformation on remote, clustered and other execution options review the links in the additional resources section later inthis guide or in the Pentaho Data Integration User Guide in the Pentaho InfoCenter.
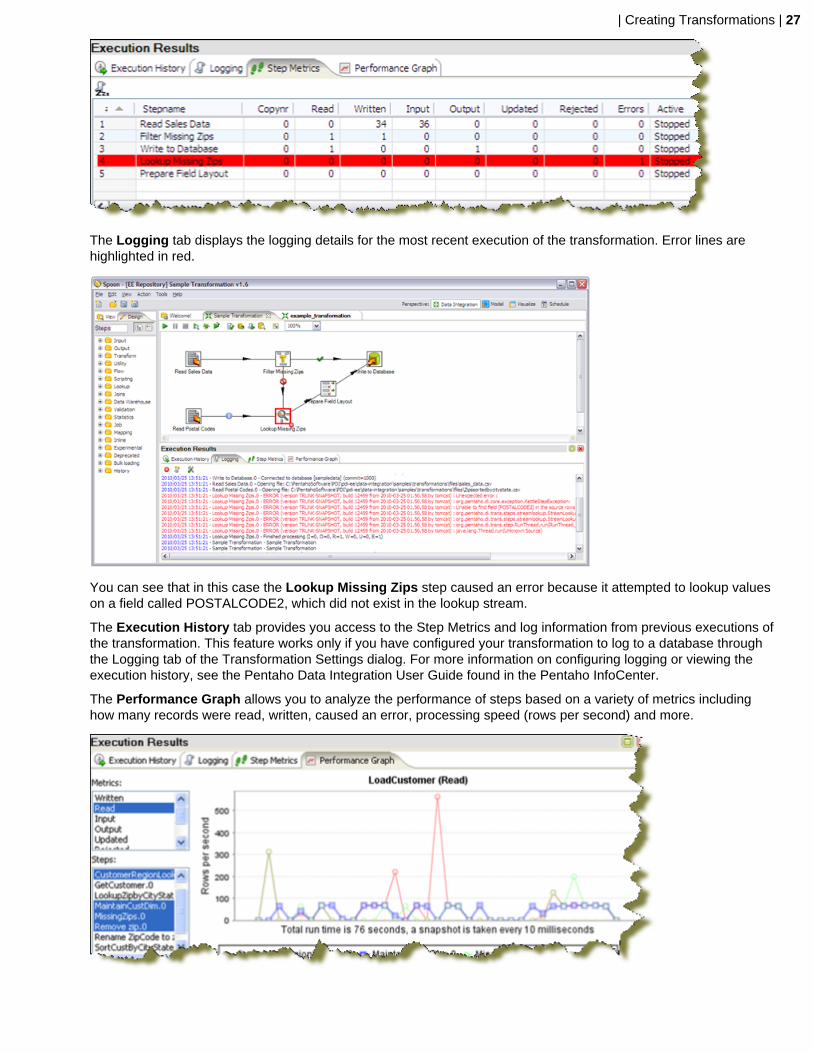
1. In the Spoon graphical interface, click Run This Transformation.The Execute a Transformation dialog box appears. You can run a transformation locally, remotely, or in a clusteredenvironment. For the purposes of this exercise, keep the default Local Execution.
2. Click Launch.The transformation executes. Upon running the transformation, the Execution Results panel opens below thegraphical workspace.
The Step Metrics tab provides statistics for each step in your transformation including how many records wereread, written, caused an error, processing speed (rows per second) and more. If any of the steps caused thetransformation to fail, they would be highlighted in red as shown below.
| Creating Transformations | 27
The Logging tab displays the logging details for the most recent execution of the transformation. Error lines arehighlighted in red.
You can see that in this case the Lookup Missing Zips step caused an error because it attempted to lookup valueson a field called POSTALCODE2, which did not exist in the lookup stream.
The Execution History tab provides you access to the Step Metrics and log information from previous executions ofthe transformation. This feature works only if you have configured your transformation to log to a database throughthe Logging tab of the Transformation Settings dialog. For more information on configuring logging or viewing theexecution history, see the Pentaho Data Integration User Guide found in the Pentaho InfoCenter.
The Performance Graph allows you to analyze the performance of steps based on a variety of metrics includinghow many records were read, written, caused an error, processing speed (rows per second) and more.

| Creating Transformations | 28
Like the Execution History, this feature requires you to configure your transformation to log to a database throughthe Logging tab of the Transformation Settings dialog box. For more information on configuring logging orperformance monitoring, see the Pentaho Data Integration User Guide found in the Pentaho InfoCenter.

| Creating Jobs | 29
Creating Jobs
Jobs are used to coordinate ETL activities such as:
• Defining the flow and dependencies for what order transformations should be run• Preparing for execution by checking conditions such as, "Is my source file available?," or "Does a table exist?"• Performing bulk load database operations• File Management such as posting or retrieving files using FTP, copying files and deleting files• Sending success or failure notifications through email
For this exercise, imagine that an external system is responsible for placing your sales_data.csv input in its sourcelocation every Saturday night at 9 p.m. You want to create a job that will check to see that the file has arrived and runyour transformation to load the records into the database. In a subsequent exercise, you will schedule the job to be runevery Sunday morning at 9 a.m.
1. Click (New) in the upper left corner of the Spoon graphical interface.
2. Select Job from the list.
3. Expand the General folder and drag a Start job entry onto the graphical workspace..
The Start job entry defines where the execution will begin.
4. Expand the Conditions folder and add a File Exists job entry.
5. Draw a hop from the Start job entry to the File Exists job entry.
6. Double-click the File Exists job entry to open its edit properties dialog box. Click Browse and select thesales_data.csv from the following location: ...\design-tools\data-integration\samples\transformations\files.
Be sure to set the filter to CSV files to see the file.
7. Expand the General folder and add a Transformation job entry.
8. Draw a hop between the File Exists and the Transformation job entries.
9. Double-click the Transformation job entry to open its edit properties dialog box.
10.Select the Specify by name and directory option. Click Browse.
11.Expand the repository tree to find your sample transformation. Select it and click OK. You likely have yourtransformation stored under the "joe," (not public), folder.

| Creating Jobs | 30
12.Save your transformation as Sample Job.
13.Click Run Job. When the Execute a Job dialog box appears, choose Local Execution and click Launch.
The Execution Results panel should open showing you the job metrics and log information for the job execution.

| Scheduling Jobs | 31
Scheduling Jobs
The Enterprise Edition Pentaho Data Integration Server provides scheduling services allowing you to schedule theexecution of jobs and transformations in the future or on a recurring basis. In this example, you will create a schedulethat runs your Sample Job every Sunday morning at 9 o'clock.
1. Open your sample job.
2. In the menubar, go to Action -> Schedule.The Schedule dialog box appears.
3. For the Start option, select the Date, click the calendar icon. When the calendar appears, choose the next Sunday.
4. Under the Repeat section, select the Weekly option. Enable the Sunday check box.
5. For the End date, select Date and then enter a date several weeks in the future using the calendar picker.
6. Click OK to complete your schedule.
Note: The scheduler includes full support for Pentaho Data Integration's parameters, arguments, andvariables. For more detailed information on scheduling options, please refer to the Pentaho Data IntegrationUser Guide found in the Pentaho InfoCenter.
7. To view, edit and manage all scheduled activities, click the Schedule perspective on the main toolbar. Here you canview a list of all schedules along with information such as when the next scheduled run will take place, when the lastrun took place and its duration and who scheduled the activity.
8. If the scheduler is stopped, you must click Start Scheduler on the sub-toolbar. If the button appears with a red stopicon, the scheduler is already running. Your scheduled activity will take place as indicated at the Next Run time.
Note: You can also start and stop individual schedules by selecting them in the table and using the Start andStop buttons on the sub-toolbar.

| Building Business Intelligence Solutions Using Agile BI | 32
Building Business Intelligence Solutions Using Agile BI
Historically, starting new Business Intelligence projects required careful consideration of a broad set of factors including:
Data Considerations
• Where is my data coming from?• Where will it be stored?• What cleansing and enrichment is necessary to address the business needs?
Information Delivery Consideration
• Will information be delivered through static content like pre-canned reports and dashboards?• Will users need the ability to build their own reports or perform interactive analysis on the data?
Skill Set Considerations
• If users need self-service reporting and analysis, what skill sets do you expect them to have?• Assuming the project involves some combination of ETL, content creation for reports and dashboards, and meta-
data modeling to enable business users to create their own content, do we have all the tools and skill sets to buildthe solution in a timely fashion?
Cost
• How many tools and from how many vendors will it take to implement the total solution?• If expanding the use of a BI tool already in house, what are the additional licensing costs associated with rolling it out
to a new user community?• What are the costs in both time and money to train up on all tools necessary to roll out the solution?• How long is the project going to take and when will we start seeing some ROI?
Because of this, many new projects are scratched before they even begin. Pentaho’s Agile BI initiative seeks to breakdown the barriers to expanding your use of Business Intelligence through an iterative approach to scoping, prototyping,and building complete BI solutions. It is an approach that centers on the business needs first, empowers the businessusers to get involved at every phase of development, and prevents projects from going completely off track from theoriginal business goals.
In support of the Agile BI methodology, the Spoon design environment provides an integrated design environment forperforming all tasks related to building a BI solution including ETL, reporting and OLAP metadata modeling and enduser visualization. In a single click, Business users will instantly be able to start interacting with data, building reportswith zero knowledge of SQL or MDX, and work hand in hand with solution architects to refine the solution.
Using Agile BIThis exercise builds upon your sample transformation and highlights the power an integrated design environment canprovide for building solutions using Agile BI.
For this example, your business users have asked to see what the top 10 countries are based on sales. Furthermore,they want the data broken down by deal size where small deals are those less than $3,000, medium sized deals arebetween $3,000 and $7,000, and large deals are over $7,000.
1. Open or select the tab containing the sample transformation you just created.
2. Right-click the Write to Database (Table Output) step, and select Visualize -> Analyzer.In the background, Pentaho Data Integration automatically generates the OLAP model that allows you to begininteracting immediately with your new data source.
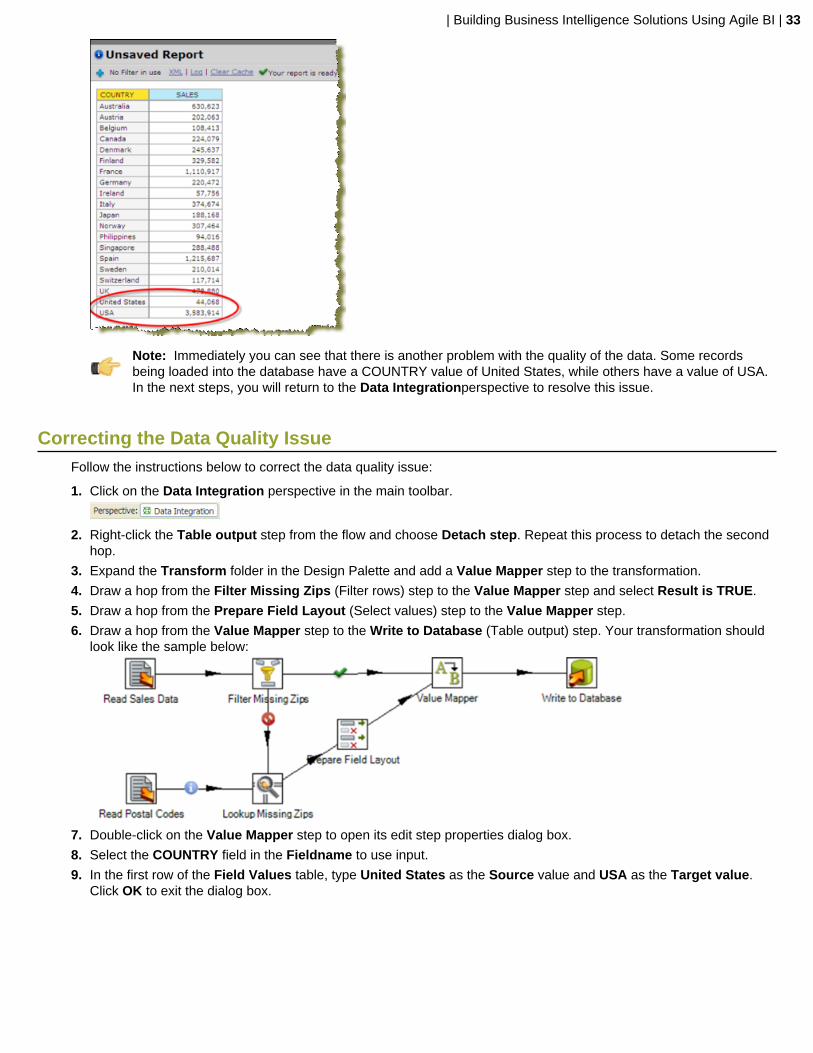
3. Drag the COUNTRY field from the Field list on the left onto the report.
4. Drag the SALES measure from the Field list onto the report.
| Building Business Intelligence Solutions Using Agile BI | 33
Note: Immediately you can see that there is another problem with the quality of the data. Some recordsbeing loaded into the database have a COUNTRY value of United States, while others have a value of USA.In the next steps, you will return to the Data Integrationperspective to resolve this issue.
Correcting the Data Quality IssueFollow the instructions below to correct the data quality issue:
1. Click on the Data Integration perspective in the main toolbar.
2. Right-click the Table output step from the flow and choose Detach step. Repeat this process to detach the secondhop.
3. Expand the Transform folder in the Design Palette and add a Value Mapper step to the transformation.
4. Draw a hop from the Filter Missing Zips (Filter rows) step to the Value Mapper step and select Result is TRUE.
5. Draw a hop from the Prepare Field Layout (Select values) step to the Value Mapper step.
6. Draw a hop from the Value Mapper step to the Write to Database (Table output) step. Your transformation shouldlook like the sample below:
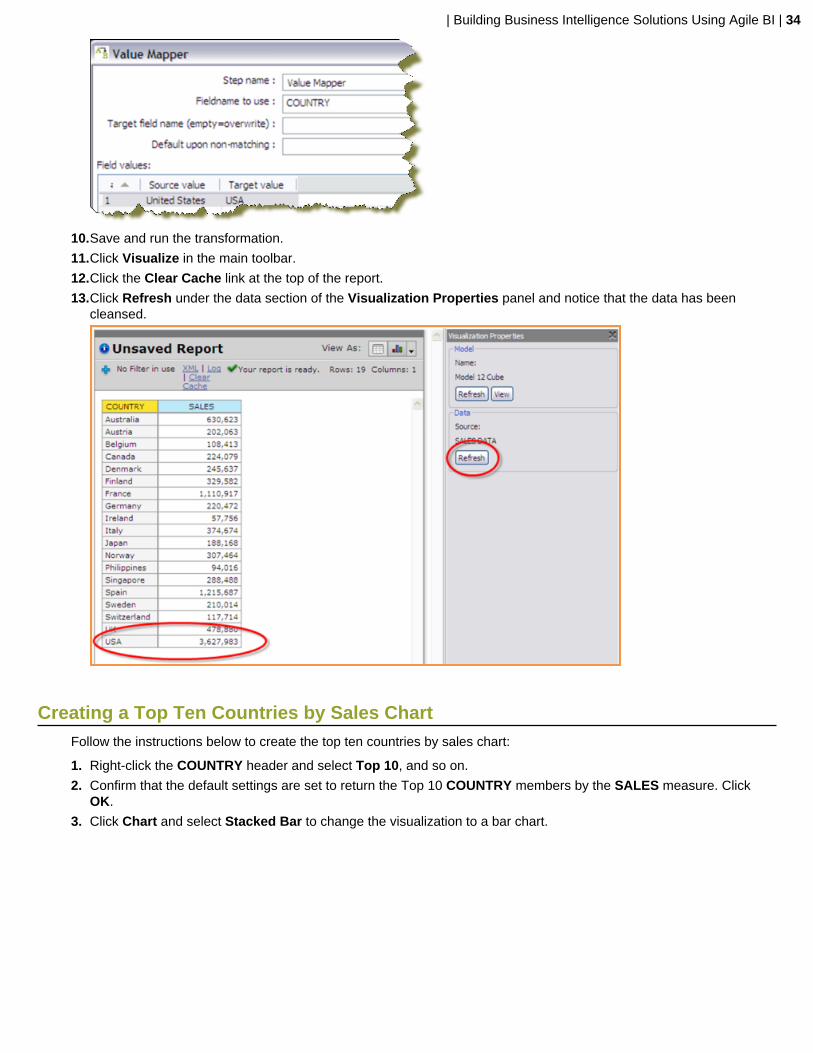
7. Double-click on the Value Mapper step to open its edit step properties dialog box.
8. Select the COUNTRY field in the Fieldname to use input.
9. In the first row of the Field Values table, type United States as the Source value and USA as the Target value.Click OK to exit the dialog box.
| Building Business Intelligence Solutions Using Agile BI | 34
10.Save and run the transformation.
11.Click Visualize in the main toolbar.
12.Click the Clear Cache link at the top of the report.
13.Click Refresh under the data section of the Visualization Properties panel and notice that the data has beencleansed.
Creating a Top Ten Countries by Sales ChartFollow the instructions below to create the top ten countries by sales chart:
1. Right-click the COUNTRY header and select Top 10, and so on.
2. Confirm that the default settings are set to return the Top 10 COUNTRY members by the SALES measure. ClickOK.
3. Click Chart and select Stacked Bar to change the visualization to a bar chart.

| Building Business Intelligence Solutions Using Agile BI | 35
Breaking Down Your Chart by Deal SizeYour source data does not contain an attribute for Deal Size, so you will use the Data Integration perspective to addthe new field.
1. Click Data Integration in the main toolbar.
2. Expand the Transform folder and drag a Number Range step onto the graphical workspace between the ValueMapper step and the Write to Database (Table Output) step. Click Yes to split the hop.
3. Double-click Number range to open its edit properties dialog box.
4. Choose the SALES field as your Input field.
5. Type DEAL SIZE as the name for the Output field.
6. In the Ranges table, define number ranges as shown in the example below. Click OK.
Note: Because this step will be adding new field into the stream, you must update your target database tableto add the new column in the next steps.
7. Double-click on the Write to Database (Table output) step.
8. Click SQL to generate the DDL necessary to update the target table.
9. Click Execute to run the SQL. Click OK to close the results dialog box. Click Close to exit the Simple SQL Editordialog box. Click OK to close the edit step properties dialog.
| Building Business Intelligence Solutions Using Agile BI | 36
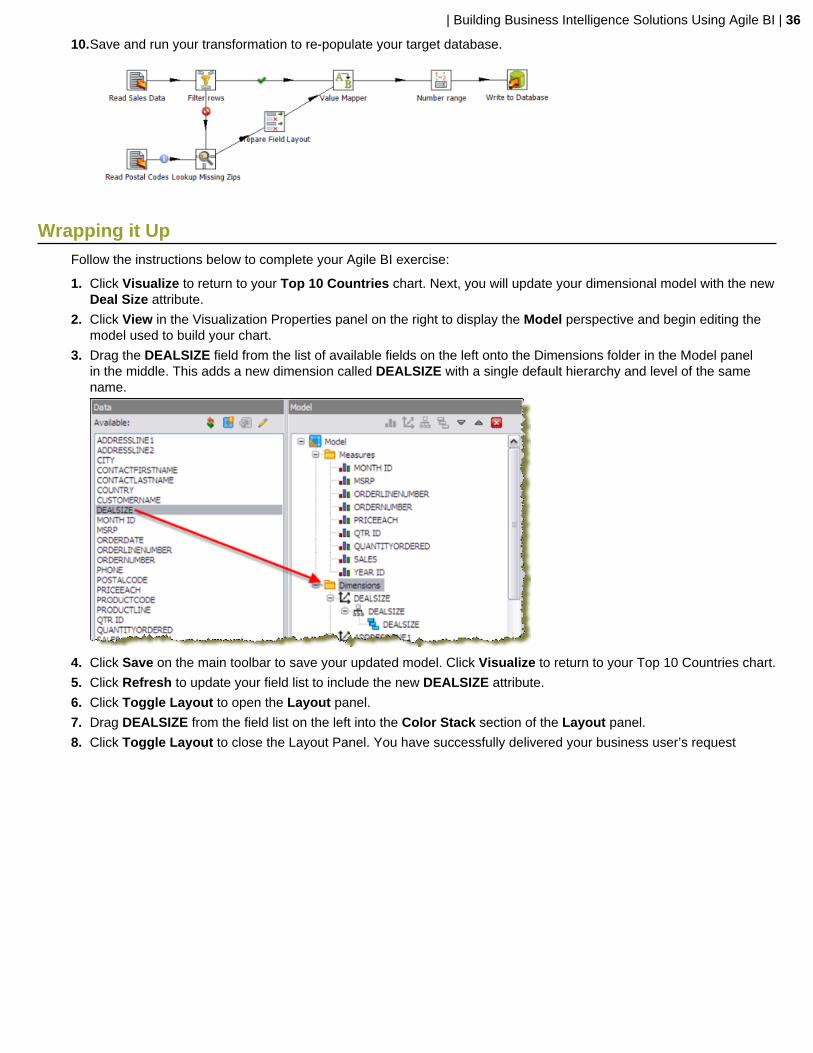
10.Save and run your transformation to re-populate your target database.
Wrapping it UpFollow the instructions below to complete your Agile BI exercise:
1. Click Visualize to return to your Top 10 Countries chart. Next, you will update your dimensional model with the newDeal Size attribute.
2. Click View in the Visualization Properties panel on the right to display the Model perspective and begin editing themodel used to build your chart.
3. Drag the DEALSIZE field from the list of available fields on the left onto the Dimensions folder in the Model panelin the middle. This adds a new dimension called DEALSIZE with a single default hierarchy and level of the samename.
4. Click Save on the main toolbar to save your updated model. Click Visualize to return to your Top 10 Countries chart.
5. Click Refresh to update your field list to include the new DEALSIZE attribute.
6. Click Toggle Layout to open the Layout panel.
7. Drag DEALSIZE from the field list on the left into the Color Stack section of the Layout panel.
8. Click Toggle Layout to close the Layout Panel. You have successfully delivered your business user’s request

| Building Business Intelligence Solutions Using Agile BI | 37

| Getting Started with PDI and Hadoop | 38
Getting Started with PDI and Hadoop
Pentaho provides a complete big data analytics solution that supports the entire big data analytics process. From bigdata aggregation, preparation, and integration, to interactive visualization, analysis, and prediction, Pentaho allows youto harvest the meaningful patterns buried in big data stores. Analyzing your big data sets gives you the ability to identifynew revenue sources, develop loyal and profitable customer relationships, and run your organization more efficientlyand cost effectively.
Pentaho, Big Data, and HadoopThe term big data applies to very large, complex, or dynamic datasets that need to be stored and managed over a longtime. To derive benefits from big data, you need the ability to access, process, and analyze data as it is being created.However, the size and structure of big data makes it very inefficient to maintain and process it using traditional relationaldatabases.
Big data solutions re-engineer the components of traditional databases—data storage, retrieval, query, processing—and massively scales them.
Pentaho Big Data Overview
Pentaho increases speed-of-thought analysis against even the largest of big data stores by focusing on the featuresthat deliver performance.
• Instant access—Pentaho provides visual tools to make it easy to define the sets of data that are important to youfor interactive analysis. These data sets and associated analytics can be easily shared with others, and as newbusiness questions arise, new views of data can be defined for interactive analysis.
• High performance platform—Pentaho is built on a modern, lightweight, high performance platform. This platformfully leverages 64-bit, multi-core processors and large memory spaces to efficiently leverage the power ofcontemporary hardware.
• Extreme-scale, in-memory caching—Pentaho is unique in leveraging external data grid technologies, such asInfinispan and Memcached to load vast amounts of data into memory so that it is instantly available for speed-of-thought analysis.
• Federated data integration—Data can be extracted from multiple sources, including big data and traditional datastores, integrated together and then flowed directly into reports, without needing an enterprise data warehouse ordata mart.
About HadoopThe Apache Hadoop software library is a framework that allows for the distributed processing of large data sets acrossclusters of computers using simple programming models. It is designed to scale up from single servers to thousandsof machines, each offering local computation and storage. Rather than rely on hardware to deliver high-availability, thelibrary itself is designed to detect and handle failures at the application layer, so delivering a highly-available service ontop of a cluster of computers, each of which may be prone to failures.
A Hadoop platform consists of a Hadoop kernel, a MapReduce model, a distributed file system, and often a number ofrelated projects—such as Apache Hive, Apache HBase, and others.
A Hadoop Distributed File System, commonly referred to as HDFS, is a Java-based, distributed, scalable, and portablefile system for the Hadoop framework.
Big Data ResourcesPentaho Big Data Analytics Center
Pentaho Big Data Wiki
Apache Hadoop project includes these modules
• Hadoop Distributed File System (HDFS)—A distributed file system that provides high-throughput access toapplication data

| Getting Started with PDI and Hadoop | 39
• Hadoop MapReduce— The key algorithm to distribute work around a cluster
Other Hadoop-related projects at Apache include:
• Avro—A data serialization system• Cassandra—A scalable multi-master database with no single points of failure• HBase—A scalable, distributed database that supports structured data storage for large tables• Hive—A data warehouse infrastructure that provides data summarization and ad hoc querying• Pig—A high-level, data-flow language and execution framework for parallel computation• ZooKeeper—A high-performance coordination service for distributed applications• MongoDB— A NoSQL open source document-oriented database system developed and supported by 10gen• CouchDB—A NoSQL open source document-oriented database system developed and supported by Apache• Sqoop—Software for transferring data between relational databases and Hadoop• Oozie—A workflow scheduler system to manage Hadoop jobs
| Why Choose Enterprise Edition? | 40
Why Choose Enterprise Edition?
Enterprise Edition enables you to deploy Pentaho Data Integration with confidence, security, and far lower total costof ownership than proprietary and open source alternatives. Benefits of Pentaho Data Integration Enterprise Editioninclude:
Professional, Technical Support• Live support provided by a knowledgeable team of product experts that consistently rates higher in customer
satisfaction than the BI megavendors• Dedicated customer case triage providing faster response times and increased priority for customer reported defects
and enhancements
Enterprise Edition Features• Enterprise security with granular control over content and actions that can be performed by users and roles.
Enterprise security can be managed directly in Pentaho Data Integration Enterprise Edition or configured to integratewith your existing LDAP or Active Directory implementation
• Centralized content management facilitating team collaboration including secured sharing of content, contentversioning (revision history), and transformation and job locking
• Integrated scheduler allowing you to schedule job and transformations for future or recurring execution; schedulesare created and managed directly in the easy-to-use, graphical designer (Spoon)
• Additional transformation steps and job entries for integrating with third-party applications, messaging architecturesand more
Certified Software Releases• All certified software releases go through rigorous quality testing and a managed release process to ensure the
stability of your production deployments• Only subscription customers get access to maintenance releases containing critical defect resolutions
Note: Binary distributions of Community Editions are provided with major product releases only. If you have acritical defect or improvement that has been addressed as part of a minor or patch release, you must wait forand upgrade to the next major release of Pentaho Data Integration.
Pricing for Pentaho Data Integration Enterprise Edition can be found at http://www.pentaho.com/explore/how-to-buy/.For more information or to start your subscription today, contact us at http://www.pentaho.com/contact/.

| Troubleshooting | 41
Troubleshooting
This section contains known problems and solutions relating to the procedures covered in this guide.
I don't know what the default login is for the DI Server, Enterprise Console, and/orCarte
For the DI Server administrator, it's username admin and password secret.
For Enterprise Console administrator, it's username admin and password password.
For Carte, it's username cluster and password cluster.
Be sure to change these to new values in your production environment.
Note: DI Server users are not the same as BI Server users.


