43
© 2021 ProSim S.A. All rights reserved. Getting started with ProSimPlus ® Use Case 1: Main features overview

© 2021 ProSim S.A. All rights reserved.
Getting started
with ProSimPlus®
Use Case 1: Main features overview

© 2
02
1 P
roS
im S
.A.
All
rig
hts
res
erv
ed
.
2
ProSimPlus is a process engineering software that performs rigorous mass and energy
balance calculations for a wide range of industrial steady-state processes. It is used
in design as well as in operation of existing plants for process optimization, units
troubleshooting or debottlenecking, plants revamping or performing front-end
engineering analysis.
This document gives a general overview of ProSimPlus features. It is based on the
“Simple example”, available on ProSim web site: www.prosim.net.
The steps to create and analyze the flowsheet are the following:
• Step 1 – Select the components
• Step 2 – Select the thermodynamic model
• Step 3 – Create the flowsheet
• Step 4 – Run the simulation
• Step 5 – Analyze generated reports
• Step 6 – Analyze results from the flowsheet
• Step 7 – Graphical User Interface
Introduction

© 2
02
1 P
roS
im S
.A.
All
rig
hts
res
erv
ed
.
3
Presentation of the example
Inlet Exchanger
Feed
Mixer
C1 Flash_V1
C2
Heavy outlet
Heavy
Light outlet
Flash_V2
C3
Pump
C4
Recycle
Light
Heat exchangerOutlet temperature = 15°C
Adiabatic mixer
Flash T,PTemperature = -60°CPressure = 25 atm
Adiabatic flashPressure drop = 0.3 atmQ = 0 (adiabatic)
PumpExhaust pressure = 75 atm
Process FeedTemperature = 40°CPressure = 75 atm
Partial molar flow rates (kmol/h)
- Nitrogen : 9.0- Methane : 41.7- Ethane : 11.2- Propane : 6.2- n-Butane : 5.4- n-Pentane: 3.0- n-Hexane : 8.1- n-Heptane: 13.3- n-Octane : 2.1
The “simple example” consists in separating a hydrocarbons mixture into heavy and light components:

© 2
02
1 P
roS
im S
.A.
All
rig
hts
res
erv
ed
.
4
Drawing area
Menu
Toolbars
Library of unit operations
Unit operations within the
selected categories
Zoom level
Before we start: Graphical User Interface

© 2
02
1 P
roS
im S
.A.
All
rig
hts
re
se
rved
.
5
Before we start: Graphical User Interface
File management(new, open, save,close, edit synopsis)
Streams(material, information)
Thermodynamic profile(s) (components, models, binary interaction parameters…)
Unit systems (unit operations description and reports)
Simulation report parameters
Run thesimulation(with options)
Setup the drawing area, Print
Copy the flowsheet (to paste in another document)
Last simulation results(report, history file, MS-Excel workbook)
Set(s) ofreactions
Graphical objects (text, image, shapes)
Object management (cut, copy, paste, delete, open configuration window) Copy the format
Open the files linked to the simulation

© 2
02
1 P
roS
im S
.A.
All
rig
hts
re
se
rved
.
6
Before we start: Graphical User Interface
Arrange the graphical objects on the flowsheet (align, center…)
Objects position (mirror, inverse, rotate…)
Arrange the objects layout in the flowsheet (front, back…)
Access to the libraryof unit operations
Access to the existing objecton the flowsheet
Management of the views of the flowsheet (creating, moving, renaming…)
Access to the graphical properties and the name of the selected object

© 2
02
1 P
roS
im S
.A.
All
rig
hts
re
se
rved
.
7
Tools: conversion tool and calculator
Before we start: Graphical User Interface
Conversions
Mathematical expressions used by the conversion tool

© 2
02
1 P
roS
im S
.A.
All
rig
hts
res
erv
ed
.
8
STEP #1: Select your components
Click on the “Thermodynamics and Compounds” icon
© 2
02
1 P
roS
im S
.A.
All
rig
hts
res
erv
ed
.
9
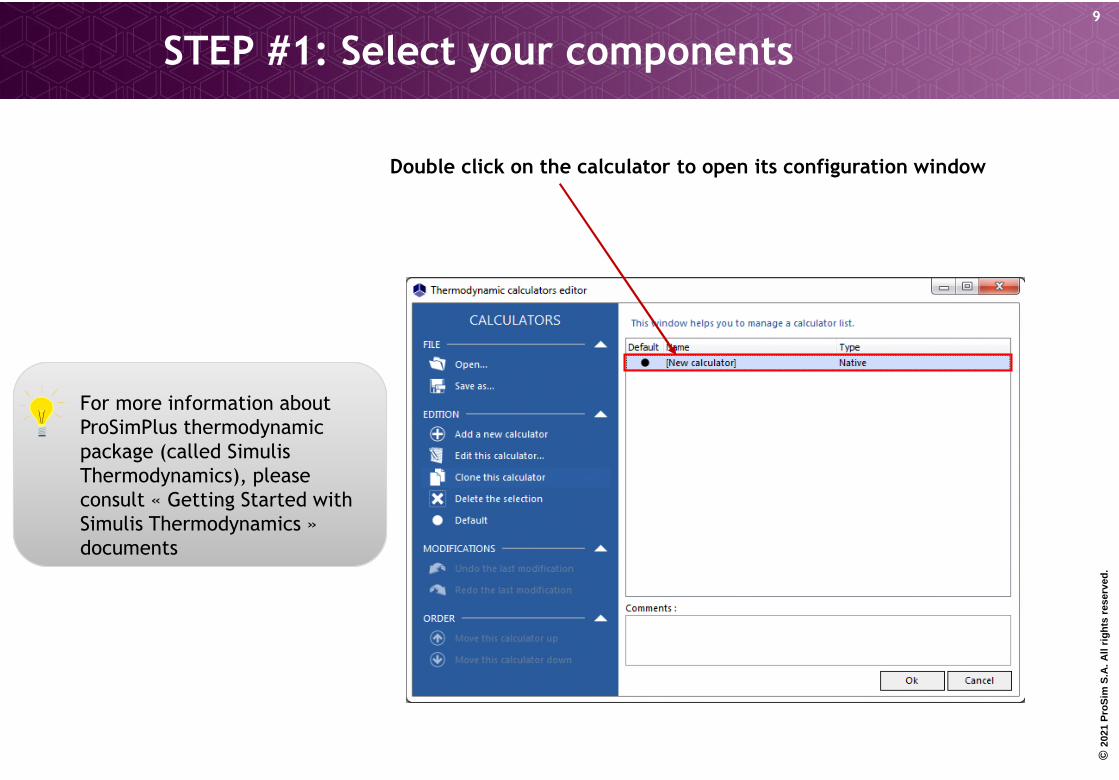
Double click on the calculator to open its configuration window
STEP #1: Select your components
For more information about ProSimPlus thermodynamic package (called SimulisThermodynamics), please consult « Getting Started with Simulis Thermodynamics » documents
© 2
02
1 P
roS
im S
.A.
All
rig
hts
res
erv
ed
.
10
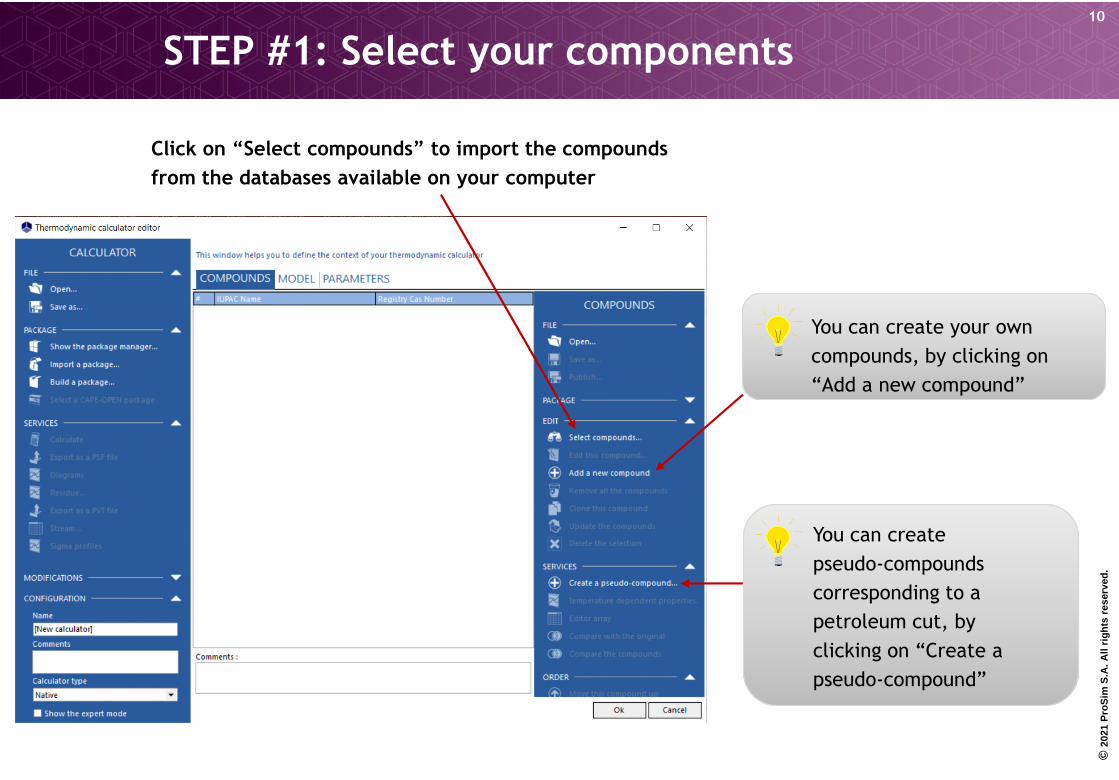
STEP #1: Select your components
Click on “Select compounds” to import the compounds
from the databases available on your computer
You can create your own
compounds, by clicking on
“Add a new compound”
You can create
pseudo-compounds
corresponding to a
petroleum cut, by
clicking on “Create a
pseudo-compound”

© 2
02
1 P
roS
im S
.A.
All
rig
hts
res
erv
ed
.
11
STEP #1: Select your components
2. You have access
to multiple search
criteria (in this
example, search
“Nitrogen” by name)
3. Click on the “Search” button to get
the list of compounds that match your
criteria
1. Select the compounds server(s) (databases or
packages) in which you want to search the
compounds
4. The search results are
shown in this area
You can run multiple searches
without closing this window
© 2
02
1 P
roS
im S
.A.
All
rig
hts
res
erv
ed
.
12
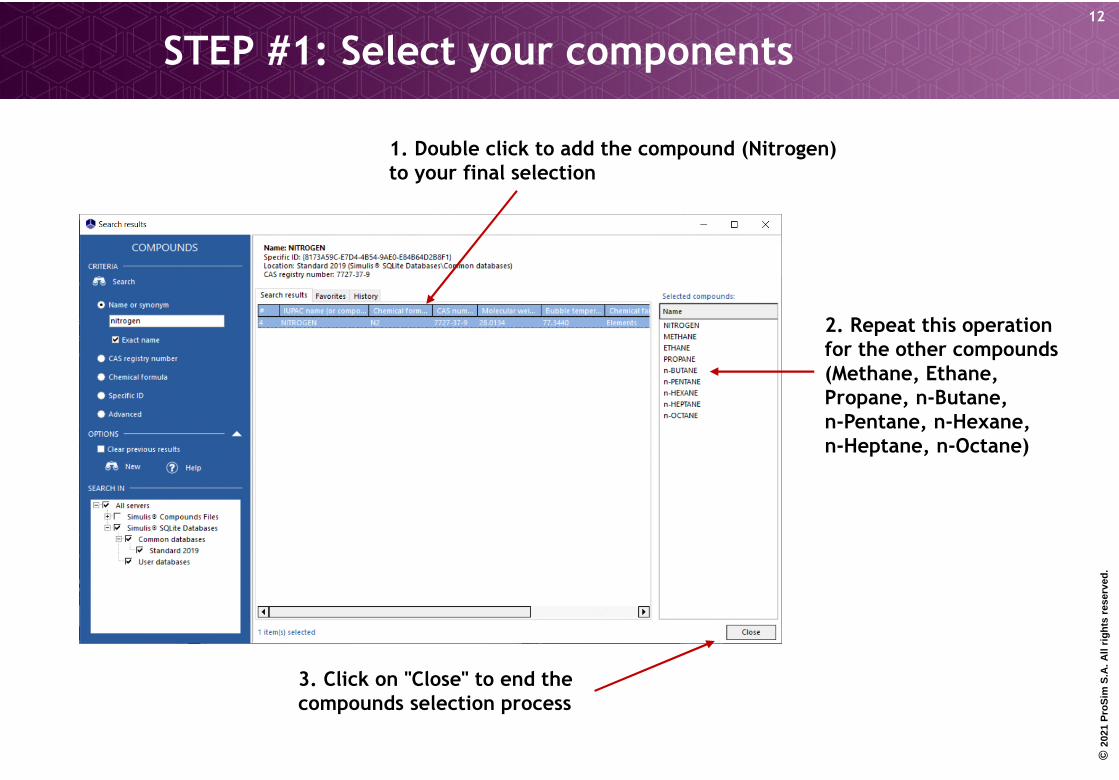
STEP #1: Select your components
1. Double click to add the compound (Nitrogen) to your final selection
3. Click on "Close" to end the compounds selection process
2. Repeat this operation for the other compounds (Methane, Ethane, Propane, n-Butane,n-Pentane, n-Hexane, n-Heptane, n-Octane)

© 2
02
1 P
roS
im S
.A.
All
rig
hts
res
erv
ed
.
13
STEP #2: Select your thermodynamic model
1. Click on the
“Model” tab to enter
the thermodynamic
models editor 2. Select the Thermodynamic
profile (in this example, SRK)
The “Binaries” tab appears automatically
when you select a model that requires binary
interaction parameters
3. You can adjust the
thermodynamic profile
if it is necessary

© 2
02
1 P
roS
im S
.A.
All
rig
hts
res
erv
ed
.
14
STEP #2: Select your thermodynamic model
1. Click on the “Binaries” tab to enter the
binaries search window (if required by the
model)
2. Click on “Import binaries…” to search for
the binary interaction parameters in the
databases

© 2
02
1 P
roS
im S
.A.
All
rig
hts
res
erv
ed
.
15
STEP #2: Select your thermodynamic model
2. Select the compounds and click on “Search”
3. Select the binary interaction parameters to be
used and click on “OK”
1. Select the binaries server(s) that you want to
use for your research

© 2
02
1 P
roS
im S
.A.
All
rig
hts
res
erv
ed
.
16
STEP #2: Select your thermodynamic model
Your thermodynamic calculator is now defined: - Components- Thermodynamic model- Binary interaction parameters (if necessary)
You can display the binaries as a grid or a matrix
Click on “OK” to validate

© 2
02
1 P
roS
im S
.A.
All
rig
hts
res
erv
ed
.
17
1. Select the process inlet icon (simple click)
2. Drop the icon in the flowsheet (simple click)
3. Double click on the unit to describe it
For a process feed, parameters to be furnished:
- Flowrates and fractions- Temperature- Pressure
STEP #3: Create your flowsheet
At least one Process feed (inlet) and one Process outlet are necessary to run a simulation
© 2
02
1 P
roS
im S
.A.
All
rig
hts
res
erv
ed
.
18
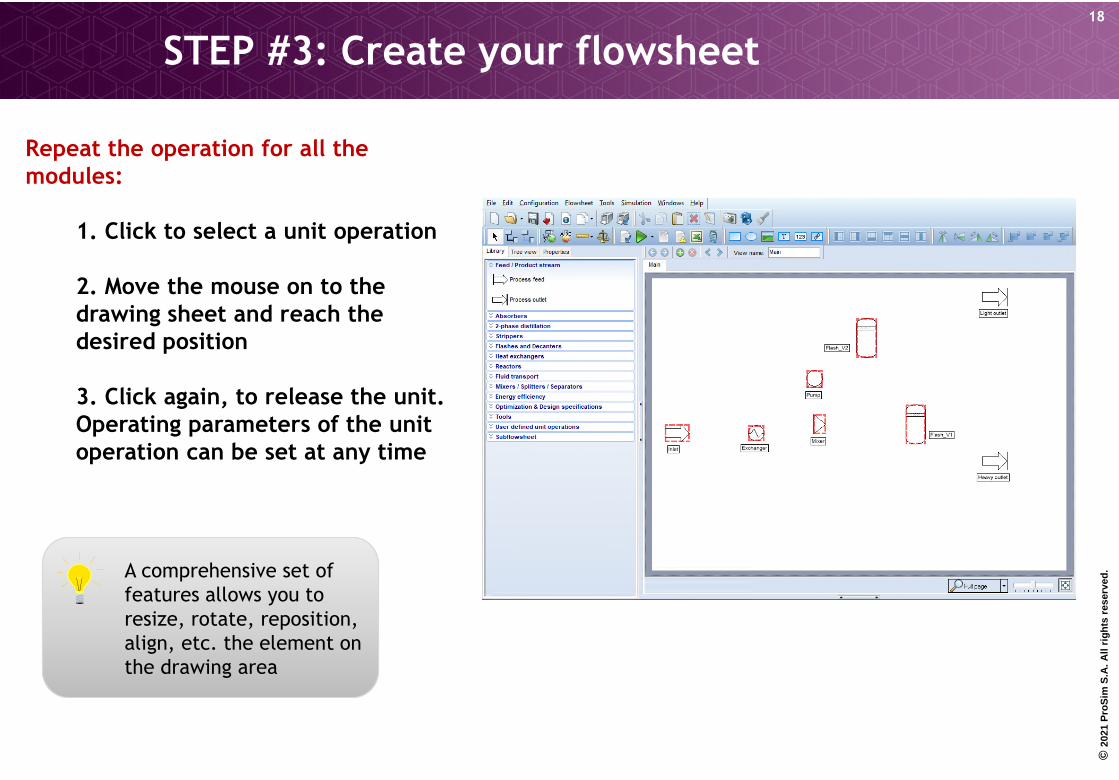
Repeat the operation for all the modules:
1. Click to select a unit operation
2. Move the mouse on to the drawing sheet and reach the desired position
3. Click again, to release the unit. Operating parameters of the unit operation can be set at any time
A comprehensive set of features allows you to resize, rotate, reposition, align, etc. the element on the drawing area
STEP #3: Create your flowsheet

© 2
02
1 P
roS
im S
.A.
All
rig
hts
re
se
rved
.
19
1. To configure a unit operation, double click on it or select “Edit” in the drop-down menu accessible by a right-click
STEP #3: Create your flowsheet
Configure each unit operation:
Missing information or inconsistent parameters are signaled with red fields

© 2
02
1 P
roS
im S
.A.
All
rig
hts
res
erv
ed
.
20
1. Select the “Material Stream”icon
2. Select the first unit operation (source) by clicking on it
STEP #3: Create your flowsheet
Connect the unit operations:
3. Select the second unit operation (target) by clicking on it
4. Both unit operations are automatically connected
TIP : Press “shift” and click on the “Material stream” icon to connect successively several unit operations.
Material streams can be colored in order to ease the reading of the flowsheet. Right click on it to access this feature.

© 2
02
1 P
roS
im S
.A.
All
rig
hts
res
erv
ed
.
21
When several connections are available, the following window appearsallowing to select the right connection point:
1. Select the unit operation outlet
2. Select the unit operation inlet
3. Confirm by clicking on “OK”
STEP #3: Create your flowsheet
© 2
02
1 P
roS
im S
.A.
All
rig
hts
res
erv
ed
.
22
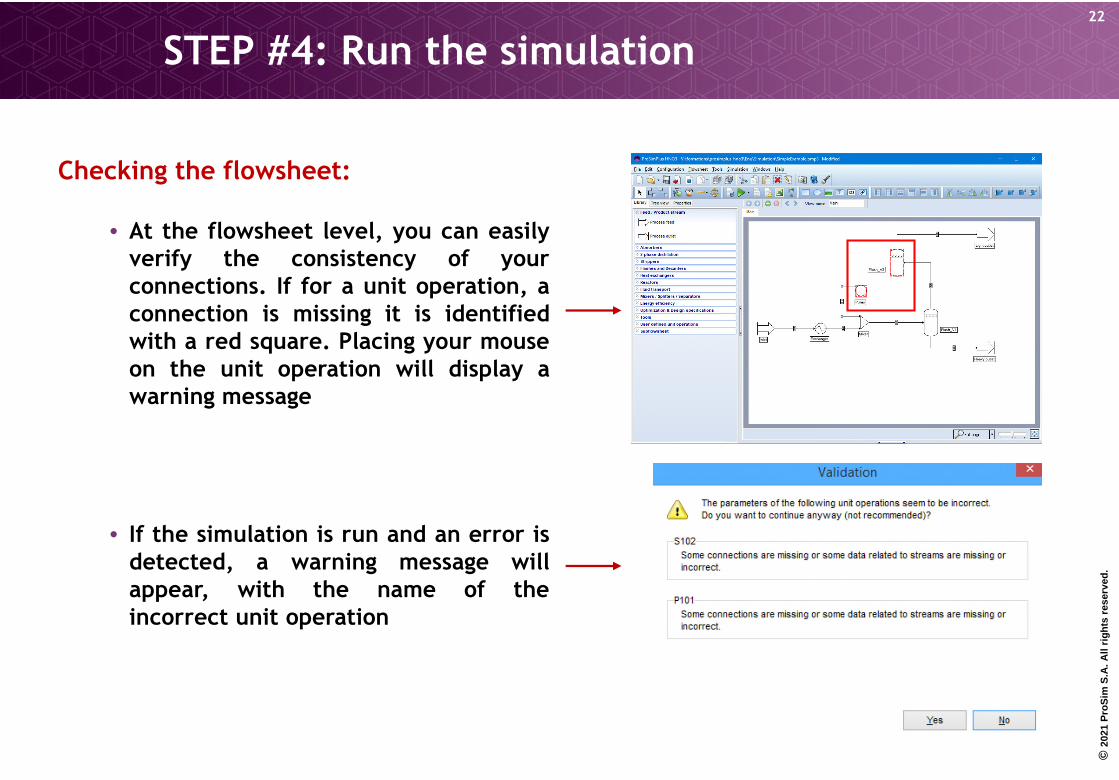
Checking the flowsheet:
• At the flowsheet level, you can easilyverify the consistency of yourconnections. If for a unit operation, aconnection is missing it is identifiedwith a red square. Placing your mouseon the unit operation will display awarning message
• If the simulation is run and an error isdetected, a warning message willappear, with the name of theincorrect unit operation
STEP #4: Run the simulation

© 2
02
1 P
roS
im S
.A.
All
rig
hts
re
se
rved
.
23
During the calculation, different symbols and indications will appear and disappear in the“Simulation progress” window and in the drawing area:
• A blue question mark indicates that the module has not been calculated yet
• A blue arrow indicates that calculation is in progress
• A green validation mark indicates that the module has been correctly calculated
• A red cross indicates a convergence error
• A yellow frame indicates a warning on the module results
Click on the green arrow or press “F9” to run the simulation
STEP #4: Run the simulation
© 2
02
1 P
roS
im S
.A.
All
rig
hts
res
erv
ed
.
24
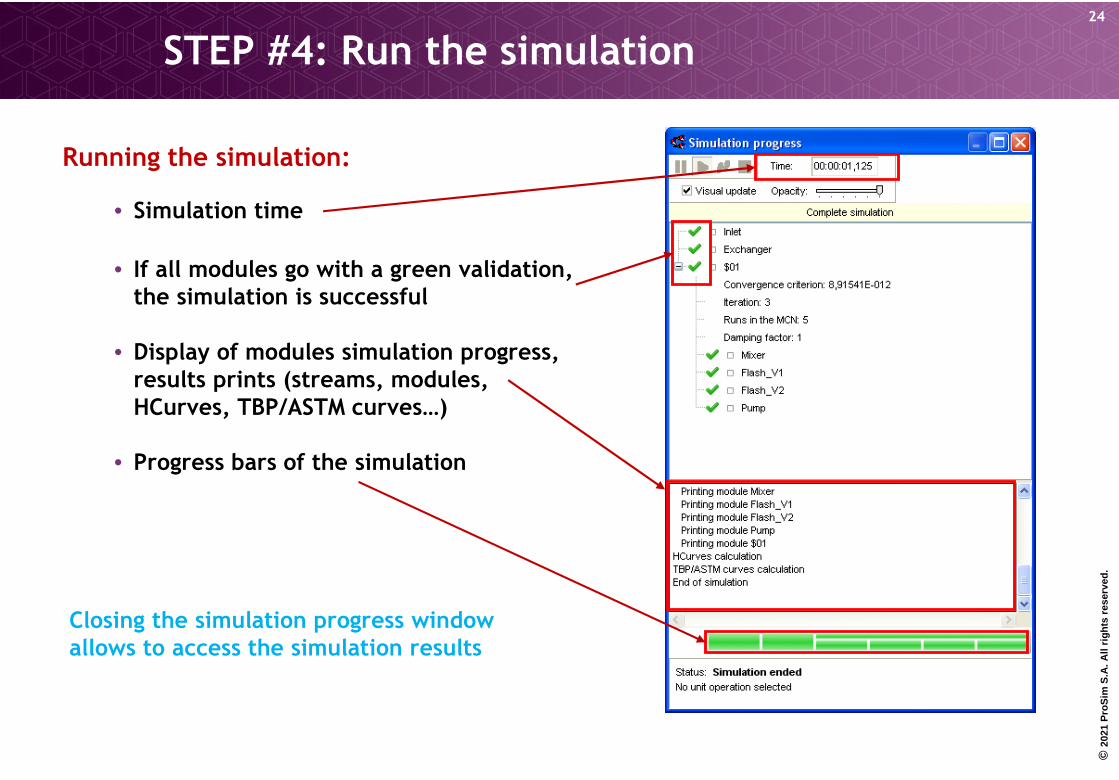
Running the simulation:
• Simulation time
• If all modules go with a green validation, the simulation is successful
• Display of modules simulation progress, results prints (streams, modules, HCurves, TBP/ASTM curves…)
• Progress bars of the simulation
STEP #4: Run the simulation
Closing the simulation progress window allows to access the simulation results
© 2
02
1 P
roS
im S
.A.
All
rig
hts
res
erv
ed
.
25
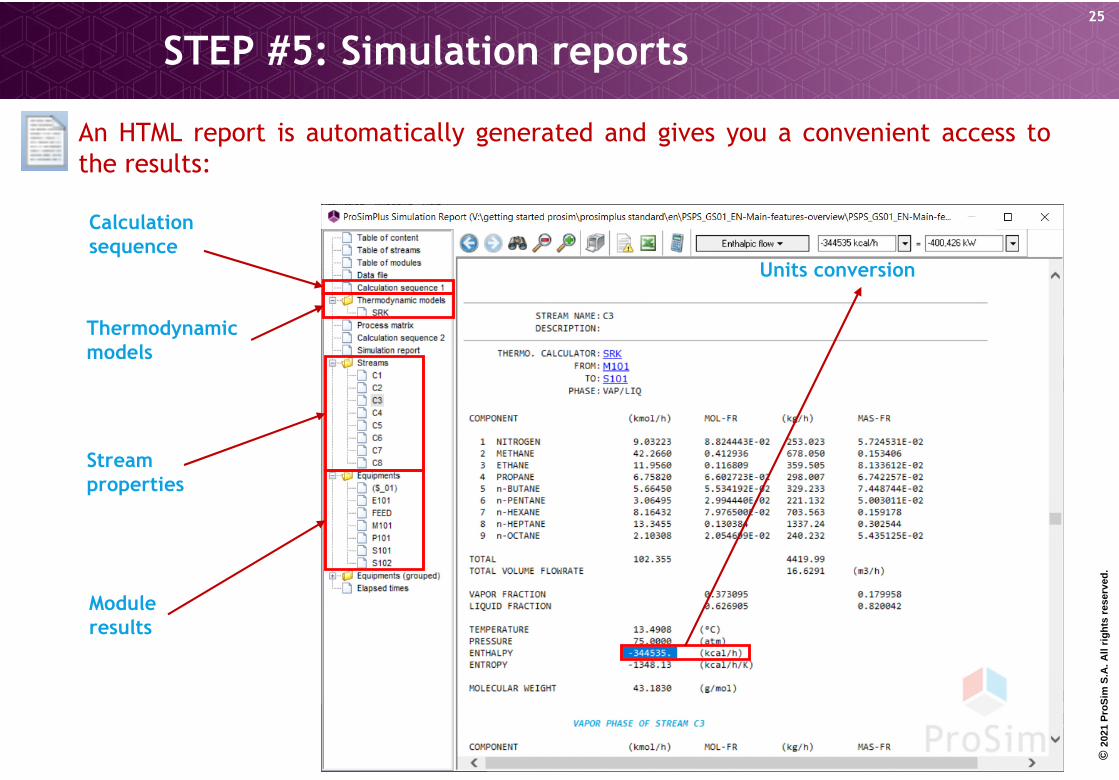
An HTML report is automatically generated and gives you a convenient access tothe results:
STEP #5: Simulation reports
Calculation sequence
Thermodynamic models
Stream properties
Module results
Units conversion

© 2
02
1 P
roS
im S
.A.
All
rig
hts
res
erv
ed
.
26
STEP #5: Simulation reports
Unit operations
• You can double-click on any module of theflowsheet, and then click on the “Report” tab toaccess the results for this specific module.
• For some modules (columns for example), a“Profiles” tab is also available.

© 2
02
1 P
roS
im S
.A.
All
rig
hts
res
erv
ed
.
27
STEP #5: Simulation reports
Excel file
• Balances on process streams
• Equipment profiles
• Etc…
2. Recover the results in order to exploit them in Excel
1. Click on the “Excel file” icon to openthe Excel report

© 2
02
1 P
roS
im S
.A.
All
rig
hts
res
erv
ed
.
28
STEP #5: Simulation reports
History file
• List of calculations
• List of encountered errors
2. For each module, display of the possible errors or warning messages
1. Click on the “History file” icon

© 2
02
1 P
roS
im S
.A.
All
rig
hts
re
se
rved
.
29
You can analyze the results directly from the flowsheet
STEP #6: Results analysis
Streams summary:Summary of streams properties
Click on to configure the streams properties for the display and the export in MS-Excel
Hints: move the cursor over a stream to display its properties

© 2
02
1 P
roS
im S
.A.
All
rig
hts
re
se
rved
.
30
Streams summary: Displaying physical properties
2. By default, “Medium” is selected and the physical properties are not calculated
1. Click on the “Streams” tab
3. Select “Extended” to compute the physical properties (only calculated for liquid or vapor phases)
STEP #6: Results analysis

© 2
02
1 P
roS
im S
.A.
All
rig
hts
re
se
rved
.
31
Add a tag (label, process value or simulation result)
STEP #6: Results analysis
2. Double-click on the “tag” object to open its configuration window
1. Click on the “tag” icon and drop it on the flowsheet
3. Select the object and parameter to display
4. You can add text
In this example, the pressure value of the “C5” stream will be displayed

© 2
02
1 P
roS
im S
.A.
All
rig
hts
re
se
rved
.
32
List of files that are generated in the same directory as the simulation file
• *.pmp3 : ProSimPlus3 simulation file
• *.his : history file
• *.htm : html file of the simulation results
• *.xls : MS-Excel file of the simulation results
• *.xmlz : results file corresponding to the summary grid
• *.don : data file with the generated keywords
• *.sim : data file with the generated keywords in restart mode
• *.tem : temporary file which manages the restart mode
• *.views : file which manages the graphical interface (flowsheet printing)
• …
• *.~: backup copy of all the previous files
STEP #6: Results analysis
Access the files linked to the simulation

© 2
02
1 P
roS
im S
.A.
All
rig
hts
re
se
rved
.
33
“Scriptlets”: right click on an object (project, stream, module, set of modules) toaccess specific scriptlets dedicated to results analysis
Project: Backup the project, Send by email, Material
balance, Alcohol properties, Stream color and thickness…
Stream: Properties, Calculation service, Combustion, Graphs,
Phase envelope…
Module(s): Material balance, Recovery ratio, Graphs, Specification data sheet (Columns, heat exchanger…), Columns export…
STEP #6: Results analysis

© 2
02
1 P
roS
im S
.A.
All
rig
hts
re
se
rved
.
34
1. Click here to access the unit system used for input data (unit operations, streams…)
2. Click here to access the unit system used in the simulation reports (report, summary, hint,…)
STEP #7: Graphical User Interface
List of all the available quantities
Predefined unit system
For each quantity, list of the available units
Copy/Paste all the unit system

© 2
02
1 P
roS
im S
.A.
All
rig
hts
re
se
rved
.
35
1. Click on “Conditions” if you want to modify the default normal and standard conditions
2. Click here if you want to apply the updated units system to the modules already on the flowsheet
Normal conditions (T and P)
Standard conditions (T and P)
Atmospheric pressure for pressure conversion in relative unit
STEP #7: Graphical User Interface

© 2
02
1 P
roS
im S
.A.
All
rig
hts
res
erv
ed
.
36
You can apply following functions on one or more unit operations:• Cut (CTRL+ X)• Copy (CTRL+ C)• Paste (CTRL+ V)• Select all (CTRL+ A)
Example:
1. Press “CTRL+A” to select all the units in the flowsheet
2. Press “CTRL+C” then “CTRL+V” to duplicate the flowsheet
3. Move the new flowsheet and run the simulation (all unit operations parameters are also copied)
STEP #7: Graphical User Interface

© 2
02
1 P
roS
im S
.A.
All
rig
hts
re
se
rved
.
37
Inserting images (logo…)Inserting text blocks
Inserting predefined shapes
Color and thickness modification of the streams
Color, width… modification of the streams and equipments tags
Layout of the graphical objects (front, background…)
Link to a document (pdf, web site…)
Graphical properties of objects
STEP #7: Graphical User Interface

© 2
02
1 P
roS
im S
.A.
All
rig
hts
re
se
rved
.
38
Visual: It is possible to replace the module icon by another picture and modify the connection ports
Inlet Exchanger
Feed
Mixer
C1 Flash_V1
C2
Heavy outlet
Heavy
Light outlet
Flash_V2
C3
Pump
C4
Recycle
Light
3. Move the connection ports:
Material stream
Information stream
2. You can:
• Load a visual (file *.puox)
• Save a visual
• Load a picture
• Restore the original visual
1. Right click on the module and select “Visual”
STEP #7: Graphical User Interface
© 2
02
1 P
roS
im S
.A.
All
rig
hts
re
se
rved
.
39
Inlet Exchanger
Feed
Mixer
C1 Flash_V1
C2
Heavy outlet
Heavy
Light outlet
Flash_V2
C3
Pump
C4
Recycle
Light
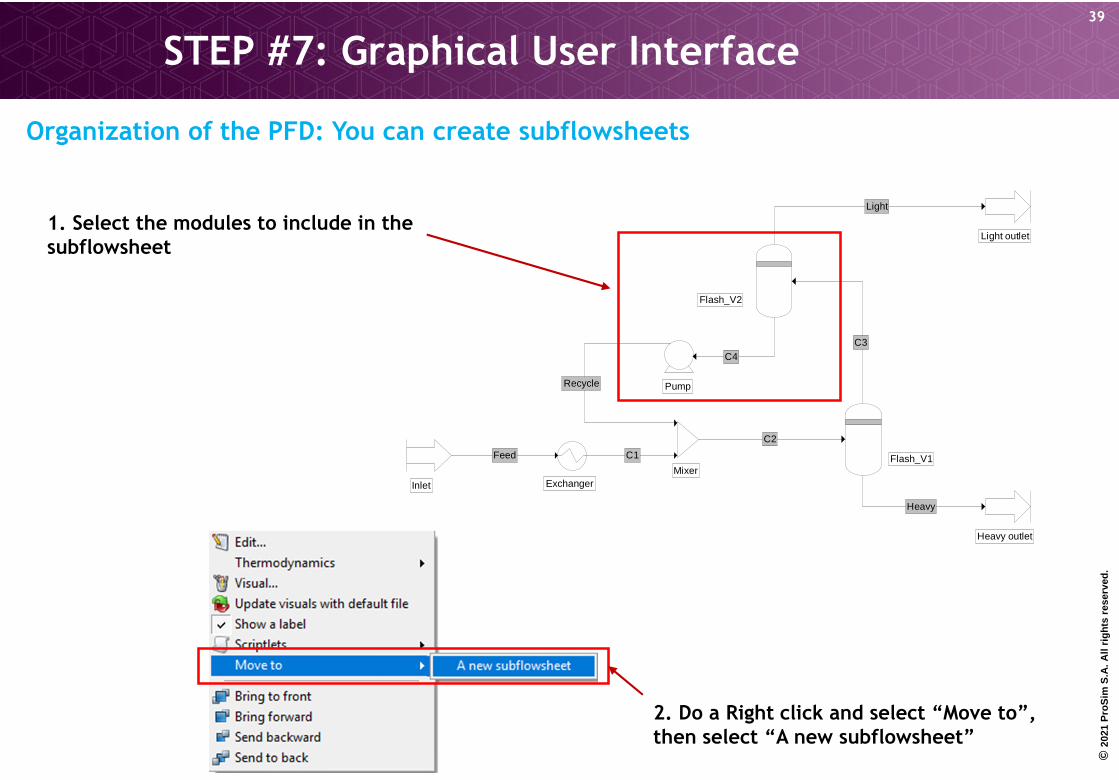
1. Select the modules to include in the subflowsheet
Organization of the PFD: You can create subflowsheets
2. Do a Right click and select “Move to”, then select “A new subflowsheet”
STEP #7: Graphical User Interface

© 2
02
1 P
roS
im S
.A.
All
rig
hts
res
erv
ed
.
40
1. The subflowsheet is represented by a single icon on the main flowsheet
2. A new tab appears. Click on it to access the subflowsheet
The pseudo-streams necessary to make the links have been automatically created
STEP #7: Graphical User Interface

© 2
02
1 P
roS
im S
.A.
All
rig
hts
res
erv
ed
.
41
Language
Size and background color of the PFD
Flowsheetprinting
STEP #7: Graphical User Interface

© 2
02
1 P
roS
im S
.A.
All
rig
hts
res
erv
ed
.
42
Hints
Projects
- Automatically display the simulation report- Add your logo in the simulation report
STEP #7: Graphical User Interface

© 2
02
1 P
roS
im S
.A.
All
rig
hts
re
se
rved
.
43
ProSim SA
51, rue Ampère
Immeuble Stratège A
F-31670 Labège
France
: +33 (0) 5 62 88 24 30
ProSim, Inc.
325 Chestnut Street, Suite 800
Philadelphia, PA 19106
U.S.A.
: +1 215 600 3759www.prosim.net


