13
ISS, NEWCASTLE UNIVERSITY IBM SPSS Statistics for Beginners for Windows A Training Manual for Beginners Dr. S. T. Kometa

ISS, NEWCASTLE UNIVERSITY
IBM SPSS Statistics for Beginners for Windows
A Training Manual for Beginners
Dr. S. T. Kometa

2
A Training Manual for Beginners
Contents 1 Aims and Objectives .................................................................................................................................... 3 1.1 Learning outcomes (Aims and Objectives) .............................................................................................. 3 1.2 Some Basics ............................................................................................................................................. 3
1.2.8 Kinds of data...................................................................................................................................... 3 1.2.8.1 Interval data .................................................................................................................................... 3 1.2.8.2 Ordinal data .................................................................................................................................... 3 1.2.8.3 Nominal data .................................................................................................................................. 3
2 Getting Started with SPSS for Windows ..................................................................................................... 3 2.1 Assumptions ......................................................................................................................................... 4 2.2 Introduction .......................................................................................................................................... 4 2.3 Dialogue boxes ..................................................................................................................................... 6 2.4 Variable names and value labels ........................................................................................................... 7 2.4.1 Variable names .................................................................................................................................. 7 2.4.2 Value labels ....................................................................................................................................... 7
3 Data entry using the keyboard ..................................................................................................................... 7 3.1 Editing data on the grid ........................................................................................................................ 7
4 Exercise 1 .................................................................................................................................................... 8 4.1 Exercise 1a – Sample Questionnaire and Coding, Variable Labels, Value Labels and Data entry ...... 8 4.2 Exercise 1b – Read an Excel Data file into SPSS ................................................................................. 9
5 Exercise 2 - How to conduct an Exploratory Data Analysis - Quantitative Variable .................................10 5.1 The Explore Procedure ........................................................................................................................10 5.2 The Descriptives Procedure .................................................................................................................10 5.3 The Frequencies Procedure .................................................................................................................11
6 Exercise 3 - How to conduct an Exploratory Data Analysis - Qualitative Variable ...................................11 6.1 The Frequencies Procedure .................................................................................................................12 6.2 The Crosstabs Procedure .....................................................................................................................12

3
1 Aims and Objectives
1.1 Learning outcomes (Aims and Objectives)
This document gives a quick overview of the essentials of SPSS. After completing this
document you should:
understand scale of measurement
be able to create an SPSS data file from scratch (coding a questionnaire)
open an Excel file in SPSS
be able to carry out some simple analyses on the data file
be able to use SPSS with a degree of confidence
1.2 Some Basics
1.2.1 Scale of Measurement
Nominal (categorical) e.g. race, colour, sex, job status, etc.
Ordinal (categorical) e.g. the effect of a drug could be none, mild and severe, job
importance (1-5, 1 being not important and 5 very important), etc.
Interval (continuous, covariates, scale, metric) e.g. temperature (in Celsius),
weight (in stones or Kg), height (in inches or cm), etc.
1.2.8 Kinds of data
There are basically three kinds of data:
1.2.8.1 Interval data
These are data taken from an independent scale with units. Examples include height,
weight and temperature.
1.2.8.2 Ordinal data
These are data collected from ranking variables on a given scale. For example, you may
ask respondents to rank some variable based on their perceived level of importance of the
variables using Likert type scale such as 1, 2, 3, 4 and 5.
1.2.8.3 Nominal data
Merely statements of qualitative category of membership. Examples include gender
(male or female), race (black or white), nationality (British, American, African, etc.).
It should be appreciated that both Interval and Ordinal data relate to quantitative variables
while Nominal data refers to qualitative variables.
2 Getting Started with SPSS for Windows

4
2.1 Assumptions
This document assumes that you know the basics of using a computer such as:
1. How to start applications
2. How to use your mouse
3. How to move and close windows.
4. How to save and open a file.
2.2 Introduction
SPSS has two main windows: The Data Editor window and the Viewer window. The
Data Editor window is in turn divided into the Data View and the Variable View
windows.
The Data View window is simply a grid with rows and columns. The rows represent
subjects (cases or observations) and columns represent variables whose names should
appear at the top of the columns. In the grid, the intersection between a row and a
column is known as a cell. A cell will therefore contain the score of a particular subject
(or case) on one particular variable. This window displays the contents of data file. You
create new data files or modify existing ones in this window. This window opens
automatically when you start an SPSS session. See Figure 1 for a brief annotation of this
window.
Fig. 1 Data View Window
The Variable View window is also a simple grid with rows and columns. This window
contains descriptions of the attributes of each variable that make up your data set. In this
Tool bar
Menu Bar
Rows
(Represent cases
Or observations)
Columns represent variables
Data View tab
Variable View tab Status Bar
Cells
Active
Cell
5
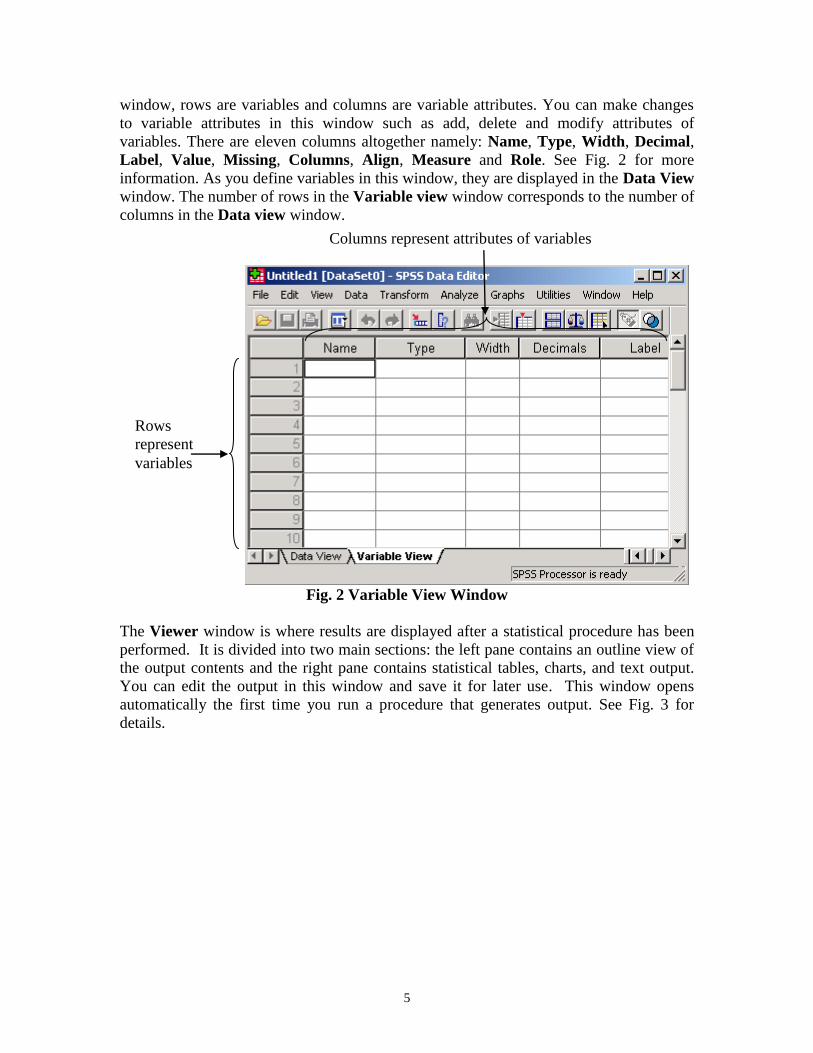
window, rows are variables and columns are variable attributes. You can make changes
to variable attributes in this window such as add, delete and modify attributes of
variables. There are eleven columns altogether namely: Name, Type, Width, Decimal,
Label, Value, Missing, Columns, Align, Measure and Role. See Fig. 2 for more
information. As you define variables in this window, they are displayed in the Data View
window. The number of rows in the Variable view window corresponds to the number of
columns in the Data view window.
Fig. 2 Variable View Window
The Viewer window is where results are displayed after a statistical procedure has been
performed. It is divided into two main sections: the left pane contains an outline view of
the output contents and the right pane contains statistical tables, charts, and text output.
You can edit the output in this window and save it for later use. This window opens
automatically the first time you run a procedure that generates output. See Fig. 3 for
details.
Rows
represent
variables
Columns represent attributes of variables

6
Fig. 3 Viewer window
2.3 Dialogue boxes
You use dialogue boxes to select variables and options for statistics and charts. You
select variables for analysis from the source list. And you use the arrow button to move
the variables into the target list. Dialogue box buttons with an ellipsis (...) open
subdialogue boxes for optional selections. There are five standard buttons on most
dialogue boxes (OK, PASTE, RESET, CANCEL, and HELP). You see some diagrams
of some dialogue boxes as you progress through this document. The Frequency dialogue
box is shown in Fig. 11.
Left pane contains outline
view of the output contents
Right pane contains statistical tables, charts and text output
Source variable
list. The variables
can be selected
Target variable list
Click this arrow to
transfer variable(s)
A single click on any of
these buttons will open
subdialogue boxes
The OK button is not available
because no variable has been
transferred to the target list
yet

7
Fig. 11 Frequency dialogue box
2.4 Variable names and value labels
2.4.1 Variable names
Always give meaningful names to all your variables. If you do not, SPSS will name the
variables for you, calling the first variable var00001, the second var00002 and so on.
There are six specific rules that you should follow when selecting variable names. A
variable name:
1. must not exceed 32 characters. (A character is simply a letter, digit or symbol).
2. must begin with a letter.
3. could have a mixture of letters, digits and any of the following symbol: @, #, _, $.
4. must not end with a full stop.
5. must not contain any of the following: a blank, !, ?, *.
6. must not be one of the keywords used in SPSS (e.g. AND, NOT, EQ, BY, and ALL)
2.4.2 Value labels
With Value labels you assign names to arbitrary code numbers. For example, you may
want to perform a statistical procedure on two groups that have been given arbitrary code
numbers of 1 and 2. You can give Value labels to these code numbers such as:
1="group 1"
2="group 2"
3 Data entry using the keyboard
When the Data Editor window is accessed for the first time, the top cell of the leftmost
column will be highlighted (i.e. thickened black borders round the cell). This is the
active cell. You can make any cell active by moving your mouse to the required cell and
then clicking the left mouse button. Notice that as you change the active cell, the cell
editor on the left, track the location of the active cell. A value typed in from the keyboard
will appear in the cell editor and can be transferred to the active cell by pressing return
or enter key on the keyboard. You can change position of the active cell in grid by
using the cursor keys (i.e. the up, down, right and left arrows on the keyboard). You can
now enter data into any cell.
3.1 Editing data on the grid
The editing functions found in most applications are available in SPSS for Windows.
You can copy, cut, and paste in SPSS. The block-and-paste technique can also be used.
To delete the values in a cell (or block), highlight the required area and press shift delete
or the back space key. To delete the values of an entire row, click on the grey area

8
containing the row number followed by delete. Similarly, to delete the values of an entire
column, click on the grey area containing the name of the column followed by delete.
4 Exercise 1
Now that the basics of SPSS for Windows have been covered, attempt the following
exercise. To do the exercise you must start SPSS for Windows if you have not already
done so.
4.1 Exercise 1a – Sample Questionnaire and Coding, Variable Labels, Value Labels
and Data entry
In this exercise, you will learn how to code a questionnaire, label variable and value, and
enter data into SPSS Data Editor.
Sample Questionnaire
1. What is your gender? Please tick 1: Male Female
2. What is your date of birth? ……………………
3. What is the total number of years you completed in an educational establishment?
…….
4. Which employment category do you belong to? Please select one:
Manager
Clerical
Custodial
5. What is your current salary? ……………….
6. What was your beginning salary …………..
Click the tap for Variable View window at the bottom left hand corner and code each
question using the information shown on the table below:
Coding of Questionnaire
Question Name Type Label Value and
Label
Measure
1 gender String Respondent’s sex m=male,
f=Female
Nominal
2 bdate Date Date of birth Scale
3 educ Numeric Educational level Scale
4 jobcat Numeric Employment
category
1=Clerical,
2=Custodial,
3=Manager
Nominal
5 salary Dollar Current salary Scale
6 salbegin Dollar Beginning salary Scale
9
Creating the first variable: gender
1. Under the column Name and in row 1 type in gender and press return on the
keyboard. To the right of the cell gender under column Type click on Numeric
and click on the little blue square in the cell.
2. Select String and click OK from the displayed dialogue box.
3. Skip the next two cells i.e. cells under columns Width and Decimals. Click on
the next cell under column Label and type in Respondent’s sex.
4. Click on the next cell under column Values and click on the little blue square in
the cell. On the displayed dialogue box type m next to Value and type Male next
to Label and click on Add. Type f next to Value and type Female next to Label
and click on Add. Then click OK.
5. Leave the remaining columns as they are. You have successfully created your first
variable.
Creating the second variable: bdate
1. Under the column Name and in row 2 type in bdate and press return on the
keyboard. To the right of the cell bdate under column Type click on Numeric and
click on the little blue square in the cell.
2. Select Date and accept the default date format of dd-mmm-yyyy by clicking OK
from the displayed dialogue box.
3. Skip the next two cells i.e. cells under columns Width and Decimals. Click on
the next cell under column Label and type in Date of birth.
4. As date of birth is unique for each person there is no need to provide Value and
Labels for this variable.
5. Skip the next three columns and under the column Measure click on the cell
Unknown and select Scale.
6. Leave the last column as it is. You have successfully created the second variable.
Creating the remaining variables:
Following the same method create the remaining four variables using the information on
the table Coding of Questionnaire above.
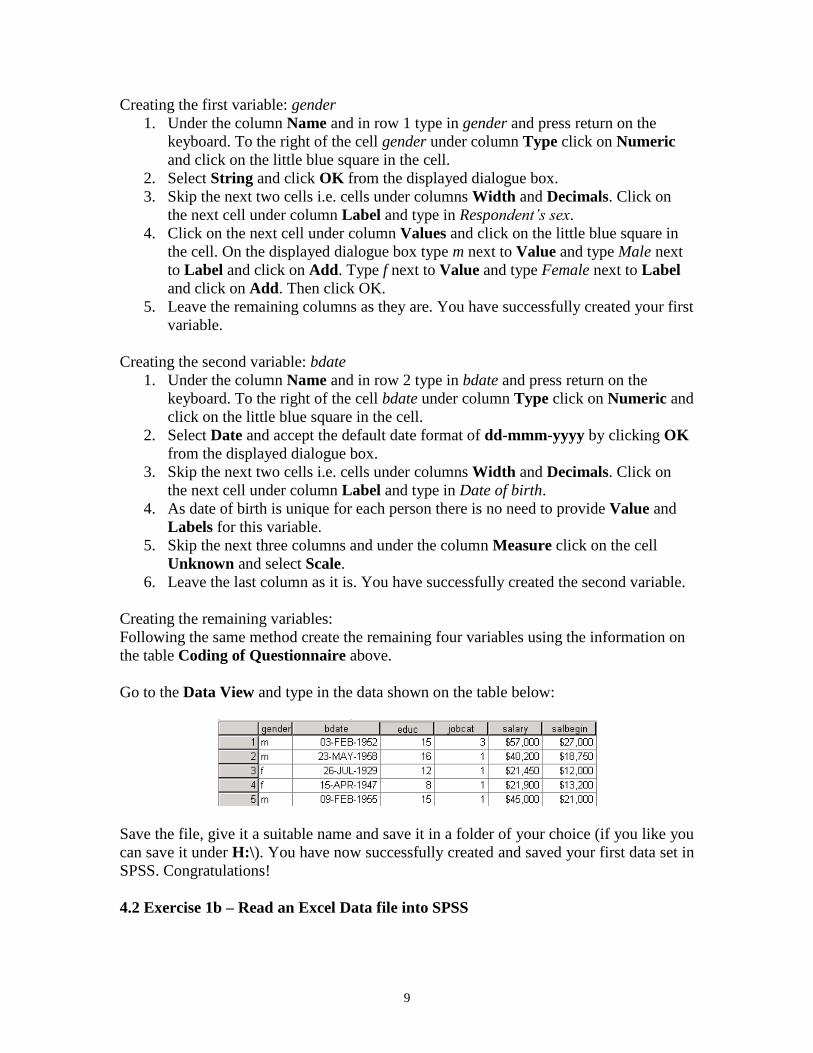
Go to the Data View and type in the data shown on the table below:
Save the file, give it a suitable name and save it in a folder of your choice (if you like you
can save it under H:\). You have now successfully created and saved your first data set in
SPSS. Congratulations!
4.2 Exercise 1b – Read an Excel Data file into SPSS
10
The file is stored in this location \\campus\software\dept\spss. It is called Gss91Sm.xls.
Before you open the file in SPSS it is a good idea to open it first in Excel, have a look at
it. Close the file in Excel. Now open this file in SPSS following these instructions:
1. File -> Open -> Data…
2. Under Files of type: using the drop-down arrow select Excel (*.xls, *.xlsx,
*.xlsm)
3. Under File name: type \\campus\software\dept\spss and click Open
4. Select GSS91Sm.xls and click Open
5. Make sure Read variable names from first row of data is checked
6. Using the drop down arrow select the worksheet to open
7. Under Range type A6:F506 and click OK
You can now modify and save the file as an SPSS data file.
5 Exercise 2 - How to conduct an Exploratory Data Analysis - Quantitative Variable
Now that we have successfully entered and saved data into SPSS, it is time to perform
some statistical data analysis procedures. However, it is advisable to conduct an
Exploratory Data Analysis (EDA) before carrying out any formal data analysis. Why not
attempt some Exploratory Data Analysis using the following: Explore, Descriptives, and
Frequencies. Follow these instructions:
5.1 The Explore Procedure
1. Start SPSS by selecting Start -> All programs -> Statistical software -> IBM SPSS
Statistics -> IBM SPSS Statistics 19. Click on Cancel to cancel the displayed
dialogue box.
2. From the menu bar select File -> Open -> Data. Under File name: type
\\campus\software\dept\spss and click Open. Select Employee data and click
Open. Study this data file.
3. Select Analyze -> Descriptive Statistics -> Explore.... The Explore dialogue box
will appear on the screen. Highlight the variable Current Salary [salary] by clicking
on it once using your mouse left button and transfer it to the Dependent List box by
clicking the top arrow. Highlight the variable Employment Category [jobcat] and
transfer it to the Factor List box by clicking the middle arrow.
4. Click on Plots… to open the Explore:Plots dialogue box and deselect the Stem-and-
Leaf check box in the Descriptive group. If Stem-and-Leaf is already deselected
click on Continue.
5. Click on OK to run the procedure. The result of this procedure will be displayed on
the Output Viewer window. Examine and try to interpret the result.
5.2 The Descriptives Procedure
With Descriptives you can quickly generate summary statistical measures such as mean,
standard deviation, variance, maximum and minimum values, range and sum for a given
variable. Follow these instructions:
11
1. From the menu bar, select Analyze -> Descriptive Statistics -> Descriptives.... The
Descriptives dialogue box will appear on the screen.
2. Transfer the variable Current Salary [salary] into the Variable(s) box.
3. Select the Options pushbutton. The Descriptives: Options dialogue box will appear
on the screen. Notice that Mean, Std. deviation, Minimum and Maximum have
already been selected for you. These are the default statistics.
4. Also select these statistical measures: Variance, Range, Sum, and S.E mean. To
select an item click on the check box once. To deselect it click on it again once.
5. Select Continue to return to the Descriptives dialogue box.
6. Select OK to run the procedure.
Examine and attempt to interpret the output.
What are the main differences between the output from the Descriptives Procedure
compare to the output from the Explore Procedure?
5.3 The Frequencies Procedure
With the Frequencies procedure you can also generate summary statistical measures for a
given variable. Frequencies gives frequency distributions for all types of data (nominal,
ordinal and interval). This example concentrates on the quantitative variable Current
Salary [salary]. An example involving qualitative variables will be carried out in
Exercise 3. Follow these instructions:
1. From the menu bar, select Analyze -> Descriptive Statistics -> Frequencies.... The
Frequencies dialog box will appear on the screen. You my need to click on the Reset
button if this dialogue box has been used before.
2. Highlight the variable Current Salary [salary] and then click on the arrow pushbutton
to transfer it into the Variables(s) box.
3. Click on the Charts pushbutton to open the Frequencies: Charts dialogue box.
Click on the Histogram and click on With Normal Curve button in the Chart Type
group and then click on Continue.
4. Click on the Statistics pushbutton to open the Frequencies: Statistics dialogue box.
5. Select these statistics: Quartiles, Mean, Median, Mode, Sum and click on
Continue.
6. Click on Display frequency tables to deselect it. It is not appropriate to produce a
frequency table for interval (continuous) variable.
7. Click on OK to run the procedure.
Examine and interpret the output.
6 Exercise 3 - How to conduct an Exploratory Data Analysis - Qualitative Variable
The data file used in this example is stored \\campus\software\dept\spss. Follow these
instructions to open this file:
12
1. File -> Open -> Data…
2. In the text area for File name: type \\campus\software\dept\spss.
3. Click on Open and select the file called bloodtype.sav.
4. Click Open.
Study this file.
The most commonly used SPSS procedures for describing qualitative data are
Frequencies and Crosstabs. To conduct an exploratory data analysis on the data follow
these instructions:
6.1 The Frequencies Procedure
1. From the menu bar, select Analyze -> Descriptive Statistics -> Frequencies.... The
Frequencies dialogue box will appear on the screen.
2. Highlight the variables Blood Type [bloodtyp] and Gender [gender] then click on the
arrow pushbutton to transfer them into the Variables(s) box.
3. Click on the Charts pushbutton to open the Frequencies: Charts dialogue box.
Click on the Histogram and click on With Normal Curve buttons within the Chart
Type group and then click on Continue.
4. Click on OK to run the procedure. Examine and interpret the output.
6.2 The Crosstabs Procedure
This procedure is used to generate contingency tables from qualitative data. To carry out
this procedure follow these instructions:
1. From the menu bar, select Analyze -> Descriptive Statistics -> Crosstabs.... The
Crosstabs dialogue box will appear on the screen.
2. Highlight the variable Gender [gender] and click on the arrow pushbutton to transfer
it to the Row(s) text box.
3. Highlight the variable Blood Type [bloodtyp] and click on the arrow pushbutton to
transfer it to the Column(s) text box.
4. Click on OK to run the procedure. Examine and interpret the output.
To use the Chi-Square test and find out if gender is associated with blood type, the
contingency table must satisfy these assumptions:
No cell should have expected value (count) less than 0, and
No more than 20% of the cells have expected values (counts) less than 5
In order to perform the test we need to state the null and alternative hypotheses:
Null (Ho): There is no association between gender and blood type.
Alternative (H1): There is an association between gender and blood type.
To perform the test, follow these instructions:
13
1. Recall the Crosstabs dialogue box via Analyze -> Descriptive Statistics ->
Crosstabs....
2. Click Cells… Under Percentage select Row and click Continue
3. Click Statistics… Select Chi-square and click Continue
4. Click OK to run the procedure.
Examine and interpret the output. Will you accept or reject the null hypothesis? What
will you conclude?


