15
GETTING TRACTION Metrics@Work’s Inaugural Not Your Normal Lunch and Learn March 1, 2013 Presentation by Dr. John Yardley, PhD, President and Founding Partner, Metrics@Work

GETTING TRACTION
Metrics@Work’s Inaugural Not Your Normal Lunch and Learn March 1, 2013
Presentation by Dr. John Yardley, PhD, President and Founding Partner, Metrics@Work

Slide 2
Explanation of what we’re trying to achieve
1. We see a lot of variation in terms of how our client organizations “score” on employee Survey follow-up items
2. We also get asked a lot of times as to how to create strong change, but ….
3. We don’t get involved very often in an organization’s change efforts
4. So, …..
5. We ask you to help us all learn about creating strong change efforts, ….
6. “Strong” means change efforts that result in real changes, i.e., TRACTION.
7. To learn from each other, we have constructed a series of opportunities for you to interact and for you to provide us with your experiences and opinions, so, ….
8. We want the 3 hours to be efficient, engaging and fun – we need you to be ready to “jump-in” and “give it all you’ve got!”

The Front-line Team is a Critical Key to Positive Change and Better Services at your Organization
While there are a number of ways of creating positive change, there is no doubt that front-line teams are an important way of creating improvements across an organization. For instance:
“Front Line Service Providers: Quality is ultimately in the hands of those who actually deliver care. Their quality performance is dependent on their knowledge skills and attitudes, their beliefs about current levels of quality, their sense of the roles they play in quality, and their perception of the status quo. It also depends on how they define themselves as professionals – their values, aspirations, organizational ethos, information-seeking behaviours, sense of stewardship over resources, and inter-professional comfort levels.” (MacLeod, H. & Kirby, M. (2013). Courage A Rare Competency. Essays 2013. Longwood Publishing)
Front-line Team change actioning is literally a ground up approach to creating better services through stronger, more collaborative work environments
Slide 3

Simple Change Model: Moving from Survey Results to Action (Action Planning 101)
1. Current State
Are
a t
o b
e A
dd
ressed
by A
cti
on
s
Not Desired
Result
Desired
Result 4. Desired State
Positive change requires a front line unit’s staff to be aligned and agree with the desire to change and what to change, i.e., they take “ownership” in the effort and provide their discretionary effort to creating that change, i.e., they are “engaged” in the change processes
Slide 4

The Employee Engagement Survey is animportant part of quality improvement
at this Organization
Results from the last survey wereeffectively communicated
I feel that people at this Organizationhave acted on the results from the last
survey
Based on previous survey results,changes in my immediate work
environment have improved the qualityof my work life
13%
19%
27%
33%
16%
18%
20%
17%
36%
34%
22%
17%
25%
12%
7%
6%
StronglyDisagree
Disagree SomewhatDisagree
Neither Agreenor Disagree
SomewhatAgree
Agree StronglyAgree
Importance & Follow-up of survey from M@W Database
Slide 5
Database Top-2 Box
Percentage
Note: Surveys are seen in very positive light for quality improvement, organizations tend to do quite well in communicating the survey, but are much less able to “act on” the results, and even less able to create change, i.e., get traction. The hallmark of excellence in change efforts is “traction” – if your organization’s traction score is merely average – how could that be changed?
61% 74%
46% 65%
29% 57%
23% 52%
Database Average
out of 100

66
.0%
64
.0%
60
.0%
58
.0%
58
.0%
57
.0%
57
.0%
56
.0%
54
.0%
52
.0%
51
.0%
51
.0%
51
.0%
50
.0%
50
.0%
49
.0%
49
.0%
49
.0%
48
.0%
47
.0%
46
.0%
46
.0%
44
.0%
42
.0%
41
.0%
40
.0%
39
.0%
36
.0%
31
.0%
0.0%
10.0%
20.0%
30.0%
40.0%
50.0%
60.0%
70.0%
80.0%
1 2 3 4 5 6 7 8 9
10
11
Dat
abas
e
12
13
14
15
16
17
18
19
20
21
22
23
24
25
26
27
28
Slide 6
… changes in my immediate work environment have improved the quality of my work life BY Organizations
15% 13% 9% 7% 7% 6% 5% 5% 3% 1% 0% 0% 0%
-1% -1% -2% -2% -2% -3% -4% -5% -5% -7% -9% -10% -11% -12% -15%
-20%
Among the 28 most recent repeat client surveys, the highest scoring organization on “the traction item” is 66%, the lowest 31%, i.e., less than half as well as the highest! There’s lots of variation – why?

78
.6%
76
.7%
75
.0%
75
.0%
74
.1%
72
.2%
71
.3%
69
.4%
69
.2%
66
.7%
66
.7%
66
.7%
66
.7%
66
.7%
65
.0%
64
.4%
63
.3%
58
.3%
58
.3%
57
.1%
56
.9%
55
.9%
55
.6%
55
.0%
54
.2%
54
.2%
54
.2%
53
.3%
53
.1%
52
.8%
52
.1%
50
.0%
48
.6%
47
.9%
46
.7%
45
.4%
43
.0%
42
.2%
36
.1%
28
.3%
25
.4%
16
.7%
15
.2%
0.0%
10.0%
20.0%
30.0%
40.0%
50.0%
60.0%
70.0%
80.0%
37
31 1
35
29
42
40
34
15 3
21
23
32
39
38
33
18 2
27
41
36 6
30
26
Ove
rall
19
28
14
11
25
24
10 5 4 8
17
12
16
22 7
13 9
20
Slide 7
… changes in my immediate work environment have improved the quality of my work life BY Work Units in a client organization
24% 23% 21% 21% 20% 18% 17% 15% 15% 13% 13% 13% 13% 13% 11% 10% 9% 4% 4% 3% 3% 2% 1% 1% 0% 0% 0%
-1% -1% -1% -2% -4% -6% -6% -8% -9% -11% -12% -18%
-26% -29% -38% -39%
Within a single client organization with 42 front line units, the highest scoring unit on “the traction item” is 78.6%, the lowest 15.2%, i.e., 5 times less well as the highest! There’s lots of variation – why?

Y Axis: Desire Getting More Stuff Done at Work, i.e., Task Oriented Behaviours
Tension between
Efficiency/Effectiveness
and HRM
Tension between
Adaptability
(Creativity) and HRM
Tension between
Efficiency/Effectiveness &
Adaptability/Creativity
Z Axis: Desire for Better Human Resource Management (HRM) and Relationships, i.e., People Oriented Behaviours
X Axis: Desire for Better Adaptability and Creativity to improve effectiveness and efficiency, i.e., Change Oriented Behaviours
The Tensions Between the 3 Leadership Determinants of a Team’s Performance
Slide 8
Adapted from Yukl and Lepsinger (2005): Flexible Leadership: Creating
Value by Balancing Multiple Challenges and Choices. Jossey-Bass.

Increasing Task Oriented Behaviours
Usually means Decreasing Change Oriented Behaviours
Focusing on Task too much
Diminishes Ability to be
Adaptable and Creative
And/or Decreasing People Oriented Behaviours
Focusing on Task too much
Diminishes Ability to
Manage your People
Assumption: Managing Tasks, Change and People in a work system is done with finite resources, i.e., limited $’s, time, FTE’s, knowledge etc. Therefore, focusing on one area leads to diminishment in another.
What Happens when a team is told, “Just Get the Job Done!”
Consequently: An over-emphasis on getting tasks completed is accomplished to the detriment of positive change, so improvements in efficiencies and effectiveness are reduced or lost and / or managing your people gets left behind
Slide 9 Adapted from Yukl and Lepsinger (2005): Flexible Leadership: Creating
Value by Balancing Multiple Challenges and Choices. Jossey-Bass.

Slide 10
What does the Iceberg Metaphor in mean for change?
What is it really like under your team’s iceberg? Similarly for your Program / Division and Organization-as-a-whole?
One of the most common reasons for not addressing issues within a team is the inability of the team to respectfully “confront the elephant,” dialogue calmly, and reach consensus on solutions that are mutually accepted by all team members – do “icebergs” sink your change efforts?

Slide 11
Interactive Polling Solutions proudly
sponsored by

Adaptation of Healthy Workplace Strategies: Creating Change and Achieving Results (Lowe, G. 2004)
1. Supportive local work culture and values
2. Leadership and commitment from all staff and management)
3. Shared understanding of drivers to be changed
4. Participative team approach (i.e., consensual decision making)
5. Customized change plans (i.e., meeting the needs of individual units)
6. Links to a strategic plan with an accountability framework
7. Support and resources needed for change efforts
8. Evaluate progress and communicate
We took the Guiding Principles (p. 11) that Graham Lowe outlined and adapted them so that they more clearly reflect change among front line units.
The Guiding Principles for Change are:
Using clickers we want you to provide your opinion on the 3 Guiding Principles that provide the most challenge for Front-line Team change achieving traction

Which among the following 8 Factors, is the most challenging in your organization for creating front-line change and traction?
1 2 3 4 5 6 7 8
14%
31%
10%
5%
12%
5%
10%
14%
1. Supportive local work culture and values
2. Leadership (Commitment from all staff and management)
3. Shared understanding of drivers to be changed
4. Participative team approach (consensual decision making)
5. Customized change plan (meeting the needs of individual units)
6. Link to a strategic plan with an accountability framework
7. Support and resources for change efforts
8. Evaluate progress and Communicate

Which among the following 8 Factors, is the 2nd most challenging in your organization for creating front-line change and traction?
1 2 3 4 5 6 7 8
12%
26%
16%
5%
12%
7%
9%
14%
1. Supportive local work culture and values
2. Leadership (Commitment from all staff and management)
3. Shared understanding of drivers to be changed
4. Participative team approach (consensual decision making)
5. Customized change plan (meeting the needs of individual units)
6. Link to a strategic plan with an accountability framework
7. Support and resources for change efforts
8. Evaluate progress and Communicate
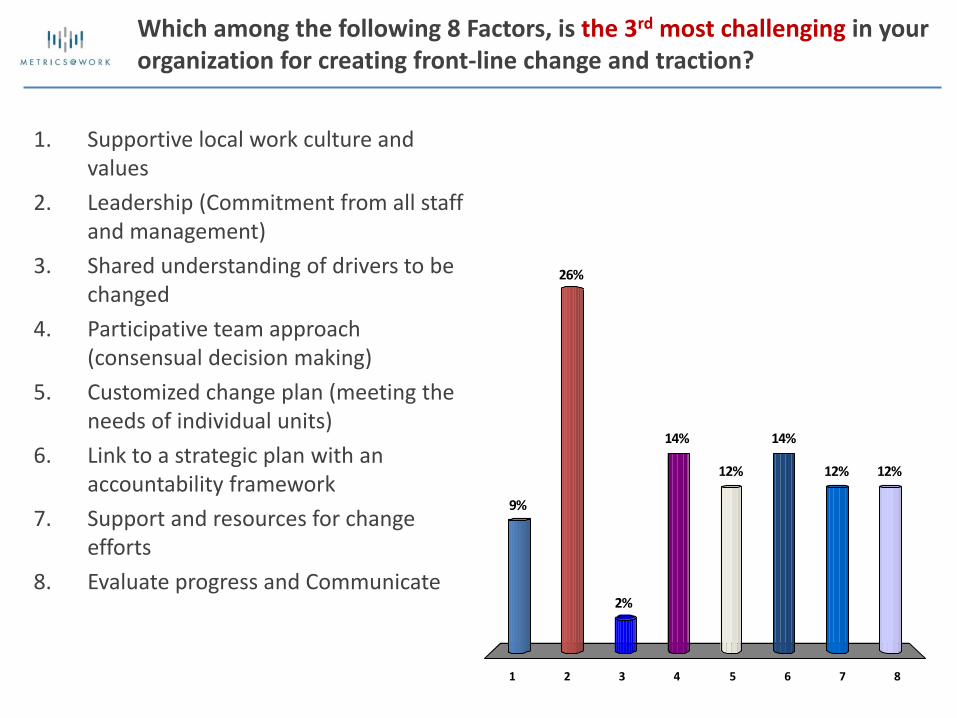
Which among the following 8 Factors, is the 3rd most challenging in your organization for creating front-line change and traction?
1 2 3 4 5 6 7 8
9%
26%
2%
12%12%
14%
12%
14%
1. Supportive local work culture and values
2. Leadership (Commitment from all staff and management)
3. Shared understanding of drivers to be changed
4. Participative team approach (consensual decision making)
5. Customized change plan (meeting the needs of individual units)
6. Link to a strategic plan with an accountability framework
7. Support and resources for change efforts
8. Evaluate progress and Communicate


