28
Getting the Community Involved in Dealing with Current Financial Realities May 17, 2012 Mohsin Dada CFP® CFO North Shore School District 112, Highland Park, IL

Getting the Community Involved in Dealing with Current Financial Realities
May 17, 2012
Mohsin Dada CFP®CFO
North Shore School District 112, Highland Park, IL

Objectives
Create Awareness of our available Financial Resources
Think of ways to Balance the District Budget, while maintaining the current level of services to our students
Address Significant Financial Impacts
Obtain Philosophical Agreement as to Budget Approach
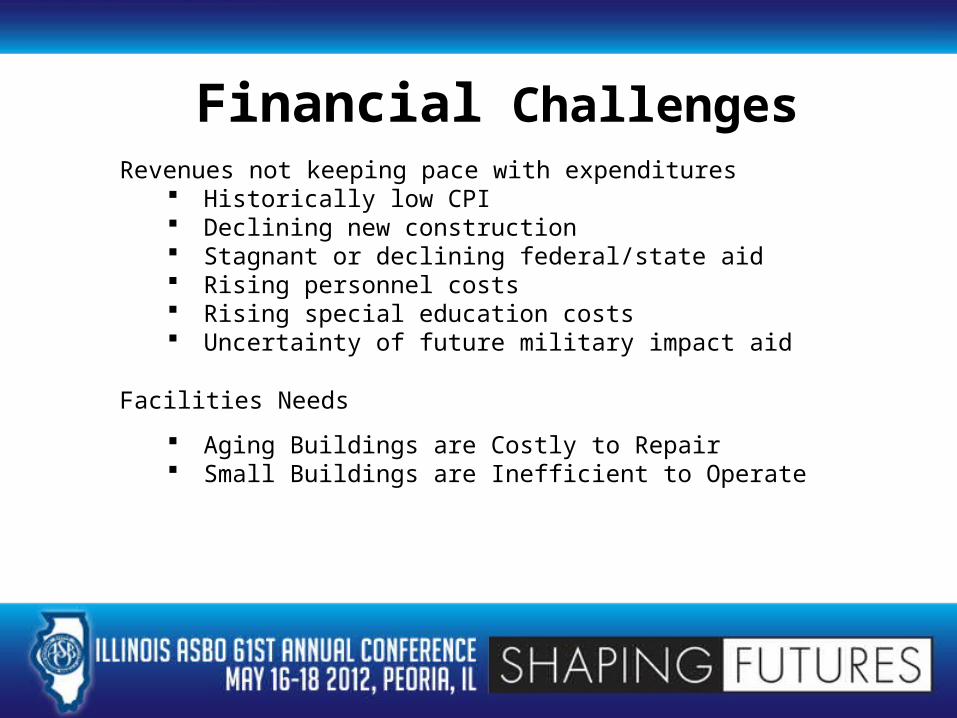
Financial ChallengesRevenues not keeping pace with expenditures
Historically low CPI Declining new construction Stagnant or declining federal/state aid Rising personnel costs Rising special education costs Uncertainty of future military impact aid
Facilities Needs
Aging Buildings are Costly to Repair Small Buildings are Inefficient to Operate

North Shore School District 112Revenue by Type – FY12

School Year Annual ExtraordinaryReimbursement Per Pupil
Annual Special EdPersonnel Reimbursement
1978-79 $2,000 Per Year $6,250 (Certified)
$2,500 (Non-Certified)
Proration rate assumed at 100% Proration rate assumed at 100%
1986-87 $2,000 Per Year $8,000 (Certified)
$2,800 (Non-Certified)
Proration rate assumed at 100% Proration rate assumed at 100%
1990-91 $2,000 Per Year $8,000 (Certified)
$2,800 (Non-Certified)
Actual Reimbursement: $1,973
ProrationRate: 100%
Proration Rate: 98.63%
1996-97 $2,000 Per Year $8,000 (Certified)
$2,800 (Non-Certified)
Actual
Actual Reimbursement: $1,734 $6,448 (Certified)
$2,327 (Non-Certified)
Proration rate: 86.71% Proration rate: 83.10%
2008 onwards The Reimbursement is no $9,000 (Certified)longer based on Special Education $3,500 (Non-Certified)
services and is calculatedas a % of regular education enrollment.
STATE SPECIAL EDUCATION REIMBURSEMENTS

Property tax levy is capped at CPI plus any new property growth
• Low CPI in last 3 years: average 1.43%• Nominal new property growth• Declining Equalized Assessed Valuation (total
property wealth of district) Interest Earnings < 1% No growth in state or federal funding
Factors Affecting Revenues As of December 2011

• Average CPI Increase, Last Three Years: 1.43%• Historic CPI Average 2.50%• Average New Construction, Last Three Years: .89%
FY12 0.35% (estimated)FY11 0.94%FY10 1.39%
• 8 Year New Construction Average: 1.43%
• Investment earnings at Historic Lows
Factors Affecting RevenuesProperty Taxes Capped at CPI Plus New Construction
As of December 2011

Factors Affecting RevenuesProperty Taxes Capped at CPI Plus New Construction
• Average CPI Increase, Last Four Years: 1.83%
• Historic CPI Average (Since 1992) 2.53%
• Average New Construction, Last Three Years: .93%FY12 0.46% FY11 0.94%FY10 1.39%
• 10 Year New Construction Average: 1.43%
• Investment earnings at Historic Lows

Factors Affecting RevenuesFiscal Year 2012 General State Aid
Amount of GSA per studentNumber of School Districts in the state 865
Foundation Level 625 $429 - $6,119Alternative Method 171 $219 - $428Flat Level 69 $218
General State Aid provides unrestricted grants-in-aid to school districts in an equitable manner.It is distributed in inverse proportion to local fiscal capacity, as measured by property tax wealth per student.North Shore School Dist 112 is relatively a wealthy school district in comparison to most school districts in the stateand is in the Flat Level of $218 per student.

State Categorical Reimbursements

10 YEARS OF DEFICIT - SURPLUS SPENDINGOur Financial History
FY 03 FY 04 FY 05 FY 06 FY 07 FY 08 FY 09 FY 10 FY 11 FY 12 (es-timated)
-$5,000,000
-$4,000,000
-$3,000,000
-$2,000,000
-$1,000,000
$0
$1,000,000
$2,000,000
$3,000,000
$4,000,000
729,040
-3,753,364 -1,381,418 -4,227,304 -3,835,041
3,542,599
-203,103 -679,886 -1,247,999 -1,346,185
Operating Surplus or Deficit after adjustment from Bond Proceeds, Capital Leases and Transfers

Operating Fund Projections with Fund Balance Target
Operating Funds – Education, Operations & Maintenance, Transportation, Illinois Municipal Retirement Fund, Tort and Working Cash
Aggregate View - Projection Summary
$3,209,975
($5,708,495)
$10,232,637
$15,652,151
$19,784,226
$22,942,981
($10,000,000)
($5,000,000)
$0
$5,000,000
$10,000,000
$15,000,000
$20,000,000
$25,000,000
2012 2013 2014 2015 2016 2017
FY-End Balances 25% of Expenditures

North Shore School District 112Expenditures by Type – FY12

Salaries and benefits account for close to 70% of budget– Salaries have risen by more than CPI– Medical insurance rates have risen by an average 9.34% in
past 3 years
Unfunded government mandates– Special Ed Costs– Transportation costs– ELL, NCLB, RtI
Repair and Maintenance of Aging Facilities
Factors Affecting Expenditures

Salaries by Staff Type
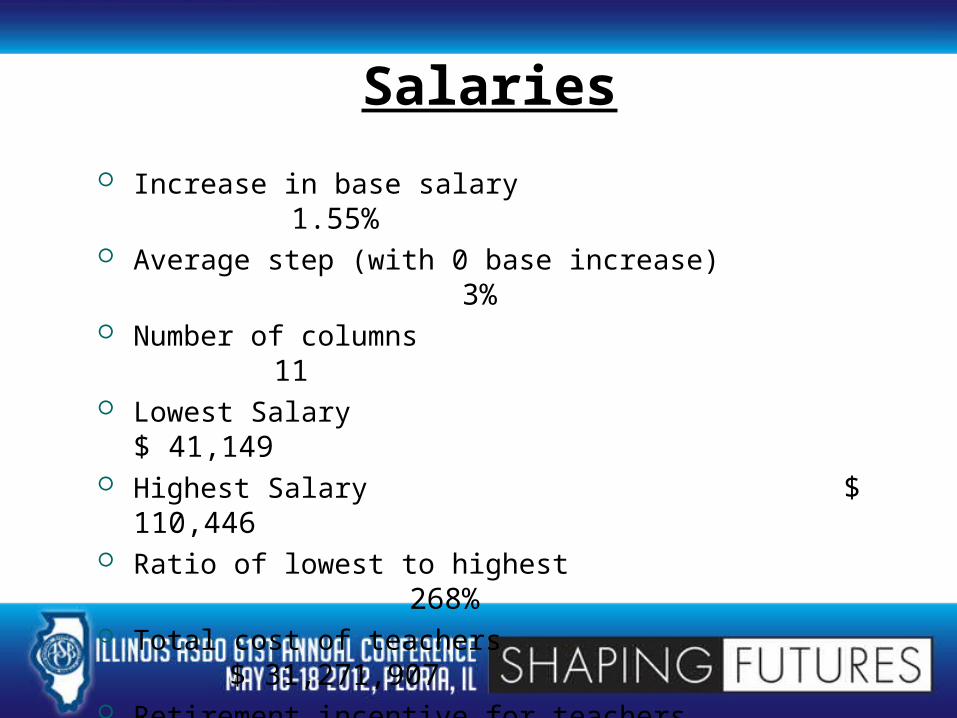
Salaries Increase in base salary
1.55% Average step (with 0 base increase)
3% Number of columns
11 Lowest Salary
$ 41,149 Highest Salary
$ 110,446 Ratio of lowest to highest
268% Total cost of teachers
$ 31,271,907 Retirement incentive for teachers
6% Number of teachers on retirement incentive
30
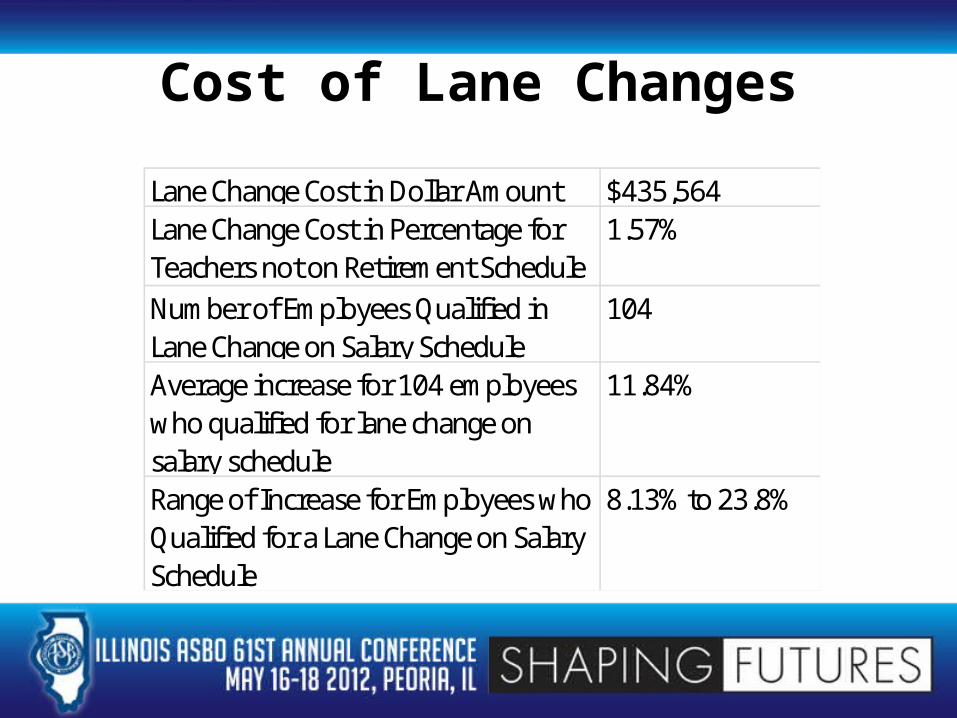
Cost of Lane Changes
Lane Change Cost in Dollar Amount $435,564 Lane Change Cost in Percentage for Teachers not on Retirement Schedule
1.57%
Number of Employees Qualified in Lane Change on Salary Schedule
104
Average increase for 104 employees who qualified for lane change on salary schedule
11.84%
Range of Increase for Employees who Qualified for a Lane Change on Salary Schedule
8.13% to 23.8%
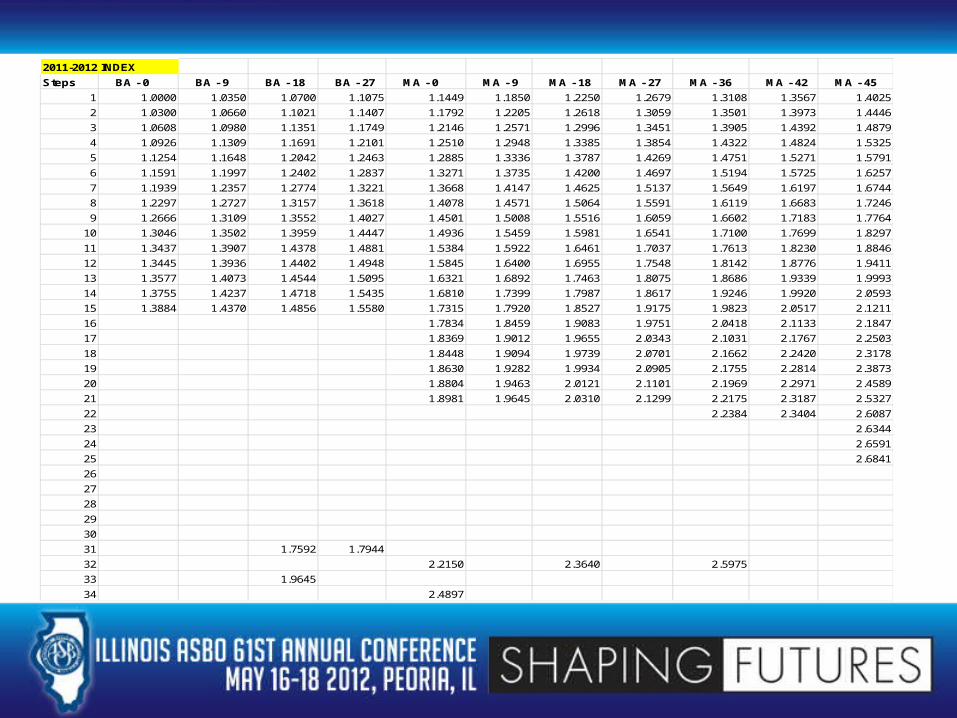
2011-2012 INDEXSteps BA - 0 BA - 9 BA - 18 BA - 27 MA - 0 MA - 9 MA - 18 MA - 27 MA - 36 MA - 42 MA - 45
1 1.0000 1.0350 1.0700 1.1075 1.1449 1.1850 1.2250 1.2679 1.3108 1.3567 1.40252 1.0300 1.0660 1.1021 1.1407 1.1792 1.2205 1.2618 1.3059 1.3501 1.3973 1.44463 1.0608 1.0980 1.1351 1.1749 1.2146 1.2571 1.2996 1.3451 1.3905 1.4392 1.48794 1.0926 1.1309 1.1691 1.2101 1.2510 1.2948 1.3385 1.3854 1.4322 1.4824 1.53255 1.1254 1.1648 1.2042 1.2463 1.2885 1.3336 1.3787 1.4269 1.4751 1.5271 1.57916 1.1591 1.1997 1.2402 1.2837 1.3271 1.3735 1.4200 1.4697 1.5194 1.5725 1.62577 1.1939 1.2357 1.2774 1.3221 1.3668 1.4147 1.4625 1.5137 1.5649 1.6197 1.67448 1.2297 1.2727 1.3157 1.3618 1.4078 1.4571 1.5064 1.5591 1.6119 1.6683 1.72469 1.2666 1.3109 1.3552 1.4027 1.4501 1.5008 1.5516 1.6059 1.6602 1.7183 1.7764
10 1.3046 1.3502 1.3959 1.4447 1.4936 1.5459 1.5981 1.6541 1.7100 1.7699 1.829711 1.3437 1.3907 1.4378 1.4881 1.5384 1.5922 1.6461 1.7037 1.7613 1.8230 1.884612 1.3445 1.3936 1.4402 1.4948 1.5845 1.6400 1.6955 1.7548 1.8142 1.8776 1.941113 1.3577 1.4073 1.4544 1.5095 1.6321 1.6892 1.7463 1.8075 1.8686 1.9339 1.999314 1.3755 1.4237 1.4718 1.5435 1.6810 1.7399 1.7987 1.8617 1.9246 1.9920 2.059315 1.3884 1.4370 1.4856 1.5580 1.7315 1.7920 1.8527 1.9175 1.9823 2.0517 2.121116 1.7834 1.8459 1.9083 1.9751 2.0418 2.1133 2.184717 1.8369 1.9012 1.9655 2.0343 2.1031 2.1767 2.250318 1.8448 1.9094 1.9739 2.0701 2.1662 2.2420 2.317819 1.8630 1.9282 1.9934 2.0905 2.1755 2.2814 2.387320 1.8804 1.9463 2.0121 2.1101 2.1969 2.2971 2.458921 1.8981 1.9645 2.0310 2.1299 2.2175 2.3187 2.532722 2.2384 2.3404 2.608723 2.634424 2.659125 2.684126 27 28 29 30 31 1.7592 1.7944 32 2.2150 2.3640 2.5975 33 1.9645 34 2.4897

Medical Insurance Costs
TYPETOTAL ANNUAL PREMIUM
PAID BY EMPLOYEE
PPO Single $8,532.00 - $8,532.00 (100%)HMO Single $5,208.00 - $5,208.00 (100%)DIFFERENCE $3,324.00 - $3,324.00
PPO Family $23,172.00 $11,388.00 $11,784.00HMO Family $14,124.00 $6,132.00 $7,992.00DIFFERENCE $9,048.00 $5,256.00 $3,792.00
PAID BY EMPLOYER

HMO/PPO Participation Ratio By Category 2011 All Employees
HMO PPO TOTAL
SINGLE 87 438 525% by Category 16.6% 83.4% 100.0%
FAMILY 44 54 98% by Category 44.9% 55.1% 100.0%
TOTAL 131 492 623% by Category 21.0% 79.0% 100.0%

Health Care Trend Rate History
0.0% 2.0% 4.0% 6.0% 8.0% 10.0% 12.0% 14.0% 16.0% 18.0%
2003
2004
2005
2006
2007
2008
2009
2010
2011
Year
Rates
PPO
HMO
10.7% (Projected)10.5% (Projected)
10.7%10.5%
10.7%
10.7%
10.4%
10.6%
11.2%10.9%
12.4%12.2%
13.0%13.2%
14.2%14.1%
15.7%16.4%
Source: Aon Consulting 2010 Health Care Trend Survey
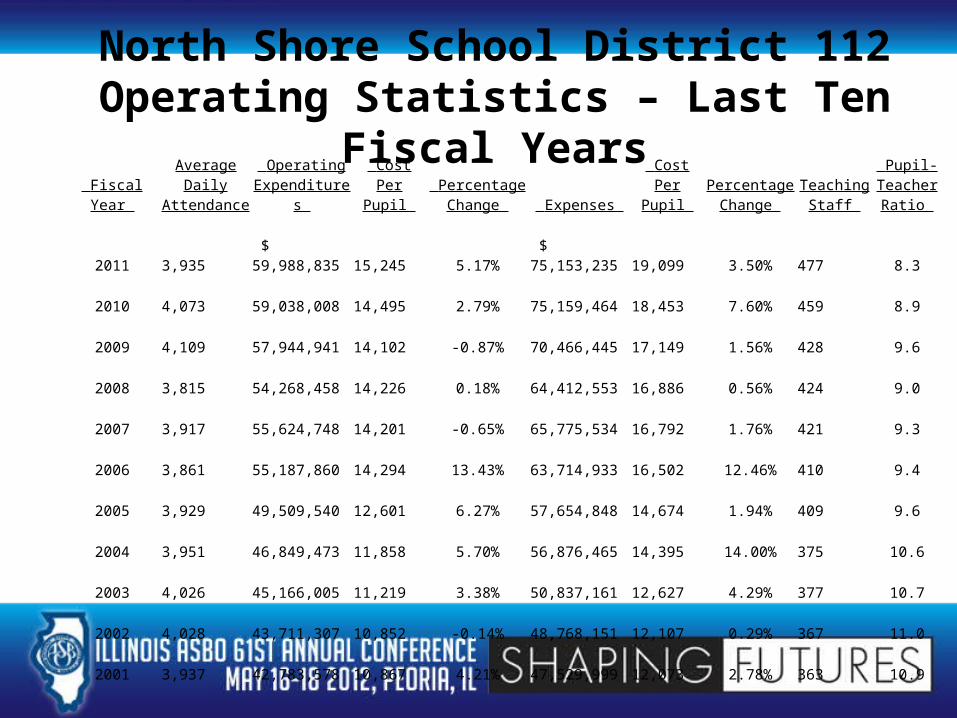
North Shore School District 112Operating Statistics – Last Ten Fiscal Years
Fiscal Year Average Daily
Attendance Operating
Expenditures Cost Per
Pupil Percentage
Change Expenses Cost Per
Pupil Percentage
Change Teaching
Staff
Pupil-Teacher Ratio
2011 3,935 $ 59,988,835 15,245 5.17% $ 75,153,235 19,099 3.50% 477 8.3
2010 4,073 59,038,008 14,495 2.79% 75,159,464 18,453 7.60% 459 8.9
2009 4,109 57,944,941 14,102 -0.87% 70,466,445 17,149 1.56% 428 9.6
2008 3,815 54,268,458 14,226 0.18% 64,412,553 16,886 0.56% 424 9.0
2007 3,917 55,624,748 14,201 -0.65% 65,775,534 16,792 1.76% 421 9.3
2006 3,861 55,187,860 14,294 13.43% 63,714,933 16,502 12.46% 410 9.4
2005 3,929 49,509,540 12,601 6.27% 57,654,848 14,674 1.94% 409 9.6
2004 3,951 46,849,473 11,858 5.70% 56,876,465 14,395 14.00% 375 10.6
2003 4,026 45,166,005 11,219 3.38% 50,837,161 12,627 4.29% 377 10.7
2002 4,028 43,711,307 10,852 -0.14% 48,768,151 12,107 0.29% 367 11.0
2001 3,937 42,783,578 10,867 4.21% 47,529,999 12,073 2.78% 363 10.9

North Shore School District 112Current Situation

Compounding Effect of Expenditures Exceeding Revenues

North Shore School District 112Summary of Major Expenditures Assumptions
No Shift of Pension Obligation to the local Board of Education from the State of Illinois Pension Rate for Employer to stay at 0.58% THIS (TRS Health) Employer Rate 0.66% TRS Federal Fund pension rate 25.12% Health Insurance increase 10% Dental Insurance increase 6% Enrollment no significant change Staffing no change No significant change in Impact Aid Retirees FY13 – 5, FY14 – 6, FY 15 – 9, FY 16 – 0 New hire replacement BA-Step 6 $48,435
SCFAC Recommendations District must address key cost drivers. Items the committee
identified that can be addressed in the FY13 budget include:– Personnel
o Consider further personnel reductions to obtain student/staff ratios that are more in line with district guidelines
o Consider reviewing allocation guidelines for special education related personnel: teachers, social workers, speech therapists, classroom aides and paraprofessional staff
– Compensationo Consider restructuring employee healthcare benefits

Strong reserve balance Strong tax base Good financial
management Low debt level /
Capacity for additional debt
Valuable real estate assets
Strong credit rating High tax collection
rates High revenue per
student Engaged community
perceives high value
Financial Strengths

ANY QUESTIONS???


