Granta Design and secruoser/noitacude/moc.ngisedatnarg.wwwybhsA.F.M
Professor Mike Ashby
Department of Engineering
University of Cambridge
www.grantadesign.com/education/resources
This Getting Started Guide is part of a set of open access teaching resources created by Mike Ashby to help introduce students to materials, processes and rational selection.
The Teaching Resources website aims to support teaching of materials-related courses in Design, Engineering and Science.
Resources come in various formats and are aimed primarily at undergraduate education. Some like this are open access.
references to books by Ashby, Askeland, Callister,
Shackelford and more...
Use CES Constructor to build your own databases.
Apply CES Selector and GRANTA MI for advanced
teaching, research, and industry.
Editions for design, eco design, polymers,
aerospace, bio engineering, architecture and the
built environment.
Unique tools to compare and analyze properties and
to select materials and processes.
Materials and Process Information
Specialist Databases
Interactive Materials Property Charts
Eco Audit Tool
Science Notes
Advanced Software
Getting started with CES EduPack
Granta Design and M.F. Ashby 2012 www.grantadesign.com/education/resources
1
Getting started with CES EduPack
These exercises give an easy way to learn to use the CES EduPack software. The comprehensive CES Help file within the software gives more detailed guidance.
Thumbnail sketch of CES EduPack
The CES EduPack software has three Levels of Database. Coverage Content Level 1 Around 70 of the most widely used materials
drawn from the classes: metals, polymers, ceramics, composites, foams and natural materials. Around 70 of the most widely used processes.
A description, an image of the material in a familiar product, typical applications, and limited data for mechanical, thermal and electrical properties, using rankings where appropriate.
Level 2 Around 100 of the most widely used materials. Around 110 of the most commonly used processes.
All the content of Level 1, supplemented by more extensive numerical data, design guidelines, ecological properties and technical notes.
Level 3 The core database contains more than 3,750 materials, including those in Levels 1 and 2. Specialist editions covering aerospace, polymers, eco-design, architecture, bio-materials and low carbon power are also available.
Extensive numerical data for all materials, allowing the full power of the CES selection system to be deployed.
When the software opens you are asked to choose a Level. Chose Level 1 to start with.
At each Level there are a number of Data Tables. The most important are: Materials and Processes.
Each of the three levels can be interrogated by • BROWSING Exploring the database and retrieving records via a hierarchical index. • SEARCHING Finding information via a full-text search of records. • SELECTION Using the powerful selection engine to find records that meet an array of design criteria.
CES EduPack does far more than this. But this is enough to get started.
Getting started with CES EduPack
Granta Design and M.F. Ashby 2012 www.grantadesign.com/education/resources
2
BROWSING and SEARCHING The DEFAULT on loading CES EduPack Levels 1 & 2 is LEVEL 1, MATERIALUNIVERSE
Exercise 1 BROWSE materials • Find record for STAINLESS STEEL • Find record for CONCRETE • Find record for POLYPROPYLENE • Explore POLYPROPYLENE record at LEVEL 2 • Find PROCESSES that can shape POLYPROPYLENE
using the LINK at the bottom of the record
Exercise 2 BROWSE processes Select LEVEL 2, ALL PROCESSES • Find record for INJECTION MOLDING • Find record for LASER SURFACE HARDENING • Find record for FRICTION WELDING (METALS) • Find MATERIALS that can be DIE CAST ,
using the LINK at the bottom of the record for DIE CASTING
Exercise 3 The SEARCH facility • Find the material POLYLACTIDE • Find materials for CUTTING TOOLS • Find the process RTM
(Part of a material record and a process record are shown overleaf)
Browse SelectSearch
Ceramics and glasses
Hybrids: composites etc
Metals and alloys
Polymers and elastomers
MaterialUniverse
++++
File Edit View Select Tools Window
MaterialUniverse
Edu Level 1
Table:
Subset:
File Edit View Select Tools Window
Browse SelectSearch
Joining
Shaping
Surface treatment
ProcessUniverse
+++
ProcessUniverse
Edu Level 2
Table:
Subset:
Browse SelectSearch
Look in table:
Polylactide
MaterialUniverse
Find what:
Getting started with CES EduPack
Granta Design and M.F. Ashby 2012 www.grantadesign.com/education/resources
3
Part of a record for a material: polypropylene Part of a record for a process: injection molding
Polypropylene (PP) (CH2-CH(CH3))n Polypropylene, PP, first produced commercially in 1958, is the younger brother of polyethylene - a very similar molecule with similar price, processing methods and application. Like PE it is produced in very large quantities (more than 30 million tons per year in 2000), growing at nearly 10% per year, and like PE its molecule-lengths and side-branches can be tailored by clever catalysis, giving precise control of impact strength, and of the properties that influence molding and drawing. In its pure form polypropylene is flammable and degrades in sunlight. Fire retardants make it slow to burn and stabilizers give it extreme stability, both to UV radiation and to fresh and salt water and most aqueous solutions. General properties Density 890 - 910 kg/m^3 Price * 1.89 - 2.07 USD/kg Mechanical properties Young’s modulus 0.896 - 1.55 GPa Shear modulus 0.316 - 0.548 GPa Bulk modulus 2.5 - 2.6 GPa Poisson’s ratio 0.405 - 0.427 Yield strength (elastic limit) 20.7 - 37.2 MPa Tensile strength 27.6 - 41.4 MPa Compressive strength 25.1 - 55.2 MPa Elongation 100 - 600 % Hardness - Vickers 6.2 - 11.2 HV Fatigue strength at 10^7 cycles 11 - 16.6 MPa Fracture toughness 3 - 4.5 MPa.m^0.5 Mechanical loss coefficient 0.0258 - 0.0446 Thermal properties Melting point 150 - 175 °C Glass temperature -25.15 - -15.15 °C Maximum service temperature 100 - 115 °C Minimum service temperature -123 - -73.2 °C Thermal conductor or insulator? Good insulator Thermal conductivity 0.113 - 0.167 W/m.°C Specific heat capacity 1.87e3 - 1.96e3 J/kg.°C Thermal expansion coefficient 122 - 180 µstrain/°C Design guidelines Standard grade PP is inexpensive, light and ductile but it has low strength. It is more rigid than PE and can be used at higher temperatures. The properties of PP are similar to those of HDPE but it is stiffer and melts at a higher temperature (165 - 170 C). Stiffness and strength can be improved further by reinforcing with glass, chalk or talc. When drawn to fiber PP has exceptional strength and resilience; this, together with its resistance to water, makes it attractive for ropes and fabric. It is more easily molded than PE, has good transparency and can accept a wider, more vivid range of colors. PP is commonly produced as sheet, moldings fibers or it can be foamed. Advances in catalysis promise new co-polymers of PP with more attractive combinations of toughness, stability and ease of processing. Mono-filaments fibers have high abrasion resistance and are almost twice as strong as PE fibers. Multi-filament yarn or rope does not absorb water, will float on water and dyes easily. Technical notes The many different grades of polypropylene fall into three basic groups: homopolymers (polypropylene, with a range of molecular weights and thus properties), co-polymers (made by co-Polymerization of propylene with other olefines such as ethylene, butylene or styrene) and composites (polypropylene reinforced with mica, talc, glass powder or fibers) that are stiffer and better able to resist heat than simple polypropylenes. Typical uses Ropes, general polymer engineering, automobile air ducting, parcel shelving and air-cleaners, garden furniture, washing machine tank, wet-cell battery cases, pipes and pipe fittings, beer bottle crates, chair shells, capacitor dielectrics, cable insulation, kitchen kettles, car bumpers, shatter proof glasses, crates, suitcases, artificial turf, thermal underwear.
Injection molding No other process has changed product design more than INJECTION MOLDING. Injection molded products appear in every sector of product design: consumer products, business, industrial, computers, communication, medical and research products, toys, cosmetic packaging and sports equipment. The most common equipment for molding thermoplastics is the reciprocating screw machine, shown schematically in the figure. Polymer granules are fed into a spiral press where they mix and soften to a dough-like consistency that can be forced through one or more channels (‘sprues’) into the die. The polymer solidifies under pressure and the component is then ejected. Thermoplastics, thermosets and elastomers can all be injection molded. Co-injection allows molding of components with different materials, colors and features. Injection foam molding allows economical production of large molded components by using inert gas or chemical blowing agents to make components that have a solid skin and a cellular inner structure. Shape Circular prismatic True Non-circular prismatic True Solid 3-D True Hollow 3-D True Physical attributes Mass range 0.001 - 25 kg Range of section thickness 0.4 - 6.3 mm Tolerance 0.07 - 1 mm Roughness 0.2 - 1.6 µm Surface roughness (A=v. smooth) A Process characteristics Primary shaping processes True Discrete True Economic attributes Relative tooling cost very high Relative equipment cost high Economic batch size (units) 10000 - 1e6 Design guidelines Injection molding is the best way to mass-produce small, precise, polymer components with complex shapes. The surface finish is good; texture and pattern can be easily altered in the tool, and fine detail reproduces well. Decorative labels can be molded onto the surface of the component (see In-mold Decoration). The only finishing operation is the removal of the sprue. Technical notes Most thermoplastics can be injection molded, although those with high melting temperatures (e.g. PTFE) are difficult. Thermoplastic-based composites (short fiber and particulate filled) can be processed providing the filler-loading is not too large. Large changes in section area are not recommended. Small re-entrant angles and complex shapes are possible, though some features (e.g. undercuts, screw threads, inserts) may result in increased tooling costs. The process may also be used with thermosets and elastomers. The most common equipment for molding thermoplastics is the reciprocating screw machine, shown schematically in the figure. Polymer granules are fed into a spiral press where they mix and soften to a dough-like consistency that can be forced through one or more channels (‘sprues’) into the die. The polymer solidifies under pressure and the component is then ejected. Typical uses Extremely varied. Housings, containers, covers, knobs, tool handles, plumbing fittings, lenses, etc. The economics Capital cost are medium to high, tooling costs are usually high - making injection molding economic only for large batch sizes. Production rate can be high particularly for small moldings. Multi-cavity molds are often used. Prototype moldings can be made using single cavity molds of cheaper materials. Typical products. Housings, containers, covers, knobs, tool handles, plumbing fittings, lenses.
Getting started with CES EduPack
Granta Design and M.F. Ashby 2012 www.grantadesign.com/education/resources
4
PROPERTY CHARTS
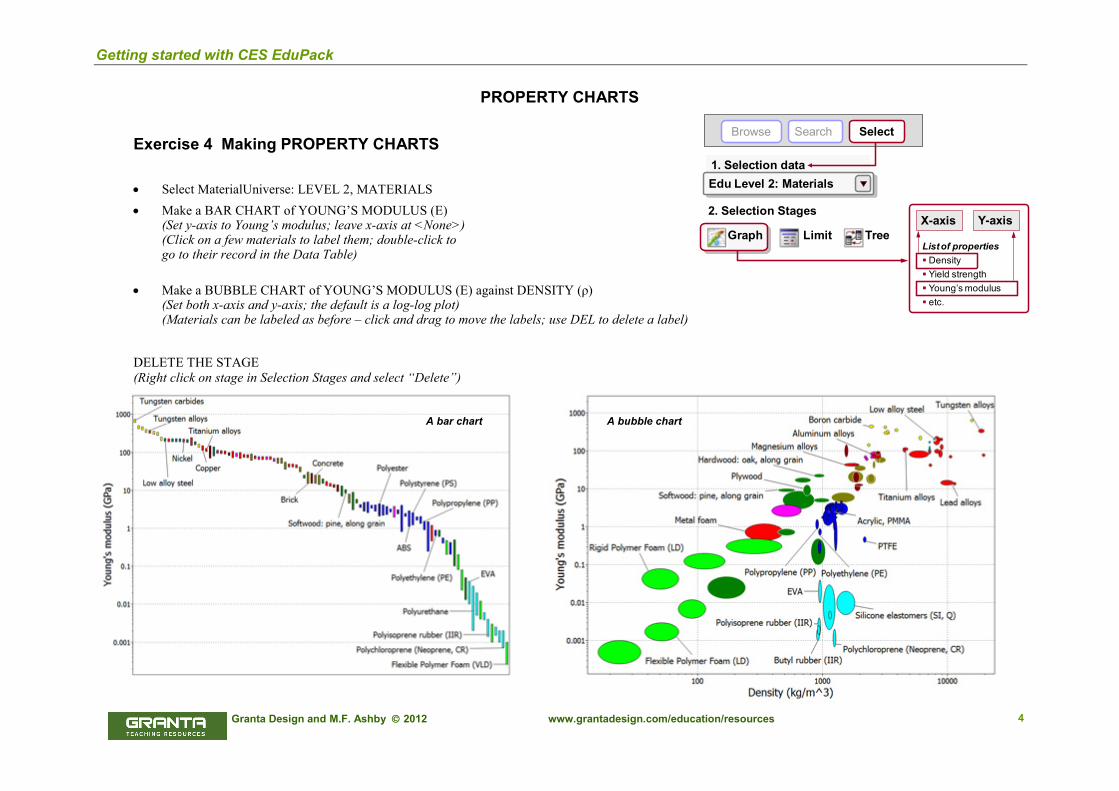
Exercise 4 Making PROPERTY CHARTS
• Select MaterialUniverse: LEVEL 2, MATERIALS • Make a BAR CHART of YOUNG’S MODULUS (E)
(Set y-axis to Young’s modulus; leave x-axis at <None>) (Click on a few materials to label them; double-click to go to their record in the Data Table)
• Make a BUBBLE CHART of YOUNG’S MODULUS (E) against DENSITY (ρ) (Set both x-axis and y-axis; the default is a log-log plot) (Materials can be labeled as before – click and drag to move the labels; use DEL to delete a label)
DELETE THE STAGE (Right click on stage in Selection Stages and select “Delete”)
A bar chart A bubble chart
Browse SelectSearch
1. Selection dataEdu Level 2: Materials
X-axis Y-axis
List of properties Density Yield strength Young’s modulus etc.
2. Selection Stages
Graph Limit Tree
Getting started with CES EduPack
Granta Design and M.F. Ashby 2012 www.grantadesign.com/education/resources
5
SELECTION using a LIMIT STAGE
Exercise 5 Selection using a LIMIT stage
• Find materials with: MAX. SERVICE TEMPERATURE > 200 °C THERMAL CONDUCTIVITY > 25 W/m.°C ELECTRICAL CONDUCTOR = GOOD INSULATOR OR INSULATOR? (Enter the limits – minimum or maximum as appropriate – and click “Apply”) (Results at Level 1 or 2: aluminum nitride, alumina, silicon nitride)
Granta Design and M.F. Ashby 2012 www.grantadesign.com/education/resources
6
GRAPH SELECTION
Exercise 6 Selection with a GRAPH stage • Make a BAR CHART of YIELD STRENGTH ( yσ ) (plotted on the y-axis) • Use a BOX SELECTION to find materials with high values of elastic limit (or strength)
(Click the box icon, then click-drag-release to define the box) • Add, on the other axis, DENSITY (ρ )
(Either: highlight Stage 1 in Selection Stages, right-click and choose Edit Stage from the menu; or double-click the graph axis to edit)
• Use a BOX SELECTION to find materials with high strength and low density • Replace the BOX with a LINE SELECTION to find materials with high values
of the “specific strength”, ρσ /y (Click the gradient line icon, then enter slope: “1” in this case. Click on the graph to position the line through a particular point. Click above or below the line to select an area: above the line for high values of ρσ /y in this case. Now click on the line and drag upwards, to refine the selection to fewer materials.)
(Results at Level 1 or 2: CFRP (isotropic), Titanium alloys, Magnesium alloys, …) DELETE THE STAGE
Granta Design and M.F. Ashby 2012 www.grantadesign.com/education/resources
7
TREE SELECTION Exercise 7 Selection with a TREE Stage • Find MATERIALS that can be MOLDED
(In Tree Stage window, select ProcessUniverse, expand “Shaping” in the tree, select Molding, and click “Insert”, then OK)
DELETE THE STAGE • Find PROCESSES to join STEELS
(First change Selection Data to select Processes: LEVEL 2, JOINING PROCESSES) (Then, in Tree Stage window, select MaterialUniverse, expand “Metals and alloys” in the tree, select Ferrous, and click “Insert”, then OK)
DELETE THE STAGE
2. Selection StagesGraph Limit Tree
Tree stage for material
Material
Ceramics Steels
Hybrids Al alloys
Metals Cu alloys
Polymers Ni alloys...
Join
ShapeSurface
Process
CastDeformMoldComposite PowderPrototype
Tree stage for process
Browse SelectSearch Search web
1. Selection dataEdu Level 2: Materials
Results X out of 95 pass
Material 1Material 2Material 3Material 4etc...
Getting started with CES EduPack
Granta Design and M.F. Ashby 2012 www.grantadesign.com/education/resources
8
GETTING IT ALL TOGETHER Exercise 8 Using ALL 3 STAGES together Change Selection Data to select Materials:
Select LEVEL 2, MATERIALS
Find MATERIALS with the following properties • DENSITY < 2000 kg/m3 • STRENGTH (Elastic limit) > 60 MPa • THERMAL CONDUCTIVITY < 10 W/m.°C
(3 entries in a Limit Stage)
• Can be MOLDED (a Tree Stage: ProcessUniverse – Shaping – Molding)
• Rank the results by PRICE (a Graph Stage: bar chart of Price) (On the final Graph Stage, all materials that fail one or more stages are grayed-out; label the remaining materials, which pass all stages. The RESULTS window shows the materials that pass all the stages.)
Exercise 9 Finding SUPPORTING INFORMATION (Requires Internet connection) • With the PET record open, click on SEARCH WEB
(CES EduPack translates the material ID to strings compatible with a group of high-quality material and process information sources and delivers the hits. Some of the sources are open access, others require a subscriber-based password. The ASM source is particularly recommended.)
CLOSE THE DATASHEET
Pric
e
Stacked stages
Browse Search Select Search web
1. Selection dataEdu Level 2: Materials
DensityModulusStrengthT-conduction
2000
6010
Min Max
ProcessJoin
ShapeSurface
CastDeformMoldComposite PowderPrototype
2. Selection StagesGraph Limit Tree
Results X out of 95 pass
Material 1 2230 113Material 2 2100 300Material 3 1950 5.6etc...
RankingProp 1 Prop 2
Intersection of all 3 stages
Getting started with CES EduPack
Granta Design and M.F. Ashby 2012 www.grantadesign.com/education/resources
9
PROCESS SELECTION
Exercise 10 Selecting PROCESSES
Change Selection Data to select Processes: Select LEVEL 2, SHAPING PROCESSES
Find PRIMARY SHAPING PROCESSES to make a component with: • SHAPE = Dished sheet • MASS = 10 – 12 kg • SECTION THICKNESS = 4 mm • ECONOMIC BATCH SIZE > 1000
(5 entries in a Limit Stage)
• Made of a THERMOPLASTIC (a Tree Stage: MaterialUniverse – Polymers and elastomers – Polymers – Thermoplastics)
Granta Design and M.F. Ashby 2012 www.grantadesign.com/education/resources
10
SAVING, COPYING and REPORT WRITING
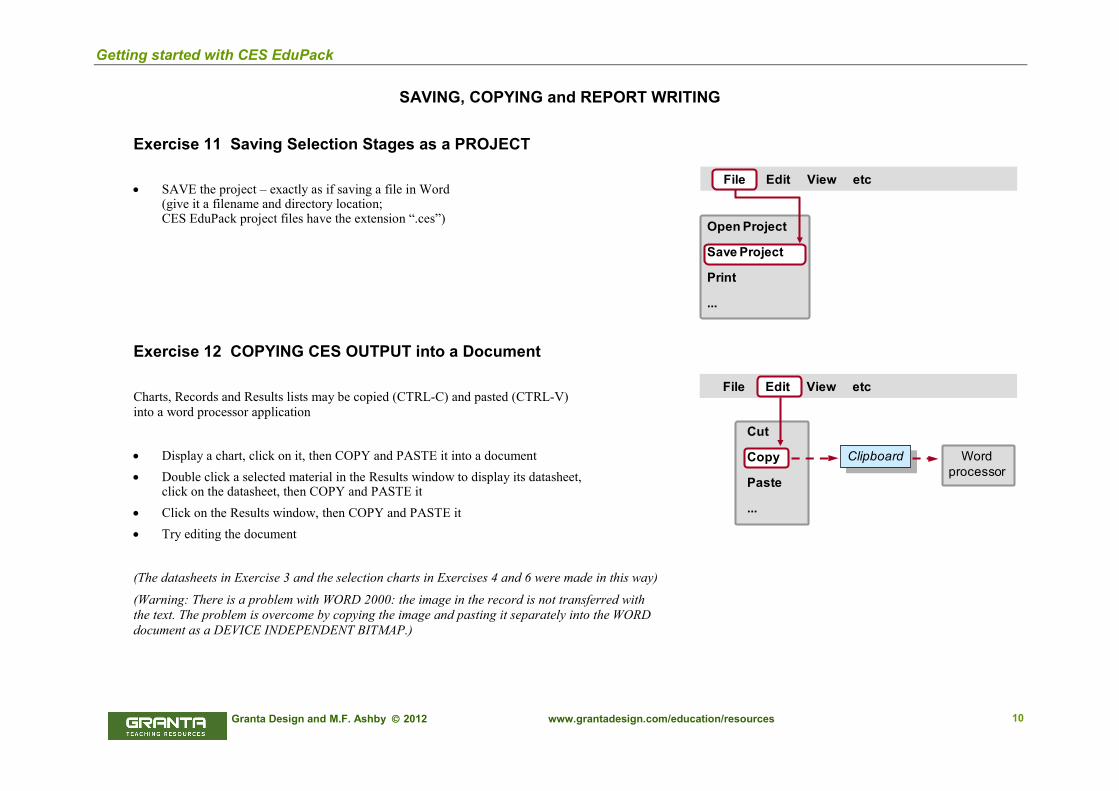
Exercise 11 Saving Selection Stages as a PROJECT
• SAVE the project – exactly as if saving a file in Word (give it a filename and directory location; CES EduPack project files have the extension “.ces”)
Exercise 12 COPYING CES OUTPUT into a Document
Charts, Records and Results lists may be copied (CTRL-C) and pasted (CTRL-V) into a word processor application
• Display a chart, click on it, then COPY and PASTE it into a document • Double click a selected material in the Results window to display its datasheet,
click on the datasheet, then COPY and PASTE it • Click on the Results window, then COPY and PASTE it • Try editing the document
(The datasheets in Exercise 3 and the selection charts in Exercises 4 and 6 were made in this way)
(Warning: There is a problem with WORD 2000: the image in the record is not transferred with the text. The problem is overcome by copying the image and pasting it separately into the WORD document as a DEVICE INDEPENDENT BITMAP.)
File Edit View etc
Open Project
Save Project
Print
...
File Edit View etc
Cut
Copy
Paste
...
Clipboard Word processor
Getting started with CES EduPack
Granta Design and M.F. Ashby 2012 www.grantadesign.com/education/resources
11
ECO AUDIT
The Eco Audit Tool calculates the energy used and CO2 produced during five key life phases of a product (material, manufacture, transport, use and end of life) and identifies which is the dominant phase. This is the starting point for eco-aware product design, as it identifies which parameters need to be targeted to reduce the eco-footprint of the product.
An example Eco Audit product file (.prd) for this case study is installed with CES EduPack in the ‘Samples’ folder.
Exercise 13 ECO AUDIT Project A brand of bottled mineral water is sold in 1 liter PET bottles with polypropylene caps. A bottle weighs 40 grams; the cap 1 gram. Bottles and caps are molded, filled, and transported 550 km from the French Alps to England by 14 tonne truck, refrigerated for 2 days and then sold. The overall life of the bottle is one year.
Product Definition
(For an explanation of the calculations used in each stage, click the help icon in the heading)
1. Material, manufacture and end of life Bill of materials, primary processing techniques and end of life
2. Transport Transportation from site of manufacture to point of sale
Eco AuditToolsBrowse Search Select
Product name: PET Bottle
Eco Audit Project
Product Definition Compare with… Clear Open Save
Quantity Component name Material Recycle content Primary process Mass (kg) End of life
0%
100%
Landfill
Combust
Downcycle
Recycle
Re-manufacture
Reuse
100 0.04Molding0% RecyclePETBottle
Molding
Extrusion
100 0.001Molding0% CombustPPCap
100 1Water
MaterialUniverseCeramics and glasses
Hybrids: composites etc
Metals and alloys
Polymers and elastomers
Elastomers
Polymers
PET
Thermoplastics
None
Stage name Transport type Distance (km)
Bottling plant to point of sale 14 tonne truck 550
Sea freight
Rail freight
14 tonne truck
Air freight – long haul
...
Getting started with CES EduPack
Granta Design and M.F. Ashby 2012 www.grantadesign.com/education/resources
12
3. Use Product life and location of use
Static mode Energy used to refrigerate product at point of sale (average energy required to refrigerate 100 bottles at 4°C = 0.12 kW)
4. Report enables rapid identification of the dominant life phase. View energy usage or CO2 footprint.
(Result: Material is the dominant life phase)
• Click on the Material life phase bar in the summary chart for guidance on strategies to reduce its impact
provides a component by component breakdown of each life phase, enabling the main contributors to the dominant phase to be identified
Energy CO2
Product life: 1 years
United KingdomCountry electricity mix:
France
Germany
United Kingdom
...
Product uses the following energy:
Energy input and output:
Power rating:
Usage:
Usage:
Electric to mechanical (electric motors)
days per year
hours per day
0.12 kW
2
24
Fossil fuel to thermal, enclosed systemFossil fuel to electricElectric to thermalElectric to mechanical (electric motors)...
Summary chart
Detailed report
Getting started with CES EduPack
Granta Design and M.F. Ashby 2012 www.grantadesign.com/education/resources
13
Exercise 14 COMPARE Eco Audits
• Compare eco audits
(In Product Definition page, click “Compare with”, then select Copy of current product.)
• In the copy, change product name to ‘PET Bottle (Recycled)’
For the material PET
• Change the RECYCLED CONTENT to 35%
Note the first life energy (not including the ‘EoL potential’) is reduced by 12%
• Click COPY to copy the chart and PASTE it into a document
Eco Audit Project
Product Definition Compare with… Clear Open Save
Copy of current product
New product
Saved product…
Energy CO2 Copy Print
Getting started with CES EduPack
Granta Design and M.F. Ashby 2012 www.grantadesign.com/education/resources
14
Exercise 15 Saving Eco Audit Product Definition Eco audit projects do not form part of a selection project and need to be saved separately
• SAVE the product definition (give it a filename and directory location; Eco Audit product files have the extension “.prd”)
Exercise 16 Saving/Exporting Eco Audit Report
• GENERATE the eco audit report • EXPORT the eco audit report as a PDF (Note: You will require Microsoft Excel or a PDF reader such as Adobe Reader to view the exported eco audit report)
Eco Audit Project
Product Definition Compare with… Clear Open Save
Eco Audit Project
Report
Detailed report
Print Export
Excel
PDF
Word
Getting started with CES EduPack
Granta Design and M.F. Ashby 2012 www.grantadesign.com/education/resources
15
Appendices
Getting started with CES EduPack
Granta Design and M.F. Ashby 2012 www.grantadesign.com/education/resources
16
Toolbars in CES EduPack
Figure A1. The Standard toolbar in CES EduPack
Figure A2. The Graph Stage toolbar in CES EduPack
Browse the database
tree
Select entities using design
criteria
Eco Audit
tool
Search for text in the database
Search for information on the Web
CES Help and
Video Tutorials
Favorites, Hybrid Synthesizer and other options
Delete selection Box selection
Add envelopes Result intersection
Line selection Show user defined records Show synthesized records
Show favorites
Hide failed records
Add text Un-zoom Zoom
Getting started with CES EduPack
Granta Design and M.F. Ashby 2012 www.grantadesign.com/education/resources
17
Physical constants and conversion of units Absolute zero temperature Acceleration due to gravity, g Avogadro’s number, NA Base of natural logarithms, e Boltzmann’s constant, k Faraday’s constant k Gas constant, R Planck’s constant, h Velocity of light in vacuum, c Volume of perfect gas at STP
-273.2oC 9.807m/s2 6.022 x 10²³ 2.718 1.381 x 10⁻²³ J/K 9.648 x 10⁴ C/mol 8.314 J/mol/K 6.626 x 10⁻³⁴ Js 2.998 x 10⁸ m/s 22.41 x 10⁻³ m3/mol
Angle, θ 1 rad 57.30o Density, ρ 1 lb/ft3 16.03 kg/m3 Diffusion Coefficient, D 1cm3/s 1.0 x 10⁻⁴m2/s Energy, U See opposite Force, F 1 kgf
1 lbf 1 dyne
9.807 N 4.448 N 1.0 x 10⁻⁵N
Length, 1 ft 1 inch 1 Å
304.8 mm 25.40 mm 0.1 nm
Mass, M 1 tonne 1 short ton 1 long ton 1 lb mass
1000 kg 908 kg 1107 kg 0.454 kg
Power, P See opposite Stress, σ See opposite Specific Heat, Cp 1 cal/gal.oC
Conversion of units – stress and pressure* MPa dyn/cm2 lb.in2 kgf/mm2 bar long ton/in2
MPa 1 107 1.45 x 10² 0.102 10 6.48 x 10⁻²
dyn/cm2 10-7 1 1.45 x 10⁻⁵ 1.02 x 10⁻⁸ 10-6 6.48 x 10⁻⁹
lb/in2 6.89 x 10⁻³ 6.89 x 10⁴ 1 703 x 10-4 6.89 x 10⁻² 4.46 x 10⁻⁴
kgf/mm2 9.81 9.81 x 10⁷ 1.42 x 10³ 1 98.1 63.5 x 10⁻²
bar 0.10 106 14.48 1.02 x 10⁻² 1 6.48 x 10⁻³
long ton/ in2 15.44 1.54 x 10⁸ 2.24 x 10³ 1.54 1.54 x 10² 1
Conversion of units – energy* J erg cal eV Btu ft lbf
J 1 107 0.239 6.24 x 10¹⁸ 9.48 x 10⁻⁴ 0.738
erg 10-7 1 2.39 x 10⁻⁸ 6.24 x 10¹¹ 9.48 x 10⁻¹¹ 7.38 x 10⁻⁸
cal 4.19 4.19 x 10⁷ 1 2.61 x 10¹⁹ 3.97 x 10⁻³ 3.09
eV 1.60 x 10⁻¹⁹ 1.60 x 10⁻¹² 3.38 x 10⁻²⁰ 1 1.52 x 10⁻²² 1.18 x 10⁻¹⁹
Btu 1.06 x 10³ 1.06 x 10¹⁰ 2.52 x 10² 6.59 x 10²¹ 1 7.78 x 10²
ft lbf 1.36 1.36 x 10⁷ 0.324 8.46 x 10¹⁸ 1.29 x 10⁻³ 1
Conversion of units – power* kW (kJ/s) erg/s hp ft lbf/s
kW (kJ/s) 1 10-10 1.34 7.38 x 10²
erg/s 10-10 1 1.34 x 10⁻¹⁰ 7.38 x 10⁻⁸
hp 7.46 x 10⁻¹ 7.46 x 10⁹ 1 15.50 x 10²
Ft lbf/s 1.36 x 10⁻³ 1.36 x 10⁷ 1.82 x 10⁻³ 1
* To convert row unit to column unit, multiply by the number at the column row intersection, thus 1MPa = 10 bar
Getting started with CES EduPack
Granta’s Teaching Resources website aims to support teaching of materials-related courses in Engineering, Science and Design. The resources come in various formats and are aimed at different levels of student.
This resource is part of a set of open access resources created by Professor Mike Ashby to help introduce materials and materials selection to students.
The website also contains other resources donated by faculty at the 700+ universities and colleges worldwide using Granta’s CES EduPack.
The teaching resource website contains both resources that require the use of CES EduPack and those that don’t.
AuthorProfessor Mike Ashby and Granta Design University of Cambridge, Granta Design Ltd. www.grantadesign.comwww.eng.cam.ac.uk
Reproduction This is part of Granta’s Open Access Teaching Resources. You can reproduce these resources in order to use them with students. Please make sure that Mike Ashby and Granta Design are credited on any reproductions. You cannot use these resources for any commercial purposes.
AccuracyWe try hard to make sure these resources are of a high quality. If you have any suggestions for improvements, please contact us by email at [email protected].
Open Access Resources include: n Interactive Case Studies n Getting Started Guides n Materials Property Charts n Engineering Data Booklets
You can register for a user name and password for these resources here:www.grantadesign.com/education/resources
Other Resources Available: n 24 PowerPoint lecture unitsn Exercises with worked solutions n Recorded webinarsn Posters n White Papers n Solution Manuals