GEWEX is a Core Project of WCRP on Global Energy and Water Exchanges Vol. 26 No. 4, November 2016 10 Years of MAHASRI Accomplishments (pages 10-23) Results from MAHASRI Project Used in Hydrological Models to Simulate Impacts of Reservoir Operation for Mitigating Floods Also Inside • Human Regulation of the Water Cycle—a new GHP/GLASS Crosscutting Project to address the Grand Challenge of Water for the Food Baskets of the World (Page 4) • Robust Response of Global Mean Precipitation to Anthropogenic Aerosols (Page 6) • New Global Precipitation Climatology Project (GPCP) monthly analysis product corrects satellite data shifts (Page 7) • GEWEX Convection-Permitting Climate Modeling Workshop addresses major challenges and future research strategies (Page 26) • Third Satellite Soil Moisture Validation and Application Workshop recommends that passive microwave L-Band mea- surements be continued in new constellations of satellites (Page 29) Spatiotemporal impacts of alternative dam operation schemes on mitigating floods in Chao Phraya River in Thailand (Mateo et al., 2014) assessed through a cascade of models developed through the Integrated Study Project on Hydrometeorological Prediction and Adaptation to Climate Change in Thailand (IMPAC-T). See article by T. Oki et al. on page 16.
Transcript
GEWEX is a Core Project of WCRP on Global Energy and Water Exchanges
Vol. 26 No. 4, November 2016
10 Years of MAHASRI Accomplishments (pages 10-23)
Results from MAHASRI Project Used in Hydrological Models to Simulate Impacts of Reservoir Operation for Mitigating Floods
Also Inside
• Human Regulation of the Water Cycle—a new GHP/GLASS Crosscutting Project to address the Grand Challenge of Water for the Food Baskets of the World (Page 4)
• Robust Response of Global Mean Precipitation to Anthropogenic Aerosols (Page 6)
• New Global Precipitation Climatology Project (GPCP) monthly analysis product corrects satellite data shifts (Page 7)
• GEWEX Convection-Permitting Climate Modeling Workshop addresses major challenges and future research strategies (Page 26)
• Third Satellite Soil Moisture Validation and Application Workshop recommends that passive microwave L-Band mea-surements be continued in new constellations of satellites (Page 29)
Also Inside
Spatiotemporal impacts of alternative dam operation schemes on mitigating floods in Chao Phraya River in Thailand (Mateo et al., 2014) assessed through a cascade of models developed through the Integrated Study Project on Hydrometeorological Prediction and Adaptation to Climate Change in Thailand (IMPAC-T). See article by T. Oki et al. on page 16.
2 November 2016
Will Forward Momentum in U.S. Climate Science Research Continue?
Peter van OevelenDirector, International GEWEX Project Office
Commentary: Will Forward Momentum in U.S. Climate Science Research Continue?
Events for Early Career Scientists at the AGU Fall Meeting 2016
News from the Young Earth System Scientists (YESS) Community
A New GHP/GLASS Crosscutting Project: Human Regulation of the Water Cycle
Research Highlights—Robust Response of Global Mean Precipitation to Anthropogenic Aerosols
New Global Precipitation Climatology Project Monthly Analysis Product Corrects Satellite Data Shifts
10 Years of MAHASRI: Accomplishments and International Science Conference Wrap-Up
Integrated Project on Hydrometeorological Prediction and Adaptation to Climate Change in Thailand (IMPAC-T)
MAHASRI Activities Related to the Indonesian Maritime Continent
MAHASRI Activities in Northeast Asia
Meeting/Workshop Reports: - Workshop on Land Surface Multi-Sphere Processes of the Tibetan Plateau - GEWEX Convection-Permitting Climate Modeling Workshop - Third Satellite Soil Moisture Validation and Application Workshop - Annual Meeting of the GEWEX Hydroclimatology Panel (GHP)
GEWEX/WCRP Calendar
2
3
3
4
6
7
10
16
18
22
24
26
29
31
32
In January 2008, I had just moved to the U.S. from The Netherlands and President Obama was stepping into of-fice for his first term. At this time, many scientists studying climate change were hopeful that the new administration would promote this area of research and saw a brighter fu-ture ahead. Forward momentum towards this has been grad-ual but undeniable, as the realization that action is neces-sary to avert the negative impacts of human-induced climate change has taken solid hold around the world. This is not a universally accepted truth, however, and 8 years later we find ourselves in a different climate in the U.S. A president has been elected who has expressed—though may not hold—orthogonal views on mankind’s influence on our climate. How this is going to affect the country’s policies and major research efforts funded through U.S. programs is unclear. Hence the task continues for GEWEX (and certainly the U.S.) scientists to showcase the importance of our research, demonstrating the impacts of climate change and its effects on all people on this Earth.
It is in everyone’s best interest to continue investing in re-search and mitigation and adaptation measures. Contrary to popular belief, people do not resist change that they be-lieve will benefit them. It is primarily up to us as scientists to make that case. An important aspect of continuing to pursue research is the need for further improvement of our climate models, which will enable us to better study the vari-ous mitigation measures in terms of effectiveness and their socio-economic and environmental costs and impacts. The unwillingness to consider some geo-engineering approaches regardless of one’s personal view on the desirability of such measures is, in my view, dangerous. As the negative effects of climate change increase, the cry for more drastic measures will also escalate. And as the scientific community dealing with climate change, we bear the responsibility of coming up with answers, and we need to be better prepared to do so.
This edition of the newsletter features many topics, with pages 10–23 dedicated to the accomplishments of the Mon-soon Asian Hydro-Atmosphere Scientific Research and Pre-diction Initiative (MAHASRI; pages 10–23). This GEWEX Hydroclimatology Panel (GHP) Regional Hydroclimate Project concluded earlier this year. The outcomes of the workshop on Human Regulation of the Water Cycle, a new GHP/Global Land/Atmosphere System Study (GLASS) Panel Crosscutting Project to address the Grand Challenge
of Water for the Food Baskets of the World (page 4), are im-portant for the future direction of GEWEX. The GEWEX Convection-Permitting Climate Modeling Workshop also addresses some major challenges and future research strate-gies (page 26).
As always, feel free to contact us with your suggestions and questions. As this is the last newsletter of 2016, I wish you Happy Holidays and a wonderful New Year!
3November 2016
Events for Early Career Scientists at the AGU 2016 Fall Meeting
Sheila Saia, AGU H3S MemberCornell University, Ithaca, New York, USA
The American Geophysical Union (AGU) 2016 Fall Meeting in San Francisco is quickly approaching and there are a num-ber of events that early career scientists (ECS)—from students to postdocs to junior researchers—will not want to miss. These events are being organized by the Hydrology Section Student Subcommittee (H3S) and supported by AGU. For more up-to-date information on times and places for these events, fol-low H3S on Twitter at @AGU_H3S or visit the AGU site: http://fallmeeting.agu.org/2016/students/.
Student and Early Career Scientist Conference (SECC)The SECC is scheduled to take place on Sunday, 11 Decem-ber. It is open to all student and early career scientist attendees, but space is limited so be sure to register for the SECC when you register online for the 2016 Fall Meeting. The interdisci-plinary science track will include technical sessions on effec-tive figure making, model development and uses, as well as an expert panel on the Food-Water-Energy Nexus. The profes-sional track will include sessions on data management, science communication and publishing, to name a few.
Pop-Up TalksPop-up talks are 5-minute talks that offer ECS a platform to share their ideas with fellow scientists and the general public. The Social Dimensions of Geoscience Pop-Up will be held on Monday, 12 December, and the Water Sciences Pop-Up talks will take place on Tuesday, 13 December. Find the latest infor-mation on times and locations of the pop-up talks at: http://fallmeeting.agu.org/2016/students/events/pop-up-talks/.
Community Service ActivityThe service committee of H3S is collaborating with a Palo Alto, California-based non-profit, Grassroots Ecology (http://www.grassrootsecology.org/), to participate in a volunteer wa-ter quality monitoring event on Saturday, 15 December. For more information and to register, please visit: https://goo.gl/forms/lUGBT0ZTPcRzGVyH3.
Meet Your Hydrology Section Student RepresentativeH3S will schedule time for ECS attending the 2016 Fall Meet-ing to meet their Hydrology Section student representative, Evan Kipnis. This meeting is also an opportunity to voice your ideas on the future direction of the AGU Hydrology Section and H3S. For more information on the time and place of this meeting, please follow H3S on Twitter (@AGU_H3S) or con-tact Evan Kipnis directly ([email protected]).
Student LoungeAGU is hosting a lounge for students to mingle with other young AGU attendees or just take a break from the hustle of the conference. Throughout the week, AGU will organize several activities here, so be sure to keep an eye out for the full sched-ule: http://fallmeeting.agu.org/2016/students/student-lounge/.
News from the Young Earth SystemScientists (YESS) Community
Carla Gulizia and the YESS Outreach Working GroupCentro de Investigaciones del Mar y la Atmósfera (CIMA), Buenos Aires, Argentina
The YESS community brings together young researchers from a range of scientific backgrounds, including both natural and social sciences. YESS unifies early career scientists (ECS) in an influential network, giving them a collective voice and lever-age while supporting career development.
Over the past year, YESS has been extremely active. The com-munity has grown extensively across the globe and carried out its first elections for Regional Representatives and its Execu-tive Committee. YESS recently published a white paper in the Bulletin of the American Meteorological Society outlining its vi-sion of the future of Earth System Science, focused on four Frontiers: seamless Earth system prediction, communication, user-driven science and interdisciplinarity (see: http://journals.ametsoc.org/doi/abs/10.1175/BAMS-D-16-0025.1). The paper also identifies what is required to tackle these major scientific challenges from an ECS perspective. The Argentinean National Weather Service is supporting YESS through the establishment of a part-time YESS officer position to assist in operations.
Periodic webinars are offered by YESS, where expert research-ers share their knowledge of particular Earth system science topics. YESS also coordinates Council Webinars, where Coun-cil members present their own science, promoting exchanges within the community. The next such webinar will be on 23 November 2016 and will cover a wide range of relevant Earth System topics.
YESS members were also present at several international con-ferences and research institutions around the world, orga-nizing side events for early career scientists. At the CLIVAR Open Science Conference held in Qingdao, China in Septem-ber 2016, YESS helped to organize the Early Career Scientists Symposium (http://www.clivar.org/news/reflections-clivar-early-career-scientists-symposium-2016).
In the upcoming year, YESS will continue its outreach efforts to grow and serve the community. We plan to organize activi-ties at several international conferences, such as the European Geophysical Union General Assembly, the American Geo-physical Union Fall Meeting, and the IAPSO-IIAMAS-IAGA General Assembly, and we will seek more opportunities for early career scientists to join various working groups, commit-tees and panels.
If you are a Master’s or Ph.D. student, or a postdoc who has re-ceived your Ph.D. within the past 5 years and are interested in joining YESS, please email us at [email protected].
A New GHP/GLASS Crosscutting Project:Human Regulation of the Water Cycle
(HRWC)
Jan Polcher1, Richard Harding2, Aaron Boone3, MartinaFlörke4, Taikan Oki5 and Pere Quintana Seguí6
1Laboratoire de Météorologie Dynamique, CNRS, Ecole Polytechnique, U. Paris-Saclay, France; 2Centre for Ecology& Hydrology, NERC, Wallingford, United Kingdom; 3CNRM Météo-France/CNRS, Toulouse, France; 4Center for Envi-ronmental Systems Research, University of Kassel, Kassel, Germany; 5Metropolitan University, Japan; 5Ebro Observa-tory, Ramon Llull University-CSIC, Roquetes, Spain
The continental water cycle is not only governed by climate and its fluctuations, but also by human activities intended to maximize water resources for mankind’s benefit. For instance, it is estimated that dams control 48% of the world’s rivers and that these reservoirs store about 7000 km³ of water on the continents (Hanasaki et al., 2006). The majority of dams provide water for agriculture to increase crop yields. Not only are societies regulating and altering the water flows at the sur-face, but they are also extracting groundwater in many regions at unsustainable levels. It is a major challenge for society to ensure sustained water availability for human activities in a changing climate. Thus, if it is the ambition of GEWEX and the World Climate Research Programme to address the Grand Challenge of Water for the Food Baskets of the World, then human interventions into the water cycle on the continents need to be explicitly taken into account in these studies.
To develop a strategy towards this aim, the GEWEX Hydro-climatology Panel (GHP) and the Global Land/Atmosphere System Study (GLASS) Panel organized a workshop from 28–30 September 2016 in Gif-sur-Yvette, France on the campus of the University Paris-Saclay and the Centre National de la Recherche Scientifique. The overall objective of the workshop was to establish a strategy that addresses the various aspects of human activities within the GEWEX program, centering on a crosscutting study that combines the modeling activities of GLASS and the regional expertise of GHP. The workshop discussions were structured by invited talks and proposed contributions.
Representation of the Flow Regime Downstream of a Dam or Reservoir The discussions on the first day were centered on available ob-servations and those needed to better understand key process-es. The most common variables observed are river discharge and flow regimes, or extremes (high and low flow conditions) described by time series that can be extracted from a hydro-graph. Observed river discharge accounts for human impacts, including water abstractions and intakes (see Figure 1). Infor-mation on naturalized flow conditions (i.e., streamflows from which manageable and quantifiable human influences have been removed) is generally not available. Some exceptions to this are measurements from very small undisturbed rivers.
Rules characterizing reservoir operation schemes are essential to the representation of the flow regime downstream of a reser-voir or dam, but are only available for a few large dams. Global Hydrological Models (GHMs) make use of generic operation schemes derived either from observations of inflow and outflow of a reservoir (or dam) or from existing rules. Information on water rights and water allocation (priorities) are difficult to col-lect and implement in models. To express water demand, data on sectorial water abstraction (i.e., potential demand) is needed but difficult to obtain. Even fewer data exist on actual water consumption for different sectors. Information on inter-basin transfers, water use efficiencies of irrigation or return flows is very limited and often only accessible in an indirect way. The discussion also tried to establish how well human water regula-tion could be observed from space. In principle the reservoir levels, irrigation areas and periods should be observable, but it could not be established how far this information can be esti-mated reliably and made available systematically at the global scale with current or planned satellite missions.
Anthropogenic Influences on the Water CycleThe human processes that need to be observed and under-stood in more detail are those directly affected by climate or that will be unsustainable in the future. The understanding of the water cycle gained within GEWEX should inform societ-ies on how the water available in the food baskets of the world will evolve. Thus, water consumption and withdrawals for ir-rigation need to be differentiated between sources like surface water or groundwater. Reservoir management for agricultural production, as well as hydropower, needs to be better under-stood to create simulations of river discharge and predict the propagation of anomalies. The observations should also cover correlated processes, such as land use and/or land cover chang-es and urbanization. As socio-economic processes are the main drivers, links need to be established within these communities for process understanding and validation.
The current state of water management in land-surface models (LSMs) is relatively nascent (Nazemi and Wheater, 2015a,b). Irrigation is generally based on water stress thresholds that are easy to implement but likely are not very realistic since they lack the human control element and do not satisfy water con-servation. Attempts at modeling groundwater have been done by extending model soil depths vertically, but this neglects lat-eral subsurface flow processes and hydrogeology. More LSMs are coupled to river routing schemes, but relatively few model dams and storage reservoirs. Some groups have made estimates of anthropogenic water with satellite-based computations of evaporation, or by assimilating satellite leaf area index (LAI), soil moisture or total column water to try and constrain an-thropogenic water use at large scales. However, assimilating observations related to human processes that are not simulated may help in numerical weather forecasting but will be prob-lematic for climate change simulations.
Improving Anthropogenic Hydrological Processes in LSMsMoving forward, what are the main issues and challenges for improving anthropogenic hydrological processes in LSMs? Great care must be taken since there is a danger of includ-
5November 2016
ing processes that are under-constrained. This would lead to over-fitted parameterizations, which would have erroneous sensitivities or miss some feedbacks. One of the main issues is estimating water demand. Some LSMs use a simple estimation for water demand, however the most promising way forward is likely to be based upon projecting water demands and allo-cations using generic hydro-economic modeling. This consists of separate calculations of water exchange value and use value (i.e., the impact of water use) and then the separation of these into different needs (irrigation, hydropower, municipal uses and ecological flows). Such approaches are designed to be glob-ally applicable; however, they are limited by available data and their complexity, which makes their general use by LSMs more difficult. Access to governing rules of centralized water manage-ment, water rights, reservoir release, environmental flow regime and river and ground water extractions (which is extremely het-erogeneous and depends on local regulations) is essential. In some cases, water managers do not follow pre-established rules rigorously, which makes the problem even more difficult. Even if the data is public, the information is often hard to access by nonlocal scientists, due to language and cultural barriers, or badly designed data sharing mechanisms. Water demand, with-drawal and actual use are often treated synonymously, but are clearly very different. As this is an interdisciplinary endeavor, terminological and conceptual differences among the different scientific communities involved can also hinder progress. Nev-ertheless, some very promising approaches from the hydro-eco-nomic community were presented at the workshop and thus strong collaborations need to be established.
Improved modeling of anthropization in LSMs is theorized to induce potential feedbacks owing to human interventions. Using an offline-modeling system with irrigation, researchers have simulated the long-term reduction in the volume of the Aral Sea and showed that future projections can be made on the expected desiccation of this natural reservoir. An example from a recent coupled modeling study over the central U.S.
showed that precipitation is enhanced downstream of irrigated areas and demonstrated how regional scale low-level circulation patterns could be modified (Huber et al., 2014). Other poten-tial irrigation feedbacks included increased evapotranspiration (ET) in the irrigated crop tiles of LSMs, which sometimes leads to overall ET decrease in grid cells due to atmospheric feedback through increased humidity on other tiles. Convec-tion can occur upstream of irrigated areas near the dry/wet soil boundary triggered by sea breeze type phenomena (Figure 2, Sato et al., 2007; Kawase et al., 2008); thus the effect is not necessarily just local, and can mitigate or dampen local and regional heat extremes. It is therefore important to encourage the GEWEX community to explore these feedbacks and how they affect our ability to predict weather and climate.
Quantifying Water Resources In the workshop’s final discussions, it was concluded that GEWEX should take on the scientific challenge of better quantifying water resources available for agriculture and oth-er activities by accounting for explicitly human intervention in our geophysical view of the water cycle. The topic needing most urgent attention is the human regulation of the water cycle. Driven by climate potentials, water is stored in reser-voirs, and governed by agronomic needs it is adducted to ir-rigate areas. When the climate does not allow this, water is pumped from deep aquifers of which the characteristics are often not fully known. As these are significant perturbations to the continental waters, it was proposed that human water regulation be prioritized in our research and that the notion of water value be progressively integrated into our approach.
Potential Study RegionsSemi-arid climates are of the greatest interest as their low cli-matic potential is most critical for human activities. Depending upon the local characteristics of the water cycle and the socio-economic conditions, very different solutions may be imple-mented for water regulation, offering a wide range of situations
Figure 2. Clouds forming around the Heato irrigation district on the Yel-low river in China. MODIS/AQUA true color image provided by T. Sato (personal communication).
Figure 1. Evolution over the last century of the annual percentiles of dis-charge at the Tortosa Station in the Ebro River in Northern Spain. This figure is based on river flow data from the Spanish Ministry of Agricul-ture, Fisheries, Food and the Environment (MAPAMA). Quintana Seguí, personal communication.
6 November 2016
to be analyzed. Furthermore, these are areas where atmospheric feedbacks from the enhanced evaporation over reservoirs or ir-rigated areas can be expected and thus we urgently need to un-derstand the climatic consequence of water usage there.
Human Regulation of the Water Cycle (HRWC) Project A number of regions were identified that could make excel-lent test cases for a crosscutting project because of their loca-tions in data rich areas: (i) the Ebro River Basin in Spain with-in the HYdrological cycle in the Mediterranean EXperiment (HyMeX) region of study; (ii) the Murray Darling River Basin in the Australian Energy and Water Exchanges (OzEWEX) do-main; and (iii) the Arkansas-Red River Basin within the U.S. Atmospheric Radiation Measurement Program where GLASS has conducted studies. Other areas, such as the Saskatchewan River Basin in Canada or the Chao Phraya River Basin in Thai-land were discussed and also offer interesting perspectives. Test cases will gather expertise and organize model comparisons to evaluate their ability to reproduce the water cycle as it is today and its evolution with increasing human regulation.
Land-surface products derived from remote sensing data, in-cluding the impacts of human activities and products for mon-itoring the human footprint on the water cycle, were identified as priorities. The involvement of the GEWEX Data and As-sessments Panel (GDAP) would greatly benefit this project.
Because of the project’s multidisciplinary approach, GEWEX should strengthen its collaborations with international organiza-tions, including the Food and Agronomy Organization (FAO) for the exchange of geophysical and agronomic views on the water cycle, and the Inter-Sectoral Impact Model Intercompari-son Project (ISIMIP) and Agricultural Model Intercomparison and Improvement Project (AgMIP) for assistance in modeling human activities in land-surface models. The GHP/GLASS crosscuttting project on the Human Regulation of the Water Cycle will build upon these collaborations and the observa-tional and modeling activities within GEWEX to work to-wards understanding the continental water cycle as a system that is strongly driven by human activities.
References
Hanasaki, N., S. Kanae and T. Oki, 2006. A reservoir operation scheme for global river routing models. J. of Hydrol., 327, 22–41.
Huber, D. B., D. B. Mechem and N. A. Brunsell, 2014. The effects of great plains irrigation on the surface energy balance, regional circulation, and pre-cipitation. J. Climate, 2, 103–128.
Kawase, H., et al., 2008. Impact of extensive irrigation on the formation of cu-mulus clouds. Geophys. Res. Lett., 35, L01806, doi:10.1029/2007GL032435.
Nazemi, A., and H. S. Wheater, 2015a. Inclusion of water resource manage-ment in Earth system models–Part 1: Problem definition and representation of water demand. Hydrol. Earth Syst. Sci., 19, 33-61, doi:10.5194/hess-19-33-2015.
Nazemi, A., and H. S. Wheater, 2015b. On inclusion of water resource management in Earth system models–Part 2: Representation of water sup-ply and allocation and opportunities for improved modeling. Hydrol. Earth Syst. Sci., 19, 63-90, doi:10.5194/hess-19-63-2015.
Sato, T., F. Kimura and A. S. Hasegawa, 2007. Vegetation and topographic control of cloud activity over arid/semiarid Asia. J. Geophys. Res. Atmos., 112, D24109, doi:10.1029/2006JD008129.
Robust Response of Global MeanPrecipitation to Anthropogenic Aerosols
Research Highlights
Reference: Salzmann, Marc, 2016. Global Warming Without Global Mean Precipitation Increase? Sci. Adv., Vol. 2, No. 6, e1501572. DOI: 10.1126/sciadv.1501572.
Science:Climate models suggest that precipitation decreases by about 3–4% per Kelvin for aerosol cooling. This is about twice as much as the precipitation increase of about 1.5–2% per Kelvin for carbon dioxide warming, and helps to explain why, thus far, global mean precipitation has not increased markedly in spite of a net global warming caused by green-house gases.
Impact:It is shown that the observed 20th century tempera-ture increase can be used as a constraint on 20th century global mean precipitation simulated in climate models, and a robust aerosol effect on precipitation is identified. This helps to more easily interpret historical changes of global mean precipitation and to reconcile climate model results with observations.
Summary:Some regions have experienced an increase in pre-cipitation while other regions have seen a precipitation de-crease. At the same time, extreme rain events have become more frequent. Yet some observations as well as global cli-mate models suggest that the global mean precipitation has neither increased nor decreased notably until recently. While greenhouse gas warming due to carbon dioxide has long been known to increase global mean precipitation in climate mod-els by about 1.5–2% per Kelvin warming, here it is shown that cooling by aerosols in state-of-the art global climate models decreases precipitation by 3–4% per Kelvin. Due to this ro-bust effect of aerosol on precipitation, global mean precipita-tion has not increased notably in spite of a net global warm-ing (based on global climate models that simulate a realistic 20th century warming). In the future, however, an increase of global mean precipitation close to the well-known 1.5–2% per Kelvin is anticipated as greenhouse gas warming is expected to become more important.
Recently publish a paper related to GEWEX research?
We are interested in showcasing selected research high-lights that feature recent and interesting results relevant to the GEWEX mission. For consideration, please summit your highlight at: http://www.gewex.org/latest-news/research-highlights/. If your article qualifies, it will be published on the GEWEX website and may be featured in GEWEX News.
7November 2016
New Global Precipitation Climatology Project Monthly Analysis Product
Corrects Satellite Data Shifts
Robert Adler1, Mathew Sapiano1, George Huffman2, David Bolvin3, Jian-Jian Wang1, Guojun Gu1, Eric Nelkin3, Pingping Xie4, Long Chiu5, Ralph Ferraro6, Udo Schneider7 and Andreas Becker7
1University of Maryland, College Park, Maryland, USA; 2NASA Goddard Space Flight Center, Greenbelt, Maryland, USA; 3NASA Goddard Space Flight Center/SSAI, Green-belt, Maryland, USA; 4NOAA/NWS/Climate Prediction Cen-ter, College Park, Maryland, USA; 5George Mason Univer-sity, Fairfax, Virginia, USA; 6NOAA/NESDIS/STAR, College Park, Maryland, USA; 7Global Precipitation Climatology Centre, Deutscher Wetterdienst, Offenbach, Germany
The Global Precipitation Climatology Project (GPCP) has been in existence for over 20 years as part of the GEWEX effort under the World Climate Research Program (WCRP). The GPCP monthly product provides a consistent analysis of global precipitation from an integration of various satellite data sets over land and ocean, and a gauge analysis over land (Huffman et al., 1997). Improvements to the original ver-sion have been performed at irregular intervals over the past years (Adler et al., 2003; Huffman et al., 2009) with Version 2.2 being available since 2012. To date, the GPCP analyses have been used in over 1500 journal papers.
Recently, additional changes and improvements have been implemented and are a part of the new Version 2.3 (V2.3) of the monthly GPCP analysis. During the last few years, the GPCP group has also been working with the National Oceanic and Atmospheric Administration (NOAA) through the University of Maryland (UMD) to streamline the multi-organization data sources, processing procedures and associ-ated computer code to make the current GPCP Version 2 a part of NOAA’s Climate Data Record (CDR) [now the Reference Environmental Data Record (REDR)] Program. The NOAA National Center for Environmental Information (NCEI) will be the main repository for the new version of GPCP (go to: https://www.ncdc.noaa.gov/cdr/atmospheric and look for GPCP), although additional information and the data set can also be accessed from UMD (gpcp.umd.edu). In addition to the monthly research data set, which is typically available a few months after the observed month, a prelimi-nary analysis, an Interim Climate Data Record (ICDR), is available within 10 days after the end of the month from the UMD website. The ICDR monthly analysis is replaced by the final, research CDR when that analysis becomes avail-able. The ICDR allows for “real-time” climate analysis us-ing the research data set as a base for anomaly calculations and more. A description of the background of GPCP can be found on the website and a more detailed description of the input data sets and analysis procedures is contained in the referenced papers.
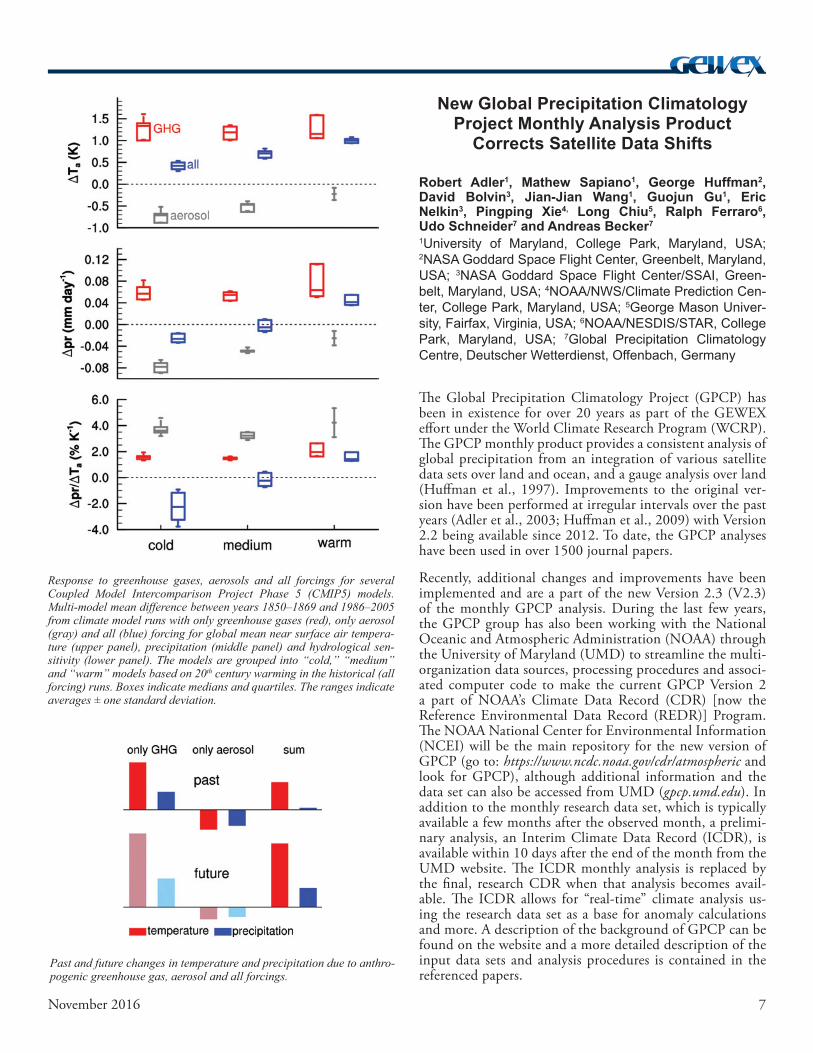
Response to greenhouse gases, aerosols and all forcings for several Coupled Model Intercomparison Project Phase 5 (CMIP5) models. Multi-model mean difference between years 1850–1869 and 1986–2005 from climate model runs with only greenhouse gases (red), only aerosol (gray) and all (blue) forcing for global mean near surface air tempera-ture (upper panel), precipitation (middle panel) and hydrological sen-sitivity (lower panel). The models are grouped into “cold,” “medium” and “warm” models based on 20th century warming in the historical (all forcing) runs. Boxes indicate medians and quartiles. The ranges indicate averages ± one standard deviation.
Past and future changes in temperature and precipitation due to anthro-pogenic greenhouse gas, aerosol and all forcings.
8 November 2016
Figure 1. Time series of global mean precipitation anomalies based on the GPCP V2.2 climatology during 1979–2012.
The new update of the GPCP monthly analysis allows for the correction of problems detected recently and the inclusion of an updated input data set. During the last several years, small, apparently systematic shifts (in the form of decreases) in mean precipitation were noted for the post-2003 period over oceans and these did not appear to be natural. After extensive analy-sis, these variations were determined to be related to subtle shifts in input satellite precipitation estimates due to imperfect cross-calibration procedures in transitions from one satellite to the next. New cross-calibration procedures were developed, tested and applied to correct the problems and have been in-corporated into this new version.
Figure 1 below shows the precipitation totals as a function of time during the GPCP era for the globe, and for land and ocean separately, for both V2.2 and V2.3. Small shifts upward for the new version are evident for recent years (2003 and be-yond). The corrections in V2.3 affect ocean precipitation in two ways: (i) from January 2009 onward tropical ocean (40°N–40°S) precipitation increases in V2.3 by about 0.03 mm/d (see Table 1) due to an improved cross-calibration of precipitation estimates from the polar-orbiting passive microwave sensor Special Sensor Microwave Imager Sounder (SSMIS) to those from the earlier SSMI estimates; and (ii) from January 2003 onward ocean precipitation estimates poleward of 40° latitude increase slightly in V2.3, varying with latitude, up to about 0.04 mm/d in the region 40–60°N due to a corrected cross-calibration of precipitation estimates from the TIROS Opera-tional Vertical Sounder (TOVS) to the Atmospheric Infrared
Sounder (AIRS). These changes produce a slight change over the global ocean (about 0.01 mm/d) from 2003 to 2008, but a larger global ocean change (about 0.05 mm/d) starting in 2009. Table 1 shows the mean values and changes over global ocean for the period of largest changes (2009–2013), an in-crease of 1.8%.
In addition to changes in satellite inputs, new gauge analy-ses recently became available from the Global Precipitation Climatology Center (GPCC) in Germany. These were inte-grated into the analysis record with the GPCC V7 full analy-sis (Becker et al., 2013; Schneider et al., 2015a) being used from 1979 to 2013 and the GPCC Monitoring analysis V5 (Schneider et al., 2015b) being used for 2014 and beyond. Although the changes made for TOVS/AIRS during this later period do affect the satellite-only analysis over land and also at middle to high latitudes, the main reason for the changes over land is the replacement of the GPCC Monitoring Prod-uct with the GPCC Full Analysis, which increases the land values by about 0.04 mm/d (see Table 1). The impact of the
9November 2016
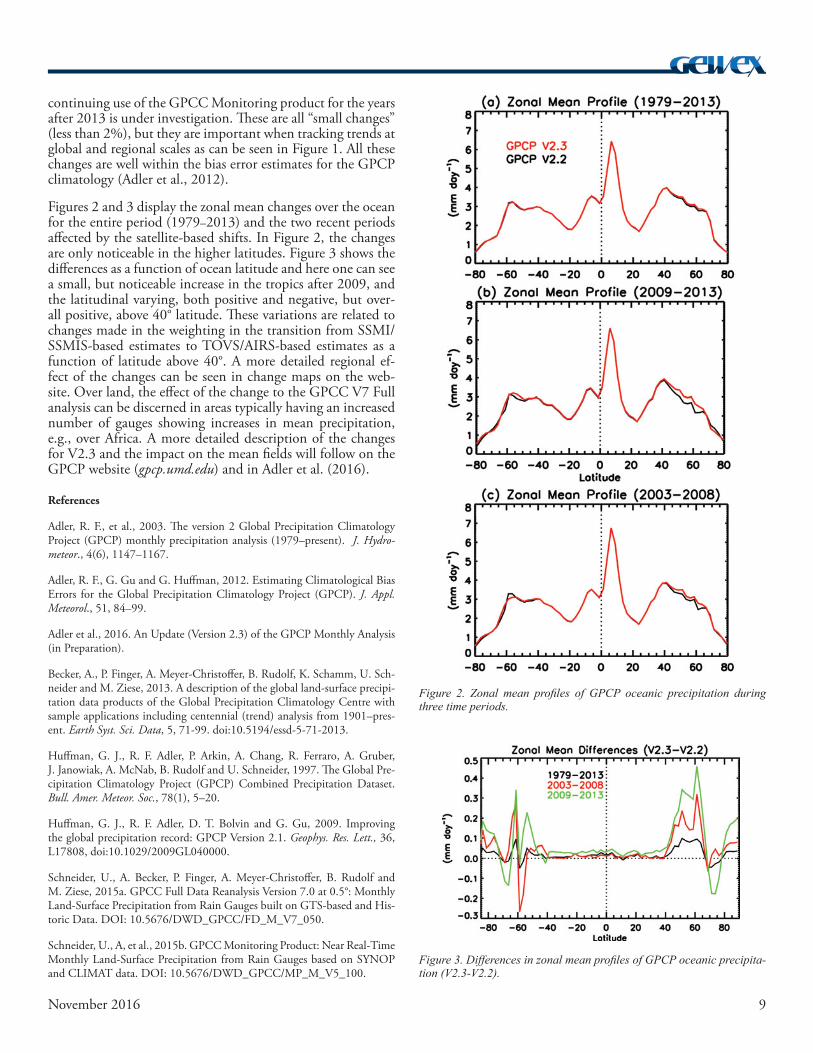
Figure 2. Zonal mean profiles of GPCP oceanic precipitation during three time periods.
Figure 3. Differences in zonal mean profiles of GPCP oceanic precipita-tion (V2.3-V2.2).
continuing use of the GPCC Monitoring product for the years after 2013 is under investigation. These are all “small changes” (less than 2%), but they are important when tracking trends at global and regional scales as can be seen in Figure 1. All these changes are well within the bias error estimates for the GPCP climatology (Adler et al., 2012).
Figures 2 and 3 display the zonal mean changes over the ocean for the entire period(1979–2013)and the two recent periods affected by the satellite-based shifts. In Figure 2, the changes are only noticeable in the higher latitudes. Figure 3 shows the differences as a function of ocean latitude and here one can see a small, but noticeable increase in the tropics after 2009, and the latitudinal varying, both positive and negative, but over-all positive, above 40° latitude. These variations are related to changes made in the weighting in the transition from SSMI/SSMIS-based estimates to TOVS/AIRS-based estimates as a function of latitude above 40°. A more detailed regional ef-fect of the changes can be seen in change maps on the web-site. Over land, the effect of the change to the GPCC V7 Full analysis can be discerned in areas typically having an increased number of gauges showing increases in mean precipitation, e.g., over Africa. A more detailed description of the changes for V2.3 and the impact on the mean fields will follow on the GPCP website (gpcp.umd.edu) and in Adler et al. (2016).
References
Adler, R. F., et al., 2003. The version 2 Global Precipitation Climatology Project (GPCP) monthly precipitation analysis (1979–present). J. Hydro-meteor., 4(6), 1147–1167.
Adler, R. F., G. Gu and G. Huffman, 2012. Estimating Climatological Bias Errors for the Global Precipitation Climatology Project (GPCP). J. Appl. Meteorol., 51, 84–99.
Adler et al., 2016. An Update (Version 2.3) of the GPCP Monthly Analysis (in Preparation).
Becker, A., P. Finger, A. Meyer-Christoffer, B. Rudolf, K. Schamm, U. Sch-neider and M. Ziese, 2013. A description of the global land-surface precipi-tation data products of the Global Precipitation Climatology Centre with sample applications including centennial (trend) analysis from 1901–pres-ent. Earth Syst. Sci. Data, 5, 71-99. doi:10.5194/essd-5-71-2013.
Huffman, G. J., R. F. Adler, P. Arkin, A. Chang, R. Ferraro, A. Gruber, J. Janowiak, A. McNab, B. Rudolf and U. Schneider, 1997. The Global Pre-cipitation Climatology Project (GPCP) Combined Precipitation Dataset. Bull. Amer. Meteor. Soc., 78(1), 5–20.
Huffman, G. J., R. F. Adler, D. T. Bolvin and G. Gu, 2009. Improving the global precipitation record: GPCP Version 2.1. Geophys. Res. Lett., 36, L17808, doi:10.1029/2009GL040000.
Schneider, U., A. Becker, P. Finger, A. Meyer-Christoffer, B. Rudolf and M. Ziese, 2015a. GPCC Full Data Reanalysis Version 7.0 at 0.5°: Monthly Land-Surface Precipitation from Rain Gauges built on GTS-based and His-toric Data. DOI: 10.5676/DWD_GPCC/FD_M_V7_050.
Schneider, U., A, et al., 2015b. GPCC Monitoring Product: Near Real-Time Monthly Land-Surface Precipitation from Rain Gauges based on SYNOP and CLIMAT data. DOI: 10.5676/DWD_GPCC/MP_M_V5_100.
10 November 2016
10 Years of MAHASRI:Accomplishments and the International
Science Conference Wrap-Up
Jun Matsumoto1,2, Taikan Oki3, Manabu D. Yamanaka2, Taiichi Hayashi4 and Jun Asanuma5
1Tokyo Metropolitan University, Japan; 2Japan Agency for Marine-Earth Science and Technology (JAMSTEC), Japan; 3The University of Tokyo, Japan; 4Kyoto University, Japan; 5University of Tsukuba, Japan
Overview of MAHASRI and Related Projects The Monsoon Asian Hydro-Atmosphere Scientific Research and Prediction Initiative (MAHASRI; http://hydro.iis.u-tokyo.ac.jp/mahasriwiki/wiki/index.html) was implemented in 2006 as a successor to the GEWEX Asian Monsoon Experiment (GAME; 1996–2005). After GAME concluded, the first Pan-WCRP Monsoon Workshop was held in June 2005 in Irvine, California, USA, and the participants strongly recommended that collaborative research on monsoon prediction issues be continued in Asia. At a post-GAME international planning workshop held in Tokyo, Japan in 2005, an International Drafting Committee was organized to develop a science plan for MAHASRI, which was presented at the 18th meeting of the GEWEX Scientific Steering Group (SSG) in Dakar, Senegal in January 2006. The feedback on the plan that was received from the SSG members was incorporated into the final MA-HASRI Science Plan (http://hydro.iis.u-tokyo.ac.jp/mahasriwi-ki/before_wiki/documents/MAHASRI_SciencePlan_v4.1.pdf), which was presented and accepted at the Pan-GEWEX Meet-ing held in Frascati, Italy in October 2006. MAHASRI was approved as a GEWEX Continental-scale Experiment (CSE) of the Global Hydrometeorology Panel (GHP). After the Pan-GEWEX Meeting, GHP was merged into a new GEWEX panel called the Coordinated Energy and Water Cycle Ob-servations Project (CEOP), co-chaired by Toshio Koike and the late John Roads. In 2010, the CSEs were redefined as Re-gional Hydroclimate Projects (RHPs) under what is now the GEWEX Hydroclimatology Panel (GHP).
The primary objective of MAHASRI was to use the scientific understanding of Asian monsoon variability to develop a hy-drometeorological prediction system up to seasonal time scales. In its implementation, real-time monitoring capabilities for hy-drometeorological observations and an integrated hydrometeo-rological database were developed, including data rescue and examination and improvement of hydrometeorological models in specific river basins. The scientific foci of MAHASRI includ-ed: (i) atmosphere-ocean-land interactions in the Asian mon-soon system; (ii) the effects of multiscale orography on mon-soon circulation and rainfall; (iii) temporal interactions among diurnal, synoptic, intraseasonal and seasonal variability of the Asian monsoon; (iv) spatial interactions among hydrometeo-rological phenomena of local, regional and continental scales; and (v) transferability of hydrological models and parameters for prediction of ungauged or sparsely observed basins.
In the initial stages of MAHASRI, facilitation and improve-ment of hydrometeorological observations in Asian monsoon countries were conducted in cooperation with the Global Earth Observation System of Systems (GEOSS) and the Co-ordinated Enhanced Observing Period (CEOP-II). GEOSS (GEO, 2007) and Japan Earth-Observation System Promo-tion Program (JEPP) funds supported these activities.
MAHASRI was loosely comprised of four sub-regions:NortheastAsia,Tibet/Himalaya,EastAsiaandtheTropics(seeFigure1).Hirohiko Ishikawa of Kyoto University initial-ly led the JEPP-Tibet Project in collaboration with the Chi-nese Academy of Sciences (CAS).Later, major activities were focused in two regions. The Northeast Asia (primarily Mon-golia) Post-Rangelands Atmosphere-hydrosphere-biosphere Interaction Study Experiment in Northeast Asia (PRAISE) was led by Jun Asanuma. The Tropics region was subdivided into (i) the Northeast Indian Subcontinent (India and Bangla-desh), led by Taiichi Hayashi; (ii) Thailand [Integrated study project on hydro-Meteorological Prediction and Adaptation to Climate change in Thailand (IMPAC-T)], led by Taikan Oki; (iii) Vietnam and the Philippines [Vietnam Philippine Rainfall Experiment (VPREX)], led by Jun Matsumoto; and (iv) the Indonesian Maritime Continent [Hydrometeorologi-cal Array for Isv-Monsoon Automonitoring (HARIMAU)], led by Manabu D. Yamanaka.
Asian Monsoon Year (AMY)During its implementation, the WCRP Joint Scientific Steer-ing Committee (JSC) recommended that MAHASRI conduct its Asian monsoon research within a broader context by in-cluding the Climate Variability and Predictability (CLIVAR) Project, specifically, the CLIVAR/Asian-Australian Monsoon Panel (AAMP). As a result, a crosscutting activity, the Asian Monsoon Year (AMY; 2007–2012), was organized as a part of the International Monsoon Study (IMS), a coordinated ob-servation and modeling effort under WCRP. AMY conducted an Intensive Observation Period (IOP) from 2008 to 2010, in which MAHASRI participated. In September 2007, a series of meetings related to AMY, the Pan-GEWEX Monsoon Study and CEOP were organized in Bali, Indonesia; this marked an important milestone in the build-up phase of MAHASRI. AMY organized eight international workshops in China, Ja-pan, Indonesia, Korea and India, and an Open Science Con-ference in October 2013 in Zhuhai, China. The activities of AMY and its scientific results in the Indonesian Maritime Continent were summarized in Matsumoto et al. (2016). AMY and MAHASRI in situ observational data have been ar-chived and are available to the worldwide research community through the Data Integration and Analysis System (DIAS; http://dias-dss.tkl.iis.u-tokyo.ac.jp/ddc/finder?lang=en) hosted by the University of Tokyo, Japan. The data are also available from the MAHASRI web page (http://hydro.iis.u-tokyo.ac.jp/mahasriwiki/wiki/data/index.html). The Meteorological Re-search Institute (MRI) of the Japan Meteorological Agency (JMA) conducted AMY Reanalysis for the period 2008–2010, including AMY observational data. This data set will be made available to the public soon. Some of the scientific results of
11November 2016
Figure 1. Target regions of MAHASRI.
MAHASRI and AMY were published in the “Special issue of MAHASRI” in the Journal of the Meteorological Society of Ja-pan (Matsumoto et al., 2011).
During MAHASRI, international Asian monsoon hydro-climate sessions were organized occasionally at the Japan Geoscience Union (JpGU) annual meetings in Japan, and AMY-related sessions were organized at the Asian Oceania Geoscience Society (AOGS), the American Geophysical Union (AGU), the European Geosciences Union (EGU), the International Association of Meteorology and Atmospheric Sciences (IAMAS) and the International Union of Geodesy and Geophysics (IUGG) meetings. MAHASRI-related inter-national workshops on the Asian monsoon were held four times in Vietnam (in 2006 at Ha Long, in 2009 and 2013 at Da Nang and in 2011 at Nha Trang). Each MAHASRI sub-regional project organized its own bilateral and/or inter-national workshops.
Major Outcomes of Regional ProjectsOne of the important scientific outcomes ofMAHASRIwasthediscoveryoftheextensiverolethattheEastAsianwintermonsoon (cold surge) plays on the variousmon-soon components in both South andSoutheastAsia, in-cluding the IndonesianMaritime Continent. MAHASRI was the first organized international project targeting the Asian winter monsoon since the Winter Monsoon Experi-ment (WMONEX) was conducted from 1978 to 1979 (John-son and Chang, 2007). Takahashi et al. (2011) investigated the role of cold surges on the development of cyclonic distur-bances in the Indian Ocean and Hattori et al. (2011) analyzed the Cross-Equatorial Northerly Surge (CENS) and its impact on rainfall in the Indonesian Maritime Continent. Extensive studies were also conducted on the dynamics of autumn and winter extreme rainfalls in Indochina (e.g., Yokoi and Matsu-
moto, 2008; Tangang et al., 2008; Wu et al., 2011; Chen et al., 2012, 2013, 2015a, 2015b), large scale interactions related to cold surges, easterly waves, the Madden-Julian Oscillation (MJO) and tropical disturbances. In addition, the impor-tance of the effect of coastlines on precipitation in the tropics was for the first time quantitatively evaluated by Ogino et al. (2016) using data from the Tropical Rainfall Measuring Mis-sion (TRMM).
ManyMAHASRI projects tackled regional scientific tar-gets.HARIMAU radars in the Indonesian Maritime Conti-nent helped establish that the coastal diurnal cycle is the most important cause of precipitation. Among the most prominent achievements of MAHASRI, IMPAC-T developed a hydrome-teorological data collection and prediction system in the Chao Phraya River Basin in Thailand. Papers have been collected and published in a Special Collection of the Hydrological Re-search Letters (HRL) of the Japan Society of Hydrology and Water Resources (http://www.hrljournal.org/special-collections/special-collection-2). Work by Jun Asanuma’s group in Mongolia on land-atmosphere interaction observations (PRAISE) and sources of precipitation on Mongolian grasslands was reported in Koike et al., 2014. The results of these projects are summa-rized in separate articles in this newsletter by the correspond-ing project leaders.
In Southeast Asia, climatological and interannualvariations of the local monsoon onset were revealedin Myanmar (Htway and Matsumoto, 2011), Vietnam(Nguyen-Le et al., 2014, 2015; Nguyen-Le and Matsumoto, 2016) andthePhilippines(Akasaka et al., 2007; Akasaka, 2011). The heat flux from the land surface during the pre-monsoon season in the inland region of Thailand was revealed by Kiguchi et al. (2013), and the relationship between pre-monsoon rain and monsoon onset over the Indochina Pen-insula was studied by Kiguchi et al. (2016). Seasonal varia-tions of rainfall induced by tropical cyclones were analyzed for the western North Pacific by Kubota and Wang (2009), and for the eastern coastal area of Vietnam by Nguyen-Thi et al. (2012a, 2012b). Takahashi et al. (2015) clarified the role of westward-propagating tropical cyclones from the western North Pacific on the interannual variation of summer mon-soon season rainfall in central Thailand, including the severe flooding in 2011. This suggests a role for disturbances in the western North Pacific Ocean on summer monsoon rainfall in Indochina (see Figure 2 on next page). Rainfall variability in large regions extending from north India, including part of the Tibetan Plateau east-southeastward to the western Pa-cific, may be affected in a similar way along the climatological monsoon trough. Long-term changes of extreme rainfalls oc-curring mainly in the latter half of the last century have also been revealed (Endo et al., 2009; Villafuerte, et al., 2015; Vil-lafuerte and Matsumoto, 2015). Furthermore, the interdec-adal variability of tropical cyclone landfall in the Philippines during the past 104 years was identified by Kubota and Chan (2009), and a 117-year Pacific-Japan teleconnection pattern index using station-based atmospheric pressure data was de-veloped by Kubota et al. (2016).
12 November 2016
Figure 2. Regression of National Oceanic and Atmospheric Administration (NOAA) Climate Prediction Center (CPC) Merged Analysis of Precipitation (CMAP) data during the rainy season (May–September) over the reference region of Indochina (12.58–208N, 97.58–107.58E) in the rectangular box against the normalized data (mm/day) from 1979 to 2011. Areas with colors are statistically significant at the 90% level, as determined by correlation coefficients based on 31 degrees of freedom (Takahashi et al., 2015).
In theNortheastern Indian Subcontinent, which experi-encessomeoftheheaviestrainfallintheworld,aprecipi-tationmeasurementnetworkwasdevelopedintheIndianstatesofAssamandMeghalaya,andinBangladesh(Murata et al., 2007). Fifteen rain gauges were installed in Assam, five in Meghalaya and seventeen in Bangladesh. Several timescale rainfall variations were clarified, such as year-to-year, seasonal, intra-seasonal and daily variations, using these newly observed rainfall data and the historically archived rainfall data of the India Meteorological Department (Hayashi et al., 2009). The target region featured daily rainfall variations with a period of 10–20 days, as well as those of 30–60 days, which are also prominent in the rest of the Indian Subcontinent. Rainfall occurring between midnight and early morning prevailed in this area (Fujinami et al., 2011, 2014). Spatial distribution of rainfall over the two countries of India and Bangladesh was integrated as one area. In addition, preliminary results related to the impacts of meteorological factors on human behaviors were collected (Wagatsuma et al., 2009).
IncentralVietnam,fieldobservationstargetingheavyrain-falleventsfromautumntoearlywinterwereconductedin2010and2012.The Japan Agency for Marine-Earth Science and Technology (JAMSTEC) in collaboration with the Na-tional Hydrometeorological Service of Vietnam (VNHMS), the Philippine Atmospheric Geophysical and Astronomical Services Administration (PAGASA) and other related agen-cies worked together to obtain the data. The impact of ad-ditional radiosonde observations during VPREX2010 was investigated by performing observing system experiments using the local ensemble transform Kalman filter (LETKF) and the atmospheric general circulation model for the Earth Simulator (AFES) by Hattori et al. (2016). Besides intensive
observations in the IOP, with support by the JEPP project in Southeast Asia, approximately 30 automatic rain gauges were installed in central Vietnam and in the northeastern Indian subcontinent, respectively, to capture the rainfall features in those regions. After the termination of the JEPP Southeast Asia Project, observation activities have been maintained by JAMSTEC in central Vietnam, and by Kyoto University in the Northeast Indian Subcontinent as described in the previous section. JAMSTEC also maintained two automated weather stations at Laoag and Daet in the Philippines, whose data are transmitted directly to JAMSTEC on a real-time basis with strong support from PAGASA. Recently, a lightning detection system was installed at Los Vanos, near Manila, and solar and longwave radiation observation capabilities were established in Laoag, also in collaboration with PAGASA. They are partly supported by the Climatic changes and evaluation of their effects on Agriculture in Asian Monsoon Region (CAAM) Project, under the research framework of the Green Network of Excellence (GRENE), by the Japanese Ministry of Educa-tion, Culture, Sports, Science and Technology (MEXT) for the Japanese fiscal year period 2011–2015. A similar system supported by VNHMS was installed at Son Tay near Hanoi in North Vietnam. The performance of Global Satellite Map-ping of Precipitation Data (GSMaP_MVK, version 5.222.1; Ushio et al., 2009) over the VuGia–ThuBon River Basin and surrounding areas in central Vietnam was examined on a monthly basis in comparison with rainfall gauges at eight meteorological stations and a gridded rainfall product of the Asian Precipitation–Highly-Resolved Observational Data Integration Towards Evaluation of Water Resources Project (APHRODITE, V1003R1; Yatagai et al., 2009, 2012) by Ngo-Duc et al. (2013).
13November 2016
TheCAAMProjectandtheThaiMeteorologicalDepartment(TMD)developedaGreenNetworkofExcellence,anenvi-ronmentalinformationversion(GRENE-ei)ofCAAMthatservesa0.05°×0.05°griddeddailyprecipitationdataprod-uctforthelowlandsofThailand(below500minelevation).The product is based on data from approximately 1,100 TMD rain gauges that were constructed for 1979–2011 (available at: http://dias-dss.tkl.iis.u-tokyo.ac.jp/ddc/viewer?ds=GRENE_ei_CAAM_Thai_Grid_DailyRain&lang=en).Also in collabo-ration with the VNHMS, the Vietnam National University (VNU) of Science, the University of Science and Technology of Hanoi (USTH) and the Foundation of River and Basin Integrated Communications of Japan, Gridded Precipitation (VnGP) data sets were constructed at 0.25° and 0.1° resolu-tions utilizing 481 stations in Vietnam for the period 1980–2010 (Nguyen-Xuan et al., 2016). The data are also avail-able from DIAS (http://dias-dmg.tkl.iis.u-tokyo.ac.jp/dmm/doc/VnGP_025-DIAS-en.html and http://dias-dmg.tkl.iis.u-tokyo.ac.jp/dmm/doc/VnGP_010-DIAS-en.html, respectively). MA-HASRI also digitized meteorological data obtained prior to World War II in Japan, the Philippines, Vietnam, Myanmar, China, Bangladesh, Indonesia and some other countries to provide a more complete record of rainfall observations in this region.
MAHASRI International Science ConferenceThe MAHASRI International Science Conference was held in Tokyo, Japan from 2–4 March 2016. Over 110 participants from 14 countries gave 47 oral and 49 poster presentations summarizing results obtained over the Project’s 10-year his-tory. The conference was organized by the International Scien-tific Committee chaired by Jun Matsumoto and hosted by the Research Center for Climatology (RCC) of the Tokyo Metro-politan University (TMU). Sponsors included TMU, the Insti-tute for Space-Earth Environmental Research (ISEE), Nagoya University, the Institute of Industrial Science (IIS), The Uni-versity of Tokyo, the Tokyo Institute of Technology (TIT) and the Strategic R&D Area Project “Strategic Research on Global Mitigation and Local Adaptation to Climate Change (S-14)” of the Environment Research and Technology Development Fund supported by the Ministry of Environment, Japan. The conference book of abstracts is available at: http://tmu-rao.jp/wordpress/wp-content/uploads/2015/11/c4b1a9047021a17ae-82beb0e3cb07946.pdf.
Oral sessions were organized into seven scientific sessions and two special sessions. In the first session, Peter van Oevelen, Director of the International GEWEX Project Office, intro-duced current monsoon research activities within GEWEX, and Jan Polcher, co-chair of GHP, presented the history and evolution of that Panel.
In Session 2, results of the regional and related projects of MAHASRI were introduced. Fadli Syamsudin (Agency for the Assesment and Application of Technology, BPPT) introduced studies conducted in the newly developed Maritime Continent Center of Excellence (MCCOE; http://tisda.bppt.go.id/mccoe/) in Indonesia. Mike T.C. Chen (Iowa State University) showed the development and formation mechanism of the Southeast
Asian winter heavy rainfall events. G.S. Bhat (Indian Insti-tute of Science) presented the evolution and propagation of monsoon cloud systems over India revealed by the Continen-tal Tropical Convergence Zone Program (CTCZ; http://www.incois.gov.in/portal/datainfo/ctczsp.jsp). Subcontinental-scale diurnal variations over South China and the South China Sea were presented by Johnny C.L. Chan (City University of Hong Kong; Huang and Chan, 2011).
Session 3 concerned monsoon precipitation that is strongly affected by regional topography in timescales from diurnal to intraseasonal. Akio Kitoh (University of Tsukuba) showed the current understanding of past changes and future projections of global and regional monsoon precipitation. Interesting fea-tures of diurnal variations of precipitation in South Asia were presented by Shoichi Shige (Kyoto University).
Session 4 was related to atmosphere-land-ocean interactions. Yaoming Ma (Institute of Tibetan Plateau Research) pre-sented observational studies on land-surface heat fluxes and evapotranspitation over heterogeneous landscape of the Ti-betan Plateau and the surrounding region (Third Pole region) and introduced Tibetan Observation and Research Platform (TORP) activities. The Science Plan for an upcoming field observation campaign called Years of the Maritime Continent (YMC; 2017–2019) was introduced by Kunio Yoneyama (JAMSTEC) and is available at: http://www.jamstec.go.jp/ymc/docs/YMC_SciencePlan_v2.pdf. Multi-decadal regional climate changes, particularly drought and heat waves in Mongolia and the roles of regional land-ocean-sea ice distributions on atmo-spheric variations, were presented by Tomonori Sato (Hok-kaido University, Erdenebat and Sato, 2016).
Extremes were discussed in Session 5, with an emphasis on precipitation extremes. Fumiaki Fujibe (TMU) showed the long-term changes of extreme precipitation in Japan. Fredolin T. Tangang (National University of Malaysia; UKM) present-ed the possible roles of various factors affecting the intensity and location of extreme precipitation events over the east coast of Peninsular Malaysia at the end of December 2014.
Session 6 was related to climate. Two special sessions were or-ganized: “From IMPAC-T to ADAP-T” led by Taikan Oki, and “Urban climate changes in Jakarta” led by Manabu Kanda of the Tokyo Institute of Technology. General Discussion Ses-sion 7 was chaired by Jun Matsumoto, who noted that one of the most important outcomes of MAHASRI has been the continued research collaborations with Asian operational agencies and research communities that have continued since GAME and how strongly they stimulate research activities in these regions, particularly Thailand, Indonesia, Vietnam, the Philippines, Bangladesh, India and Mongolia.
Potential future research targets were summarized as follows:
• Multi-scale interactions: diurnal/synoptic/ISO/seasonal changes in time, or local/regional/global changes in space
• Land–ocean–atmosphere interactions
• Changes and attribution of extremes
14 November 2016
• Decadal variations of the Asian monsoon
• Effects of humans on the hydrological cycle
• Developing an adaptation strategy for climate changes
Future PlansThe scientific outcomes of MAHASRI and related research will be summarized in a special collection of papers on the “Asian monsoon hydroclimate” to be published in the Progress in Earth and Planetary Science of the Japan Geoscience Union. A Special call for Excellent Papers on hot topics (SPEPS; http://progearthplanetsci.org/index.html#modal) was issued in August with a deadline of 31 January 2017. Planning for a MAHASRI follow-on project will be proposed at the next GHP meeting.
References
Akasaka, I., W. Morishima and T. Mikami, 2007. Seasonal march and spa-tial difference of rainfall in the Philippines. Int. J. Climatol., 27: 715–725, doi: 10.1002/joc.1428.
Akasaka, I., 2011. Interannual variations in seasonal march of rainfall in thePhilippines. Int. J. Climatol., 30: 1301–1314, doi: 10.1002/joc.1975.
Chen, T. C., J. D. Tsay, M. C. Yen and J. Matsumoto, 2012. Interannual variation of the late fall rainfall in Central Vietnam. J. Climate, 25, 392–413, doi: 10.1175/JCLI-D-11-00068.
Chen, T. C., J. D. Tsay, M. C. Yen and J. Matsumoto, 2013. The win-ter rainfall of Malaysia. J. Climate, 26, 936–958, doi: 10.1175/JCLI-D-12-00174.1.
Chen, T. C., J. D. Tsay, J. Alpert and J. Matsumoto, 2015a. Development and formation mechanism of the Southeast Asian winter heavy rainfall events around the South China Sea: Part I–Formation and propagation of cold surge vortex. J. Climate, 28, 1417–1443, doi: 10.1175/JCLI-D-14-00170.1.
Chen, T. C., J. D. Tsay and J. Matsumoto, 2015b. Development and forma-tion mechanism of the Southeast Asian winter heavy rainfall events around the South China Sea: Part II – Multiple interactions. J. Climate, 28, 1444–1464, doi: 10.1175/JCLI-D-14-00171.1.
Endo, N., J. Matsumoto and T. Lwin, 2009. Trends in precipitation extremes over Southeast Asia. SOLA, 5, 168–171, doi: 10.2151/sola.2009‒043.
Erdenebat, E., and T. Sato, 2016. Recent increase in heat wave frequency around Mongolia: role of atmospheric forcing and possible influence of soil moisture deficit. Atmos. Sci. Lett., 7, 135–140, doi: 10.1002/asl.616.
Fujinami, H., et al., 2011. Characteristic intraseasonal oscillation of rainfall and its effect on interannual variability over Bangladesh during boreal sum-mer. Int. J. Climatol., 31, 1192–1204, doi: 10.1002/joc.2146.
Fujinami, H., T. Yasunari and A. Morimoto, 2014. Dynamics of distinct intraseasonal oscillation in summer monsoon rainfall over the Meghalaya-Bangladesh-western Myanmar region: Covariability between the tropics and mid-latitudes. Clim. Dynam., 43, 2147–2166, doi: 10.1007/s00382-013-2040-1.
GEO (Group on Earth Observations), 2007. The First 100 Steps to GEO-SS, Annex of Early Achievements to the Report on Progress, 2007 Cape Town Ministerial Summit: Earth Observations for Sustainable Growth and Development, 30 November 2007, GEO Secretariat, 212pp. https://www.earthobservations.org/documents/the_first_100_steps_to_geoss.pdf.
Hattori, M., S. Mori and J. Matsumoto, 2011. The cross-equatorial north-erly surge over the Maritime Continent and its relationship to precipitation patterns. J. Met. Soc. Japan, 89A, 27–47, doi: 10.2151/jmsj.2011-A02.
Hattori, M., et al., 2016. The impact of additional radiosonde observations on the analysis of disturbances in the South China Sea during VPREX2010. SOLA, 12, 75−79. doi:10.2151/sola.2016-018.
Hayashi, T., et al., 2009. Several features and future perspective of weather condition in the northeastern region of the Indian Subcontinent. Abstracts
Participants at the MAHASRI International Science Conference.
15November 2016
of papers, International Workshop on Agriculture and Sustainable Develop-ment in Brahmaputra Basin, Assam, 57−58.
Htway, O., and J. Matsumoto, 2011. Climatological onset dates of sum-mer monsoon over Myanmar. Int. J. Climatol., 31, 382–393, doi: 10.1002/joc. 2076.
Huang, W.-R. and J. C. L. Chan, 2011. Maintenance mechanisms for the early morning maximum rainfall over Southeast Asia. Q. J. R. Meteorol. Soc. 137, 959−968, doi:10.1002/qj.815.
Johnson, R. and C.-P. Chang, 2007. Winter MONEX: A quarter-century and beyond. Bull. Amer. Meteor. Soc., 88, 385–388, doi: 10.1175/BAMS-88-3-385.
Kiguchi, M., et al., 2013. The heat flux from the land surface during the pre-monsoon season in the inland region of Thailand. Climate and Land Surface Changes in Hydrology, IAHS Publ. 359, 239–245.
Kiguchi, M., J. Matsumoto, S. Kanae and T. Oki, 2016. Pre-monsoon rain and its rerelationship with monsoon onset over the Indochina Peninsula. Front. Earth Sci., 4:42, doi: 10.3389/feart.2016.00042.
Koike, Y., J. Asanuma and G. Davaa, 2014. Identifying Precipitation Sourc-es in Northern Mongolia using Back Trajectory Analysis. 2014 JPGU Meet-ing, Abstracts.
Kubota, H., and B. Wang, 2009. How much do tropical cyclones affect seasonal and interannual rainfall variability over the western North Pacific? J. Clim., 22, 5495−5510, doi: 10.1175/2009JCLI2646.1.
Kubota, H., and J. C. L. Chan, 2009. Interdecadal variability of tropical cyclone landfalll in the Philippines from 1902 to 2005. Geophys. Res. Lett. 36, L12802, doi: 10.1029/2009GL038108.
Kubota, H., Y. Kosaka and S.-P. Xiec, 2016. 117-year long index of the Pacific-Japan pattern with application to interdecadal variability. Int. J. Cli-matol., 36, 1575–1589, doi: 10.1002/joc.4441.
Matsumoto, J., et al. (eds.), 2011. Special Issue on MAHASRI−Monsoon Asian Hydro-Atmosphere Scientific Research and Prediction Initiative. J. Met. Soc. Japan, 89A, 464pp.
Matsumoto, J., et al., 2016. An overview of the Asian Monsoon Years 2007–2012 (AMY) and multi-scale interactions in the extreme rainfall events over the Indonesian maritime continent. The Global Monsoon System Research and Forecast (Third Edition), edited by C.-P. Chang et al., World Scientific Publication Company, in press.
Murata, F., T. Hayashi, J. Matsumoto and H. Asada, 2007. Rainfall on the Meghalaya plateau in northeastern India–one of the rainiest places in the world. Nat. Hazards, 42:391–399, doi: 10.1007/s11069-006-9084-z.
Ngo-Duc, T., J. Matsumoto, H. Kamimera and H. H. Bui, 2013. Monthly adjustment of Global Satellite Mapping of Precipitation (GSMaP) data over the VuGia–ThuBon River Basin in Central Vietnam using an artificial neu-ral network. SOLA 7, 85–90, doi: 10.3178/hrl.7.85.
Nguyen-Le, D., J. Matsumoto and T. Ngo-Duc, 2014. Climatological onset date of summer monsoon in Vietnam. Int. J. Climatol., 34, 3237–3250, doi: 10.1002/ joc.3908.
Nguyen-Le, D., J. Matsumoto and T. Ngo-Duc, 2015. Onset of the rainy seasons in the eastern Indochina Peninsula. J. Climate, 28, 5645-5666. doi: 10.1175/JCLI-D-14-00373.1.
Nguyen-Le, D., and J. Matsumoto, 2016. Delayed withdrawal of the au-tumn rainy season over central Vietnam in recent decades. Int. J. Climatol., 36, 3002–3019. doi: 10.1002/joc.4533.
Nguyen-Thi, H. A., J. Matsumoto, T. Ngo-Duc and N. Endo, 2012a. A climatological study of tropical cyclone rainfall in Vietnam. SOLA, 8, 041-044 , doi:10.2151/sola.2012-011.
Nguyen-Thi, H. A., J. Matsumoto, T. Ngo-Duc and N. Endo, 2012b. Long-term trends in tropical cyclone rainfall in Vietnam, J. Agrofor. Envi-ron., 6(2), 89−92.
Nguyen-Xuan, T., et al., 2016. The Vietnam Gridded Precipitation (VnGP) Dataset: construction and validation. SOLA, 12, 291-294, doi:10.2151/sola.2016-057.
Ogino, S. Y., M. D. Yamanaka, S. Mori and J. Matsumoto, 2016. How much is the precipitation amount over the tropical coastal region? J. Cli-mate, 29, 1231–1236, doi: 10.1175/JCLI-D-15-0484.1.
Takahashi, H. G., Y. Fukutomi and J. Matsumoto, 2011. The impact of long-lasting northerly surges of the East Asian winter monsoon on tropical cyclogenesis and its seasonal march. J. Met. Soc. Japan, 89A, 181−199, doi: 10.2151/jmsj.2011-A12.
Takahashi, H. G., H. Fujinami, T. Yasunari and J. Matsumoto, 2015. Role of tropical cyclones along the monsoon trough in the 2011 Thai flood and interannual variability. J. Climate, 28, 1465−1476, doi: 10.1175/JCLI-D-14-00147.1.
Tangang, F. T., et al., 2008. On the roles of the northeast cold surge, the Borneo vortex, the Madden-Julian Oscillation, and the Indian Ocean Di-pole during the extreme 2006/2007 flood in southern Peninsular Malaysia. Geophys. Res. Lett., 35, L14S07, doi:10.1029/2008GL033429.
Ushio T., et al., 2009. A Kalman filter approach to the Global Satellite Map-ping of Precipitation (GSMaP) from combined passive microwave and in-frared radiometric data. J. Met. Soc. Japan, 87A: 137–151, doi: 10.2151/jmsj.87A.137.
Villafuerte II, M. Q., and J. Matsumoto, 2015. Significant influences of global mean temperature and ENSO on extreme rainfall in Southeast Asia. J. Climate, 28, 1905−1919, doi: 10.1175/JCLI-D-14-00531.1.
Villafuerte II, M. Q., J. Matsumoto and H. Kubota, 2015. Changes in extreme rainfall in the Philippines (1911–2010) linked to global mean temperature and ENSO. Int. J. Climatol., 35, 2033−2044, doi: 10.1002/joc.4105.
Wagatsuma Y., T. Terao, T. Hayashi and A. S. G. Faruque, 2009. Climate change impact on health: diarrhea diseases in Bangladesh. Papers in Interna-tional Workshop on Agriculture and Sustainable Development in Brahma-putra Basin, Assam, 51−4.
Wu, P.-M., Y. Fukutomi and J. Matsumoto, 2011. An observational study of the extremely heavy rain event in northern Vietnam during 30 Octo-ber–1 November 2008. J. Met. Soc. Japan, 89A:331−344, doi: 10.2151/jmsj.2011-A23.
Yatagai, A., O. Arakawa, K. Kamiguchi, H. Kawamoto, M. I. Nodzu and A. Hamada, 2009. A 44-year daily gridded precipitation dataset for Asia based on a dense network of rain gauges. SOLA, 5, 137–140. doi: 10.2151/sola.2009-035.
Yatagai, A., et al., 2012. APHRODITE: Constructing a long-term daily gridded precipitation dataset for Asia based on a dense network of rain gauges. Bull. Amer. Meteor. Soc., 93, 1401–1415. doi: 10.1175/BAMS-D-11-00122.
Yokoi, S., and J. Matsumoto, 2008. Collaborative effects of cold surge and tropical depression-type disturbance on heavy rainfall in central Vietnam. Mon. Wea. Rev., 136, 3275−3288, doi: 10.1175/2008MWR2456.1.
16 November 2016
Integrated Study Project on Hydrometeorological Prediction and
Adaptation to Climate Change in Thailand (IMPAC-T)
Taikan Oki1, Masashi Kiguchi1 and Nontawat Junjareon2
1Institute of Industrial Science, The University of Tokyo, Ja-pan; 2Faculty of Engineering, Kasetsart University, Thailand
Brief History of Japanese and Thai Collaborative Hydrocli-matological Projects in Southeast AsiaResearchers from academia and operational agencies from Thailand and Japan have been collaborating in research rel-evant to hydrology, water resources engineering and related disciplines for over two decades. In the late 1980s, Prof. Katumi Musiake of the University of Tokyo and the late Prof. Hiroyoshi Shiigai of Tsukuba University organized the Hy-drology in Humid Tropical Regions in Asia Project under the UNESCO International Hydrology Programme (IHP). In the 1990s, the GEWEX Asian Monsoon Experiment in the Tropics (GAME-T) conducted field measurements for use in hydrometeorological applications and model predictions for water resources management. After GAME-T, collaboration was maintained through the Research and Development of Hydrological Modeling and Water Resources Systems Project under the Japan Science and Technology Agency (JST) Core Research for Evolutional Science and Technology Program (CREST). A Global Earth Observation System of Systems (GEOSS) pilot study supported by the Japan Earth Observing System (EOS) Promotion Program (JEPP) was successfully carried out in Thailand from 2005 to 2008.
IMPAC-TWith increasing population growth, urbanization and demo-graphic changes, many areas of the world have become more vulnerable to natural disasters, such as floods and droughts. Projected climate change is predicted to exacerbate the impacts of these hydrometeorological extreme events in the coming decades. To address these issues in Thailand and neighboring regions, an international project called the Integrated Study Project on Hydrometeorological Prediction and Adaptation to Climate Change in Thailand (IMPAC-T; http://impact.eng.ku.ac.th/cc/) was conducted during the Monsoon Asian Hydro-Atmosphere Scientific Research and Prediction Initia-tive (MASHARI) from 2009 to 2014. IMPAC-T was a techni-cal cooperation and joint research project with Thailand and Japan to develop a prototype hydrological information system to support decision making on water-related climate change impacts by the Government of Thailand. The project observed and analyzed meteorological phenomena, hydrological cycles and water management in Thailand to understand the physical and social mechanisms associated with them, and constructed future scenarios to develop mitigation strategies for anticipat-ed hydrometeorological damages. IMPAC-T was supported by the Science and Technology Research Partnership for Sus-
tainable Development (SATREPS), a program implemented jointly by the Japan International Cooperation Agency (JICA) and the Japan Science and Technology Agency (JST).
Thailand experienced a major flood disaster in 2011 and the extent of flooding from the Chao Phraya River was unprec-edented. The impact of this disaster was also felt in Japan because both countries are tightly linked together by joint manufacturing businesses. During the flood, researchers in-volved in IMPAC-T conducted extensive field surveys, data collection and numerical simulations. At that time there was no integrated server system for hydrometeorological data col-lection and prediction (Komori et al., 2012). A new climate change data center was established at Kasetsart University in Bangkok, Thailand at the conclusion of IMPACT-T to sup-port data collection, future projections and decision making to minimize the impacts of hydrometeorological disasters in Thailand.
IMPAC-T ResultsKotsuki and Tanaka (2013) quantitatively examined global precipitation products, compared these with surface rain gauge data, and applied this information to hydrological simulations to reveal how sensitive the discharge simulation in the Chao Phraya River Basin is to forcing precipitation data. Ono et al. (2013) assessed how extreme precipitation values estimated from globally gridded precipitation data sets compared with those derived from rain gauge data sets in the Indo-China Pen-insula using a bias correction method for elevation effect, vali-dated with rain gauge data from the Mae Chaem Watershed in Northern Thailand. Veerakachen et al. (2014) validated the products from the Global Satellite Mapping of Precipitation (GSMaP) Project using the rain gauge database established under IMPAC-T. They found that the accuracy of the near real-time product is good but not sufficient for early-warning applications, whereas the non-real-time product is suitable for climate change studies. Watanabe et al. (2014) applied a bias correction method developed in Watanabe et al. (2012) for fu-ture climatic projections in Coupled Model Intercomparison Project Phase 5 (CMIP5) data sets and provided forcing data for assessing future hydrological and water resources changes in the Chao Phraya River Basin.
A study by Champathong et al. (2013) found a significant decrease in the river discharge during the dry season by as-sessing possible changes in the hydrological regime in the Chao Phraya River that were projected by the Meteorological Research Institute Atmospheric General Circulation Model (MRI-AGCM) simulations with two spatial resolutions and scenarios. Kotsuki et al. (2014) examined the uncertainties associated with the future projection of river discharge in the Chao Phraya River Basin using multi-model and multi-sce-nario General Circulation Model (GCM) simulations from the CMIP5 data set, and found a robust increase in mid rainy season precipitation and a possible increase in flood vol-ume. Pratoomchai et al. (2014) assessed future projections of ground water resources in the upper Chao Phraya River Basin using multiple scenarios and GCM simulations, and
17November 2016
found that ground water depletion is projected for the region due to decreases in recharge and storage.
Hatono et al. (2014) tried to convert an area inundated by water detected by the Moderate Resolution Imaging Spectro-radiometer (MODIS) to total water volume in a macroscale region covering the Indo-China Peninsula, and found gen-eral agreement with the seasonal change of water volume ob-served by gravity measurements from the Gravity Recovery and Climate Experiment (GRACE) (see Figure 1). Kobayashi and Yokoo (2013) analyzed the relationship between river dis-charge and water stored in the river basin with hydrograph
separation in temporal domain, and estimated realistic sea-sonal changes in total water storage in a mountainous river basin. Yokoo et al. (2014) advanced the study by Kobayashi and Yokoo (2013) that estimated water storages in mountain-ous regions in northern Thailand, and proposed five different discharge subcomponents.
Kim et al. (2014) evaluated the governing process of evapo-transpiration based on more than a decade of field observations and found the impact of land use and land cover change is not significant in northern Thailand compared to meteorological variations. Hanasaki et al. (2014) introduced how a quasi-real time hydrological simulation system using H08 (Hanasaki et al., 2008) for the Chao Phraya river basin was developed us-ing forcing data-synthesized data sets, including the IMPAC-T automatic weather stations (see Figure 2).
From IMPAC-T to ADAP-TThe research achievements of the project have been published in a special collection of the Journal of Hydrological Research Letters. The researchers of IMPAC-T are hopeful that their re-search achievements will greatly contribute to reducing flood damage in the future and to supporting better decision-mak-ing in water resource management. A new research project, Advancing co-Design of integrated strategies with AdaPta-tion to climate change in Thailand (ADAP-T), was approved as another project for 2016 through 2020 under SATREPS. ADAP-T puts emphasis on studies on impacts and adaptation of climate change in six sectors, namely freshwater resources, sediment disasters, coastal regions, rural areas including agri-cultural productions, forest region and land use changes, and urban area, particularly flash flooding. Governmental sections related to the climate change action plan in Thailand have been involved in ADAP-T from the initial discussions of the proj-ect, and are expected to utilize the outcomes of ADAP-T for their policy making and planning of climate change actions.
Figure 1. Temporal variation of the water height equivalent spatially av-eraged for the Chao Phraya River Basin (Hatono et al., 2014). The values for GRACE (green dashed line), converted MODIS without rivers (red dotted line) and converted MODIS with rivers (blue solid line) are shown. The period of the flood in the Chao Phraya river basin is shaded.
Figure 2. Simulated daily river discharge at four stations in the Chao Phraya River Basin in 2012 [m3 s–1] (red lines, Hanasaki et al., 2014). Black lines show the observations. The horizontal axis shows the month and day of the year.
18 November 2016
References
Champathong, A., et al., 2013. Future projection of mean river discharge climatology for the Chao Phraya River basin. Hydrol. Res. Letts., 7, 36–41, doi: 10.3178/hrl.7.36.
Hanasaki, N., et al., 2008. An integrated model for the assessment of global water resources–Part 1: Model description and input meteorological forc-ing. Hydrol. Earth Syst. Sc., 12, 1007–1025.
Hanasaki, N., et al., 2014. A quasi-real-time hydrological simulation of the Chao Phraya River using meteorological data from the Thai Meteorological Department Automatic Weather Stations. Hydrol. Res. Letts., 8, 9–14, doi: 10.3178/hrl.8.9.
Hatono, M., K. Noda, H. Kim, S. Baimoung, K. Yoshimura, K. Oki and T. Oki, 2014. Conversion of surface water coverage to water volume using satellite data. Hydrol. Res. Letts., 8, 15–19, doi: 10.3178/hrl.8.15.
Kim, W., D. Komori, J. Cho, S. Kanae and T. Oki, 2014. Long-term analy-sis of evapotranspiration over a diverse land use area in northern Thailand. Hydrol. Res. Letts., 8, 45–50. doi: 10.3178/hrl.8.45.
Kobayashi, S., and Y. Yokoo, 2013. Estimating watershed-scale storage changes from hourly discharge data in mountainous humid watersheds: toward a new way of dominant process modeling. Hydrol. Res. Letts., 7, 97–103, doi: 10.3178/hrl.7.97.
Komori, D., et al., 2012. Characteristics of the 2011 Chao Phraya River flood in Central Thailand. Hydrol. Res. Letts., 6, 41–46. doi: 10.3178/HRL.6.41.
Kotsuki, S., and K. Tanaka, 2013. Uncertainties of precipitation products and their impacts on runoff estimates through hydrological land surface simula-tion in Southeast Asia. Hydrol. Res. Letts., 7, 79–84. doi: 10.3178/hrl.7.79.
Kotsuki, S., K. Tanaka and S. Watanabe. 2014. Projected hydrological changes and their consistency under future climate in the Chao Phraya Riv-er Basin using multi-model and multi-scenario of CMIP5 dataset. Hydrol. Res. Letts., 8, 27–32. doi: 10.3178/hrl.8.27.
Mateo, C. M., et al., 2014. Assessing the impacts of reservoir operation to floodplain inundation by combining hydrological, reservoir management, and hydrodynamic models. Water Resour. Res., 50(9), 7245–7266.
Ono, K., S. Kazama, L. N. Gunawardhan and K. Kuraji, 2013. An investi-gation of extreme daily rainfall in the Mekong River Basin using a gridded precipitation dataset. Hydrol. Res. Letts., 7, 66–72, doi: 10.3178/hrl.7.66.
Pratoomchai, W., S. Kazama, N. Hanasaki, C. Ekkawatpanit, D. Komori, 2014. A projection of groundwater resources in the Upper Chao Phraya Riv-er basin in Thailand. Hydrol. Res. Letts., 8, 20–26, doi: 10.3178/hrl.8.20.
Veerakachen, W., M. Raksapatcharawong and S. Seto, 2014. Performance evaluation of Global Satellite Mapping of Precipitation (GSMaP) products over the Chaophraya River Basin, Thailand. Hydrol. Res. Letts., 8, 39–44, doi: 10.3178/hrl.8.39.
Watanabe, S., et al., 2012. Intercomparison of bias-correction methods for monthly temperature and precipitation simulated by multiple climate mod-els. J. Geophys. Res., 117, D23114, doi: 10.1029/2012JD018192.
Watanabe, S., et al., 2014. Application of performance metrics to climate models for projecting future river discharge in the Chao Phraya River basin. Hydrol. Res. Letts., 8, 33–38, doi: 10.3178/hrl.8.33.
Yokoo, Y., et al., 2014. Storage under the 2011 Chao Phraya River flood: An interpretation of watershed-scale storage changes at two neighboring mountainous watersheds in northern Thailand. Hydrol. Res. Letts., 8, 1–8, doi: 10.3178/hrl.8.1.
MAHASRI Activities Related to theIndonesian Maritime Continent
Manabu Yamanaka1,2, Shuichi Mori1 and Fadli Syamsudin3
1Japan Agency for Marine-Earth Science and Technology, Yokosuka, Japan; 2Professor Emeritus, Kobe University, Kobe, Japan; 3Agency for the Assessment and Application of Technology, South Tangerang, Indonesia
Scientific studies by Monsoon Asian Hydro-Atmosphere Sci-entific Research and Prediction Initiative (MAHASRI) over the Indonesian Maritime Continent (IMC) were conducted in parallel with projects for societal applications (e.g., floods and landslides) and capacity building. These studies used radar ob-servations initially targeting the intraseasonal variations (ISV) of the IMC, the world’s strongest convective activity.
In 2005 the Hydrometeorological Array for ISV-Monsoon Automonitoring (HARIMAU) (Yamanaka et al., 2008) was accepted under the Japan Earth-Observation System Promo-tion Program (JEPP) as a contribution to the Global Earth Observation System of Systems (GEOSS; see GEO, 2007). HARIMAU was conducted from August 2005 to March 2010 in collaboration with the Japan Agency for Marine-Earth Sci-ence and Technology (JAMSTEC), Kyoto University, Hok-kaido University of Japan, the Agency for the Assessment and Application of Technology (BPPT), the Indonesian National Institute of Aeronautics and Space (LAPAN) and the Indo-nesian Agency for Meteorology, Climatology and Geophysics (BMKG). HARIMAU consisted of a radar-profiler network with meteorological Doppler radars [C-band at Serpong near Jakarta, and X-band near Padang (e.g., Kawashima et al., 2011; Sakurai et al., 2011; Mori et al., 2011; Kamimera et al., 2012)] and wind profilers (Pontianak, Manado and Biak) (e.g., Tabata et al., 2011). The large Doppler Equatorial At-mospheric Radar located at Kototabang (e.g., Shibagaki et al., 2006; Seto et al., 2009) was also included in the network (see Figure 1). Rainfall and wind distribution data were displayed via the Internet in near real-time throughout the project.
Since 2005, the Indonesian Government has funded the BMKG’s efforts to install over 40 C-band Doppler radars (see Figure 1). The number of radiosonde stations was also increased to 23, which contributed to the improved accuracy of objective analyses at meteorological agencies worldwide (cf. Seto et al., 2009). In parallel to the measurements obtained by the radars and radiosondes, JAMSTEC and BPPT collaborat-ed on buoy-vessel observations over the Indonesian Exclusive Economic Zone as a part of the international network of the Tropical Ocean Climate Study (TOCS, Ando et al., 2010). Another JEPP project, the Indian Ocean Moored Network Initiative for Climate Studies (IOMICS), collected data during 2005‒2010 as a part of Research Moored Array for African-Asian-Australian Monsoon Analysis and Prediction (RAMA, McPhaden et al., 2009). Vessel-radar-radiosonde observations on atmosphere-ocean interactions over the Indian Ocean were
19November 2016
conducted by the Mirai Indian Ocean Cruise for the Study of the Madden-Julian Oscillation (MJO)-Convection Onset in 2006 (MISMO2006; Yoneyama et al., 2008).
In 2009, a follow-on project to HARIMAU and IOMICS was approved under the Science and Technology Research Partner-ship for Sustainable Development (SATREPS). This project established an international center of tropical climatology, me-teorology and oceanography, called the Maritime Continent Center of Excellence (MCCOE) under BPPT in November 2013, and included capacity building for radar operations and buoy manufacturing during 2010–2014. A campaign of obser-vations and hydrological data analysis (HARIMAU2011) was conducted (Sulistyowati et al., 2014) in collaboration with the Cooperative Indian Ocean Experiment on Intraseasonal Vari-ability in the Year 2011 (CINDY2011; Yoneyama et al., 2013). After MCCOE was established, the HARIMAU radars and profilers became the responsibility of that Center (see: http://www.jamstec.go.jp/iorgc/harimau/HARIMAU.html and http://neonet.bppt.go.id/satreps/, http://tisda.bppt.go.id/mccoe/).
Multiscale Interactions over the Indonesian Maritime ContinentResearch by the HARIMAU and MCCOE projects confirms that the local diurnal cycles (sea-land breeze circulation) are the most fundamental phenomena over the IMC with land-sea coexistence and without cyclonic activities. Variabilities of the diurnal cycles are understood by multi-scale interactions with intraseasonal variations (MJO), hemispheric seasonal cy-
Figure 1. Observation networks used in HARIMAU (2005–2010) and MCCOE (2010-2014) projects (see Yamanaka et al., 2008; Ando et al., 2010), in collaboration with US-Japan-China RAMA-Triangle Trans-Ocean Buoy Network (TRITON)-Tropical Atmosphere Ocean (TAO) climate buoy arrays (upper map) and Indonesian BMKG operational radars installed before 2010 (blue and orange circles) and by the Malaysian Meteorological Depart-ment (green circles).
cles (monsoon surges) and interannual variations such as the El Niño Southern Oscillation (ENSO) and the Indian Ocean Dipole (IOD) (Yamanaka, 2016; Matsumoto et al., 2016).
The diurnal-cycle dominance over the IMC that had been ob-served by satellites prior to MAHASRI (e.g., Mori et al., 2004; Sakurai et al., 2005) was confirmed by profiler-radar observa-tions (e.g., Araki et al., 2006; Tabata et al., 2011). Data showed that even in the rainy season (austral summer in Java and Bali), the rainfall-induced land cooling reverses the trans-coastal tem-perature gradient before sunrise and the resulting clear sky over land until around noon provides solar heating, depending on the season. These processes lead to rapid land/hydrosphere-atmosphere water exchange, local air pollutant washout and transequatorial boreal winter monsoon surges (e.g., Hattori et al., 2011). Although events associated with sub-synoptic-scale Borneo (or cold surge) vortices (e.g., Yokoi and Matsumoto, 2008) and the rare mesoscale tropical storms are often extreme, the contribution of normal diurnal cycles is considerable in the annual regional rainfall amount over the IMC.
These features are in contrast to the Inter-Tropical Convergence Zone with the MJO appearing clearly over the Indian and Pa-cific Oceans on both sides of the IMC (e.g., Shibagaki et al., 2006; Hidayat and Kizu, 2010; Fujita et al., 2011; Kamimera et al., 2012; Marzuki et al., 2013). Larger moisture transport from warmer sea water in La Niña and negative IOD years activates the diurnal-cycle rainfall, which leads to an ambigu-ous dry season and flood disasters during cold surges and/or
20 November 2016
MJO active phases in the rainy season (e.g., Wu et al., 2007, 2013; Sulistyowati et al., 2014; Matsumoto et al., 2016, see Figure 2). In El Niño and/or positive IOD years, the cooler sea-surface temperature suppresses the morning coastal-sea rainfall, and often induces serious drought and smog disasters over the IMC (Hamada et al., 2002, 2012; Kubota et al., 2011; Les-tari et al., 2016). Agricultural applications were assessed using detailed climate prediction (Hidayat et al., 2016). Decadal or longer-scale rainfall trends (e.g., Endo et al., 2009; Villafuerte and Matsumoto, 2015) should also appear through amplitude modulations of the diurnal cycles associated with variations of the sea-surface temperature and moisture transport.
The Water Cycle in the Indonesian Maritime ContinentOgino et al. (2016) found that global tropical rainfall rises sig-nificantly at the coastline due to the diurnal cycles and is usu-ally concentrated within 300 km of the coastline (left panel of Figure 3). Therefore, the total length of the IMC coastlines generates the world’s largest rainfall (Yamanaka, 2016) (right panel of Figure 3). The diurnal cycle of land-sea circulation along the coastline is suppressed in smaller islands, resulting in less rainfall. For small islands neighboring larger islands within a distance of 100 km, such as Siberut near Sumatra (Wu et al., 2008b; Kamimera et al., 2012) and Biak near Papua (Tabata et al., 2011), there are two peaks in rainfall due to the different diurnal cycles of both islands (night and morning by small and large islands, respectively).
Figure 2. A heavy rainfall event associated with morning rain (migrating from sea to land) amplified mainly by ISV and partly by a cold surge, observed with 2-km altitude Constant-Altitude Plan Position Indicator (CAPPI) images of the HARIMAU C-band radar at Serpong/Jakarta during 15–17 Janu-ary 2013 near Jakarta, west Java (Wu et al., 2013).
The hydrological cycle of the IMC was revealed using isotopic analysis (Kurita et al., 2009; Fudeyasu et al., 2011; Suwarman et al., 2013; Belgaman et al., 2016). Ascending of the tem-perature inversion layer (suppressing transport from below) was observed over the Indochina Peninsula during the onset of the rainy season, but not in the coastal region (e.g., Nodzu et al., 2006). Kelvin-Helmholtz billow clouds or shear-gravity clouds were observed near the tropopause (e.g., Mega et al., 2010). Observational data contributed to global reanalysis, as well as high-resolution numerical studies both for regional (e.g., Wu et al., 2008a, 2009) and global (e.g., Sato et al., 2009) scales.
As a follow-on to the activities described, a multi-national ob-servation campaign, Years of the Maritime Continent (YMC), is being planned for 2017–2019, in parallel with numerical weather prediction studies.
References
Ando, K., et al., 2010. Development of new international research labo-ratory for maritime-continent seas climate research and contributions to global surface moored buoy array. Proceedings of the “OceanObs’09: sustained Ocean Observations and Information for Society” Conference (Annex), Venice, Italy, 21–25 Sept. 2009, Hal, J., D.E. Harrison and D. Stammer (eds), ESA Publication WPP-306.
Araki, R., et al., 2006. Seasonal and interannual variations of diurnal cycles of local circulation and cloud activity observed at Serpong, West Jawa, In-donesia. J. Met. Soc. Japan, 84A, 171–194.
21November 2016
Figure 3. Precipitation-coastline relationships: (Left) local precipitation observed by the Tropical Rainfall Measuring Mission (TRMM) (37°S−37°N; December 1997−January 2011) as a function of coastline distance (Ogino et al., 2016); (Right) regional precipitation plotted from an IPCC report (blue diamonds=observtions, pink squares=numerical simulations) as a function of coastline density (defined by coastline length divided by land area, in 100-km resolution) (modified from Yamanaka, 2016).
Belgaman, H. A., K. Ichiyanagi, M. Tanoue, R. Suwarman, K. Yoshimura, S. Mori, N. Kurita, M. D. Yamanaka and F. Syamsudin, 2016. Intraseasonal variability of δ18O of precipitation over the Indonesian maritime continent related to the Madden-Julian oscillation. SOLA, 12, 192–197.
Endo, N., J. Matsumoto and T. Lwin, 2009. Trends in precipitation ex-tremes over Southeast Asia. SOLA, 5, 168‒171.
Fudeyasu, H., et al., 2011. Effects of large-scale moisture transport and mesoscale processes on precipitation isotope ratios observed at Sumatera, Indonesia. J. Met. Soc. Japan, 89A, 49–59.
Fujita, M., et al., 2011. Diurnal convection peaks over the eastern Indian Ocean off Sumatra during different MJO phases. J. Met. Soc. Japan, 89A, 317−330.
GEO (Group on Earth Observations), 2007. The First 100 Steps to GEO-SS, Annex of Early Achievements to the Report on Progress, 2007 Cape Town Ministerial Summit: Earth Observations for Sustainable Growth and Development, 30 November 2007, GEO Secretariat, 212pp. https://www.earthobservations.org/documents/the_first_100_steps_to_geoss.pdf.
Hamada, J.-I., M. D. Yamanaka, J. Matsumoto, S. Fukao, P. A. Winarso and T. Sribimawati, 2002. Spatial and temporal variations of the rainy season over Indonesia and their link to ENSO. J. Met. Soc. Japan, 80, 285–310.
Hamada, J.-I., et al., 2012. Interannual rainfall variability over Northwest-ern Jawa and its relation to the Indian Ocean Dipole and El Niño-Southern Oscillation events. SOLA, 8, 069-072.
Hattori, M., S. Mori and J. Matsumoto, 2011. The cross-equatorial north-erly surge over the maritime continent and its relationship to precipitation patterns. J. Met. Soc. Japan, 89A, 27−47.
Hidayat, R. and S. Kizu, 2010. Influence of the MJO on Indonesian rainfall variability in austral summer. Int. J. Climatol., 30, 1816–1825.
Hidayat, R., K. Ando, Y. Masumoto and J. J. Luo, 2016. Interannual vari-ability of rainfall over Indonesia: Impacts of ENSO and IOD and their predictability. IOP Conf. Series: Earth and Environmental Science, 31, 012043, doi: 10.1088/1755-1315/31/1/012043.
Kamimera, H., et al., 2012. Modulation of diurnal rainfall cycle by the Madden-Julian Oscillation based on one-year continuous observations with a meteorological radar in West Sumatera. SOLA, 8, 111–114.
Kawashima, M., et al., 2011. Case study of an intense wind event associated with a mesoscale convective system in west Sumatera during the HARI-MAU2006 campaign. J. Met. Soc. Japan, 89A, 239–257.
Kubota, H., et al., 2011. Interannual rainfall variability over the eastern maritime continent. J. Met. Soc. Japan, 89A, 111–122.
Kurita, N., et al., 2009. The relationship between the isotopic content of precipitation and the precipitation amount in tropical regions. J. Geochem. Explor., 102, 113–122.
Lestari, S., et al., 2016. ENSO influences on rainfall extremes around Su-lawesi and Maluku Islands in the eastern Indonesian maritime continent. SOLA, 12, 37–41.
Marzuki, H., et al., 2013. Cloud episode propagation over the Indonesian maritime continent from 10 years of infrared brightness temperature obser-vations. Atmos. Res., 120, 268–286.
Matsumoto, J., et al., 2016. Overview of the Asian Monsoon Years 2007–2012 (AMY) and multi-scale interactions in the extreme rainfall events over the Indo-nesian maritime continent. The Global Monsoon System Research and Forecast (Third Edition), edited by C.-P. Chang et al., World Scientific Pub. Co., in press.
McPhaden, M., et al., 2009. RAMA: The research moored array for African-Asian-Australian monsoon analysis and prediction. Bull. Amer. Meteor. Soc., 90, 459–480.
Mega, T., et al., 2010. Turbulence generation by Kelvin-Helmholtz instabil-ity in the tropical tropopause layer observed with a 47-MHz range imaging radar. J. Geophys. Res., 115, D18115, doi:10.1029/2010JD013864.
Mori, S., et al., 2004. Diurnal land-sea rainfall peak migration over Su-matera Island, Indonesian maritime continent, observed by TRMM satellite and intensive rawinsonde soundings. Mon. Weather Rev., 132, 2021–2039.
Mori, S., et al., 2011. Convective systems developed along the coastline of Sumatra Island, Indonesia observed with an X-band Doppler radar during the HARIMAU2006 campaign. J. Met. Soc. Japan, 89A, 61–81.
Nodzu, M. I., S.-Y. Ogino, Y. Tachibana and M. D. Yamanaka, 2006. Cli-matological description on seasonal variations of temperature inversion lay-ers over the Indochina Peninsula. J. Climate, 19, 3307–3319.
22 November 2016
MAHASRI Activities in Northeast Asia
Jun Asanuma1, Yuriko Koike2 and Gombo Davaa3
1Center for Research in Isotopes and Environmental Dy-namics, University of Tsukuba, Japan; 2Teikoku Internation-al Co., Gifu, Japan; 3Information and Research Institute of Meteorology, Hydrology and Environment, Mongolia
Monsoon Asian Hydro-Atmosphere Scientific Research and Prediction Initiative (MAHASRI) activities in Northeast Asia included intensive observations, analyses and model simulations under the Rangeland Atmosphere-Hydrosphere-Biosphere Interaction Study Experiment (RAISE) and Post-RAISE Project (PRAISE, Sugita et al., 2007). The observa-tions were obtained from a hydrometeorological monitoring network located on semiarid grasslands about 100 km east of Ulaanbaatar, Mongolia. The network consisted of three auto-matic weather stations that obtained general meteorological data and an eddy covariance flux measurement system located at a semiarid steppe near the village of Kherlen Bayan Ulaan (KBU, e.g., Li et al., 2007). The interannual variations of the surface water balance measured at KBU revealed that most of precipitated water evaporated during the drier years, while in the wetter years, some amount of water was percolated into and stored in the deeper soil. In addition, during the observa-tion period, each of these wetter and drier periods was found to last more than one, and sometimes several years.
The Asian Dryland Model Intercomparison Project (ADMIP, Asanuma et al. 2012) intercompared land-surface models with data obtained from Asian drylands. Intercomparisons of sur-face flux components at the monthly scales revealed that the sensible heat flux is more difficult to predict than the latent heat flux, as the latter is fully constrained by precipitation, while the former involves partitioning of the heat between the
Figure 1. Precipitation sources of the Mongolian grassland (the red dot) and their strength averaged over the seven warm seasons from 2003.
Ogino, S.-Y., et al., 2016. How much is the precipitation amount over the tropical coastal region? J. Climate, 29, 1231–1236.
Sakurai, N., et al., 2005. Diurnal cycle of cloud system migration over Su-matera Island. J. Meteorol. Soc. Japan, 83, 835–850.
Sakurai, N., S. Mori, M. Kawashima, Y. Fujiyoshi, J. Hamada, S. Shimizu, H. Fudeyasu, et al., 2011. Migration process and 3D wind field of precipita-tion systems associated with a diurnal cycle in west Sumatera: Dual Dop-pler radar analysis during the HARIMAU2006 campaign. J. Meteorol. Soc. Japan, 89, 341–361.
Sato, T., H. Miura, M. Satoh, Y. N. Takayabu and Y. Wang, 2009. Diurnal cycle of precipitation in the tropics simulated in a global cloud-resolving model. J. Climate, 22, 4809–4826.
Seto, T. H., et al., 2009. Comparison study of lower-tropospheric horizontal wind over Sumatera, Indonesia using NCEP/NCAR reanalysis, operational radiosonde, and the Equatorial Atmosphere Radar. SOLA, 5, 21–24.
Shibagaki, Y., et al., 2006. Multi-scale convective systems associated with an intraseasonal oscillation over the Indonesian maritime continent. Mon. Weather Rev., 134, 1682–1696.
Sulistyowati, R., et al., 2014. Rainfall-driven diurnal variations in the Cili-wung River, West Jawa, Indonesia. SOLA, 10, 141−144.
Suwarman, R., et al., 2013. The variability of stable isotopes and water ori-gin of precipitation over the maritime continent. SOLA, 9, 74–78.
Tabata, Y., et al., 2011. Observational study on diurnal precipitation cycle in equatorial Indonesia using 1.3-GHz wind profiling radar network and TRMM precipitation radar. J. Atmos. Sol. Terr. Phys., 73, 1031–1042.
Villafuerte, M. Q., and J. Matsumoto, 2015. Significant influences of global mean temperature and ENSO on extreme rainfall in Southeast Asia. J. Cli-mate, 28, 1905–1919.
Wu, P., et al., 2007. The impact of trans-equatorial monsoon flow on the formation of repeated torrential rains over Java Island. SOLA, 3, 93−96.
Wu, P.-M., M. D. Yamanaka and J. Matsumoto, 2008a. The formation of nocturnal rainfall offshore from convection over western Kalimantan (Bor-neo) Island. J. Met. Soc. Japan, 86A, 187–203.
Wu, P.-M., et al., 2008b. Diurnal variation of rainfall and precipitable wa-ter over Siberut Island off the western coast of Sumatera Island. SOLA, 4, 125–128.
Wu, P.-M., M. Hara, J.-I. Hamada, M. D. Yamanaka and F. Kimura, 2009. Why heavy rainfall occurs frequently over the sea in the vicinity of western Sumatera Island during nighttime. J. Appl. Meteor., 48, 1345–1361.
Wu, P., et al., 2013. The effects of an active phase of the Madden-Julian Os-cillation on the extreme heavy precipitation event over western Java Island in January 2013. SOLA, 9, 79–83.
Yamanaka, M. D., et al., 2008. HARIMAU radar-profiler network over In-donesian maritime continent: A GEOSS early achievement for hydrological cycle and disaster prevention. J. Disaster Res., 3, 78–88.
Yamanaka, M. D., 2016. Physical climatology of Indonesian maritime continent: An outline to comprehend observational studies. Atmos. Res., 178–179, 231–259.
Yokoi, S., and J. Matsumoto, 2008. Collaborative effects of cold surge and tropical depression–type disturbance on heavy rainfall in central Vietnam. Mon. Wea. Rev., 136, 3275–3287.
Yoneyama, K., et al., 2008. MISMO field experiment in the equatorial In-dian Ocean. Bull. Amer. Meteor. Soc., 89, 1889–1903.
Yoneyama, K., C. Zhang and C. N. Long, 2013. Tracking pulses of the Madden–Julian oscillation. Bull. Amer. Meteor. Soc., 94, 1871–1891.
23November 2016
air and the soil (Asanuma et al., 2012). The data from KBU was also used to investigate hydrometeorological regimes and to model drylands in Northeastern Asia (e.g., Zhang et al., 2010; Xia et al., 2014).
Identifying the location of the precipitation sources, their strength and their temporal variations provided insights into the hydrological cycle and its interactions with land surfaces (e.g., Gimeno et al., 2012). The precipitation sources of the Mongolian grasslands were identified through quasi-isentropic backtrajectory analyses of water vapor (e.g., Dirmeyer and Brubaker, 1999; Dirmeyer et al., 2014) for the seven warm seasons starting in 2003. The analyses used the Japanese 25-year Reanalysis (JRA25) for the atmospheric field and the measurements of rain gauges in the Mongolian grasslands for the precipitation amount. Source regions of precipitation at the Mongolian grassland were identified as an average of the seven warm seasons (see Figure 1), where the strongest source was located in and around Mongolia and the other major sources were found in central and western Asia. The temporal variations of these sources summarized with respect to their regions are shown in Figure 2. The precipitation at the target that evaporated at the local Mongolian land surface was rela-tively steady over the years investigated, except in 2004.
The precipitation sources in 2004 can be attributed to the abnormally large amount of precipitation received in the late autumn of the previous year. As usually seen in the high latitudes, surface soil freezes during the winter in Mongolia. Therefore, late fall precipitation tends to be preserved in the frozen soil during the subsequent winter, and melts during the next spring. This in turn causes a wetter soil surface accompa-nied by greater evaporation, which could be associated with a greater moisture supply that encourages local precipitation. Current results are consistent with these general ideas.
Figure 2. Interannual variations of the strength of the precipitation sourc-es in the Mongolian grassland. CTA, WTA, WSB, ESB and MON stand for the central and the western Asia, the western and the eastern Siberia, and Mongolia, respectively.
In addition to the Mongolian grassland, precipitation sources were also studied for three additional points on the same me-ridian shown in the left panel of Figure 3. The results were used to compute the recycle ratio of the precipitation (defined as the ratio between the precipitated water that was evaporated from the local surface to the total precipitation) and are shown in the right panel of Figure 3, where the southern points tend to have a smaller recycle ratio. This clearly reflects the nature of the Asian summer monsoon, where the horizontal mass trans-fer of water is accompanied by a lower recycling ratio.
References
Asanuma, J., D. Ojima, B. Ailikun and K. Yorozu, 2012. Intercomparison of land surface process modeling in Asian drylands. APN Science Bulletin, 3, 65–66.
Dirmeyer, P. A., and K. L. Brubaker, 1999. Contrasting evaporative mois-ture sources during the drought of 1988 and the flood of 1993. J. Geophys. Res.-Atmos., 104, 19383–19397.
Dirmeyer, P. A., J. Wei, M. G. Bosilovich and D. M. Mocko, 2014. Com-paring evaporative sources of terrestrial precipitation and their extremes in MERRA using relative entropy. J. Hydrometeor., 15, 102–116.
Gimeno, L., A. Stohl, R. M. Trigo, F. Dominguez, K. Yoshimura, L. Yu, A. Drumond, A. M. Durán Quesada and R. Nieto, 2012. Oceanic and terrestrial sources of continental precipitation. Rev. Geophys., 50, RG4003.
Li, S. G., J. Asanuma, A. Kotani, G. Davaa and D. Oyunbaatar, 2007. Evapotranspiration from a Mongolian steppe under grazing and its environ-mental constraints. J. Hydrol., 333, 133–143.
Sugita, M., J. Asanuma, M. Tsujimura, S. Mariko, M. Lu, F. Kimura, D. Azzaya and T. Adyasuren, 2007. An overview of the rangelands atmosphere–hydrosphere–biosphere interaction study experiment in northeastern Asia (RAISE). J. Hydrol, 333, 2007.
Xia, J., S. Liang, J. Chen, W. Yuan, S. Liu, L. Li, W. Cai, L. Zhang, Y. Fu, T. Zhao and others, 2014. Satellite-based analysis of evapotranspiration and water balance in the grassland ecosystems of dryland East Asia. PLOS ONE, 9, e97295.
Zhang, F., W. Ju, J. Chen, S. Wang, G. Yu, Y. Li, S. Han and J. Asanuma, 2010. Study on evapotranspiration in East Asia using the BEPS ecological model. J. Nat. Res., 25, 1596–1606.
Figure 3. Recycle ratio computed at the four points (left) indicated in the map (right).
24 November 2016
Meeting/Workshop Reports
Workshop on Land Surface Multi-Sphere Processes of the Tibetan Plateau andAssessment of Their Environmental
and Climate Effects 8–10 August 2016
Xining, China
Tandong Yao1 and Yongkang Xue2
1Institute of Tibetan Plateau Research, Chinese Academy of Sciences, China; 2University of California, Los Angeles, California, USA
The Tibetan Plateau (TP), often called the Third Pole, is a unique geographic region that includes the Himalayas and sur-rounding mountain ranges. It is the highest and most extensive highland in the world and exerts a huge influence on regional and global climate and hydrology through dynamic, mechani-cal and thermal forcing mechanisms. The headwater areas of many major rivers in the eastern part of Asia are located in the TP. Because of this, surface conditions over the TP have always been an important research topic in Earth science. Over the past several decades, significant progress has been achieved in under-standing the conditions of the TP’s surface and climate, through both observational and theoretical research. Meanwhile, new scientific problems have been identified and require further in-depth study. The purpose of the workshop was to bring together professionals in different scientific disciplines from around the world to exchange ideas and research findings to broaden un-derstanding, bridge existing knowledge gaps in TP scientific research and foster interdisciplinary collaboration.
The meeting was a great success with more than 230 partici-pants and 20 volunteers from 12 countries, including China, India, Japan, Nepal, The Netherlands and the United States. There were three plenary sessions, nine parallel sessions, post-er sessions and many inspiring presentations on the latest achievements in TP multi-disciplinary research. The workshop was organized by the Third Pole Environment (TPE) Project; the Institute of Tibetan Plateau Research, Chinese Academy of Sciences (ITPCAS); and the University of California at Los Angeles (UCLA). The American Geophysical Union, the National Natural Science Foundation of China, the U.S. Na-tional Science Foundation were among the 14 organizations that sponsored this workshop.
Overarching themes of the meeting included: (1) character-istics of atmospheric processes, energy and hydrological cy-cles and other physical processes over the TP and impacts of their interactions on the monsoon system; (2) applications of ground measurements, proxy records (ice core, lake sediment) and stable isotopes, as well as remote sensing in analyzing and understanding land surface multi-sphere processes; (3) param-eterization of surface processes over the TP and its applica-tions in regional climate predictions and evaluation of climate
models’ performances over the TP; (4) aerosol-cloud-radiation interactions over the TP and their climate impact; (5)ecosys-tem dynamics, climate change and anthropogenic impact on the TP; (6) changing cryosphere and the resulting hydrologi-cal response; and (7) paleo-environment of the TP.
Eleven plenary keynote speeches reviewed the latest research on the TP climate and environment. Several of these employed various proxy records. Lonnie Thompson of Ohio State Uni-versity presented changes in the climate that have been docu-mented in ice core records from TP glaciers. These indicate that the recent warming across the TP, which has been am-plified at higher elevations, is greater than during the “medi-eval climate anomaly” and is comparable to the interstadials or warmer periods of the last glacial cycle. The presentation by Tandong Yao of ITPCAS on glacier melt and multi-sphere in-teractions showed a more intensified water cycle within the TP. Records of stable water isotopes in precipitation and ice cores have been employed to identify and confirm different climate and circulation features over the TP. The figure on the next page shows the TP climate features and the observed climate and environmental changes over the past several decades. Based on the paleo record in the Qinghai Lake and its environs, Fahu Chen of Lanzhou University discussed Holocene moisture and East Asian summer monsoon evolution in the northeastern TP and showed that the East Asian Summer Monsoon (EASM) reached its maximum during the middle rather than early Holocene. The evolution of the EASM at the paleo scale was mainly controlled by northern hemisphere summer insolation and modulated by melted water since the last glacial period.
Dennis Lettenmaier of UCLA spoke on recent progress in modeling cold seasons and mountain land surface hydrologi-cal processes. He showed that for some of the key processes, modeling worked reasonably well when local observations were available, and noted that upscaling over large areas was a significant challenge. Yongkang Xue of UCLA reviewed the progress in TP land-atmosphere interaction modeling studies and suggested a new mechanism to link Tibetan surface tem-perature anomalies in the Spring to the summer drought and floods in East Asia. William Lau of the University of Maryland at College Park presented the Tibetan anticyclone, the Asian tropopause aerosol layer (ATAL) and transport processes in the upper troposphere and lower stratosphere (UTLS). He showed that when aerosols are transported into the UTLS, the atmo-spheric constituents are capped by the tropopause inversion layer and advected, forming the ATAL. The ATAL is modu-lated by UTLS transport processes, which undergo intrinsic monsoon intraseasonal oscillations with 20–30 day quasi-periodicity, coupled to tropospheric monsoon dynamics and diabatic heating processes.
Several presentations focused on the characteristics of atmo-spheric processes. Toshio Koike of the University of Tokyo presented regional and local structures of atmospheric heating over the TP using radiosonde data and a land data assimilation system, and identified three major types of heating (sensible heat, latent heat and horizontal advection). Each type of heat-ing dominated different vertical atmospheric layers. Deliang
25November 2016
Three modes of the modern westerlies-monsoon interaction system and how they effect land surface processes over the TP. (a,b) Based on large-scale precipitation stable oxygen isotope observation data since the 1990s, three modes of the modern westerlies-monsoon interaction system were identified. These are the Indian monsoon mode in southern TP (left column in Panel b), westerlies mode in northern TP (middle column in Panel b) and transition mode in central TP (right column in Panel b). (c-f) These three modes affect the TP environment as they mark glaciers (c), lakes (f), ecosystems (e) and precipitation (d) with distinctive regional features. The largest glaciers retreat in the monsoon mode-dominated southern TP, and had retreated the least or advanced slightly in the westerlies mode-dominated northwestern TP over the past 30 years. The area of lakes is reduced in the Yaluzhangbu River Basin in southern TP whereas, it became significantly larger on the Changtang Plateau in northern TP during 1976–2010. The date when the vegetation greens up over the TP also varies spatially, with plants in northeastern TP experiencing an earlier green-up while those in southwest were later in the last decade. Precipitation for 1979–2010 shows an increasing trend in the monsoon mode-dominated region and decreasing trend in the westerlies mode-dominated region, respectively. Figures are modified based on Yao et al. (2012, 2013), Lei et al (2014) and Shen et al. (2015).
26 November 2016
Chen of the University of Gothenburg showed that terrestrial sources provide more than 69% of the moisture for TP pre-cipitation, while the oceans to the west and south provided more than 21% of the total moisture supply. The precipita-tion-recycling ratio in the TP from 1979 to 2013 increased significantly, which suggests an intensified local hydrological cycle. Renhe Zhang of the Chinese Academy of Meteorological Sciences demonstrated the effect of 10–20 day intraseasonal oscillation on the vortices moving off the TP. This movement is accompanied by water vapor convergence, ascending motion and condensation latent heating, which provide favorable con-ditions for producing eastward movement of TP vortices.
Volker Mosbrugger of the Senckenberg Nature Research So-ciety presented the interactions between vegetation, climate and humans, and proposed a systemic approach for a better understanding of TP surface and climate dynamics. Peng Cui of the Institute of Mountain Hazards and Environment, CAS, presented a risk analysis of hazards in high mountain areas. He described the impacts of climate change on these hazards and demonstrated that valleys with increasing population density were coincident with the risk areas of mountain hazards.
Nine parallel sessions covered some of the most important TP research subjects: (1) TPE; (2) Understanding atmospheric processes over TP at regional and global scales; (3) The hydro-logical cycle and water resources; (4) Cryosphere change and hydrological response in the TP; (5) Modeling TP atmospher-ic and surface processes; (6) Aerosols over the TP and their climate impact; (7) Remote sensing of land-surface processes over the TP; (8) Paleo-environment at the TP; and (9) Impact of climate change on ecosystems over the TP.
At the half-day plenary session, the chairs summarized problems that had been resolved based on session presentations, outlined products and data sets that have been developed and reviewed new research opportunities and possible collaborations. Fu-ture research directions, publications of the presentations, data sharing, upcoming meetings and research networking were also discussed. Peter van Oevelen, Director of the International GEWEX Project Office, expressed the support of GEWEX for the workshop and related research and outlined future areas of collaboration between the TPE and GEWEX commmunities, particularly in the context of the WCRP Grand Challenge on Water for the Food Baskets of the World and the GEWEX Regional Hydroclimatology Projects. The workshop program and abstracts are available at: http://xining2016.tpe.ac.cn/ and https://easmea-outreach.geog.ucla.edu/xining2016/.
References
Lei, Y., et al., 2014. Response of inland lake dynamics over the Tibetan Plateau to climate change. Clim. Change, 125(2), 281–290.
Shen, M. G., et al., 2015. Precipitation impacts on vegetation spring phe-nology on the Tibetan Plateau. Glob. Change Biol., 21:3647–3656.
Yao, T., et al., 2012. Different glacier status with atmospheric circulations in Tibetan Plateau and surroundings. Nat. Clim. Change, 2(9), 663–667.
Yao, T., et al., 2013. A review of climatic controls on d18O in precipita-tion over the Tibetan Plateau: Observations and simulations. Rev. Geophys., 51(4), 525–548.
Andreas F. Prein1, Roy Rasmussen1 and Graeme Stephens2
1National Center for Atmospheric Research, Boulder, Colorado, USA; 2Jet Propulsion Laboratory, Pasadena, California, USA
Convection-permitting models (CPMs) typically have less than or equal to 4 km horizontal grid spacing, which allows explicit simulation of deep convection without using convec-tion parameterization schemes. The workshop was held to foster communication and collaboration within the rapidly growing CPM community. Its primary focus was on the ma-jor challenges and future research strategies in this area. More than 70 scientists from 13 countries participated, representing a large cross section of the climate and weather community.
The two-and-a-half day workshop featured six keynote talks, 27 oral and 44 poster presentations. The book of abstracts and recordings from presentations and posters can be down-loaded from the workshop website at: https://ral.ucar.edu/events/2016/cpcm. The workshop covered five main topics: (1) CPM evaluation and added value, (2) climate change as-sessments with CPMs, (3) land-atmosphere interactions in CPMs, (4) observational data sets for CPM evaluation, and (5) CPM for simulating tropical phenomena.
Contributions to the evaluation and added value of CPMs focused on assessing the quality of CPM simulations to rep-licating the current climate in different regions and quantify-ing their benefits compared to large-scale models (LSMs) that parameterize convection. The ultimate goal of this assessment was to identify phenomena that can be better represented in CPMs than in LSMs. The more accurate representation of processes in CPMs enhances the confidence in their future cli-mate projections. Finding shortcomings in CPM simulations can help to advance their development.
A well-established area of added value in CPM simulations is the improvement of the diurnal cycle of convective precipi-tation. A major aim of the community is to investigate the representation of processes within CPMs. Traditional evalua-tion methods used in climate model evaluation do not allow the analysis of modeled processes. Therefore, new evaluation methods were introduced that can increase our insights into the model performance on a process level. For example, storm tracking algorithms allows one to identify and follow storms over time (e.g., precipitating storms or clouds).
A major challenge in CPMs is the treatment of turbulence, since traditional approximations (i.e., Reynolds averaging) are not valid on the kilometer scale and CPM grid spacings are too coarse to explicitly resolve turbulence. Modeling in this “gray zone” is affecting the quality of CPMs and might influ-
27November 2016
ence the reliability of future climate projections. A number of studies investigated the dependence of the model performance on the applied grid spacing, the influence of different plan-etary boundary layer schemes and the role of parameterizing deep convection with traditional and scale-aware convection parameterization schemes at convection-permitting scales. The model results often show strong sensitivities to these changes that depend on the region and model, which calls for a more detailed and coordinated analysis.
Studies that analyzed climate change projections in CPM simulations frequently focused on changes in extreme precipi-tation, especially on sub-daily timescales. There is a large con-sensus between the individual studies that sub-daily extreme precipitation increases with climate change and that environ-mental conditions will be more favorable for extreme convec-tive events over the eastern U.S. Studies that investigated the changes of sub-daily extreme events dependent on future tem-perature increases show intensifications of extremes that are close to 7% K–1, which is in line with the Clausius-Clapeyron relationship that describes the dependence of saturation vapor pressure on temperature. Studies that focused on the climate change effects on snowpack in the Western U.S. showed sub-stantial losses in future snowpack and snow cover, especially at lower elevations where snow is typically falling close to the melting level. The loss of low elevation snow cover in a warmer climate leads to stronger than average warming in springtime due to the snow-albedo feedback.
A large number of papers were presented on the use of the pseudo-global warming (PGW; Schär et al., 1996) approach for assessing climate change effects with CPMs. In the PGW approach, a climate change perturbation, which is typically derived from global climate model projections, is added to the current climate lateral boundary conditions that are typically taken from reanalyses. The climate change perturbation pri-
Participants at the GEWEX Convection-Permitting Climate Modeling Workshop.
marily affects very large scales while weather patterns do not change. This means that the PGW approach chiefly provides a thermodynamic response to climate change. The advantage of the PGW method for climate change assessments is that effects from internal climate variabilities are minimized and CPM simulations are not affected by biases in the lateral boundary conditions. However, potential changes in large-scale weather patterns cannot be assessed.
A few presentations focused on the assessment of uncertain-ties in CPM simulations by investigating ensembles of climate change projections. Their aim was to explore how large-scale uncertainties in GCMs relate to uncertainties on local scales and how sensitive the model results are to model grid spacing and model physics. Most CPM climate change assessments compare a single deterministic future and current climate simulation, and therefore cannot assess uncertainties related to internal variability, model setup, the driving global climate model or the emission pathway.
Another area in which CPMs have been shown to add value to coarser-resolution models is the simulation of land-atmo-sphere interactions. Large benefits can be achieved in simulat-ing snowpack dynamics in mountainous regions. This is due to a more realistic simulation of terrain and the representation of steeper slopes, which is important for the correct simulation of precipitation amplifications. Coupling more realistic land- surface models can lead to improvements of snowpack and snow-cover simulations. The correct treatment of canopies in the land-surface model was highlighted because of the strong effect of canopies on the surface albedo (Liu et al., 2016). The evaluation of model performance in simulating snow is challenging because of the scarcity of observations in moun-tainous regions and observational uncertainties in measuring snow. Satellite products can provide novel information about snow cover for model evaluations. In summer, CPMs might
28 November 2016
have a stronger coupling between the land surface and the atmosphere. LSMs tend to produce more low, intense, high frequency and large spread precipitation than CPMs, which leads to a lower coupling strength.
Throughout the workshop, the importance of high-quality, high-resolution observational data sets was emphasized. The quantification of observational uncertainties is important to evaluate the significance of model biases. A promising devel-opment is the generation of probabilistic observational data sets that allows the assessment of uncertainties by providing an ensemble of observations that samples uncertainties aris-ing from sampling or measurement errors (e.g., Newman et al., 2015). Another promising development is the collection of hourly precipitation data on a global scale in the “Intel-ligent Use of Climate Models for Adaptation to Non-Sta-tionary Hydrological Extremes” (INTENSE) Project. This effort will benefit model evaluation especially in data poor regions (e.g., the tropics, Africa). Satellite products are espe-cially attractive because of their close-to-global coverage and relatively high spatiotemporal resolution. However, satellites cannot provide measurements on the resolution of CPMs, which prevents the evaluation of local-scale features. Due to the large number of variables that are derived from satellite observations, they can be of particular value for process-ori-ented model evaluations.
A large number of studies focused on the application of CPMs in tropical regions and for tropical phenomena such as tropical cyclones. CPMs are able to improve the simula-tion of tropical cyclone dynamics, including eye wall features, wind speeds and minimum pressure that cannot be captured by coarse resolution models. One goal of global simulations with convection-permitting resolution in the tropics is the improvement of mid-latitudes weather forecasting capabili-ties due to teleconnections. In particular, we are hopeful that the improved simulation of the Madden-Julian Oscillation (MJO)will overcome long-standing biases in LSM forecasts. An idealized study highlighted the difference in represent-ing tropical precipitation with a CPM compared to LSMs. CPM results cannot be reproduced by perturbing the phys-ics in LSM simulations and CPM results were shown to be less sensitive to perturbing the model physics than those of LSMs.
Discussions and Next StepsAlthough impressive progress in the area of CPM simulations was presented, it remains challenging to assess the robust-ness of the results due to the large variety of model setups, evaluation methods, domain sizes and time periods. The most commonly analyzed variable is precipitation with relatively high spatiotemporal resolution. In particular, precipitation ex-tremes are a main focus of research since CPMs have proven to provide significant improvements over large-scale models in this area. Future CPM studies should expand their focus to processes that have so far gone largely unexplored, such as local wind systems, snowpack dynamics and hydrology, land-atmosphere interactions, evapotranspiration and the represen-tation of clouds and radiation.
The main benefits of CPM simulations include:
• Improved representation of physical processes that re-sults in reduced uncertainties (e.g., convective storms, gravity waves, terrain)
• Simulation of impact relevant processes and scales (e.g., extreme events such as mesoscale convective systems or tropical cyclones)
• Better representation of hydrological processes (e.g., snowpack, orographic precipitation)
One of the most significant challenges with CPMs is the high demand for computational resources and the large volume of data that constrains CPM simulations to short time periods and complicates model analysis and the exchange of data. The significant computational resources required often inhibit the assessment of uncertainties and the reliability of CPM results. Additionally, missing high resolution observational data sets are limiting the ability to assess the performance of CPM sim-ulations and their further development. The correct treatment of model physics such as turbulence, radiation or microphys-ics is a challenge since the physics used in CPM simulations were developed for LSMs that parameterize deep convection. Further challenges include the representation of land-surface processes, simulation of shallow convection, the impact of ver-tical resolution and model top and the limited support for regional climate model developments.
Four approaches to convection-permitting modeling: (a) super-parameterizations, (b) variable resolution modeling, (c) regional climate modeling and (d) global convection-permitting modeling (Prein et al., 2015).
29November 2016
Collaborations and community building were identified as the most promising pathways to efficiently identify and re-solve these challenges. Working in a community helps to avoid duplication of work, and a coordinated effort for CPM simulations will make simulations more comparable and en-ables the assessment of uncertainties. A community standard for common data formats and metrics would significantly im-prove the capability to intercompare model results. A strong CPM community might also help to generate funding op-portunities for CPM research and will facilitate collaboration with other communities, such as hydrology, meteorology or stakeholder communities. The formulation of clear objectives such as simulating convection in the central U.S., modeling the MJO or intercomparing different approaches to convec-tion-permitting modeling (see figure on previous page) will be helpful for efficient collaborations.
In the last session, potential next steps and future plans were discussed, and it was agreed that the CPM community should reach out to the hydrology community and organize a joint workshop in 2017. We will also connect with other GEWEX and WCRP activities and initiatives launched under the Coordinated Regional Climate Downscaling Experiment (CORDEX) Flagship Pilot Study framework, particularly the initiative on “Convective phenomena at high resolution over Europe and the Mediterranean,” led by Stefan Sobo-lowski and Erica Coppola. To foster communication within the CPM community, an online blog will be created to ac-commodate discussions and exchanges of novel results. We already have an active email list to efficiently share informa-tion within the community. Furthermore, a special issue on convection-permitting modeling in the international journal Climate Dynamics will soon be open for submissions. Based on the success of this workshop, we are planning to organize a successor workshop in 2018 and will host sessions at large atmospheric science conferences, such as the American Geo-physical Union, the European Geophysical Union and the American Meteorological Society general assemblies.
References
Liu, C., K. Ikeda, R. Rasmussen, M. Barlage, A. J. Newman, A. F. Prein, F. Chen, L. Chen, M. Clark, A. Dai and J. Dudhia, 2016. Continental-scale convection-permitting modeling of the current and future climate of North America. Clim. Dynam., pp. 1–25.
Newman, A., M. Clark, J. Craig, B. Nijssen, A. Wood, E. Gutmann, N. Mizukami, L. Brekke and J. Arnold, 2015. Development of an En-semble Gridded Hydrometeorological Forcing Data Set over the Con-tiguous U.S. In EGU General Assembly Conference Abstracts (Vol. 17, p. 14249).
Schär, C., C. Frei, D. Lüthi and H. C. Davies, 1996. Surrogate climate change scenarios for regional climate models. Geophys. Res. Lett., 23(6), pp. 669–672.
Prein, A. F., W. Langhans, G. Fosser, A. Ferrone, N. Ban, K. Goergen, M. Keller, M. Tölle, O. Gutjahr, F. Feser and E. Brisson, 2015. A review on regional convection permitting climate modeling: Demonstrations, pros-pects, and challenges. Rev. Geophys., 53(2), pp. 323–361.
Third Satellite Soil Moisture Validation and Application Workshop
21–22 September 2016New York City, New York, USA
Thomas Jackson1, Wolfgang Wagner2, Matthias Drusch3, Richard de Jeu4, Jared Entin5, Susanne Mecklenburg3, Lothar Schüller6, John Qu7, Robert Stefanski8, Dara Entekhabi9 and Yann Kerr10
1US Department of Agriculture (USDA), Beltsville, Maryland, USA; 2Vienna University of Technology (TU Wien), Vienna, Austria; 3European Space Agency (ESA), Noordwijk, The Netherlands; 4VanderSat, Noordwijk, The Netherlands; 5National Aeronautics and Space Administration (NASA), Washington, DC, USA; 6European Organization for the Ex-ploitation of Meteorological Satellites (EUMETSAT), Darm-stadt, Germany; 7George Mason University, Fairfax, Virginia, USA; 8World Meteorological Organization (WMO), Geneva, Switzerland; 9Massachusetts Institute of Technology, Cam-bridge, Massachusetts, USA; 10Centre d’Etudes Spatiales de la Biosphère (CESBIO), Toulouse, France
The objective of this workshop series is to discuss and reconcile methodological advances in the validation and application of global satellite soil moisture data. These workshops are unique in that they bring together developers and users of soil mois-ture data sets derived from both passive and active microwave satellite missions [e.g., Soil Moisture Active Passive (SMAP), Soil Moisture Ocean Salinity (SMOS) Mission, Advanced Scatterometer (ASCAT), Advanced Microwave Scanning Ra-diometer 2 (AMSR2), Sentinel-1 and other legacy missions]. The third workshop was jointly organized by NASA, USDA, VanderSat and TU Wien and was supported and co-sponsored by ESA, EUMETSAT, WMO, GEWEX, the Global Climate Observing System (GCOS) Terrestrial Observation Panel for Climate (TOPC) and the Committee on Earth Observation Satellites (CEOS). There were over a hundred participants from countries from around the world, including Argentina, Austria, Australia, Brazil, Canada, China, Finland, France, Germany, Italy, Kuwait, Spain, The Netherlands and the U.S. The work-shop opened with a tribute to Manfred Owe, summarizing his contributions to soil moisture remote sensing.Presentations were solicited that addressed the following re-search questions: (1) what is the quality of current satellite products and what products can we expect in the near future? (2) who is using satellite soil moisture data and for what pur-pose? (3) what are the best practices in validating soil moisture products? (4) what are the main limitations of satellite soil moisture data from a user’s perspective? and (5) what is the future of satellite-based soil moisture remote sensing?Some of these questions were addressed by contributed pre-sentations, and others through focused discussion sessions. Overviews of the validation activities of the SMOS, SMAP and EUMESAT satellite program were provided, which gave context for the more detailed presentations. A number of pre-
30 November 2016
sentations dealt with the results of validation against in situ observations, as well as the intercomparisons between differ-ent products. In addition to the individual satellite products, there were presentations on the multiple satellite product de-veloped under the ESA Climate Change Initiative. One of the highlights of this workshop was that despite having operated for only one year, the quality of the SMAP data products is already very high and can be expected to further improve in the coming years. New products are ready for production that will enhance the spatial information (See figure below).
Validation metrics and alternative uncertainty characteriza-tion methods were covered by several presentations. These contributions showed that, in particular, triple collocation is increasingly being used for estimating unbiased root-mean-square error, correlation and signal-to-noise ratio of satellite soil moisture data by comparing a data triplet (preferably from satellite, model and in situ) over both dense and sparse in situ soil moisture networks. This block of presentations was fol-lowed by data assimilation and downscaling studies. There are numerous efforts underway to provide data products at higher spatial resolutions through the use of downscaling techniques. Alternatives presented focused on using passive microwave ob-servations with active microwave, as well as visible and infrared information. The presentations on soil moisture data applica-tions included papers that dealt with precipitation, droughts, food security and crop yield.
Two presentations highlighted new opportunities, the first on the Chinese Water Cycle Observing Mission (WCOM) sched-
uled for launch as early as 2020. This satellite would provide continuity of L-Band soil moisture products as well as those based on AMSR-like multiple frequency passive observations. The second opportunity is an effort supported by WMO to enhance the availability of soil moisture data products through enhanced in situ observations and modeling.
The workshop concluded with discussions of three important issues facing the soil moisture remote sensing community: (1)validation standards, (2) in situ soil moisture networks, and (3) the future of satellite-based observing systems.
Validation StandardsAn impetus for the discussion of standards comes from the CEOS Land Product Validation Group that is attempting to develop good-practices documents for all land variables, in-cluding soil moisture. The scope of such a document should include all phases of validation and offer guidance on instru-ments, methodologies and metrics. It is anticipated that this effort will take considerable time. As a starting point, it was proposed that this group write a paper summarizing latest ex-periences using triple collocation, data assimilation and other novel uncertainty characterization methods, which may then serve as input for the good-practices document.
In Situ Soil Moisture NetworksThe discussion session on the in situ networks noted the sig-nificantly improved availability of in situ soil moisture data for scientific purposes. Yet, most of the in situ data come from North America, Europe and Australia, while in many
An example of the additional spatial detail provided by the SMAP enhanced soil moisture product as compared to the standard product during the recent Louisiana (USA) flood event. The new product is posted to a 9-km grid, as opposed to the 36-km grid used with the baseline product. This new product will be available in December 2016 (Image source: Steven Chan, JPL).
31November 2016
other regions no data are being collected, or data are not be-ing shared with the scientific community. The call to promote (e.g., through WMO) the sharing of data and the establish-ment of new in situ networks in poorly covered regions, such as Africa and South America, was made. It was also noted that the International Soil Moisture Network (ISMN; https://ismn.geo.tuwien.ac.at/) is widely used by the soil moisture commu-nity. It was hence recommended to continue this activity, but the question of where long-term funding could come from remaines open (currently, ISMN activities are funded by ESA as a contribution to CEOS).
Future of Satellite-Based Observing SystemsBeginning in the 1980s, soil moisture estimates were derived from satellite observing systems not designed for this purpose. Nevertheless, the U.S. Defense Meteorological Satellite Pro-gram (DMSP) Special Sensor Microwave Imager/Sounder (SSMI/S), MetOp/ASCAT and Aqua/AMSR have been used successfully to derive global data sets. More recently, these ef-forts were enhanced by the SMOS and SMAP satellite mis-sions, which were specifically designed to provide measure-ments of soil moisture. While continuity is likely for active and higher frequency passive microwave measurements, thus far nothing is planned for the continuity of passive microwave L-Band measurements, which are expected to operate until at least 2020. It should be noted that the support for continu-ity of instruments like Sentinel-1, ASCAT and AMSR is not driven by the soil moisture community or hydrological ap-plications, but by the oceanographic community and applica-tions over the ocean.
The results presented at the workshop clearly indicated that the measurements and soil moisture products originating from the various satellite missions are highly complemen-tary in their spatial and temporal coverage, resolutions and product accuracy. As a general statement, radar measurements (e.g., from Sentinel-1) excel with respect to their high spatial resolution but are strongly limited in temporal coverage and resolution and product accuracy. Measurements from SMOS, SMAP, AMSR and ASCAT are comparable in spatial and tem-poral coverage and resolutions.
The soil moisture product accuracies and characteristics in-dicate that the most comprehensive soil moisture data sets will be obtained by combining information from the different sensors. Only a constellation of satellites providing active and passive microwave measurements at frequencies from L- to C-Band will ensure that the the following key soil moisture infor-mation requirements expressed by the different end user com-munities can be met: (1) high temporal sampling representing the diurnal cycle for hydrological applications; (2) high spatial resolution resolving individual fields for agricultural applica-tions; and (3) consistently high absolute accuracy at the global scale for hydro-meteorology and climate applications.
The workshop participants recommended that instruments taking passive microwave L-Band measurements be contin-ued in new constellations of satellites (i.e., complementing the ASCAT and AMSR series, and the Sentinel-1s.)
Annual Meeting of the GEWEX Hydroclimatology Panel (GHP)
3–5 October 2016Gif-sur-Yvette, France
Jason Evans1, Jan Polcher2 and Joan Cuxart3
1Climate Change Research Centre, School of Biological, Earth and Environmental Sciences, University of New South Wales, Sydney, Australia; 2Laboratoire de Météorologie Dy-namique du CNRS/IPSL, Paris, France; 3Departament de Física, Universitat de les illes Balears, Mallorca, Spain
The GEWEX Hydroclimatology Panel (GHP) meeting was hosted by Jan Polcher at the Centre National de la Recherche Scientifique (CNRS) campus, part of the Université Paris-Sa-clay. The goal of the 3-day meeting was to evaluate ongoing and planned GHP activities to ensure that they contribute ef-fectively to the leading role that GEWEX plays in the regional hydrological sciences and related modeling activities. The meet-ing was co-located with the Global Land/Atmosphere System Study (GLASS) Panel meeting and had the additional aim of exploring collaborations between GHP and GLASS. Updates were provided for each element of the two main components of GHP—the Regional Hydroclimate Projects (RHPs) and the research topic-based Crosscutting Projects.
Regional Hydroclimate Projects (RHPs)The presentations by the project managers of the RHPs pro-vided updates on their recent accomplishments and future plans as well as highlighting the contributions that each RHP is making to the GEWEX Science Questions (GSQs).
The Hydrological Cycle in the Mediterranean Experiment (HyMeX) passed its mid-term review and has established a new focus on scale continuum in object-oriented studies, as well as more integrated transdisciplinary approaches. Key is-sues with societal impact include heavy precipitation, flash flooding and droughts. If the next phase of HyMeX achieves as much as the first, it will certainly have transformed our knowledge of water and climate issues in the Mediterranean Basin. The Changing Cold Regions Network (CCRN) RHP has been progressing well with many research achievements in the last year. Of particular note is the awarding of the “Global Water Futures” Project, by far the largest of its kind ever in Canada, which will allow significant continuation and expan-sion of the work currently underway within the RHP.
The Hydrology of Lake Victoria Basin (HyVic) and the Aus-tralian Energy and Water Exchanges (OzEWEX) are the two RHPs in the Initiating Phase. HyVic is underway as the first major funded project of HyCRISTAL (Integrating Hydro-Climate Science into Policy Decisions for Climate-Resilient Infrastructure and Livelihoods in East Africa), led by John Marsham, starting this past year. Future progress will be ac-celerated by a now-established coordination mechanism and hopefully the success of further grant proposals. OzEWEX has
32 November 2016
experienced some turbulent times with the Commonwealth Scientific and Industrial Research Organization (CSIRO) firing large numbers of scientists in their climate and water divisions, while the Australian Research Council has funded a Centre of Excellence for climate extremes. Despite these changes the annual workshop was again a success, along with the release of a special issue of Climatic Change on Natural Climatic Hazards in Australia, and the first Summer Institute (a 6-week long research intensive summer school for elite stu-dents in water and climate).
A number of potential new RHPs were discussed, includ-ing Baltic Earth, which has established itself as the successor to BALTEX and written a new science plan for the Baltic Sea Region around the six WCRP Grand Challenges. Bal-tic Earth has been accepted as an Initiating Phase RHP. We welcome it to the family and look forward to helping them with their progress towards addressing the Grand Challeng-es in the coming years. The Pannonian Basin Experiment (PannEx) held a second workshop in Budapest, Hungary. A white paper on the scientific challenges for the region has been written and circulated and will form a basis for discus-sions at the follow-up workshop to be held in March 2017 in Romania. The group has made great strides in bringing the community together and is on-track to apply for Initiating RHP status in 2017.
Crosscutting ProjectsThe established Crosscutting Projects focused on sub-daily precipitation (INTENSE), the International Network for Alpine Catchment Hydrology (INARCH) and precipitation near zero degrees Celsius all made progress during the year. This generally included holding workshops, collecting data and starting new research activities. A number of potential crosscutting activities have moved towards project status with one crosscut focused on the human management of the water cycle holding a workshop just before the GHP meeting.
GHP’s Global Data Centers, the Global Runoff Data Cen-ter (GRDC) and Global Precipitation Climatology Center (GPCC), also presented their activities over the past year with encouraging connections made with GEWEX projects.
Wrap UpOverall the progress of the established RHPs and Crosscutting Projects was very good and is an indication of a productive year ahead for GHP-related science. The continued develop-ment of initiating and potential new projects is also very en-couraging for the future vitality of GHP. As always, sugges-tions for new initiatives are welcome. The joint discussions with GLASS highlighted a number of activities with potential for collaboration, with the initial focus being the development of water management in the water cycle. This would become a crosscutting activity jointly overseen by both Panels. The next GHP meeting is planned for October 2017 in Katmandu, Nepal and will include a joint session with the Third Pole En-vironment (TPE) Project. This meeting will explore the poten-tial for TPE to evolve into a future RHP.
GEWEX NEWSPublished by the International GEWEX Project Office
Peter J. van Oevelen, DirectorDawn P. Erlich, Editor
Shannon F. Macken, Assistant Editor
International GEWEX Project Officec/o USRA
425 3rd Street SW, Suite 940Washington, DC 20024 USA