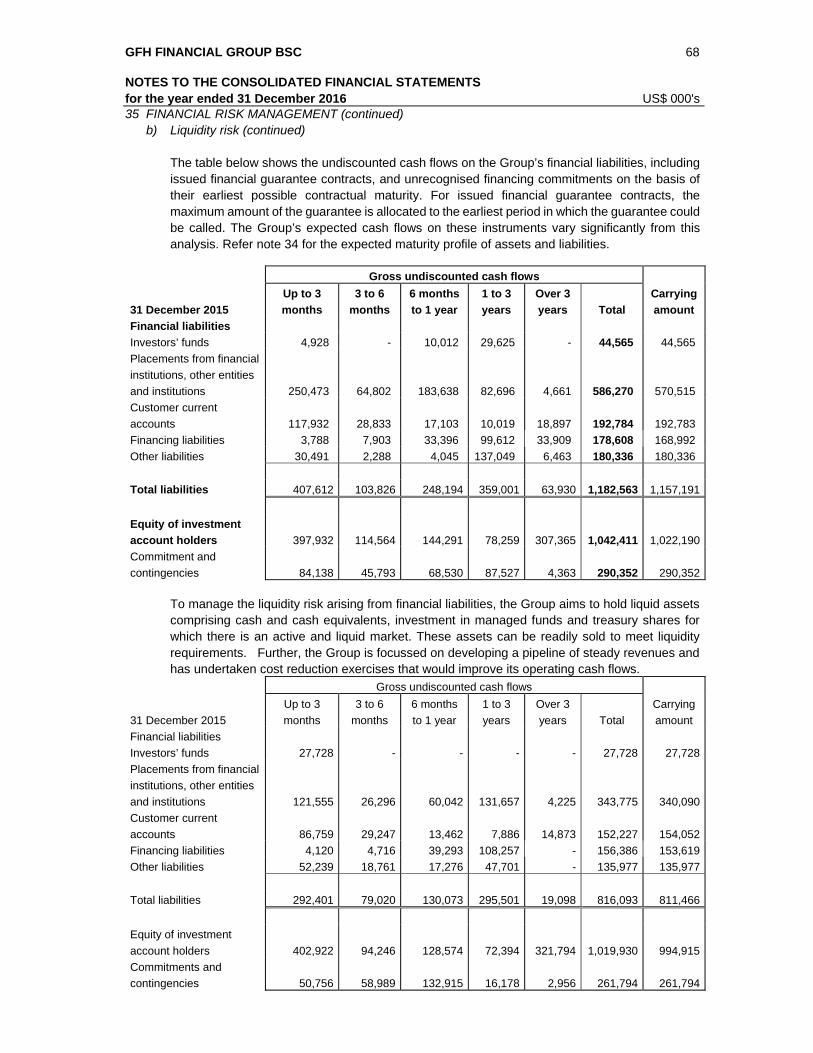
Commercial registration : 44136 (registered with Central Bank of Bahrain as a Islamic wholesale investment Bank) Registered Office : Bahrain Financial Harbour Office 2901, 29 th Floor, Building 1398, East Tower, Block 346, Road 4626 Manama, Kingdom of Bahrain Telephone +973 17538538 Directors : Ahmed Al Mutawa, Chairman Mosabah Saif Al Mautairy, Vice Chairman Bashar Muhammad Almutawa Mohammed Ali Talib Sheikh Mohammed Bin Duaij Al Khalifa Khalid Alkhazraji Faisal Abdulla Fouad Yousef Ibrahim AlGhanim Jassim AlSeddiqi (w.e.f 17 April 2016) Hisham Alrayes (w.e.f. 17 April 2016) Chief Executive Offcer : Hisham Alrayes Auditors : KPMG Fakhro GFH Financial Group BSC CONSOLIDATED FINANCIAL STATEMENTS 31 DECEMBER 2016
Transcript
Commercial registration : 44136 (registered with Central Bank of Bahrain as a Islamic wholesale investment Bank)
Registered Office : Bahrain Financial Harbour Office 2901, 29th Floor, Building 1398, East Tower, Block 346, Road 4626 Manama, Kingdom of Bahrain Telephone +973 17538538
Directors : Ahmed Al Mutawa, Chairman Mosabah Saif Al Mautairy, Vice Chairman Bashar Muhammad Almutawa Mohammed Ali TalibSheikh Mohammed Bin Duaij Al Khalifa Khalid Alkhazraji Faisal Abdulla Fouad Yousef Ibrahim AlGhanim Jassim AlSeddiqi (w.e.f 17 April 2016) Hisham Alrayes (w.e.f. 17 April 2016)
Chief Executive Offcer : Hisham Alrayes
Auditors : KPMG Fakhro
GFH Financial Group BSC
CONSOLIDATED FINANCIAL STATEMENTS
31 DECEMBER 2016
GFH Financial Group BSC
CONSOLIDATED FINANCIAL STATEMENTS for the year ended 31 December 2016 CONTENTS Page Chairman’s report 1-5 Independent auditors’ report to the shareholders 6 Consolidated financial statements Consolidated statement of financial position 7 Consolidated income statement 8 Consolidated statement of changes in owners’ equity 9-10 Consolidated statement of cash flows 11 Consolidated statement of changes in restricted investment accounts 12 Consolidated statement of sources and uses of zakah and charity fund 13 Notes to the consolidated financial statements 14-74
GFH Financial Group BSC 1
CHAIRMAN’S REPORT for the year ended 31 December 2016 IN THE NAME OF ALLAH, THE BENEFICIENT, THE MERCIFUL, PRAYERS AND PEACE BE UPON THE LAST APOSTLE AND MESSENGER, OUR PROPHET MOHAMMED. Dear Shareholders, On behalf of the Board of Directors of GFH, I am pleased to present the Group's financial results for the fiscal year ended 31st December 2016. Realizing the benefits of our transformation, the year was once again marked by greater levels of diversification and value creation as well as enhanced financial stability and profitability. We are especially proud of our sustained progress in light of a challenging macroeconomic environment, which continues to impact both the MENA region as well as the global markets in which we are active. We attribute our ability to continue to effectively invest, grow and prosper to a strong and disciplined strategy aimed at achieving steady results whatever market conditions or challenges may arise. At the core of this strategy has been a focus on the expansion of our business lines and, thus, revenue streams as well as a keen commitment to extracting value from our existing portfolio of investments across sectors and asset classes. As a result, our performance in 2016 saw GFH deliver a consolidated net profit of US$233.05 million versus US$12.02 million in 2015, an increase of 1839%. Importantly, net profits before provisions were an even more significant US$454.16 million for 2016. Operationally, we also took steps to further strengthen the Group throughout the year. This included the further building of our human capital in key areas and in line with our ongoing diversification. Among our senior hires during the year were new heads at our GFH Capital and GFH Real Estate subsidiaries as well as a new head of Investment Management on the Group level. Asset Management Looking at our core business lines, GFH continued to build its asset portfolio with the completion, in late 2016, of our second acquisition of a US-based industrial real estate portfolio in a deal valued at US$58 million. The portfolio includes 11 income producing distribution, warehousing and industrial properties in the Midwest region of the US across three states. The portfolio is well diversified in terms of tenant base and location strengthening the portfolio’s performance. The portfolio also benefits from a regular cash flow stream resulting from long leases as well as strong single and multi-tenanted tenant base in the properties. With this acquisition, GFH has further strengthened its foothold in the US industrial real estate sector and better positioned itself to take advantage of the strong fundamentals supporting this growing market segment. Looking at the performance of our existing US$115 million portfolio of industrial real estate in the US, which includes 17 income-generating industrial, warehousing and distribution assets across six states, results were above budgets. Also benefiting from favorable demographics and other supporting trends returns for the year surpassed originally anticipated cash-on-cash yields validating our investment rationale and our overall view on this segment of the US real estate market. GFH’s US$48 million investment in Jeddah Mall, acquired in 2015, is performing satisfactorily in accordance with the plan. It continues to benefit from its attractive location in Jeddah and has seen other key progress including the notable addition of a LuLu Hypermarket to the mall’s tenants which will attract and drive further traffic to the mall. GFH’s residential portfolio in the US, acquired in 2014, is delivering higher than targeted distributions to our investors and an exit would be considered at an opportune time taking into consideration the robust market conditions in the US.
GFH Financial Group BSC 2
CHAIRMAN’S REPORT (continued) for the year ended 31 December 2016 We go into 2017 being optimistic about real estate as an asset class and continue to leverage our strong relationships with market participants in order to identify other medium to long term, income yielding opportunities across various markets and sectors within real estate both in the US and elsewhere that we believe can add value in the coming years.. Private Equity Our private equity arm also continued to make notable investments in 2016. Alongside Abu Dhabi Financial Group, we announced the establishment of ADCorp, the first Islamic financial institution at the Abu Dhabi Global Market. Focused on Corporate Finance, Wealth and Asset Management, ADCorp is being led by financial industry veteran Talal Al Zain, who is widely recognised as one of the region’s leading asset management executives. With this investment GFH continues to look for opportunities to maximise and capture the ongoing growth in Islamic investment and finance globally. We expect ADCorp to start operations in the first half of 2017. Building on our existing investments and success in regional education, we also made two additional investments in the regional education market during 2016. In October, we announced the launch of US$46 million investment in AMA International University, Bahrain, which comprises of a university as well as a school. AMA is a premier institution which focuses on providing quality education to local and international students in Bahrain. AMA University has a current enrollment of 5,550 students and AMA School has an enrollment of approximately 1,600 students. During the fourth quarter, we added the British School of Bahrain to our investment portfolio. The School, which has a strength of c. 2,400 students, has received an “Outstanding” ranking in Bahrain placing it among a select group of only five local educational institutions to have received such recognition. GFH’s existing investments in the regional education sector, made in 2014 and 2015, also continued to deliver solid performance and meet targeted cash dividends for our investors. GFH believes that positive demographics in the GCC underpin the defensive nature of the education sector and allow for the provision of steady cash flows and attractive returns for the Group and our investors. We will continue to evaluate and pursue additional profitable opportunities in education sector, where have now built a strong presence and track record for value creation. Another noteworthy transaction during 2016 was the Arab Petroleum Investments Corporation (APICORP)’s acquisition of a 30% shareholding in Falcon Cement, a GFH portfolio company. APICORP, created by Organization of Arab Petroleum Exporting Countries, is a key addition to the company’s shareholders and board and their investment provides additional resources to ensure Falcon continues to build on its market leading position and benefits from positive trends in building and real estate. We look forward to working with APICORP and developing this into a strategic business partnership for GFH. Commercial Banking Over the past year, our commercial banking activities also witnessed significant growth despite challenging market conditions resulting from ongoing global and regional economic difficulties and geopolitical uncertainty. Khaleeji Commercial Bank (KHCB), our commercial banking subsidiary, continued to deliver on its strategy, which has been focused on growing its share of the Bahrain Islamic banking market. Success towards this objective was tangible and, according to plan, resulted in the expansion of the Bank’s corporate and retail client base including its ability to attract and retain high net worth individuals. This growth was supported by the development of a more comprehensive range of high-quality Shari'a compliant banking products and solutions as well as a result of significant enhancements made in efficiency, service quality and technological innovation which will continue to be a focus in the year ahead.
GFH Financial Group BSC 3
CHAIRMAN’S REPORT (continued) for the year ended 31 December 2016 For the 2016 financial year, the Bank reported profits before impairments of US$30.67 million, representing an increase of 10.2% over 2015. It also continued impressive growth in its loan book, which rose 12% year-on-year to US$1.17 billion. Similarly, Customer Deposits grew by 32% to $1.7 billion, decreasing the Bank’s loan/deposit ratio from 81% to 69% year-on-year. Furthermore, in support of future growth and market expansion, KHCB adopted a conservative provisioning policy in 2016, setting aside US$35.76 million in impairments to guard against any potential drops in asset values as well as maintaining a strong overall capital adequacy ratio of 18% and satisfactory levels of liquidity. Real Estate Development During the year, GFH strengthened its real estate platform and ability to build value in this important business line in which we have long been pioneers. GFH Real Estate (GFH RE) was launched in 2016 as a dedicated entity that is now engaged in a range of project development and management activities. This includes the launch of its own direct development projects and the oversight of others associated with the Group, particularly in the UAE and Bahrain. Significant milestones were reached in our real estate activities and projects under development. We are particularly pleased with the re-commencement of construction work at Villamar, the landmark US$700 million residential and commercial complex spread over 35,900 square meters at the Bahrain Financial Harbour (BFH). After a period of inactivity, Gulf Holding Company, the project’s developer, announced the conclusion of a final Sukuk restructuring agreement with Al Rajhi Bank (the project financier) and GFH (the project sponsor). The agreement serves to effectively reschedule the project’s finances and officially re-launch works. This was a major achievement given Villamar’s iconic position on the Bahrain skyline. With the rescheduling of the project’s finances, the way is now paved towards swift completion of Phase 1 expected in 2018. Also at BFH, we made significant strides ahead on our Harbour Row and Harbour Walk project, a US$150 million mixed-use real estate development comprised of luxury residential units along with premium commercial spaces featuring waterfront living, retail and dining experiences. A major contract was awarded during the year to Almoayyed Contracting Group, one of the region's leading full-service general contractors, for the development of the project as a result of their ability to meet the project unique and high specification requirement standards. The project which is being managed by GFHRE, also successfully received all pre-authorization approvals for the project work commencement with mobilization now well underway. In the UAE, our California Village project, a mixed-use development and gated community, also progressed in 2016. Key steps were taken which resulted in mobilization of the project and the commencement of infrastructure work. Similarly, advancements were made in our projects in North Africa during 2016. Our Tunis Financial Harbour project took further shape during the year with a number of major milestones reached. This included the progression of the Joint Venture agreement for the development of project’s golf course and surrounding villas. In addition, the project company was able to sign an agreement with a well-known contractor for the infrastructure works for Phases 1 and 2 on which works are expected to commence in early 2017. Additionally, the framework agreement signed to develop the mall has progressed and it is expected that a final design will be available in first quarter 2017. These steps all serve to further enhance the value of the project, attract more investment and, ultimately, pave way for the next phases of this mega project to proceed.
GFH Financial Group BSC 4
CHAIRMAN’S REPORT (continued) for the year ended 31 December 2016 Our ‘Gateway to Morocco’ project also saw considerable progress. During 2016 key accomplishments included approval on the new Master Plan which was granted by the government authority (the Wali) of Marrakech. The plan was forwarded to the Ministerial Committee to extend the investment agreement. The new concept plan features residential, retail and commercial components, along with a theme park. New designs and specifications were adopted in order to meet market demands and government requirements. The project is being developed through a phased approach. The first phase to be developed consists of a Dubai-style shopping and entertainment area along with a residential element. In this regard, several alternatives for financing are being discussed with banks and potential investors. The Mumbai Economic Development Zone (MEDZ) project also advanced at a steady pace. The Wadhwa Group, the joint development partners, submitted the project’s master plan for the land allocated for Phase 1 with the project subsequently receiving the Letter of Intent from the local Special Planning Authority. Wadhwa has also received Stage 1 environment clearance for development under Phase 1. As such, the site preparation works are in progress and particularly the associated roads for the township. Permissions have also been obtained from the Railways Department for construction of a rail-under-bridge, which ensures connectivity to the National Highway with work under progress on the same. The Adani Group, the joint development partner, have also currently appointed HOK as the architect and master planner to finalize the overall master plan for the development of the land. Adani have also made the requisite applications to the State Government for approval of development of Phases 2 and 3 lands as a Special Township Project. Distributions to Investors Throughout 2016, we continued to distribute strong dividends to investors in line with our progressive dividend policy. In total, the Group returned dividends to its investors from underlying investments in the, UAE, KSA and the US primarily from investments in real estate and education sectors. This includes 8.2% returns for 2016 from our Sheffield Private School (SPS) investment and 7% from the Philadelphia Private School (PPS) in the UAE, 11% from our Jeddah Mall investment in KSA and returns of 9% and 8.5% from our Diversified US Residential Portfolio (DURP) and US Industrial portfolio, respectively. Debts and Liabilities In line with the Group’s focus on continuing to strengthen its financial position, in 2016 we continued our focus on maintaining prudent levels of leverage. In doing so, we took important steps to minimize our overall financing liabilities in order to improve liquidity and enhance our investment and risk profile. Our timely debt repayments are a testimony to soundness of our financial and business practices and the strength of the financial foundations on which we are building. During 2016, GFH debt repayments amounted to US$74 million. The 2016 debt repayments included the full prepayment and settlement of a financing facility drawn down in 2006, which originally amounted to US$300 million. Moreover, the Group remains firmly focused on strengthening its balance sheet and credit rating, and these scheduled repayments are part of our ongoing commitment to maintaining a healthy financial profile. Over the past nine years, we have significantly deleveraged our balance sheet, with GFH’s consolidated financing liabilities reducing from US$1 billion in 2008 to US$112 million currently, and an extremely healthy debt to equity ratio of 16%.
GFH Financial Group BSC 5
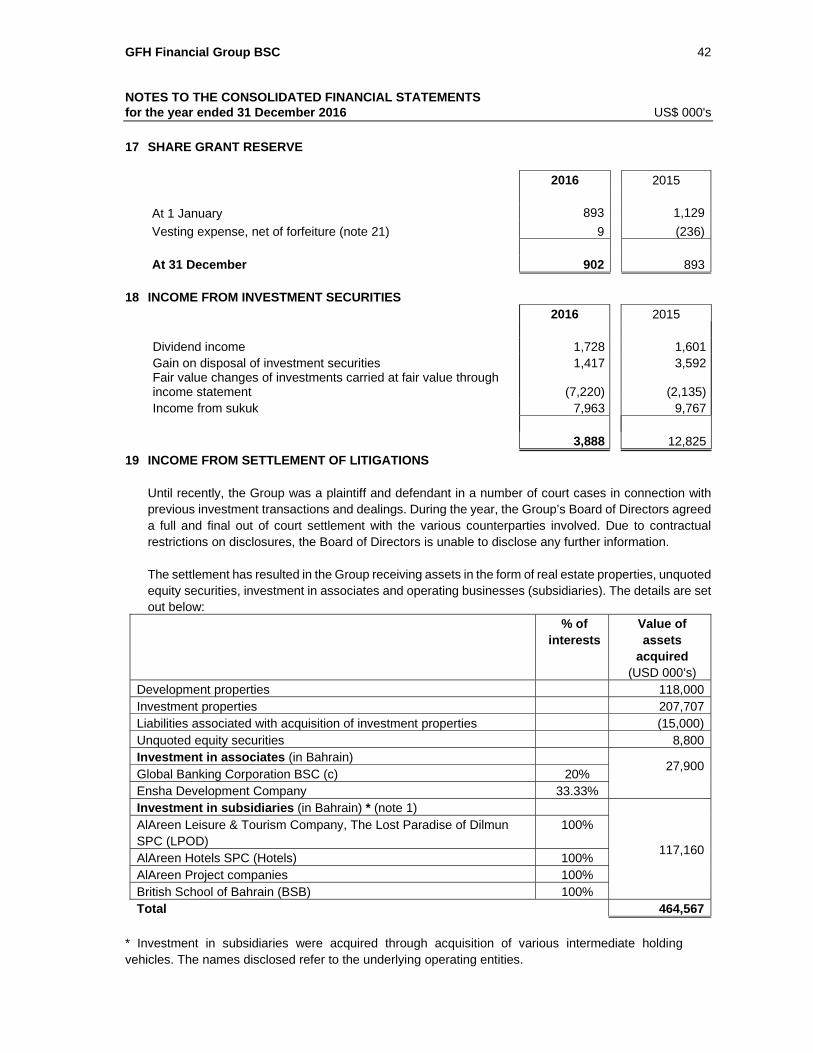
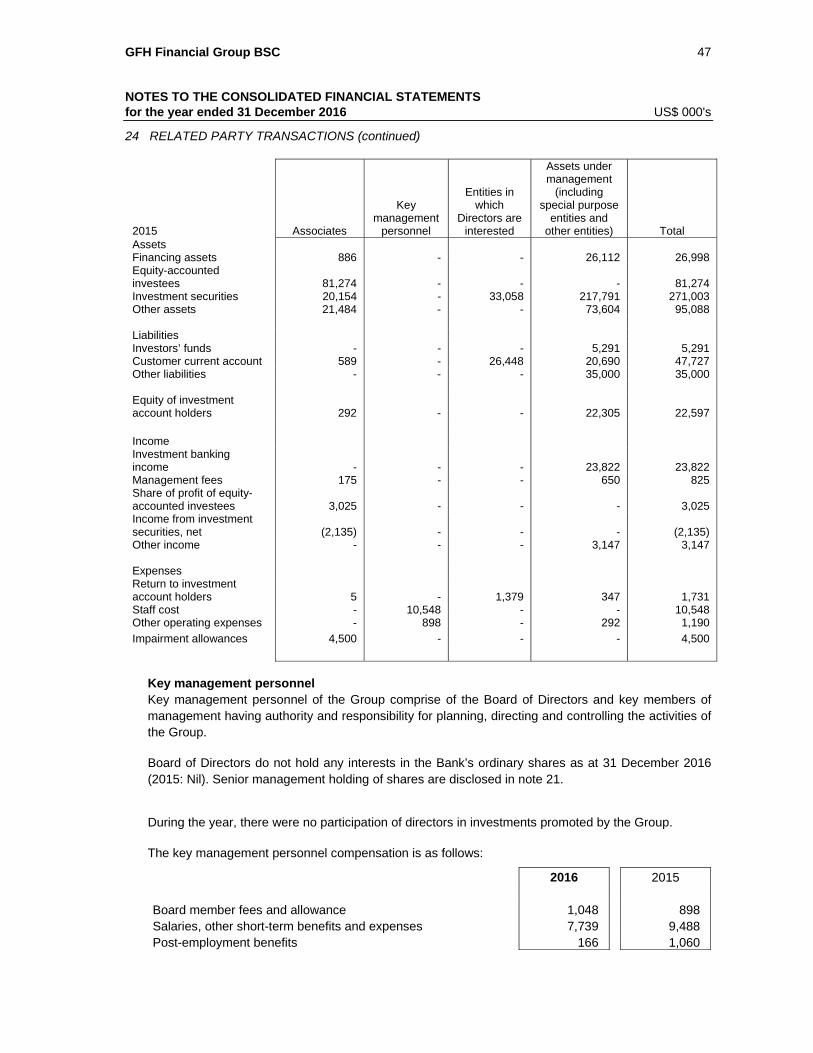
CHAIRMAN’S REPORT (continued) for the year ended 31 December 2016 Based on future cash flow estimates, we remain on track to repay all our outstanding debts as they fall due. Our confidence stems from our overall strategy, which is focused on unearthing additional value from our assets and expanding revenue streams. It has been encouraging to see new business income from all of GFH’s subsidiaries, as well as our commercial and investment banking divisions during 2016. We expect more of the same in the year ahead. Related parties Please refer to note 24 of the consolidated financial statements, for transactions between GFH and its directors or entities in which the directors are interested. Recoveries & Legal Cases During 2016, the Board of GFH resolved to approve the proposed out of court settlement with certain counterparties whereby the Group received assets amounting to US$464m. Following the completion of the requisite due diligence exercises, on the aforesaid assets and fulfilment of the pertinent obligation, the total net value of the assets recovered has reached to US$464m, reflecting a great enhancement to the financial results of the Group and hence maximizing the shareholder’s value. In future, GFH expects to generate additional revenue and value as it maximizes the potential of these assets recived in settlements. Conclusion Looking to the year ahead, we are confident of our ability to continue to build on the momentum we have established and the solid foundations that are now firmly in place for further growth. These strides are a direct result of the dedication of our management team and staff who have worked tirelessly to establish GFH as the solid financial group that we are today. There is no question that great challenges have been posed, but we have emerged stronger and better positioned than ever for success. We would also like to thank our shareholders and investors, both new and existing, for their ongoing confidence in our strategy, prospects and, importantly, our ability to deliver on their behalf now and in the future. Similarly, our deep gratitude and appreciation is extended for the ongoing support afforded us by the Central Bank of Bahrain, the Government of the Kingdom of Bahrain and its wise leadership His Royal Majesty King Hamad bin Isa Al Khalifa, His Royal Highness the Prime Minister Prince Khalifa bin Salman Al Khalifa and His Royal Highness the Crown Prince and Deputy Supreme Commander Prince Salman bin Hamad Al Khalifa. In concluding and, as we go forward, we remain committed to creating even greater value and delivering stronger levels of returns and profitability for the benefit of our shareholders, investors and all stakeholders of the Group. We will achieve this through the continued expansion of our portfolio of solid, income yielding investments and the effective management of what is now a strong and diverse base of assets. We enter 2017 with great confidence in the future of our Group and look forward to keeping you apprised of our activities and progress in the months ahead. Sincerely, Dr. Ahmed Al-Mutawa Chairman 5th February 2017
GFH Financial Group BSC 7
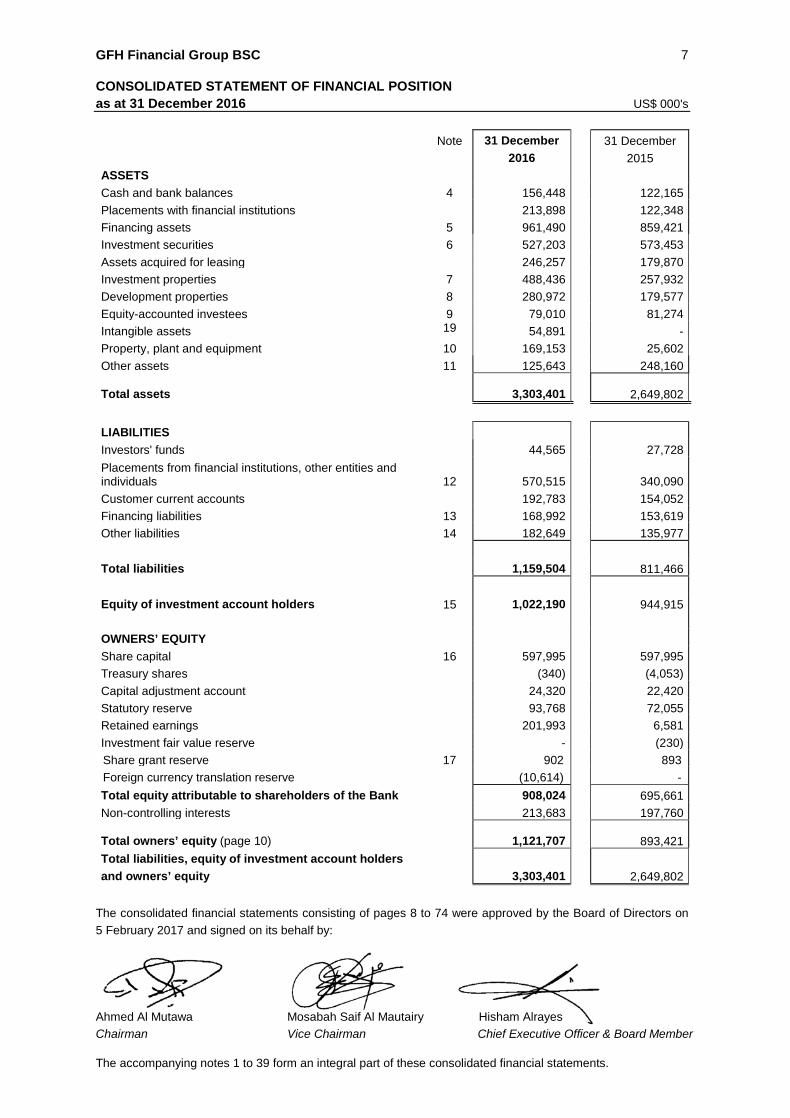
CONSOLIDATED STATEMENT OF FINANCIAL POSITION as at 31 December 2016 US$ 000's
The consolidated financial statements consisting of pages 8 to 74 were approved by the Board of Directors on
5 February 2017 and signed on its behalf by:
Ahmed Al Mutawa Mosabah Saif Al Mautairy Hisham Alrayes
Chairman Vice Chairman Chief Executive Officer & Board Member The accompanying notes 1 to 39 form an integral part of these consolidated financial statements.
Note 31 December
2016
31 December
2015
ASSETS
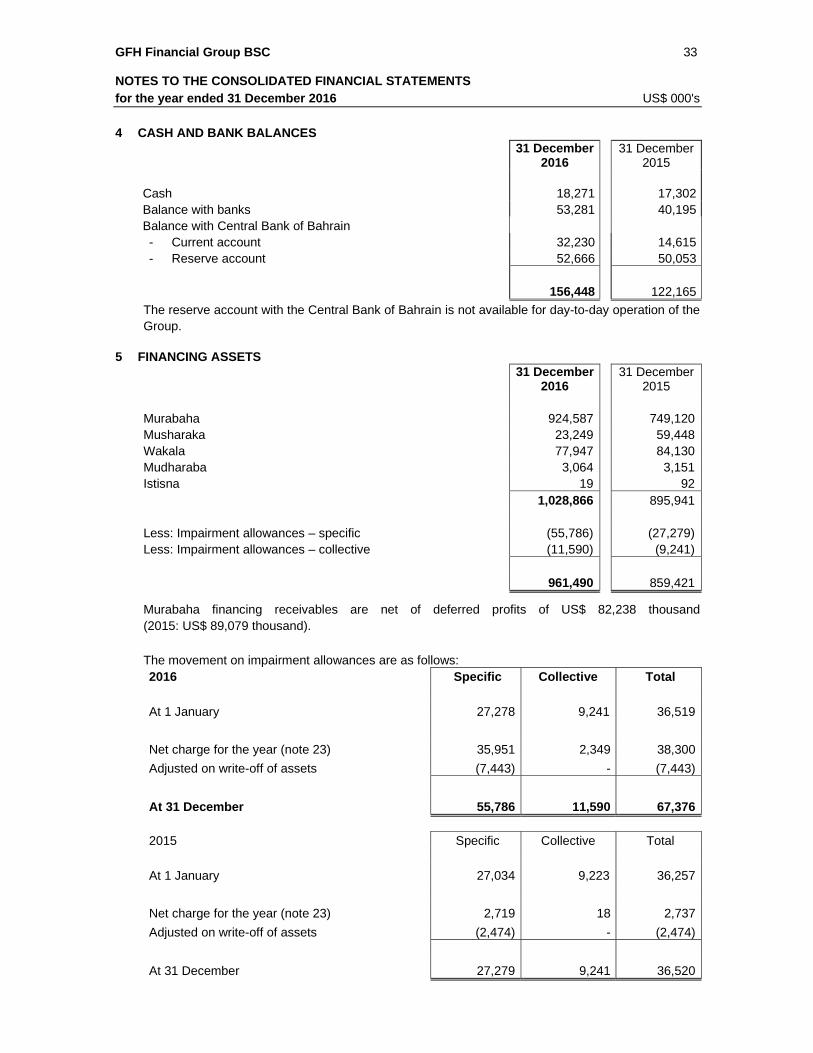
Cash and bank balances 4 156,448 122,165
Placements with financial institutions 213,898 122,348
Financing assets 5 961,490 859,421
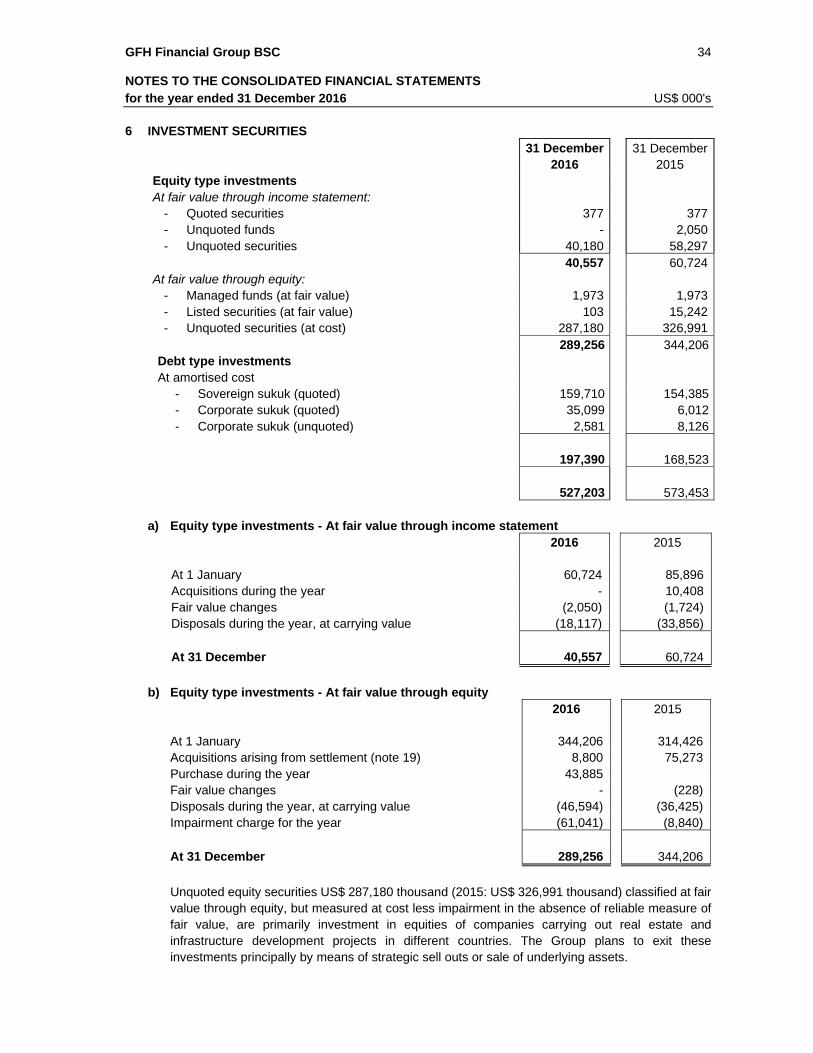
Investment securities 6 527,203 573,453
Assets acquired for leasing 246,257 179,870
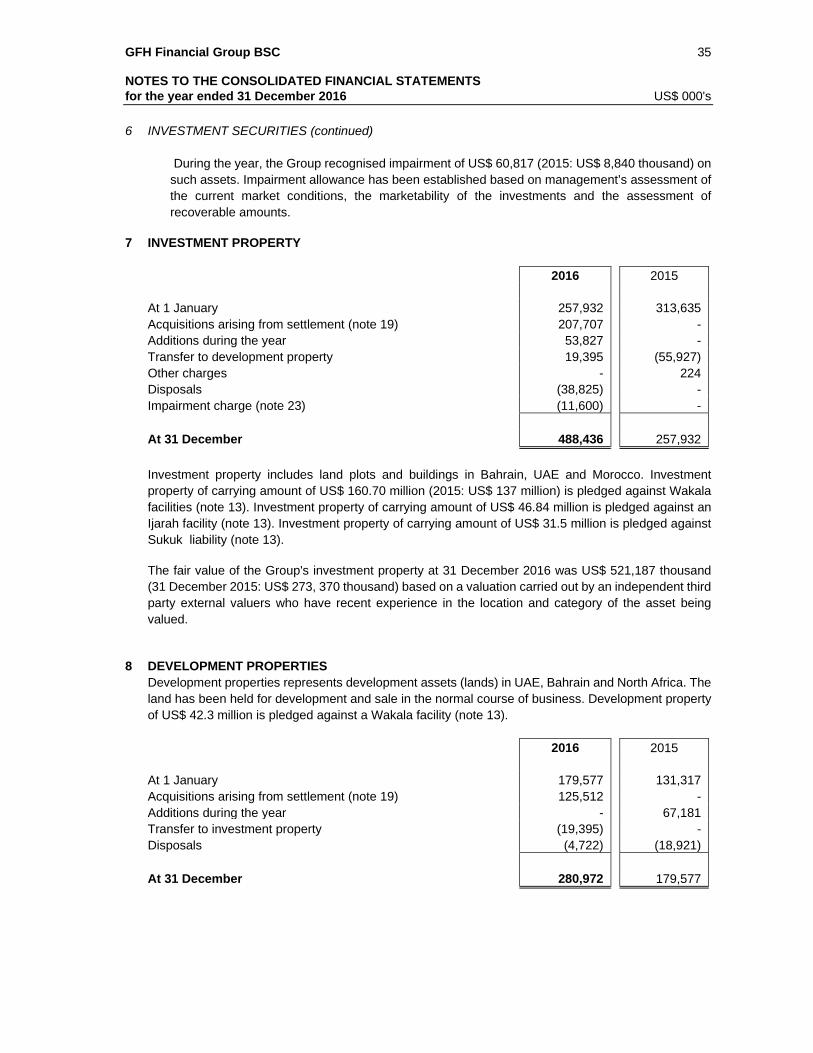
Investment properties 7 488,436 257,932
Development properties 8 280,972 179,577
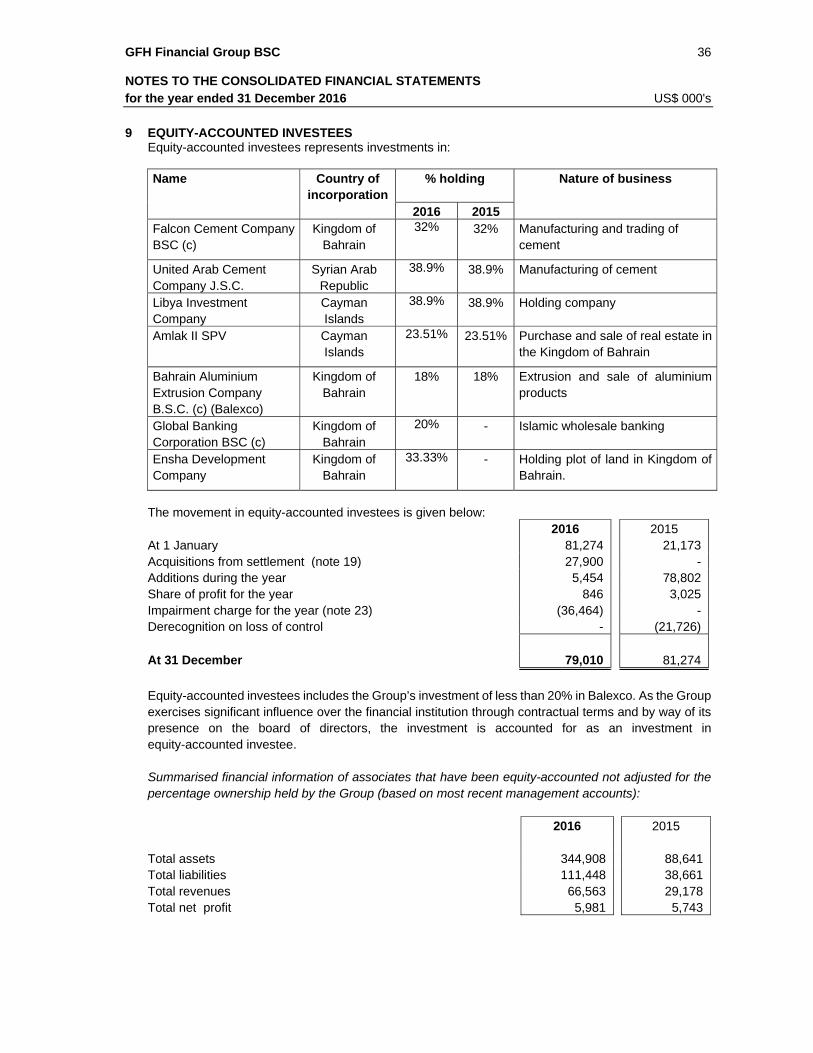
Equity-accounted investees 9 79,010 81,274
Intangible assets 19 54,891 -
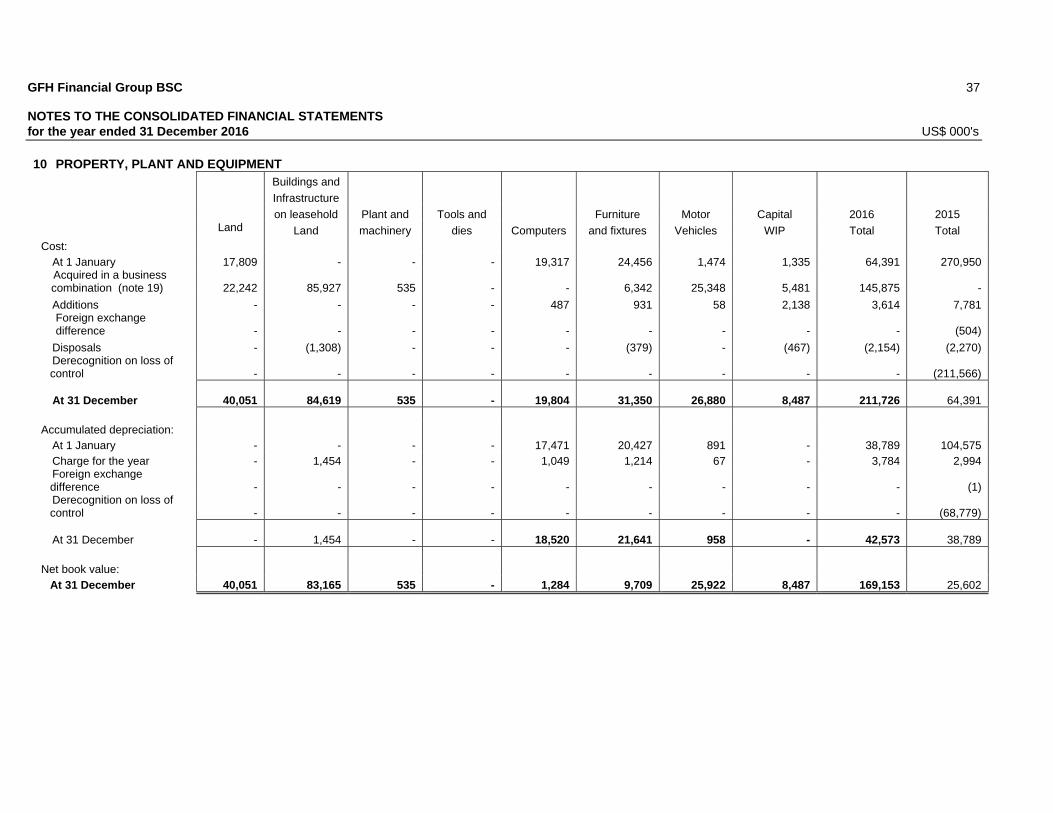
Property, plant and equipment 10 169,153 25,602
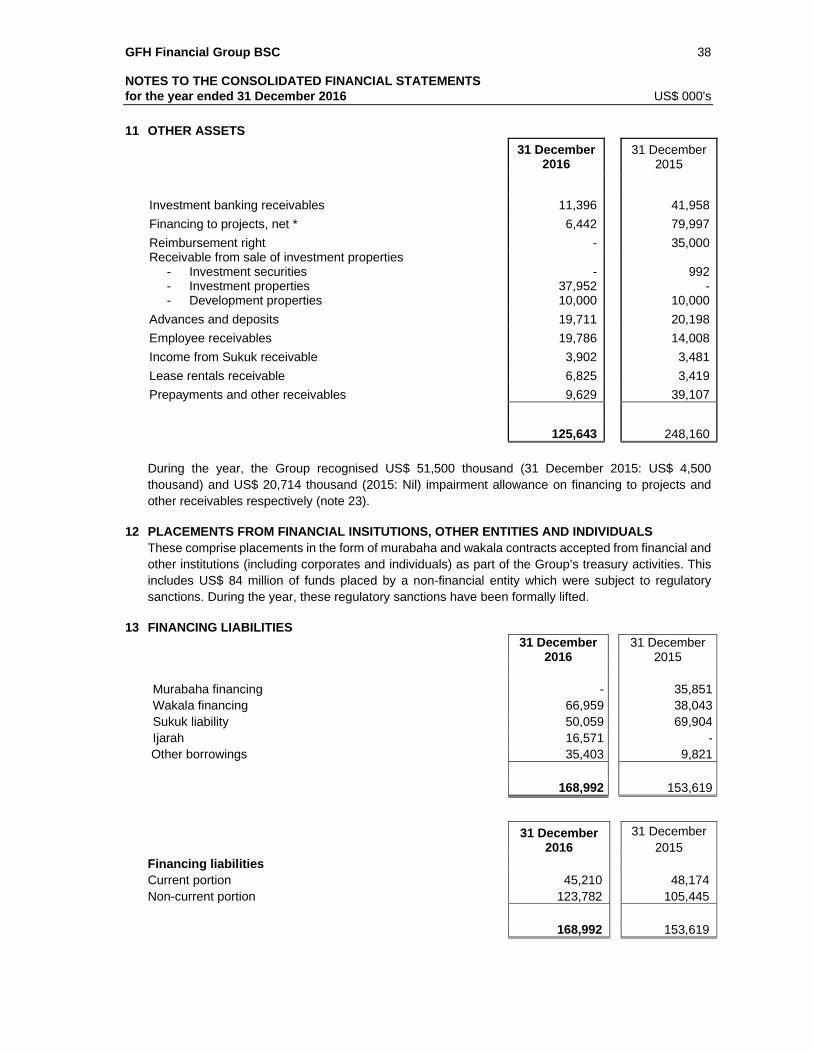
Other assets 11 125,643 248,160 Total assets 3,303,401
2,649,802
LIABILITIES
Investors' funds 44,565 27,728
Placements from financial institutions, other entities and individuals 12 570,515
340,090
Customer current accounts 192,783 154,052
Financing liabilities 13 168,992 153,619
Other liabilities 14 182,649 135,977
Total liabilities 1,159,504 811,466
Equity of investment account holders 15 1,022,190 944,915
OWNERS’ EQUITY
Share capital 16 597,995 597,995
Treasury shares (340) (4,053)
Capital adjustment account 24,320 22,420
Statutory reserve 93,768 72,055
Retained earnings 201,993 6,581
Investment fair value reserve - (230)
Share grant reserve 17 902 893
Foreign currency translation reserve (10,614) -
Total equity attributable to shareholders of the Bank 908,024 695,661
Non-controlling interests 213,683 197,760 Total owners’ equity (page 10) 1,121,707
893,421
Total liabilities, equity of investment account holders
and owners’ equity 3,303,401
2,649,802
GFH Financial Group BSC 8
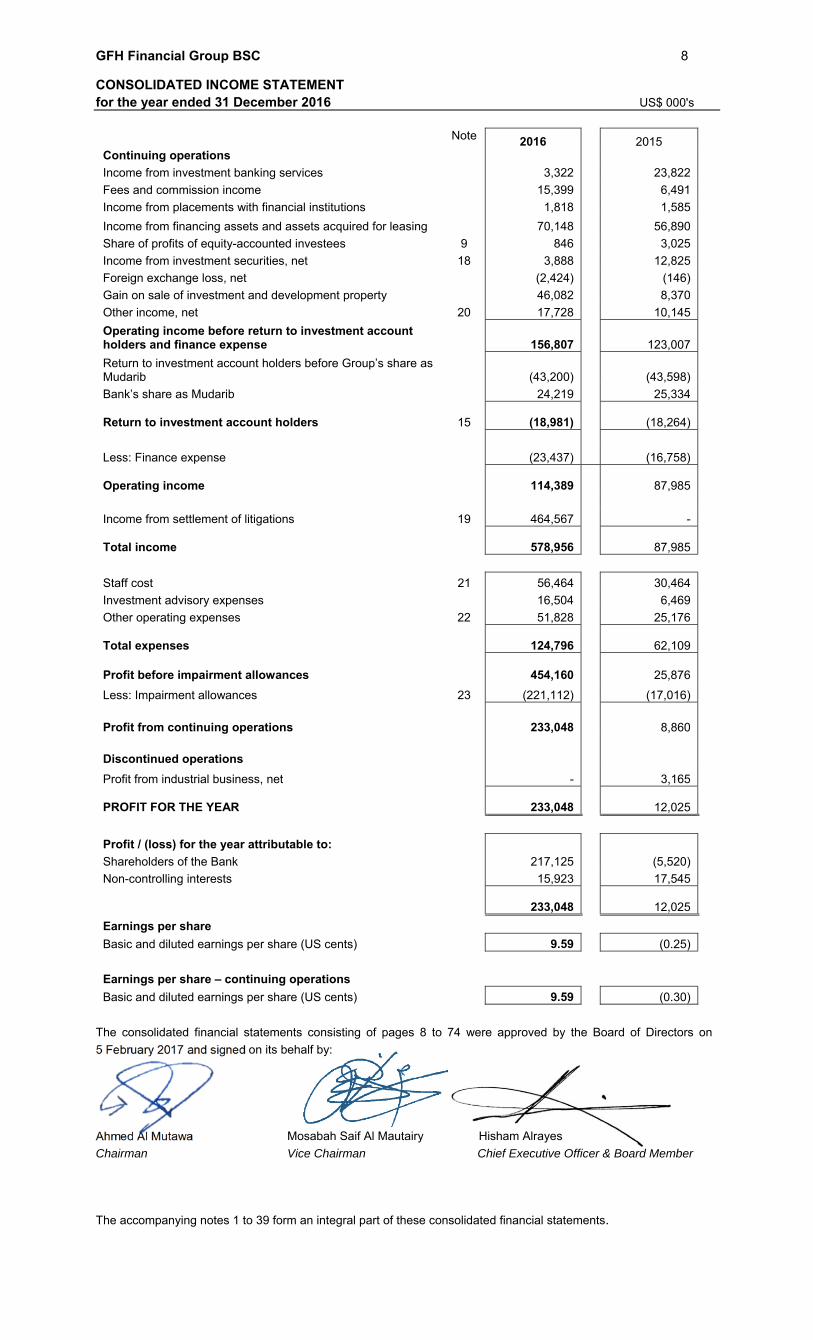
CONSOLIDATED INCOME STATEMENT for the year ended 31 December 2016 US$ 000's
Note 2016 2015 Continuing operations
Income from investment banking services 3,322 23,822
Fees and commission income 15,399 6,491
Income from placements with financial institutions 1,818 1,585
Income from financing assets and assets acquired for leasing 70,148 56,890
Share of profits of equity-accounted investees 9 846 3,025
Income from investment securities, net 18 3,888 12,825
Foreign exchange loss, net (2,424) (146)
Gain on sale of investment and development property 46,082 8,370
Other income, net 20 17,728 10,145
Operating income before return to investment account holders and finance expense 156,807 123,007
Return to investment account holders before Group’s share as Mudarib (43,200) (43,598)
Bank’s share as Mudarib 24,219 25,334 Return to investment account holders 15 (18,981) (18,264)
Less: Finance expense (23,437) (16,758) Operating income 114,389 87,985
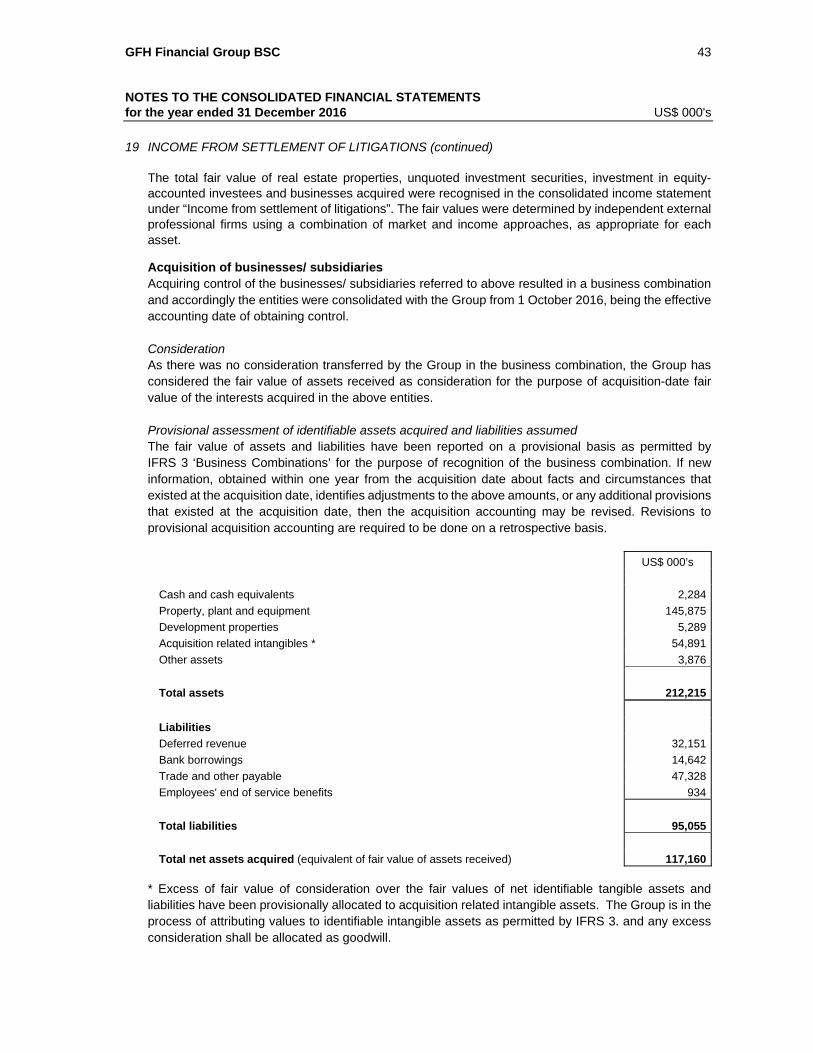
Income from settlement of litigations 19 464,567 -
Total income
578,956 87,985
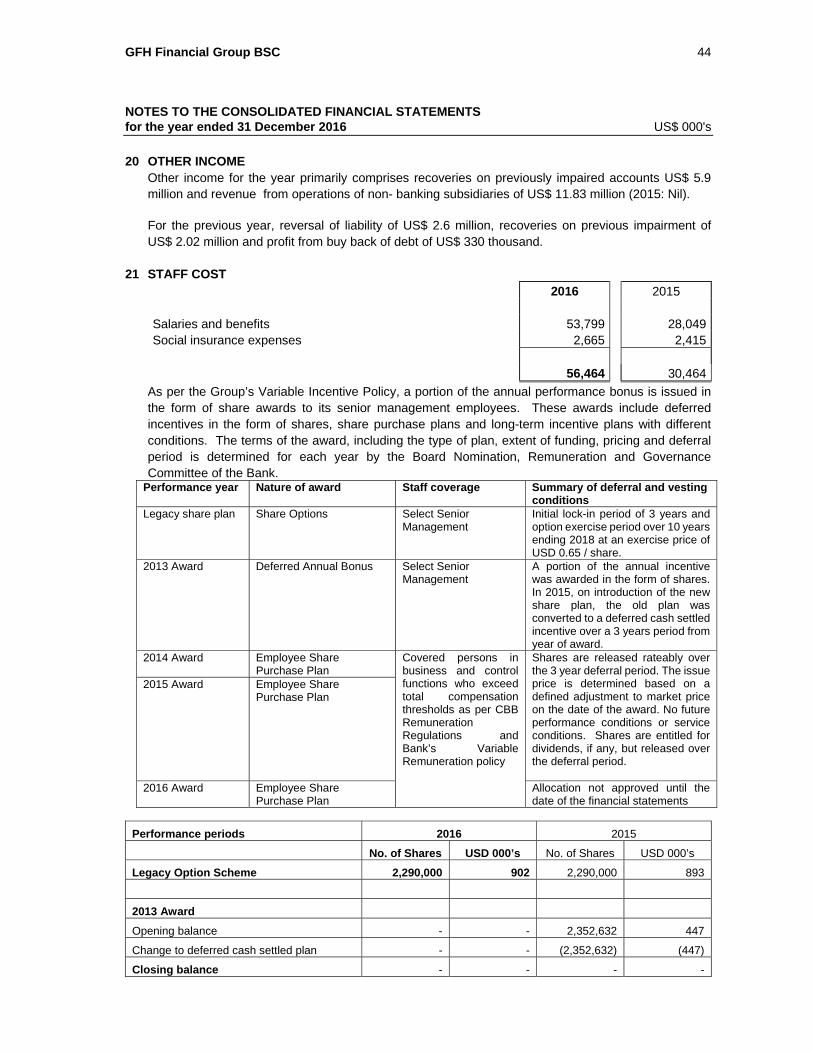
Staff cost 21 56,464 30,464
Investment advisory expenses 16,504 6,469
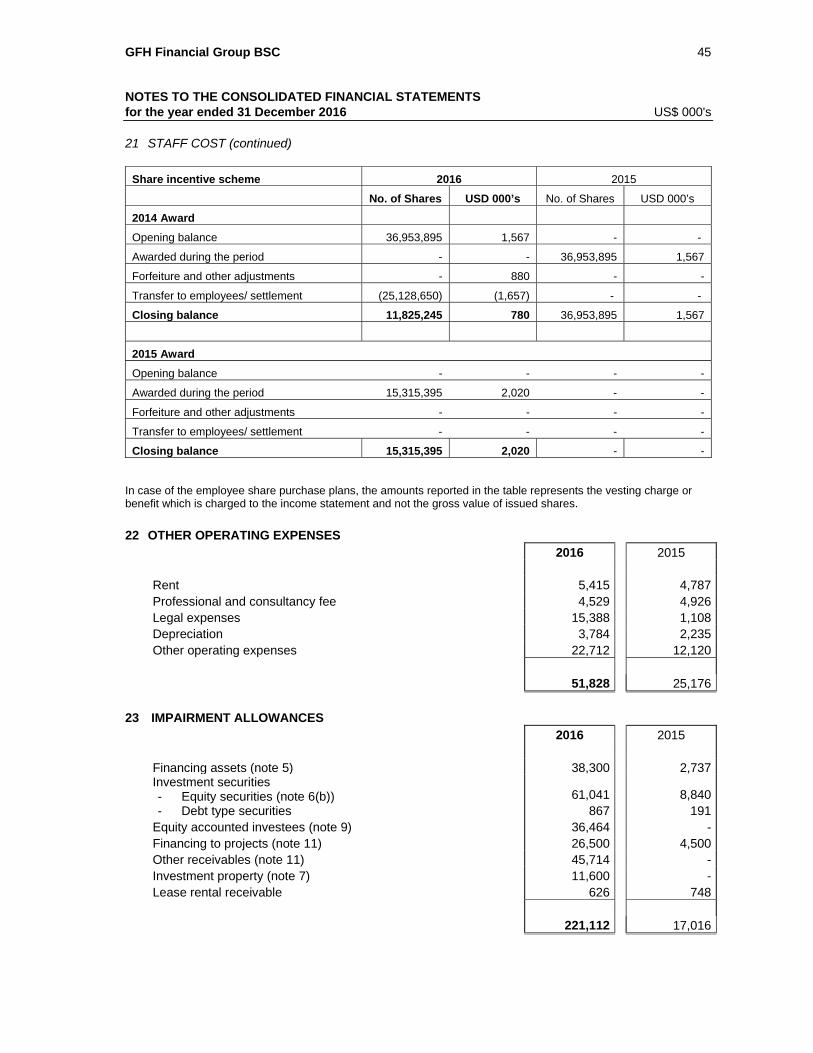
Other operating expenses 22 51,828 25,176 Total expenses 124,796 62,109
Profit before impairment allowances 454,160 25,876
Less: Impairment allowances 23 (221,112) (17,016)
Profit from continuing operations 233,048 8,860
Discontinued operations
Profit from industrial business, net - 3,165
PROFIT FOR THE YEAR
233,048 12,025
Profit / (loss) for the year attributable to:
Shareholders of the Bank 217,125 (5,520)
Non-controlling interests 15,923 17,545
233,048
12,025
Earnings per share
Basic and diluted earnings per share (US cents) 9.59 (0.25)
Earnings per share – continuing operations
Basic and diluted earnings per share (US cents) 9.59 (0.30)
The consolidated financial statements consisting of pages 8 to 74 were approved by the Board of Directors on
5 February 2017 and signed on its behalf by:
Ahmed Al Mutawa Mosabah Saif Al Mautairy Hisham Alrayes
Chairman Vice Chairman Chief Executive Officer & Board Member
The accompanying notes 1 to 39 form an integral part of these consolidated financial statements.
GFH Financial Group BSC 9
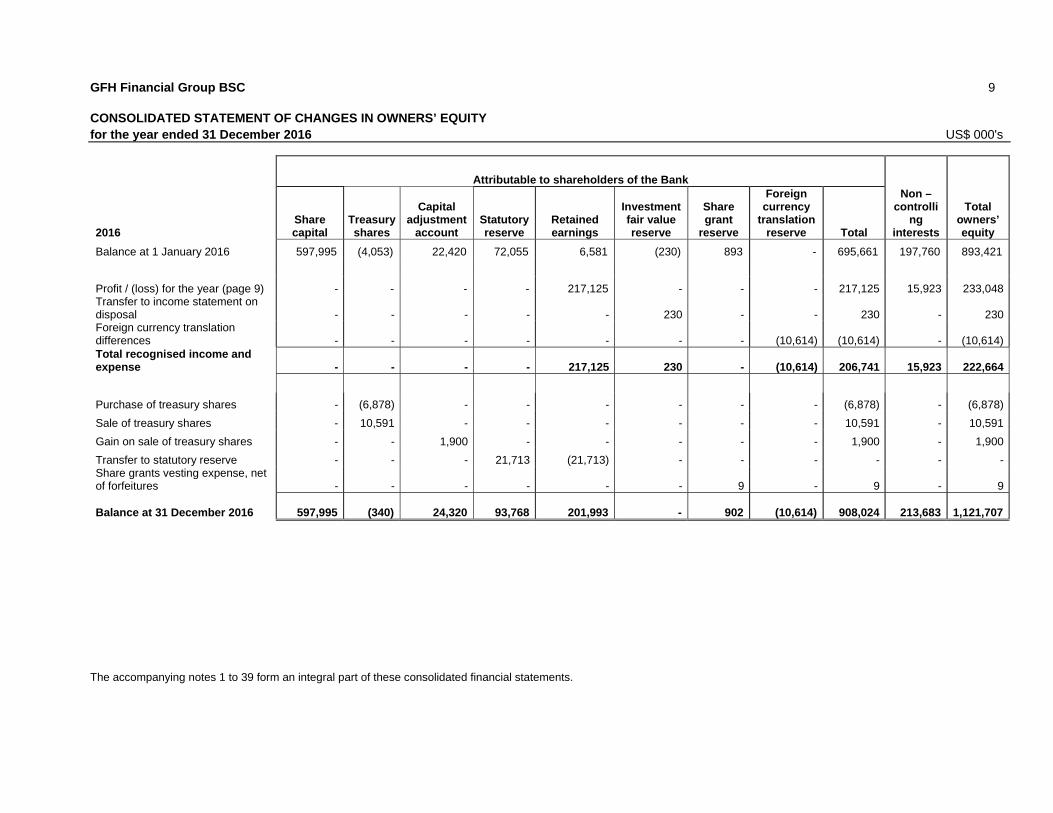
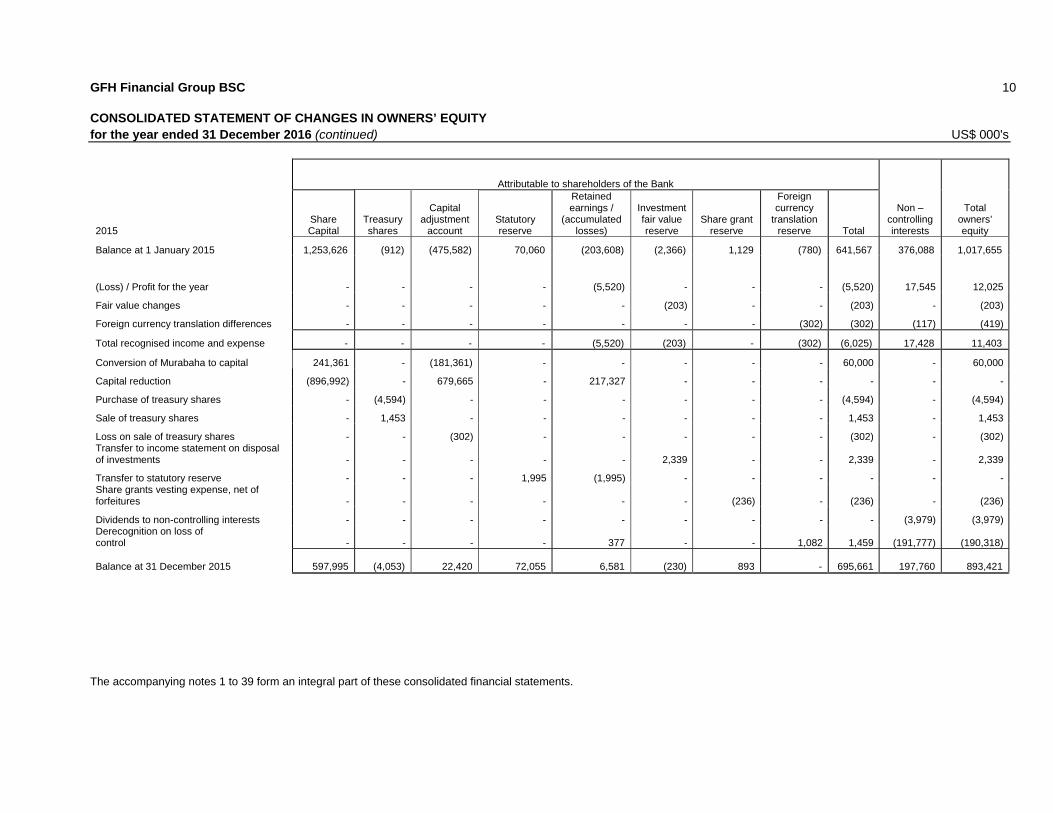
CONSOLIDATED STATEMENT OF CHANGES IN OWNERS’ EQUITY for the year ended 31 December 2016 US$ 000's
Attributable to shareholders of the Bank Non –
controlling
interests
Total owners’ equity 2016
Share capital
Treasury shares
Capital adjustment
account Statutory reserve
Retained earnings
Investment fair value reserve
Share grant
reserve
Foreign currency
translation reserve
Total
Balance at 1 January 2016 597,995 (4,053) 22,420 72,055 6,581 (230) 893 - 695,661 197,760 893,421
Profit / (loss) for the year (page 9) - - - - 217,125 - - - 217,125 15,923 233,048 Transfer to income statement on disposal - - - - - 230 - - 230 - 230 Foreign currency translation differences - - - - - - - (10,614) (10,614) - (10,614) Total recognised income and expense - - - - 217,125 230 - (10,614) 206,741 15,923 222,664
Sale of treasury shares - 1,453 - - - - - - 1,453 - 1,453
Loss on sale of treasury shares - - (302) - - - - - (302) - (302) Transfer to income statement on disposal of investments - - - - - 2,339 - - 2,339 - 2,339
Transfer to statutory reserve - - - 1,995 (1,995) - - - - - - Share grants vesting expense, net of forfeitures - - - - - - (236) - (236) - (236)
Dividends to non-controlling interests - - - - - - - - - (3,979) (3,979) Derecognition on loss of control - - - - 377 - - 1,082 1,459 (191,777) (190,318) Balance at 31 December 2015 597,995 (4,053) 22,420 72,055 6,581 (230) 893 - 695,661 197,760 893,421
The accompanying notes 1 to 39 form an integral part of these consolidated financial statements.
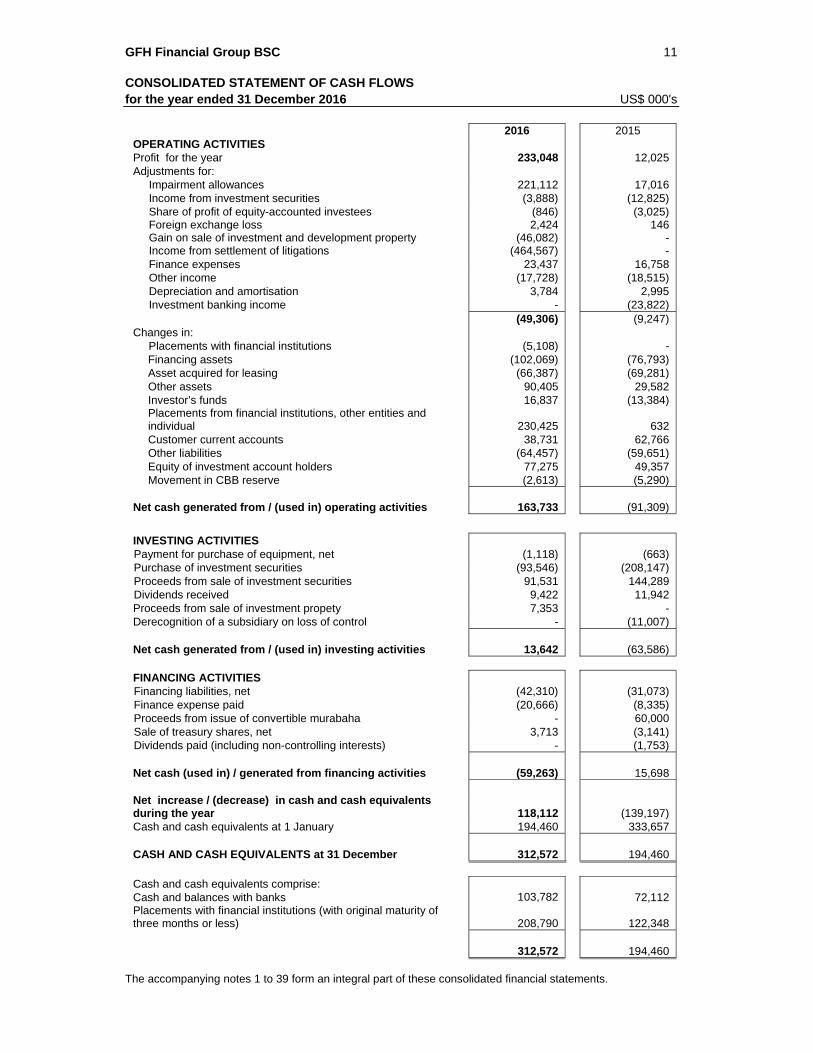
GFH Financial Group BSC 11 CONSOLIDATED STATEMENT OF CASH FLOWS for the year ended 31 December 2016 US$ 000's
2016 2015 OPERATING ACTIVITIES Profit for the year 233,048 12,025 Adjustments for:
Impairment allowances 221,112 17,016 Income from investment securities (3,888) (12,825) Share of profit of equity-accounted investees (846) (3,025) Foreign exchange loss 2,424 146 Gain on sale of investment and development property (46,082) - Income from settlement of litigations (464,567) - Finance expenses 23,437 16,758 Other income (17,728) (18,515) Depreciation and amortisation 3,784 2,995 Investment banking income - (23,822)
(49,306) (9,247) Changes in: Placements with financial institutions (5,108) -
Financing assets (102,069) (76,793) Asset acquired for leasing (66,387) (69,281) Other assets 90,405 29,582 Investor’s funds 16,837 (13,384) Placements from financial institutions, other entities and individual 230,425 632 Customer current accounts 38,731 62,766 Other liabilities (64,457) (59,651) Equity of investment account holders 77,275 49,357 Movement in CBB reserve (2,613) (5,290)
Net cash generated from / (used in) operating activities 163,733 (91,309)
INVESTING ACTIVITIES Payment for purchase of equipment, net (1,118) (663) Purchase of investment securities (93,546) (208,147) Proceeds from sale of investment securities 91,531 144,289 Dividends received 9,422 11,942 Proceeds from sale of investment propety 7,353 - Derecognition of a subsidiary on loss of control - (11,007) Net cash generated from / (used in) investing activities 13,642 (63,586) FINANCING ACTIVITIES Financing liabilities, net (42,310) (31,073) Finance expense paid (20,666) (8,335) Proceeds from issue of convertible murabaha - 60,000 Sale of treasury shares, net 3,713 (3,141) Dividends paid (including non-controlling interests) - (1,753) Net cash (used in) / generated from financing activities (59,263) 15,698 Net increase / (decrease) in cash and cash equivalents during the year 118,112 (139,197) Cash and cash equivalents at 1 January 194,460 333,657
CASH AND CASH EQUIVALENTS at 31 December 312,572 194,460
Cash and cash equivalents comprise: Cash and balances with banks 103,782 72,112 Placements with financial institutions (with original maturity of three months or less) 208,790 122,348
312,572 194,460
The accompanying notes 1 to 39 form an integral part of these consolidated financial statements.
GFH Financial Group BSC 12
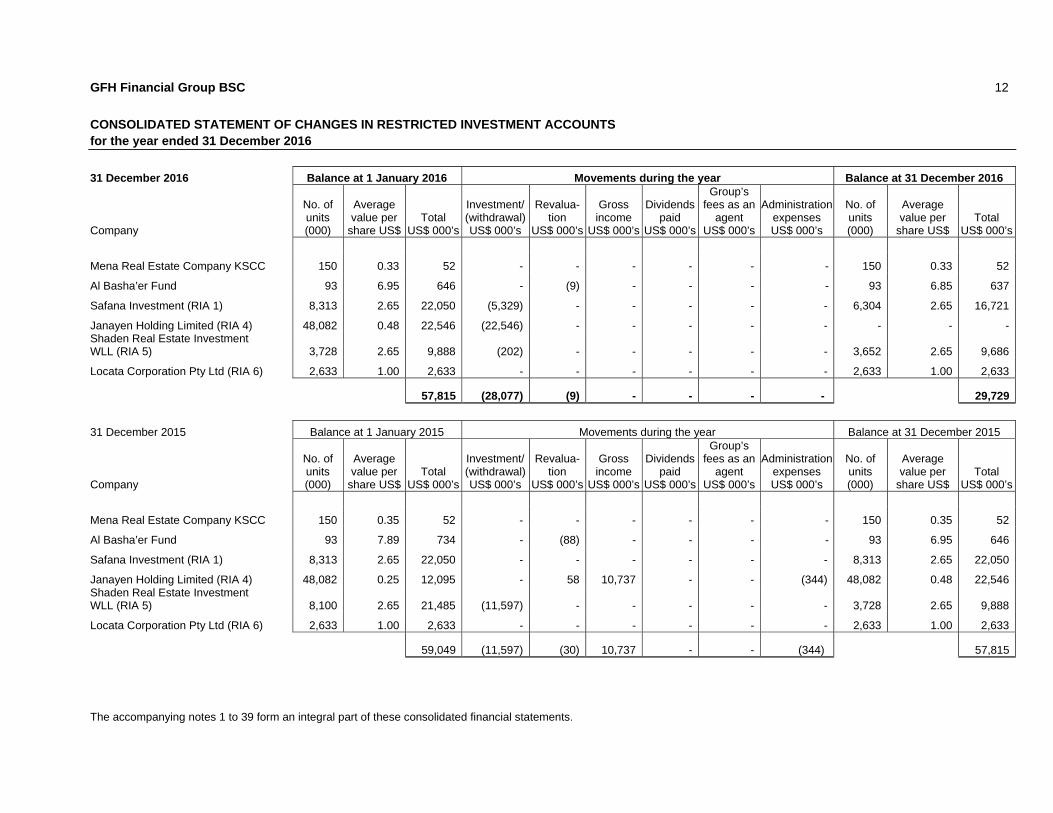
CONSOLIDATED STATEMENT OF CHANGES IN RESTRICTED INVESTMENT ACCOUNTS for the year ended 31 December 2016
31 December 2016 Balance at 1 January 2016 Movements during the year Balance at 31 December 2016
Company
No. of units (000)
Average value per
share US$Total
US$ 000’s
Investment/ (withdrawal) US$ 000’s
Revalua-tion
US$ 000’s
Gross income
US$ 000’s
Dividends paid
US$ 000’s
Group’s fees as an
agent US$ 000’s
Administration expenses US$ 000’s
No. of units (000)
Average value per
share US$ Total
US$ 000’s
Mena Real Estate Company KSCC 150 0.33 52 - - - - - - 150 0.33 52
Al Basha’er Fund 93 6.95 646 - (9) - - - - 93 6.85 637
The accompanying notes 1 to 39 form an integral part of these consolidated financial statements.
GFH Financial Group BSC 13
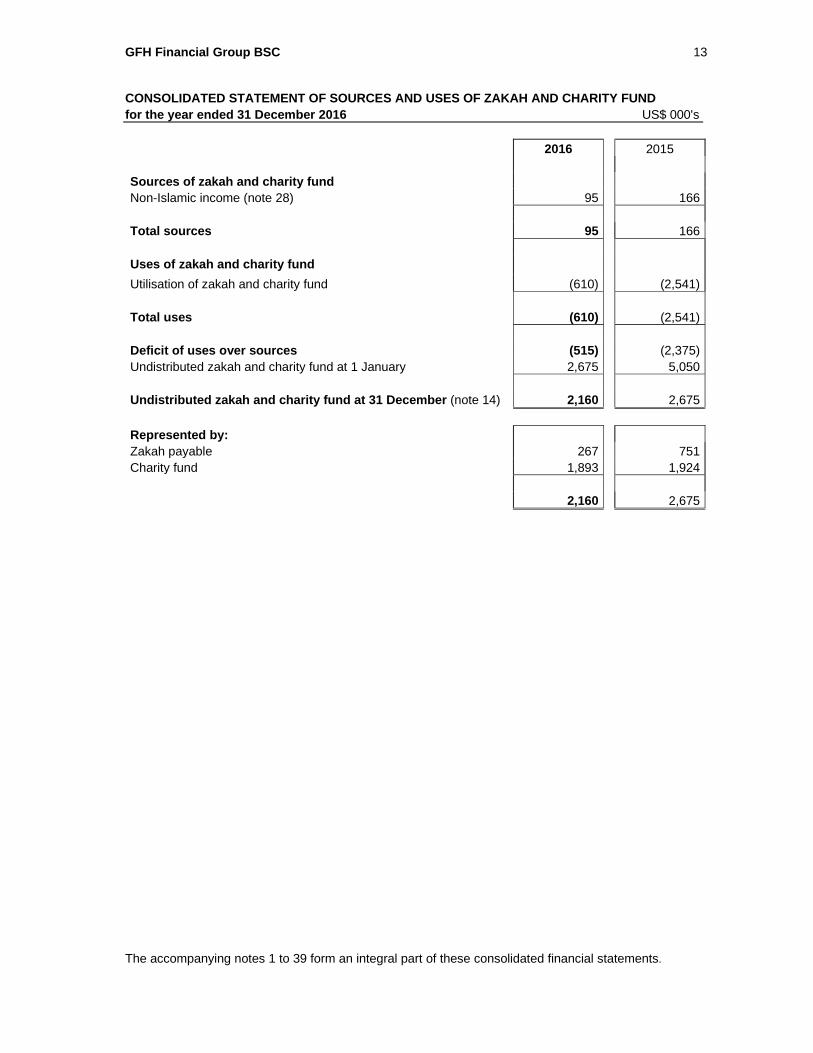
CONSOLIDATED STATEMENT OF SOURCES AND USES OF ZAKAH AND CHARITY FUND for the year ended 31 December 2016 US$ 000's 2016 2015 Sources of zakah and charity fund Non-Islamic income (note 28) 95 166 Total sources 95 166 Uses of zakah and charity fund
Utilisation of zakah and charity fund (610) (2,541) Total uses (610) (2,541) Deficit of uses over sources (515) (2,375)Undistributed zakah and charity fund at 1 January 2,675 5,050 Undistributed zakah and charity fund at 31 December (note 14) 2,160 2,675
The accompanying notes 1 to 39 form an integral part of these consolidated financial statements.
GFH Financial Group BSC 14
NOTES TO THE CONSOLIDATED FINANCIAL STATEMENTS for the year ended 31 December 2016 US$ 000's
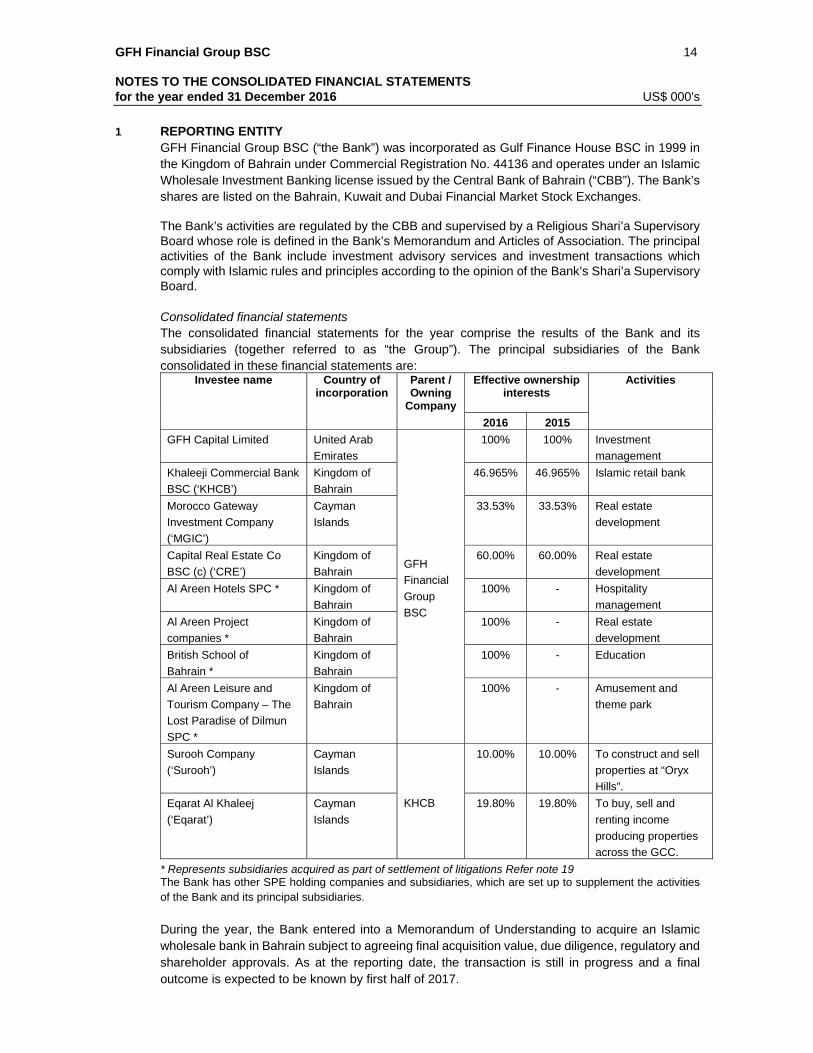
1 REPORTING ENTITY GFH Financial Group BSC (“the Bank”) was incorporated as Gulf Finance House BSC in 1999 in the Kingdom of Bahrain under Commercial Registration No. 44136 and operates under an Islamic Wholesale Investment Banking license issued by the Central Bank of Bahrain (“CBB”). The Bank’s shares are listed on the Bahrain, Kuwait and Dubai Financial Market Stock Exchanges. The Bank’s activities are regulated by the CBB and supervised by a Religious Shari’a Supervisory Board whose role is defined in the Bank’s Memorandum and Articles of Association. The principal activities of the Bank include investment advisory services and investment transactions which comply with Islamic rules and principles according to the opinion of the Bank’s Shari’a Supervisory Board. Consolidated financial statements The consolidated financial statements for the year comprise the results of the Bank and its subsidiaries (together referred to as “the Group”). The principal subsidiaries of the Bank consolidated in these financial statements are:
Investee name Country of incorporation
Parent / Owning
Company
Effective ownership interests
Activities
2016 2015
GFH Capital Limited United Arab
Emirates
GFH
Financial
Group
BSC
100% 100% Investment
management
Khaleeji Commercial Bank
BSC (‘KHCB’)
Kingdom of
Bahrain
46.965% 46.965% Islamic retail bank
Morocco Gateway
Investment Company
(‘MGIC’)
Cayman
Islands
33.53% 33.53% Real estate
development
Capital Real Estate Co
BSC (c) (‘CRE’)
Kingdom of
Bahrain
60.00% 60.00% Real estate
development
Al Areen Hotels SPC * Kingdom of
Bahrain
100% - Hospitality
management
Al Areen Project
companies *
Kingdom of
Bahrain
100% - Real estate
development
British School of
Bahrain *
Kingdom of
Bahrain
100% - Education
Al Areen Leisure and
Tourism Company – The
Lost Paradise of Dilmun
SPC *
Kingdom of
Bahrain
100% - Amusement and
theme park
Surooh Company
(‘Surooh’)
Cayman
Islands
KHCB
10.00% 10.00% To construct and sell
properties at “Oryx
Hills”.
Eqarat Al Khaleej
(‘Eqarat’)
Cayman
Islands
19.80% 19.80% To buy, sell and
renting income
producing properties
across the GCC.
* Represents subsidiaries acquired as part of settlement of litigations Refer note 19 The Bank has other SPE holding companies and subsidiaries, which are set up to supplement the activities of the Bank and its principal subsidiaries.
During the year, the Bank entered into a Memorandum of Understanding to acquire an Islamic wholesale bank in Bahrain subject to agreeing final acquisition value, due diligence, regulatory and shareholder approvals. As at the reporting date, the transaction is still in progress and a final outcome is expected to be known by first half of 2017.
GFH Financial Group BSC 15
NOTES TO THE CONSOLIDATED FINANCIAL STATEMENTS for the year ended 31 December 2016 US$ 000’s 2 SIGNIFICANT ACCOUNTING POLICIES
The significant accounting polices applied in the preparation of these consolidated financial statements are set out below. These accounting policies have been applied consistently to all periods presented in the consolidated financial statements, and have been consistently applied by Group.
a) Statement of compliance The consolidated financial statements have been prepared in accordance with the Financial Accounting Standards (‘FAS’) issued by the Accounting and Auditing Organisation for Islamic Financial Institutions and in conformity with Bahrain Commercial Companies Law. In line with the requirement of AAOIFI and the CBB Rule Book, for matters that are not covered by FAS, the Group uses guidance from the relevant International Financial Reporting Standard (IFRS). New standards, amendments and interpretations effective from 1 January 2016 The following new standards, amendments to standards and interpretations are effective for annual periods beginning on or after 1 January 2016 and are expected to be relevant to the Group. FAS 27 – Investments Accounts FAS 27 Investments accounts was issued in December 2014 replacing FAS 5 – ‘Disclosures of Bases for Profit Allocation between Owner’s Equity and Investment Account Holders’ and FAS 6 – ‘Equity of Investment Account Holders and their Equivalent’. The adoption of this standard expanded the disclosures related to equity of Investment Account Holders. The standard had no significant impact on the consolidated financial statements of the Bank. Refer to note 16 for the additional disclosure.
ii. New standards, amendments and interpretations issued but not yet effective No new standards, amendments to standards and interpretations that are effective for annual periods beginning on or after 1 January 2017.
b) Basis of preparation
The consolidated financial statements are prepared on the historical cost basis except for the measurement at fair value of certain investment securities. The Group classifies its expenses in the consolidated income statement by the nature of expense method. The consolidated financial statements are presented in United States Dollars (US$), being the functional currency of the Group’s operations. All financial information presented in US$ has been rounded to the nearest thousands, except when otherwise indicated. The preparation of consolidated financial statements requires the use of certain critical accounting estimates. It also requires management to exercise judgement in the process of applying the Group’s accounting policies. Estimates and underlying assumptions are reviewed on an ongoing basis. Revisions to accounting estimates are recognised in the period in which the estimate is revised and in any future periods affected. Management believes that the underlying assumptions are appropriate and the Group’s consolidated financial statements therefore present the financial position and results fairly. The areas involving a higher degree of judgement or complexity, or areas where assumptions and estimates are significant to the consolidated financial statements are disclosed in note 3.
c) Basis of consolidation
(i) Business combinations
Business combinations are accounted for using the acquisition method as at the acquisition date, which is the date on which control is transferred to the Group. Control is the power to govern the financial and operating policies of an entity so as to obtain benefits from its
GFH Financial Group BSC 16
NOTES TO THE CONSOLIDATED FINANCIAL STATEMENTS for the year ended 31 December 2016 US$ 000’s
2 SIGNIFICANT ACCOUNTING POLICIES (continued)
c) Basis of consolidation (continued)
activities. In assessing control, the Group takes into consideration potential voting rights that are currently exercisable. The Group measures goodwill at the acquisition date as: the fair value of the consideration transferred; plus the recognised amount of any non-controlling interest in the acquiree; plus if the business combination achieved in stages, the fair value of the pre-existing equity
interest in the acquiree; less the net recognised amount (generally fair value) of the identifiable assets acquired and
liabilities assumed.
When the excess is negative, a bargain purchase gain is recognised immediately in the consolidated income statement.
The consideration transferred does not include amounts related to settlement of pre-existing relationships. Such amounts are generally recognised in the consolidated income statement. Transaction costs, other than those associated with the issue of debt or equity securities, that the Group incurs in connection with a business combination are expensed as incurred. Any contingent consideration payable is measured at fair value at the acquisition date. If the contingent consideration is classified as equity, then it is not remeasured and settlement is accounted within equity. Otherwise subsequent changes in the fair value of the contingent consideration are recognised in the consolidated income statement.
(ii) Subsidiaries Subsidiaries are those enterprises (including special purpose entities) controlled by the Group. Control exists when the Group has the power, directly or indirectly, to govern the financial and operating policies of an enterprise so as to obtain benefits from its activities. Subsidiaries are consolidated from the date on which control commences until when control ceases.
(iii) Non-controlling interests (NCI)
NCI are measured at their proportionate share of the acquiree’s identifiable net assets at the date of acquisition.
(iv) Special purpose entities The consolidated financial statements of the Group comprise the financial statements of the Bank and its subsidiaries. Subsidiaries are those enterprises (including special purpose entities) controlled by the Bank. Control exists when the Group has the power, directly or indirectly, to govern the financial and operating policies of an enterprise so as to obtain benefits from its activities. Subsidiaries are consolidated from the date on which control is transferred to the Group and de-consolidated from the date that control ceases. Control is presumed to exist, when the Bank owns majority of voting rights in an investee. Special purpose entities (SPEs) are entities that are created to accomplish a narrow and well-defined objective such as the securitisation of particular assets, or the execution of a specific borrowing or investment transaction and usually voting rights are relevant for the operating of such entities. An investor that has decision-making power over an investee and exposure to variability of returns determines whether it acts as a principal or as an agent to determine whether there is a linkage between power and returns. When the decision maker is an agent, the link between power and returns is absent and the decision maker's delegated power does
GFH Financial Group BSC 17
NOTES TO THE CONSOLIDATED FINANCIAL STATEMENTS for the year ended 31 December 2016 US$ 000’s
2 SIGNIFICANT ACCOUNTING POLICIES (continued)
c) Basis of consolidation (continued)
not lead to a control conclusion. Where the Group’s voluntary actions, such as lending amounts in excess of existing liquidity facilities or extending terms beyond those established originally, change the relationship between the Group and an SPE, the Group performs a reassessment of control over the SPE. The Group in its fiduciary capacity manages and administers assets held in trust and other investment vehicles on behalf of investors. The financial statements of these entities are usually not included in these consolidated financial statements. Information about the Group’s fiduciary assets under management is set out in note 25.
(v) Loss of control When the Group losses control over a subsidiary, it derecognises the assets and liabilities of the subsidiary, any non-controlling interests and the other components of equity. Any surplus or deficit arising on the loss of control is recognised in consolidated income statement. Any interest retained in the former subsidiary, is measured at fair value when control is lost. Subsequently it is accounted for as an equity-accounted investee or in accordance with the Group’s accounting policy for investment securities depending on the level of influence retained.
(vi) Investment in associates (Equity-accounted investees) Associates are those entities in which the Group has significant influence, but not control or joint control, over the financial and operating policies. Significant influence is presumed to exits when the Group holds between 20% and 50% of the voting power of another entity.
On initial recognition of an associate, the Group makes an accounting policy choice as to whether the associate shall be equity accounted or designated as at fair value through income statement. The Group makes use of the exemption in FAS 24 – Investment in Associates for venture capital organisation and designates certain of its investment in associates, as ‘investments carried at fair value through income statement’. These investments are managed, evaluated and reported on internally on a fair value basis (refer to note 2 (f)).
If the equity accounting method is chosen for an associate, these are initially recognised at cost and the carrying amount is increased or decreased to recognise the investor’s share of the profit or loss of the investees after the date of acquisition. Distributions received from an investees reduce the carrying amount of the investment. Adjustments to the carrying amount may also be necessary for changes in the investor’s proportionate interest in the investees arising from changes in the investee’s equity. When the Group’s share of losses exceeds its interest in an equity-accounted investees, the Group’s carrying amount is reduced to nil and recognition of further losses is discontinued except to the extent that the Group has incurred legal or constructive obligations or made payments on behalf of the equity-accounted investees. Equity accounting is discontinued when an associate is classified as held-for-sale.
(vii) Transactions eliminated on consolidation and equity accounting Intra-group balances and transactions, and any unrealised income and expenses (except for foreign currency translation gains or losses) from intra-group transactions with subsidiaries are eliminated in preparing the consolidated financial statements. Intra-group gains on transactions between the Group and its equity-accounted investees are eliminated to the extent of the Group’s interest in the investees. Unrealised losses are also eliminated in the same way as unrealised gains, but only to the extent that there is no evidence of impairment. Accounting policies of the subsidiaries and equity- accounted investees have been changed where necessary to ensure consistency with the policies adopted by the Group.
GFH Financial Group BSC 18
NOTES TO THE CONSOLIDATED FINANCIAL STATEMENTS for the year ended 31 December 2016 US$ 000's 2 SIGNIFICANT ACCOUNTING POLICIES (continued)
d) Foreign currency transactions (i) Functional and presentation currency
Items included in the consolidated financial statements are measured using the currency of the primary economic environment in which the entity operates (the functional currency). The consolidated financial statements are presented in US dollars, which is the Group’s functional and presentation currency.
(ii) Transactions and balances
Transactions in foreign currencies are translated into the functional currency using the spot exchange rates prevailing at the dates of the transactions. Monetary assets and liabilities denominated in foreign currencies at the reporting date are translated into the functional currency at the spot exchange rate at the reporting date.
Non-monetary items that are measured based on historical cost in a foreign currency are translated using the spot exchange rate at the date of the transactions. Foreign exchange gains and losses resulting from the settlement of such transactions and from the translation at year-end exchange rates of monetary assets and liabilities denominated in foreign currencies are recognised in the income statement. Translation differences on non-monetary items carried at their fair value, such as certain equity securities measured at fair value through equity, are included in investments fair value reserve.
(iii) Foreign operations The assets and liabilities of foreign operations, including goodwill and fair value adjustments arising on acquisition are translated into US$ at exchange rates at the reporting date. The income and expenses of foreign operations are translated into US$ at the exchange rates at the date of the transactions. Foreign currency differences are accumulated into foreign currency translation reserve in owners’ equity, except to the extent the translation difference is allocated to NCI. When foreign operation is disposed of in its entirety such that control is lost, cumulative amount in the translation reserve is reclassified to consolidated income statement as part of the gain or loss on disposal.
e) Offsetting of financing instruments Financial assets and liabilities are offset and the net amount presented in the consolidated statement of financial position when, and only when, the Group has a legal right to set off the recognised amounts and it intends either to settle on a net basis or to realise the asset and settle the liability simultaneously. Income and expense are presented on a net basis only when permitted under AAOIFI, or for gains and losses arising from a group of similar transactions.
f) Investment securities
Investment securities may comprise of debt and equity instruments, but exclude investment in subsidiaries and equity-accounted investees (note 2 (c)(ii) and (vi)). (i) Classification
The Group segregates its investment securities into debt-type instruments and equity-type instruments. Debt-type instruments Debt-type instruments are investments that provide fixed or determinable payments of profits and capital. Investments in debt-type instruments are classified in the following categories:
GFH Financial Group BSC 19
NOTES TO THE CONSOLIDATED FINANCIAL STATEMENTS for the year ended 31 December 2016 US$ 000's 2 SIGNIFICANT ACCOUNTING POLICIES (continued) (f) Investment securities (continued)
At fair value through income statement (FVTIS) These investments are either not managed on contractual yield basis or designated on initial recognition as FVTIS to avoid any accounting mismatch that would arise on measuring the assets or liabilities or recognising the gains or losses on them on different bases. Currently, the Group does not have any investment under this category. At amortised cost This classification is for debt-type instruments which are not designated as FVTIS and are managed on contractual yield basis. Equity-type instruments Equity-type instruments are investments that do not exhibit features of debt-type instruments and include instruments that evidence a residual interest in the assets of an entity after deducting all its liabilities. Investments in equity type instruments are classified in the following categories: At fair value through income statement (FVTIS) Equity-type instruments classified and measured at FVTIS include investments held-for-trading or designated on initial recognition at FVTIS. Investments are classified as held-for-trading if acquired or originated principally for the purpose of generating a profit from short-term fluctuations in price or dealers margin or that form part of a portfolio where there is an actual pattern of short-term profit taking. The Group currently does not have any of its investments classified as investments held-for-trading purposes. On initial recognition, an equity-type instrument is designated as FVTIS only if the investment is managed and its performance is evaluated and reported internally by the management on a fair value basis.
At fair value through equity (FVTE) Equity-type instruments other than those designated at FVTIS are classified as at fair value through equity. These include investments in certain quoted and unquoted equity securities.
(ii) Recognition and de-recognition Investment securities are recognised at the trade date i.e. the date that the Group commits to purchase or sell the asset, at which date the Group becomes party to the contractual provisions of the instrument. Investment securities are derecognised when the rights to receive cash flows from the financial assets have expired or where the Group has transferred substantially all risk and rewards of ownership.
(iii) Measurement Investment securities are measured initially at fair value plus, except for investment securities carried at FVTIS, transaction costs that are directly attributable to its acquisition or issue.
Subsequent to initial recognition, investments carried at FVTIS and FVTE are re-measured to fair value. Gains and losses arising from a change in the fair value of investments carried at FVTIS are recognised in the consolidated income statement in the period in which they arise. Gains and losses arising from a change in the fair value of investments carried at FVTE are recognised in the consolidated statement of changes in owners equity and presented in a separate investment fair value reserve in equity.
GFH Financial Group BSC 20
NOTES TO THE CONSOLIDATED FINANCIAL STATEMENTS for the year ended 31 December 2016 US$ 000's 2 SIGNIFICANT ACCOUNTING POLICIES (continued) (f) Investment securities (continued)
The fair value gains / (losses) are recognised taking into consideration the split between portions related to owners’ equity and equity of investment account holders. When the investments carried at FVTE are sold, impaired, collected or otherwise disposed of, the cumulative gain or loss previously recognised in the statement of changes in owners’ equity is transferred to the income statement.
Investments at FVTE where the entity is unable to determine a reliable measure of fair value on a continuing basis, such as investments that do not have a quoted market price or there are no other appropriate methods from which to derive reliable fair values, are stated at cost less impairment allowances.
(iv) Measurement principles Amortised cost measurement The amortised cost of a financial asset or liability is the amount at which the financial asset or liability is measured at initial recognition, minus capital repayments, plus or minus the cumulative amortisation using the effective profit method of any difference between the initial amount recognised and the maturity amount, minus any reduction (directly or through use of an allowance account) for impairment or uncollectibility. The calculation of the effective profit rate includes all fees and points paid or received that are an integral part of the effective profit rate. Fair value measurement Fair value is the amount for which an asset could be exchanged, or a liability settled, between knowledgeable, willing parties in an arm’s length transaction on the measurement date. When available, the Group measures the fair value of an instrument using quoted prices in an active market for that instrument. A market is regarded as active if quoted prices are readily and regularly available and represent actual and regularly occurring market transactions on an arm’s length basis. If a market for a financial instrument is not active, the Group establishes fair value using a valuation technique. Valuation techniques include using recent arm’s length transactions between knowledgeable, willing parties (if available), discounted cash flow analyses and other valuation models with accepted economic methodologies for pricing financial instruments.
g) Financing assets
Financing assets comprise Shari’a compliant financing contracts with fixed or determinable payments. These include financing provided through Murabaha, Musharaka, Istisna and Wakala contracts. Financing assets are recognised on the date at which they are originated and are carried at their amortised cost less impairment allowances, if any.
h) Assets acquired for leasing
Assets acquired for leasing (Ijarah Muntahia Bittamleek) comprise finance lease assets which are stated at cost less accumulated depreciation and any impairment in value. Under the terms of lease, the legal title of the asset passes to the lessee at the end of the lease term, provided that all lease instalments are settled. Depreciation is calculated on a straight line basis at rates that systematically reduce the cost of the leased assets over the period of the lease. The Group assesses at each reporting date whether there is objective evidence that the assets acquired for leasing are impaired. Impairment losses are measured as the difference between the carrying amount of the asset (including lease rental receivables) and the estimated recoverable amount. Impairment losses, if any, are recognised in the consolidated income statement.
GFH Financial Group BSC 21
NOTES TO THE CONSOLIDATED FINANCIAL STATEMENTS for the year ended 31 December 2016 US$ 000's 2 SIGNIFICANT ACCOUNTING POLICIES (continued) i) Placements with and from financial and other institutions
These comprise placements made with financial and other institutions or received under shari’a compliant contracts. Placements are usually short term in nature and are stated at their amortised cost.
j) Cash and cash equivalents
For the purpose of consolidated statement of cash flows, cash and cash equivalents comprise cash on hand, bank balances and short-term highly liquid assets (placements with financial institutions) with original maturities of three months or less when acquired that are subject to insignificant risk of changes in their fair value, and are used by the Group in the management of its short-term commitments. Bank balances that are restricted and not available for day to day operations of the Group are not included in cash and cash equivalents.
k) Investment property
Investment property comprise land plots and buildings. Investment property is property held to earn rental income or for capital appreciation or both but not for sale in the ordinary course of business, use in the supply of services or for administrative purposes. Investment property is measured initially at cost, including directly attributable expenses. Subsequent to initial recognition, investment property is carried at cost less accumulated depreciation and accumulated impairment allowances (if any). Land is not depreciated.
A property is transferred to investment property when, there is change in use, evidenced by: (i) end of owner-occupation, for a transfer from owner-occupied property to investment
property; or (ii) (ii) commencement of an operating ijara to another party, for a transfer from a development
property to investment property. Further, an investment property is transferred to development property when, there is a change in use, evidenced by: (i) commencement of own use, for a transfer from investment property to owner-occupied
property; (ii) commencement of development with a view to sale, for a transfer from investment in real
estate to development property.
An investment property is derecognised upon disposal or when the investment property is permanently withdrawn from use and no future economic benefits are expected from the disposal. Any gain or loss arising on derecognition of the property (calculated as the difference between the net disposal proceeds and the carrying amount of the asset) is included in the consolidated income statement in the period in which the property is derecognised.
l) Development properties Development properties are properties held for sale or development and sale in the ordinary course of business. Development properties are measured at the lower of cost and net realisable value.
m) Property, plant and equipment
Property, plant and equipment is stated at cost less accumulated depreciation and accumulated impairment losses, if any. Cost includes the cost of replacing part of the property, plant and equipment and borrowing costs for long-term construction projection if the recognition criteria are met. All other repair and maintenance costs are recognised in the consolidated income statement as incurred.
GFH Financial Group BSC 22
NOTES TO THE CONSOLIDATED FINANCIAL STATEMENTS for the year ended 31 December 2016 US$ 000's 2 SIGNIFICANT ACCOUNTING POLICIES (continued) (m) Property, plant and equipment (continued)
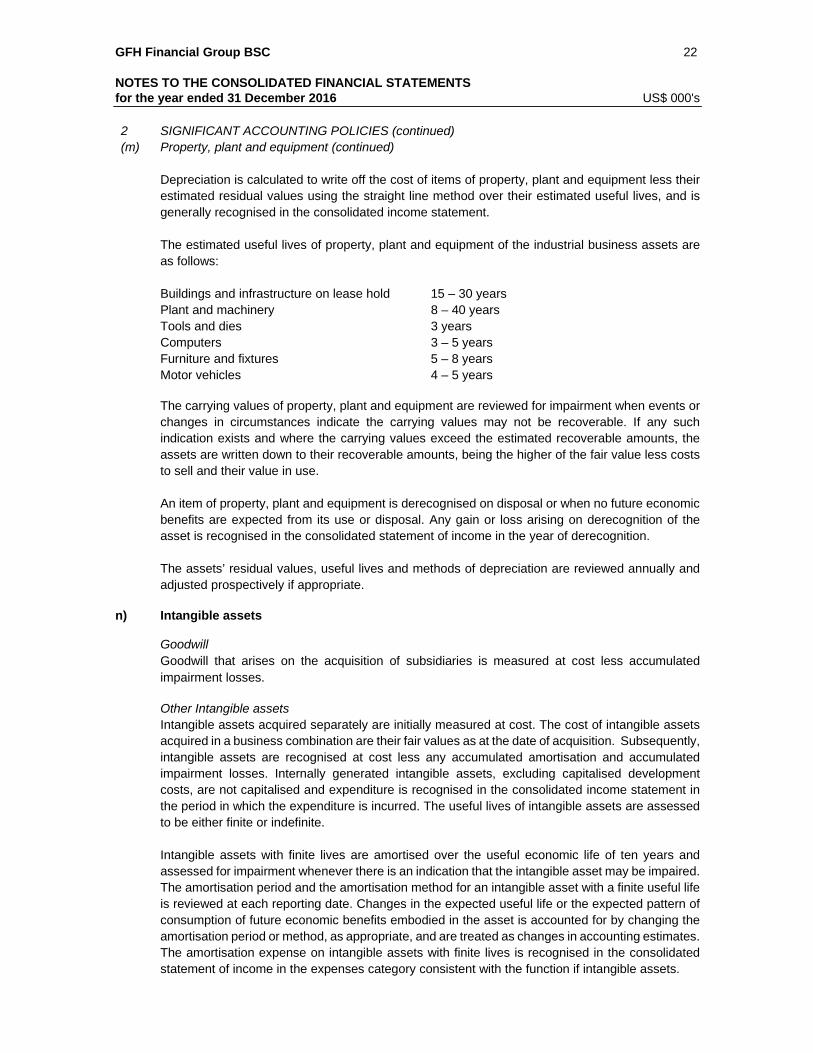
Depreciation is calculated to write off the cost of items of property, plant and equipment less their estimated residual values using the straight line method over their estimated useful lives, and is generally recognised in the consolidated income statement. The estimated useful lives of property, plant and equipment of the industrial business assets are as follows: Buildings and infrastructure on lease hold 15 – 30 years Plant and machinery 8 – 40 years Tools and dies 3 years Computers 3 – 5 years Furniture and fixtures 5 – 8 years Motor vehicles 4 – 5 years
The carrying values of property, plant and equipment are reviewed for impairment when events or changes in circumstances indicate the carrying values may not be recoverable. If any such indication exists and where the carrying values exceed the estimated recoverable amounts, the assets are written down to their recoverable amounts, being the higher of the fair value less costs to sell and their value in use. An item of property, plant and equipment is derecognised on disposal or when no future economic benefits are expected from its use or disposal. Any gain or loss arising on derecognition of the asset is recognised in the consolidated statement of income in the year of derecognition. The assets’ residual values, useful lives and methods of depreciation are reviewed annually and adjusted prospectively if appropriate.
n) Intangible assets Goodwill Goodwill that arises on the acquisition of subsidiaries is measured at cost less accumulated impairment losses. Other Intangible assets Intangible assets acquired separately are initially measured at cost. The cost of intangible assets acquired in a business combination are their fair values as at the date of acquisition. Subsequently, intangible assets are recognised at cost less any accumulated amortisation and accumulated impairment losses. Internally generated intangible assets, excluding capitalised development costs, are not capitalised and expenditure is recognised in the consolidated income statement in the period in which the expenditure is incurred. The useful lives of intangible assets are assessed to be either finite or indefinite. Intangible assets with finite lives are amortised over the useful economic life of ten years and assessed for impairment whenever there is an indication that the intangible asset may be impaired. The amortisation period and the amortisation method for an intangible asset with a finite useful life is reviewed at each reporting date. Changes in the expected useful life or the expected pattern of consumption of future economic benefits embodied in the asset is accounted for by changing the amortisation period or method, as appropriate, and are treated as changes in accounting estimates. The amortisation expense on intangible assets with finite lives is recognised in the consolidated statement of income in the expenses category consistent with the function if intangible assets.
GFH Financial Group BSC 23
NOTES TO THE CONSOLIDATED FINANCIAL STATEMENTS for the year ended 31 December 2016 US$ 000's 2 SIGNIFICANT ACCOUNTING POLICIES (continued) (n) Intangible assets (continued)
Intangible assets with indefinite useful lives are not amortised, but are tested for impairment annually, either individually or at the cash generating unit level. The assessment of indefinite life is reviewed annually to determine whether the indefinite life continues to be supportable. If not, the change in useful life from indefinite to finite is made on a prospective basis. Intangible assets with indefinite useful life consists of a license to construct and operate a cement plant in the Kingdom of Bahrain. Gains or losses arising from derecognition of an intangible asset are measured as the difference between the net disposal proceeds and the carrying amount of the asset and are reocognised in the consolidated statement of income when the asset is derecognised.
o) Impairment of assets The Group assesses at each reporting date whether there is objective evidence that an asset is impaired. Objective evidence that financial assets are impaired can include default or delinquency by a borrower, restructuring of a loan or advance by the Group on terms that the Group would not otherwise consider, indications that a borrower or issuer will enter bankruptcy, the disappearance of an active market for a security, or other observable data relating to a group of assets such as adverse changes in the payment status of borrowers or issuers in the group, or economic conditions that correlate with defaults in the group.
Financial assets carried at amortised cost For financial assets carried at amortised cost, impairment is measured as the difference between the carrying amount of the financial assets and the present value of estimated cash flows discounted at the assets’ original effective profit rate. Losses are recognised in consolidated income statement and reflected in an allowance account. When a subsequent event causes the amount of impairment loss to decrease, the impairment loss is reversed through the consolidated income statement. Investments carried at fair value through equity (FVTE) In the case of equity type instruments carried at fair value through equity, a significant or prolonged decline in the fair value of the security below its cost is objective evidence of impairment resulting in recognition of an impairment loss. If any such evidence exists for equity type instruments, the unrealised re-measurement loss is transferred from equity to the consolidated income statement. Impairment losses recognised in consolidated income statement for an equity investment are reversed directly through equity. For equity type instruments carried at cost due to the absence of reliable fair value, the Group makes an assessment of whether there is an objective evidence of impairment for each investment by assessment of financial and other operating and economic indicators. Impairment is recognised if the expected recoverable amount is assessed to be below the carrying amount of the investment. All impairment losses are recognised in the consolidated income statement and are not reversed subsequently.
GFH Financial Group BSC 24
NOTES TO THE CONSOLIDATED FINANCIAL STATEMENTS for the year ended 31 December 2016 US$ 000's
2 SIGNIFICANT ACCOUNTING POLICIES (continued) (o) Impairment of assets (continued) Other non-financial assets
The carrying amount of the Group’s assets or its cash generating unit, other than financial assets, are reviewed at each reporting date to determine whether there is any indication of impairment. A cash generating unit is the smallest identifiable asset group that generates cash flows that largely are independent from other asset and groups. If any such indication exists, the asset's recoverable amount is estimated. The recoverable amount of an asset or a cash generating unit is the greater of its value in use or fair value less costs to sell. An impairment loss is recognised whenever the carrying amount of an asset or its cash generating unit exceeds its estimated recoverable amount. Impairment losses are recognised in the consolidated income statement. Impairment losses are reversed only if there is an indication that the impairment loss may no longer exist and there has been a change in the estimates used to determine the recoverable amount. Separately recognised goodwill is not amortised and is tested annually for impairment and carried at cost less accumulated impairment losses. Impairment losses on separately recognised goodwill are not reversed.
p) Investors funds These represent funds of projects set-up and promoted by the Group and placed with the Group pending disbursement to the projects concerned and carried at amortised cost.
q) Customers’ current accounts Balances in current (non-investment) accounts are recognised when received by the Group. The transactions are measured at the cash equivalent amount received by the Group at the time of contracting. At the end of the accounting period, the accounts are measured at their book value.
r) Financing liabilities
Financing liabilities represents facilities from financial institution, and financing raised through Sukuk. Financing liabilities are initially measured at fair value plus transaction costs, and subsequently measured at their amortised cost using the effective profit rate method. Financing cost, dividends and losses relating to the financial liabilities are recognised in the consolidated income statement as finance expense. The Group derecognises a financial liability when its contractual obligations are discharged, cancelled or expire. If any financing liability is extinguished by issuing the Bank’s ordinary shares, the Bank recognises the difference between the carrying amount of the financing liability extinguished and fair value of the shares issued in the consolidated income statement. Financing liabilities include compound financial instrument in the form of ‘convertible murabaha’ issued by the Group that can be converted to share capital at the option of the holder. The liability component of a compound financial instrument is recognised initially at the fair value of a similar liability that does not have an equity conversion option. The equity component is recognised initially at the difference between the fair value of the compound financial instrument as a whole and the fair value of the liability component. Any directly attributable transaction costs are allocated to the liability and equity components in proportion to their initial carrying amounts. Subsequent to initial recognition, the liability component of the convertible murabaha is measured at amortised cost using the effective profit rate method. The equity component of a compound financial instrument is not remeasured subsequent to initial recognition.
GFH Financial Group BSC 25
NOTES TO THE CONSOLIDATED FINANCIAL STATEMENTS for the year ended 31 December 2016 US$ 000's
Financial guarantees are contracts that require the Group to make specified payments to reimburse the holder for a loss it incurs because a specified debtor fails to make payment when due in accordance with the terms of a debt instrument. A financial guarantee contract is recognised from the date of its issue. The liability arising from a financial guarantee contract is recognised at the present value of any expected payment to settle the liability, when a payment under the guarantee has become probable. The Group has issued financial guarantees to support its development projects (note 34).
t) Dividends and board remuneration
Dividends to shareholders and board remuneration are recognised as liabilities in the period in which they are declared.
u) Share capital and reserves The Group classifies capital instruments as financial liabilities or equity instruments in accordance with the substance of the contractual terms of the instruments. Equity instruments of the group comprise ordinary shares and equity component of share-based payments and convertible instruments. Incremental costs directly attributable to the issue of an equity instrument are deducted from the initial measurement of the equity instruments.
Treasury shares The amount of consideration paid including all directly attributable costs incurred in connection with the acquisition of the treasury shares are recognised in equity. Consideration received on sale of treasury shares is presented in the financial statements as a change in equity. No gain or loss is recognised on the Group’s consolidated income statement on the sale of treasury shares. Statutory reserve The Bahrain Commercial Companies Law 2001 requires that 10 percent of the annual net profit be appropriated to a statutory reserve which is normally distributable only on dissolution. Appropriations may cease when the reserve reaches 50 percent of the paid up share capital. Appropriation to statutory reserve is made when approved by the shareholders.
v) Equity of investment account holders Equity of investment account holders are funds held by the Group, which it can invest at its own discretion. The investment account holder authorises the Group to invest the account holders’ funds in a manner which the Group deems appropriate without laying down any restrictions as to where, how and for what purpose the funds should be invested. The Group charges management fee (Mudarib fees) to investment account holders. Of the total income from investment accounts, the income attributable to customers is allocated to investment accounts after setting aside provisions, reserves and deducting the Group’s share of income. The allocation of income is determined by the management of the Group within the allowed profit sharing limits as per the terms and conditions of the investment accounts. Administrative expenses incurred in connection with the management of the funds are borne directly by the Group and are not charged separately to investment accounts. Equity of Investment account holders are carried at their book values and include amounts retained towards profit equalisation and investment risk reserves.
GFH Financial Group BSC 26
NOTES TO THE CONSOLIDATED FINANCIAL STATEMENTS for the year ended 31 December 2016 US$ 000's 2 SIGNIFICANT ACCOUNTING POLICIES (continued) (u) Equity of investment account holders (continued)
Profit equalisation reserve is the amount appropriated by the Bank out of the Mudaraba income, before allocating the Mudarib share, in order to maintain a certain level of return to the deposit holders on the investments. Investment risk reserve is the amount appropriated by the Bank out of the income of investment account holders, after allocating the Mudarib share, in order to cater against future losses for investment account holders. Creation of these reserves results in an increase in the liability towards the pool of investment accounts holders.
Restricted investment accounts Restricted investment accounts represents assets acquired by funds provided by holders of restricted investment accounts and their equivalent and managed by the Group as an investment manager based on either a Mudaraba contract or agency contract. The restricted investment accounts are exclusively restricted for investment in specified projects as directed by the investments account holders. Assets that are held in such capacity are not included as assets of the Group in the consolidated financial statements.
w) Assets held-for-sale and discounted operations i) Classification
The Group classifies non-current assets or disposal groups as held-for-sale if its carrying amount is expected to be recovered principally through a sale transaction rather than through continuing use within twelve months. A disposal group is a group of assets to be disposed of, by sale or otherwise, together as a group in a single transaction, and liabilities directly associated with those assets that will be transferred in the transaction. A subsidiary acquired exclusively with a view to resale is initially recognised at its fair value less costs to sell and is classified as disposal group and income and expense from its operations are presented as part of discontinued operation. If the criteria for classification as held- for- sale are no longer met, the entity shall cease to classify the asset (or disposal group) as held- for- sale and shall measure the asset at the lower of its carrying amount before the asset (or disposal group) was classified as held-for-sale, adjusted for any depreciation, amortisation, equity accounting adjustments or revaluations that would have been recognised had the asset (or disposal group) not been classified as held-for-sale and its recoverable amount at the date of the subsequent decision not to sell.
ii) Measurement
Non-current assets or disposal groups classified as held-for-sale, other than financial instruments, are measured at the lower of its carrying amount and fair value less costs to sell. Financial instruments that are non-current assets and ‘held-for-sale’ continue to be measured in accordance with their stated accounting policies. On classification of equity-accounted investee as held-for-sale, equity accounting is ceased at the time of such classification as held-for-sale. Any impairment loss on a disposal group is allocated first to goodwill, and then to the remaining assets and liabilities on a pro rata basis, except that no loss is allocated to financial assets and investment property carried at fair value, which continue to be measured in accordance with the Group’s other accounting policies. Impairment losses on initial classification as held-for-sale and subsequent gains and losses on remeasurement are recognised in the consolidated income statement. Gains are not recognised in excess of any cumulative impairment loss.
GFH Financial Group BSC 27
NOTES TO THE CONSOLIDATED FINANCIAL STATEMENTS for the year ended 31 December 2016 US$ 000's
iii) Discontinued operations A discontinued operation is a component of the Group’s business, the operations and cash flows of which can be clearly distinguished from the rest of the Group and which: represents a separate major line of business or geographical area of operations; is part of a single co-ordinated plan to dispose of a separate major line of business or
geographical area of operations; or is a subsidiary acquired exclusively with a view to re-sale.
Classification as a discontinued operation occurs on disposal or when the operation meets the criteria to be classified as held-for-sale, if earlier. When an operation is classified as a discontinued operation, the comparative consolidated income statement is re-presented as if the operation had been discontinued from the start of the comparative year.
x) Revenue recognition
Revenue is measured at the fair value of consideration received or receivable. Revenue is recognised to the extent that it is probable that future economic benefits associated with the item of revenue will flow to the Group, the revenue can be measured with reliability and specific criteria have been met for each of the Group’s activities as described below:
Banking business
Commission income
Income from placements with / from financial institutions are recognised on a time-apportioned basis over the period of the related contract using the effective profit rate.
Dividend income from investment securities is recognised when the right to receive is established. This is usually the ex-dividend date for equity securities.
Finance income / expenses are recognised using the amortised cost method at the effective profit rate of the financial asset / liability.
Fees and commission income that are integral to the effective profit rate on a financial asset carried at amortised cost are included in the measurement of the effective profit rate of the financial asset. Other fees and commission income, including account servicing fees, sales commission, management fees, placement and arrangement fees and syndication fees, are recognised as the related services are performed.
Income from Murabaha and Wakala contracts are recognised on a time-apportioned basis over the period of the contract using the effective profit method.
Profit or losses in respect of the Bank’s share in Musharaka financing transaction that commence and end during a single financial period is recognised in the income statement at the time of liquidation (closure of the contract). Where the Musharaka financing continues for more than one financial period, profit is recognised to the extent that such profits are being distributed during that period in accordance with profit sharing ratio as stipulated in the Musharaka agreement.
Income from assets acquired for leasing (Ijarah Muntahia Bittamleek) are recognised proportionately over the lease term.
Income from sukuk and income / expenses on placements is recognised at its effective profit rate over the term of the instrument.
GFH Financial Group BSC 28
NOTES TO THE CONSOLIDATED FINANCIAL STATEMENTS for the year ended 31 December 2016 US$ 000's 2 SIGNIFICANT ACCOUNTING POLICIES (continued) (w) Revenue recognition (continued)
Non banking business Revenue from the sale of goods is recognised when customer takes possession. Revenue from rendering of services is recognised when services are rendered.
y) Earnings prohibited by Shari’a
The Group is committed to avoid recognising any income generated from non-Islamic sources. Accordingly, all non-Islamic income is credited to a charity account where the Group uses these funds for charitable means.
z) Zakah
Pursuant to the decision of the shareholders’, the Group is required to pay Zakah on its undistributed profits. The Group is also required to calculate and notify, under a separate report, individual shareholders of their pro-rata share of the Zakah payable by them on distributed profits. These calculations are approved by the Group’s Shari’a Supervisory Board.
aa) Employees benefits
(i) Short-term benefits Short-term employee benefit obligations are measured on an undiscounted basis and are expensed as the related service is provided. A provision is recognised for the amount expected to be paid under short-term cash bonus or profit-sharing plans if the Group has a present legal or constructive obligation to pay this amount as a result of past service provided by the employee and the obligation can be estimated reliably. Termination benefits are recognised as an expense when the Group is committed demonstrably, without realistic possibility of withdrawal, to a formal detailed plan to either terminate employment before the normal retirement date, or to provide termination benefits as a result of an offer made to encourage voluntary redundancy.
(ii) Post employment benefits
Pensions and other social benefits for Bahraini employees are covered by the Social Insurance Organisation scheme, which is a “defined contribution scheme” in nature under, and to which employees and employers contribute monthly on a fixed-percentage-of-salaries basis. Contributions by the Bank are recognised as an expense in consolidated income statement when they are due.
Expatriate and certain Bahraini employees on fixed contracts are entitled to leaving indemnities payable, based on length of service and final remuneration. Provision for this unfunded commitment, has been made by calculating the notional liability had all employees left at the reporting date. These benefits are in the nature of a “defined benefit scheme” and any increase or decrease in the benefit obligation is recognised in the consolidated income statement.
GFH Financial Group BSC 29
NOTES TO THE CONSOLIDATED FINANCIAL STATEMENTS for the year ended 31 December 2016 US$ 000's 2 SIGNIFICANT ACCOUNTING POLICIES (continued) (z) Employment benefits (continued) (ii) Post employment benefits (continued)
The Group also operates a voluntary employees saving scheme under which the Group and the employee contribute monthly on a fixed percentage of salaries basis. The scheme is managed and administered by a board of trustees who are employees of the Group. The scheme is in the nature of a defined contribution scheme and contributions by the Group are recognised as an expense in the consolidated income statement when they are due.
(iii) Share-based employee incentive scheme
The Bank operates a share-based incentive scheme for its employees (the “Scheme”) whereby employee are granted the Bank’s shares as compensation on achievement of certain non-market based performance conditions and service conditions (the ‘vesting conditions’).
The grant date fair value of equity instruments granted to employees is recognised as an employee expense, with a corresponding increase in equity over the period in which the employees become unconditionally entitled to the share awards.
Non-vesting conditions are taken into account when estimating the fair value of the equity instrument but are not considered for the purpose of estimating the number of equity instruments that will vest. Service and non-market performance conditions attached to the transactions are not taken into account in determining fair value but are considered for the purpose of estimating the number of equity instruments that will vest. The amount recognised as an expense is adjusted to reflect the number of share awards for which the related service and non-market performance vesting conditions are expected to be met, such that the amount ultimately recognised as an expense is based on the number of share awards that do meet the related service and non-market performance conditions at the vesting date. Amount recognised as expense are not trued-up for failure to satisfy a market condition.
bb) Provisions A provision is recognised if, as a result of a past event, the Group has a present legal or constructive obligation that can be estimated reliably, and it is probable that an outflow of economic benefits will be required to settle the obligation.
cc) Onerous contracts A provision for onerous contracts is recognised when the expected benefits to be derived by the Group from the contract are lower than the unavoidable cost of meeting its obligations under the contract. The provision is measured at the present value of the lower of the expected cost of terminating the contract and the expected net cost of continuing with the contract.
dd) Trade date accounting All “regular way” purchases and sales of financial assets are recognised on the trade date, i.e. the date that the Group commits to purchase or sell the asset.
ee) Investment account holder protection scheme Funds held with the Group in unrestricted investment accounts and current accounts of its retail banking subsidiary are covered by the Deposit Protection Scheme (the Scheme) established by the Central Bank of Bahrain regulation in accordance with Resolution No (34) of 2010. The Scheme applies to all eligible accounts held with the retail bank subject to certain specific exclusions, maximum total amount entitled and other regulations concerning the establishment of a Deposit Protection Scheme and a Deposit Protection Board.
GFH Financial Group BSC 30
NOTES TO THE CONSOLIDATED FINANCIAL STATEMENTS for the year ended 31 December 2016 US$ 000's 3 CRITICAL ACCOUNTING ESTIMATES AND JUDGEMENTS IN APPLYING ACCOUNTING
POLICIES The Group makes estimates and assumptions that effect the reported amounts of assets and liabilities within the next financial year. Estimates and judgements are continually evaluated and are based on historical experience and other factors, including expectation of future events that are believed to be reasonable under the circumstances. Judgements (i) Classification of investments
In the process of applying the Group’s accounting policies, management decides on acquisition of an investment whether it should be classified as investments carried at fair value through income statement or investments carried at fair value through equity or investments carried at amortised cost. The classification of each investment reflects the management’s intention in relation to each investment and is subject to different accounting treatments based on such classification (note 2 (f)).
(ii) Special purpose entities The Group sponsors the formation of special purpose entities (SPE’s) primarily for the purpose of allowing clients to hold investments. The Group provides corporate administration, investment management and advisory services to these SPE’s, which involve the Group making decisions on behalf of such entities. The Group administers and manages these entities on behalf of its clients, who are by and large third parties and are the economic beneficiaries of the underlying investments. The Group does not consolidate SPE’s that it does not have the power to control. In determining whether the Group has the power to control an SPE, judgements are made about the objectives of the SPE’s activities, its exposure to the risks and rewards, as well as about the Group intention and ability to make operational decisions for the SPE and whether the Group derives benefits from such decisions.
(iii) Classification as held-for-sale The Group classifies non-current assets (or disposal group) as held-for-sale when the carrying amount will be recovered principally through a sale transaction rather than continuing use. In such case, the asset is available for immediate sale in its present condition subject to only to terms that are usual and customary for sale of such assets and the sale is highly probable. Further, the asset is actively marketed for sale at a price that is reasonable in relation to its current fair value.
Estimations (i) Fair value of investments
The Group determines fair value of investments designated at fair value that are not quoted in active markets by using valuation techniques such as discounted cash flows and recent transaction prices. Fair value estimates are made at a specific point in time, based on market conditions and information about the investee companies. These estimates are subjective in nature and involve uncertainties and matters of significant judgement and therefore, cannot be determined with precision. There is no certainty about future events (such as continued operating profits and financial strengths). It is reasonably possible, based on existing knowledge, that outcomes within the next financial year that are different from assumptions could require a material adjustment to the carrying amount of the investments. In case where discounted cash flow models have been used to estimate fair values, the future cash flows have been estimated by the management based on information from and discussions with representatives of investee companies, and based on the latest available audited and un-audited financial statements. The basis of valuation have been reviewed by the Management in terms of the appropriateness of the methodology, soundness of assumptions and correctness of calculations and have been approved by the Board of Directors for inclusion in the consolidated financial statements.
GFH Financial Group BSC 31
NOTES TO THE CONSOLIDATED FINANCIAL STATEMENTS for the year ended 31 December 2016 US$ 000's 3 CRITICAL ACCOUNTING ESTIMATES AND JUDGEMENTS IN APPLYING ACCOUNTING
POLICIES (continued)
(ii) Impairment on investments carried at fair value carried through equity The Group determines that investments carried at fair value through equity are impaired when there has been a significant or prolonged decline in the fair value below their cost. This determination of what is significant or prolonged requires judgment. In the case of quoted equity securities in active markets, the Group generally considers a decline in value below cost of 30%, or a decline that persists for more than 9 months as an indicator of impairment. In the case where markets for the investment are assessed to be inactive, the Group determines impairment based on its assessment of the investee companies’ financial health, industry and sector performance. Equity-type instruments classified as investments at FVTE but carried at cost less impairment due to the absence of reliable measure of fair value are tested for impairment. A significant portion of the Group’s equity-type investments comprise investments in real estate and infrastructure development projects (2016: US$392,004 thousand; 2015: US$ 288,099 thousand). In making an assessment of impairment, the Group evaluates among other factors, ease of raising liquidity for the project, evidence of a deterioration in the financial health of the project, impacts of delays in execution, industry and sector performance, and operational and financing cash flows. The Group has exposures to investments and projects that operate in countries and geographies where business and political environment are subject to rapid changes. The performance of the investments and recoverability of exposures is based on condition prevailing and information available with management as at the reporting date. It is the management’s opinion that the current level of provisions are adequate and reflect prevailing conditions, long term asset objectives and available information. It is reasonably possible, based on existing knowledge, that the current assessment of impairment could require a material adjustment to the carrying amount of the investments within the next financial year due to significant changes in the assumptions underlying such assessments.
(iii) Impairment of investment property The Group conducts impairment assessment of investment property periodically using external independent property valuers to value the property. The fair value is determined based on the market value of the property either by comparable method or the residual value basis to assess the market value of the sites considering its current physical condition. The Group’s investment property are situated in Bahrain, UAE and Morocco. Given the dislocation in the local property market and infrequent property transactions, it is reasonably possible, based on existing knowledge, that the current assessment of impairment could require a material adjustment to the carrying amount of these assets within the next financial year due to significant changes in assumptions underlying such assessments.
(iv) Impairment of other receivables
Each counterparty exposure is evaluated individually for impairment and is based upon management’s best estimate of the present value of the cash flows that are expected to be received. In estimating these cash flows, management makes judgements about a counterparty’s financial situation. Each impaired asset is assessed on its merits, and the workout strategy and estimate of cash flows considered recoverable are independently evaluated by the Risk Management Department.
(v) Impairment of financing assets
Each counterparty exposure is evaluated individually for impairment and is based upon management’s best estimate of the present value of the cash flows that are expected to be received. In estimating these cash flows, management makes judgements about a counterparty’s financial situation and the net realisable value of any underlying assets / collaterals.
GFH Financial Group BSC 32
NOTES TO THE CONSOLIDATED FINANCIAL STATEMENTS for the year ended 31 December 2016 US$ 000's 3 CRITICAL ACCOUNTING ESTIMATES AND JUDGEMENTS IN APPLYING ACCOUNTING
POLICIES (continued) Each impaired asset is assessed on its merits, and the workout strategy and estimate of cash flows considered recoverable are independently evaluated by the Risk Management Department. For the purposes of a collective evaluation of impairment, financing assets are grouped on the basis of similar credit risk characteristics (that is, on the basis of the Group’s grading process that considers asset type, industry, geographical location, collateral type, past-due status and other relevant factors). The methodology and assumptions used for the grading process and estimating both the amount and timing of future cash flows are reviewed regularly to reduce any differences between loss estimates and actual loss experience. In view of the management, the current level of provisioning is adequate and no additional impairment allowances are required on a collective basis.
(vi) Impairment of other non-financial assets and cash generating units Investment in associates and recognised goodwill are subject to an impairment based on indicators of performance and market conditions. Cash generating units include the Group’s investments in certain subsidiaries and equity-accounted investees and investment property that generate cash flows that are largely independent from other assets and activities of the Group. The basis of impairment assessment for such cash generating units is described in accounting policy note 2 (o). For equity-accounted investees with indicators of impairment, the recoverable amounts is determined based on fair value less costs to sell (FVLCTS). FVLCTS for the equity-accounted investees was determined using a combination of income and market approaches of valuations.
The objective of valuation techniques is to arrive at a fair value that reflects the price of the financial instrument at the reporting date that would have been determined by market participants acting at arm’s length.
(vii) Estimating net realisable value of development property Development property is stated at lower of cost and net realisable value. Net realisable value is the estimated selling price in the ordinary course of business less estimated selling expenses. The management has forecasted the cost of completion of development property and has engaged independent valuers to estimate the residual value of the development property based on estimated market selling prices for similar properties. Net realisable value estimates are made at a specific point in time, based on market conditions and information about the expected use of development property. These estimates involve uncertainties and matters of significant judgement and therefore, cannot be determined with precision. There is no certainty about future events. It is reasonably possible, based on existing knowledge, that outcomes within the next financial year that are different from assumptions could require a material adjustment to the carrying amount of the development property.
GFH Financial Group BSC 33
NOTES TO THE CONSOLIDATED FINANCIAL STATEMENTS for the year ended 31 December 2016 US$ 000's
4 CASH AND BANK BALANCES
31 December 2016
31 December 2015
Cash 18,271 17,302Balance with banks 53,281 40,195Balance with Central Bank of Bahrain - Current account 32,230 14,615- Reserve account 52,666 50,053 156,448
122,165
The reserve account with the Central Bank of Bahrain is not available for day-to-day operation of the Group.
a) Equity type investments - At fair value through income statement
2016 2015 At 1 January 60,724 85,896 Acquisitions during the year - 10,408 Fair value changes (2,050) (1,724) Disposals during the year, at carrying value (18,117) (33,856)
At 31 December 40,557 60,724
b) Equity type investments - At fair value through equity
2016 2015 At 1 January 344,206 314,426 Acquisitions arising from settlement (note 19) 8,800 75,273 Purchase during the year 43,885 Fair value changes - (228) Disposals during the year, at carrying value (46,594) (36,425) Impairment charge for the year (61,041) (8,840)
At 31 December 289,256 344,206
Unquoted equity securities US$ 287,180 thousand (2015: US$ 326,991 thousand) classified at fair value through equity, but measured at cost less impairment in the absence of reliable measure of fair value, are primarily investment in equities of companies carrying out real estate and infrastructure development projects in different countries. The Group plans to exit these investments principally by means of strategic sell outs or sale of underlying assets.
GFH Financial Group BSC 35
NOTES TO THE CONSOLIDATED FINANCIAL STATEMENTS for the year ended 31 December 2016 US$ 000's
6 INVESTMENT SECURITIES (continued)
During the year, the Group recognised impairment of US$ 60,817 (2015: US$ 8,840 thousand) on such assets. Impairment allowance has been established based on management’s assessment of the current market conditions, the marketability of the investments and the assessment of recoverable amounts.
7 INVESTMENT PROPERTY
2016 2015
At 1 January 257,932 313,635 Acquisitions arising from settlement (note 19) 207,707 - Additions during the year 53,827 - Transfer to development property 19,395 (55,927) Other charges - 224 Disposals (38,825) - Impairment charge (note 23) (11,600) - At 31 December 488,436 257,932
Investment property includes land plots and buildings in Bahrain, UAE and Morocco. Investment property of carrying amount of US$ 160.70 million (2015: US$ 137 million) is pledged against Wakala facilities (note 13). Investment property of carrying amount of US$ 46.84 million is pledged against an Ijarah facility (note 13). Investment property of carrying amount of US$ 31.5 million is pledged against Sukuk liability (note 13). The fair value of the Group's investment property at 31 December 2016 was US$ 521,187 thousand (31 December 2015: US$ 273, 370 thousand) based on a valuation carried out by an independent third party external valuers who have recent experience in the location and category of the asset being valued.
8 DEVELOPMENT PROPERTIES
Development properties represents development assets (lands) in UAE, Bahrain and North Africa. The land has been held for development and sale in the normal course of business. Development property of US$ 42.3 million is pledged against a Wakala facility (note 13).
2016 2015
At 1 January 179,577 131,317 Acquisitions arising from settlement (note 19) 125,512 - Additions during the year - 67,181Transfer to investment property (19,395) - Disposals (4,722) (18,921) At 31 December 280,972 179,577
GFH Financial Group BSC 36
NOTES TO THE CONSOLIDATED FINANCIAL STATEMENTS for the year ended 31 December 2016 US$ 000's
9 EQUITY-ACCOUNTED INVESTEES
Equity-accounted investees represents investments in: Name Country of
incorporation % holding Nature of business
2016 2015 Falcon Cement Company BSC (c)
Kingdom of Bahrain
32% 32% Manufacturing and trading of cement
United Arab Cement Company J.S.C.
Syrian Arab Republic
38.9% 38.9% Manufacturing of cement
Libya Investment Company
Cayman Islands
38.9% 38.9% Holding company
Amlak II SPV Cayman Islands
23.51% 23.51% Purchase and sale of real estate in the Kingdom of Bahrain
Bahrain Aluminium Extrusion Company B.S.C. (c) (Balexco)
Kingdom of Bahrain
18% 18% Extrusion and sale of aluminium products
Global Banking Corporation BSC (c)
Kingdom of Bahrain
20% - Islamic wholesale banking
Ensha Development Company
Kingdom of Bahrain
33.33% - Holding plot of land in Kingdom of Bahrain.
The movement in equity-accounted investees is given below:
2016 2015 At 1 January 81,274 21,173 Acquisitions from settlement (note 19) 27,900 -Additions during the year 5,454 78,802 Share of profit for the year 846 3,025 Impairment charge for the year (note 23) (36,464) - Derecognition on loss of control - (21,726) At 31 December 79,010 81,274
Equity-accounted investees includes the Group’s investment of less than 20% in Balexco. As the Group exercises significant influence over the financial institution through contractual terms and by way of its presence on the board of directors, the investment is accounted for as an investment in equity-accounted investee. Summarised financial information of associates that have been equity-accounted not adjusted for the percentage ownership held by the Group (based on most recent management accounts):
2016 2015 Total assets 344,908 88,641 Total liabilities 111,448 38,661 Total revenues 66,563 29,178 Total net profit 5,981 5,743
GFH Financial Group BSC 37
NOTES TO THE CONSOLIDATED FINANCIAL STATEMENTS for the year ended 31 December 2016 US$ 000's
10 PROPERTY, PLANT AND EQUIPMENT
Buildings and
Infrastructure
on leasehold Plant and Tools and Furniture Motor Capital 2016 2015
Land Land machinery dies Computers and fixtures Vehicles WIP Total Total Cost:
At 1 January 17,809 - - - 19,317 24,456 1,474 1,335 64,391 270,950 Acquired in a business combination (note 19) 22,242 85,927 535 - - 6,342 25,348 5,481 145,875 -
Disposals - (1,308) - - - (379) - (467) (2,154) (2,270) Derecognition on loss of control - - - - - - - - - (211,566)
At 31 December 40,051 84,619 535 - 19,804 31,350 26,880 8,487 211,726 64,391 Accumulated depreciation:
At 1 January - - - - 17,471 20,427 891 - 38,789 104,575 Charge for the year - 1,454 - - 1,049 1,214 67 - 3,784 2,994 Foreign exchange difference - - - - - - - - - (1) Derecognition on loss of control - - - - - - - - - (68,779)
At 31 December - 1,454 - - 18,520 21,641 958 - 42,573 38,789 Net book value:
At 31 December 40,051 83,165 535 - 1,284 9,709 25,922 8,487 169,153 25,602
GFH Financial Group BSC 38
NOTES TO THE CONSOLIDATED FINANCIAL STATEMENTS for the year ended 31 December 2016 US$ 000's
11 OTHER ASSETS
31 December 2016
31 December 2015
Investment banking receivables 11,396 41,958
Financing to projects, net * 6,442 79,997
Reimbursement right - 35,000Receivable from sale of investment properties
- Investment securities - Investment properties - Development properties
- 37,952 10,000
992-
10,000
Advances and deposits 19,711 20,198
Employee receivables 19,786 14,008
Income from Sukuk receivable 3,902 3,481
Lease rentals receivable 6,825 3,419
Prepayments and other receivables 9,629 39,107
125,643 248,160
During the year, the Group recognised US$ 51,500 thousand (31 December 2015: US$ 4,500 thousand) and US$ 20,714 thousand (2015: Nil) impairment allowance on financing to projects and other receivables respectively (note 23).
12 PLACEMENTS FROM FINANCIAL INSITUTIONS, OTHER ENTITIES AND INDIVIDUALS
These comprise placements in the form of murabaha and wakala contracts accepted from financial and other institutions (including corporates and individuals) as part of the Group’s treasury activities. This includes US$ 84 million of funds placed by a non-financial entity which were subject to regulatory sanctions. During the year, these regulatory sanctions have been formally lifted.
NOTES TO THE CONSOLIDATED FINANCIAL STATEMENTS for the year ended 31 December 2016 US$ 000's
13 FINANCING LIABILITIES (continued)
Murabaha financing Murabaha financing comprised medium-term financing from a syndicate of banks to be repaid over 6 years on semi-annual basis commencing from August 2014. The revised profit rate on the facility is 6 months LIBOR plus margin (subject to a minimum of 5%). The Murabaha financing facilities secured by a pledge over the Group’s investment in a subsidiary of carrying value of US$ 143 million and investment property of carrying value of US$ 24.6 million. During the year, the murabaha financing was fulling repaid. Wakala financing Wakala financing (i) (2016) Wakala financing comprise of a facility from a financial institution. The facility is for an amount of US$ 35 million, repayable over a period of 3 years annually from November 2017 till November 2019 at a profit rate of LIBOR plus margin of 7.65% (subject to a minimum of 8%). The facility is secured by a pledge over the Group’s development property of carrying value of US$ 42.3 million and investment property of carrying value of US$ 24.7 million. Wakala financing (ii) (2009) Wakala financing comprise is a syndicate facility from a number of financial institutions. Wakala financing is repayable over a period of six years till April 2019 at an agreed profit rate of 6%. The Wakala financing facility is secured by a pledge over the Group’s investment property having a carrying value of US$ 136 million (note 7). Sukuk liability The Sukuk is backed by a pool of assets of the Group and has a liquidity facility provided by the Bank to support timely payments of distributions. The Sukuk were traded on the London Stock Exchange’s Gilt Edged and Fixed Interest Market. Currently, the Sukuk are suspended from trading. The Sukuk is repayable over a period of 6 years with semi-annual repayment starting from July 2014, with final instalment in July 2018. The Sukuk carry a profit rate of LIBOR plus a margin of 3%, with a minimum profit rate of 5%. The Sukuk Certificates are backed by the Group’s investment securities with carrying values of US$ 92.94 million (31 December 2015: 92.94 million) and an investment property with carrying value of US$ 31.5 million (31 December 2015: US$ 31.5 million)
Ijarah facility Represents facility from a financial institution for acquisition of a property repayable over a period of 8 years at a yield rate of 7% p.a.. The Ijarah is for an investment property of the Group with a carrying value of US$ 46.84 million. Other borrowings These comprise financing availed by subsidiaries relating to project development and working capital requirements.
GFH Financial Group BSC 40
NOTES TO THE CONSOLIDATED FINANCIAL STATEMENTS for the year ended 31 December 2016 US$ 000's
14 OTHER LIABILITIES
31 December 2016
31 December 2015
Employee related accruals 25,179 3,430Unclaimed dividends 5,844 5,861Mudaraba profit accrual 7,812 7,509Provision for employees’ leaving indemnities 3,109 1,999Zakah and Charity fund (page 14) 2,160 2,675Provision against financial guarantees - 35,000Accounts payable 48,177 64,266Accrued expenses and other payables 90,368 15,237 182,649 135,977
15 EQUITY OF INVESTMENT ACCOUNT HOLDERS (EIAH)
The funds received from investment account holders have been commingled and jointly invested with the Group
in the following asset classes as at 31 December: 31 December
2016 31 December
2015 Balances with banks 45,389 27,549 CBB reserve account 52,666 50,053 Placements with financial institutions 157,635 116,586 Debt type instruments – sukuk 197,390 168,523 Financing assets 569,110 582,204
1,022,190 944,915
The investors’ share of the return on jointly invested assets and distribution to investment account holders were as follows: 2016 2015 Returns from jointly invested assets (43,200) 43,598 Banks share as Mudarib 24,219 (25,334) Return to investment account holders 18,981 18,264
The average gross rate of return in respect of unrestricted investment accounts was 4.39% for 2016 (2015: 4.74%). Approximately 1.93% (2015: 1.99%) was distributed to investors and the balance was either set aside for provisions and/or retained by the Group as a Mudarib fee. Unrestricted investment accounts include profit equalisation reserve of US$ 7 thousand (2015: US$ 7 thousand) and investment risks reserve of US$ 3 thousand (2015: US$ 3 thousand).
GFH Financial Group BSC 41
NOTES TO THE CONSOLIDATED FINANCIAL STATEMENTS for the year ended 31 December 2016 US$ 000's
16 SHARE CAPITAL
Authorised: 31 December
2016 31 December
2015
5,660,377,358 shares of US$ 0.265 each (2015: 5,660,377,358 shares of US$ 0.265 each) 1,500,000
1,500,000
Issued and fully paid up:
2,256,583,403 shares of US$ 0.265 each (2015: 2,256,583,403 shares of US$ 0.265 each) 597,995
597,995 The movement in the share capital during the year is as follows: 2016 2015
At 1 January 597,995 1,253,626
Conversion of murabaha to share capital - 241,361
Capital reduction - (896,992)
At 31 December 597,995 597,995
At 31 December 2016, the Bank held 2,211,891 (31 December 2015: 24,503,697) treasury shares.
Additional information on shareholding pattern (i) The Bank has only one class of equity shares and the holders of these shares have equal voting
rights.
(ii) Distribution schedule of equity shares, setting out the number of holders and percentage in the following categories: Categories*
Number of shares
Number of shareholders
% of total outstanding
shares Less than 1% 1,324,537,256 6,988 58.70 1% up to less than 5% 459,380,975 10 20.36 5% to less than 10% 170,674,221 1 7.56 10% to less than 20% 301,990,951 1 13.38 Total 2,256,583,403 7,000 100
* Expressed as a percentage of total outstanding shares of the Bank.
(iii) As at 31 December 2016, the shareholders who hold more than 5% of the total outstanding
shares are as below:
Shareholder name
Number of shares
% of total outstanding
shares Integrated Capital PJSC 301,990,951 13.38 Mohammed Ahmed Saeed Al-Qassmi 170,674,221 7.56
GFH Financial Group BSC 42
NOTES TO THE CONSOLIDATED FINANCIAL STATEMENTS for the year ended 31 December 2016 US$ 000's
17 SHARE GRANT RESERVE
2016 2015 At 1 January 893 1,129
Vesting expense, net of forfeiture (note 21) 9 (236) At 31 December 902 893
18 INCOME FROM INVESTMENT SECURITIES
2016 2015
Dividend income 1,728 1,601Gain on disposal of investment securities 1,417 3,592Fair value changes of investments carried at fair value through income statement (7,220)
(2,135)
Income from sukuk 7,963 9,767 3,888 12,825
19 INCOME FROM SETTLEMENT OF LITIGATIONS Until recently, the Group was a plaintiff and defendant in a number of court cases in connection with previous investment transactions and dealings. During the year, the Group’s Board of Directors agreed a full and final out of court settlement with the various counterparties involved. Due to contractual restrictions on disclosures, the Board of Directors is unable to disclose any further information. The settlement has resulted in the Group receiving assets in the form of real estate properties, unquoted equity securities, investment in associates and operating businesses (subsidiaries). The details are set out below:
% of interests
Value of assets
acquired (USD 000’s)
Development properties 118,000Investment properties 207,707Liabilities associated with acquisition of investment properties (15,000)Unquoted equity securities 8,800Investment in associates (in Bahrain)
27,900Global Banking Corporation BSC (c) 20% Ensha Development Company 33.33% Investment in subsidiaries (in Bahrain) * (note 1)
117,160
AlAreen Leisure & Tourism Company, The Lost Paradise of Dilmun SPC (LPOD)
100%
AlAreen Hotels SPC (Hotels) 100% AlAreen Project companies 100% British School of Bahrain (BSB) 100% Total 464,567
* Investment in subsidiaries were acquired through acquisition of various intermediate holding vehicles. The names disclosed refer to the underlying operating entities.
GFH Financial Group BSC 43
NOTES TO THE CONSOLIDATED FINANCIAL STATEMENTS for the year ended 31 December 2016 US$ 000's
19 INCOME FROM SETTLEMENT OF LITIGATIONS (continued)
The total fair value of real estate properties, unquoted investment securities, investment in equity-accounted investees and businesses acquired were recognised in the consolidated income statement under “Income from settlement of litigations”. The fair values were determined by independent external professional firms using a combination of market and income approaches, as appropriate for each asset.
Acquisition of businesses/ subsidiaries Acquiring control of the businesses/ subsidiaries referred to above resulted in a business combination and accordingly the entities were consolidated with the Group from 1 October 2016, being the effective accounting date of obtaining control. Consideration As there was no consideration transferred by the Group in the business combination, the Group has considered the fair value of assets received as consideration for the purpose of acquisition-date fair value of the interests acquired in the above entities. Provisional assessment of identifiable assets acquired and liabilities assumed The fair value of assets and liabilities have been reported on a provisional basis as permitted by IFRS 3 ‘Business Combinations’ for the purpose of recognition of the business combination. If new information, obtained within one year from the acquisition date about facts and circumstances that existed at the acquisition date, identifies adjustments to the above amounts, or any additional provisions that existed at the acquisition date, then the acquisition accounting may be revised. Revisions to provisional acquisition accounting are required to be done on a retrospective basis.
US$ 000’s
Cash and cash equivalents 2,284
Property, plant and equipment 145,875
Development properties 5,289
Acquisition related intangibles * 54,891
Other assets 3,876
Total assets 212,215
Liabilities
Deferred revenue 32,151
Bank borrowings 14,642
Trade and other payable 47,328
Employees' end of service benefits 934
Total liabilities 95,055
Total net assets acquired (equivalent of fair value of assets received) 117,160
* Excess of fair value of consideration over the fair values of net identifiable tangible assets and liabilities have been provisionally allocated to acquisition related intangible assets. The Group is in the process of attributing values to identifiable intangible assets as permitted by IFRS 3. and any excess consideration shall be allocated as goodwill.
GFH Financial Group BSC 44
NOTES TO THE CONSOLIDATED FINANCIAL STATEMENTS for the year ended 31 December 2016 US$ 000's
20 OTHER INCOME
Other income for the year primarily comprises recoveries on previously impaired accounts US$ 5.9 million and revenue from operations of non- banking subsidiaries of US$ 11.83 million (2015: Nil).
For the previous year, reversal of liability of US$ 2.6 million, recoveries on previous impairment of US$ 2.02 million and profit from buy back of debt of US$ 330 thousand.
As per the Group’s Variable Incentive Policy, a portion of the annual performance bonus is issued in the form of share awards to its senior management employees. These awards include deferred incentives in the form of shares, share purchase plans and long-term incentive plans with different conditions. The terms of the award, including the type of plan, extent of funding, pricing and deferral period is determined for each year by the Board Nomination, Remuneration and Governance Committee of the Bank.
Performance year Nature of award Staff coverage Summary of deferral and vesting conditions
Legacy share plan Share Options Select Senior Management
Initial lock-in period of 3 years and option exercise period over 10 years ending 2018 at an exercise price of USD 0.65 / share.
2013 Award Deferred Annual Bonus Select Senior Management
A portion of the annual incentive was awarded in the form of shares. In 2015, on introduction of the new share plan, the old plan was converted to a deferred cash settled incentive over a 3 years period from year of award.
2014 Award Employee Share Purchase Plan
Covered persons in business and control functions who exceed total compensation thresholds as per CBB Remuneration Regulations and Bank’s Variable Remuneration policy
Shares are released rateably over the 3 year deferral period. The issue price is determined based on a defined adjustment to market price on the date of the award. No future performance conditions or service conditions. Shares are entitled for dividends, if any, but released over the deferral period.
2015 Award Employee Share Purchase Plan
2016 Award Employee Share Purchase Plan
Allocation not approved until the date of the financial statements
Performance periods 2016 2015
No. of Shares USD 000’s No. of Shares USD 000’s
Legacy Option Scheme 2,290,000 902 2,290,000 893
2013 Award
Opening balance - - 2,352,632 447
Change to deferred cash settled plan - - (2,352,632) (447)
Closing balance - - - -
GFH Financial Group BSC 45
NOTES TO THE CONSOLIDATED FINANCIAL STATEMENTS for the year ended 31 December 2016 US$ 000's
21 STAFF COST (continued)
Share incentive scheme 2016 2015
No. of Shares USD 000’s No. of Shares USD 000’s
2014 Award
Opening balance 36,953,895 1,567 - -
Awarded during the period - - 36,953,895 1,567
Forfeiture and other adjustments - 880 - -
Transfer to employees/ settlement (25,128,650) (1,657) - -
Closing balance 11,825,245 780 36,953,895 1,567
2015 Award
Opening balance - - - -
Awarded during the period 15,315,395 2,020 - -
Forfeiture and other adjustments - - - -
Transfer to employees/ settlement - - - -
Closing balance 15,315,395 2,020 - - In case of the employee share purchase plans, the amounts reported in the table represents the vesting charge or benefit which is charged to the income statement and not the gross value of issued shares.
NOTES TO THE CONSOLIDATED FINANCIAL STATEMENTS for the year ended 31 December 2016 US$ 000’s 24 RELATED PARTY TRANSACTIONS
Parties are considered to be related if one party has the ability to control the other party or exercise significant influence over the other party in making financial and operating decisions. Related parties include entities over which the Group exercises significant influence, major shareholders, directors and executive management of the Group. A significant portion of the Group’s management fees are from entities over which the Group exercises influence (assets under management). Although these entities are considered related parties, the Group administers and manages these entities on behalf of its clients, who are by and large third parties and are the economic beneficiaries of the underlying investments. The transactions with these entities are based on agreed terms.
The significant related party balances and transactions (excluding compensation to key management personnel of the Bank) included in these consolidated financial statements are as follows:
* The amounts presented excludes bonus to key management personnel for 2016, as allocation has not been finalised at the date of approval of these consolidated financial statements.
GFH Financial Group BSC 47
NOTES TO THE CONSOLIDATED FINANCIAL STATEMENTS for the year ended 31 December 2016 US$ 000's
24 RELATED PARTY TRANSACTIONS (continued)
2015 Associates
Key management
personnel
Entities in which
Directors are interested
Assets under management
(including special purpose
entities and other entities) Total
Assets Financing assets 886 - - 26,112 26,998 Equity-accounted investees 81,274 - - - 81,274 Investment securities 20,154 - 33,058 217,791 271,003 Other assets 21,484 - - 73,604 95,088 Liabilities Investors’ funds - - - 5,291 5,291 Customer current account 589 - 26,448 20,690 47,727 Other liabilities - - - 35,000 35,000 Equity of investment account holders 292 - - 22,305 22,597 Income Investment banking income - - - 23,822 23,822 Management fees 175 - - 650 825 Share of profit of equity- accounted investees 3,025 - - - 3,025 Income from investment securities, net (2,135) - - - (2,135) Other income - - - 3,147 3,147 Expenses Return to investment account holders 5 - 1,379 347 1,731 Staff cost - 10,548 - - 10,548 Other operating expenses - 898 - 292 1,190
Impairment allowances 4,500 - - - 4,500
Key management personnel Key management personnel of the Group comprise of the Board of Directors and key members of management having authority and responsibility for planning, directing and controlling the activities of the Group.
Board of Directors do not hold any interests in the Bank’s ordinary shares as at 31 December 2016 (2015: Nil). Senior management holding of shares are disclosed in note 21.
During the year, there were no participation of directors in investments promoted by the Group. The key management personnel compensation is as follows:
2016 2015
Board member fees and allowance 1,048 898 Salaries, other short-term benefits and expenses 7,739 9,488 Post-employment benefits 166 1,060
GFH Financial Group BSC 48
NOTES TO THE CONSOLIDATED FINANCIAL STATEMENTS for the year ended 31 December 2016 US$ 000's
25 ASSETS UNDER MANAGEMENT The Group provides corporate administration, investment management and advisory services to its project companies, which involve the Group making decisions on behalf of such entities. Assets that are held in such capacity are not included in these consolidated financial statements. At the reporting date, the Group had assets under management of US$ 2,166,805 thousand (31 December 2015: US$ 2,137,037 thousand). During the year, the Group had charged management fees amounting to US$ 1,807 thousand (2015: US$ 825 thousand) to its assets under management.
26 EARNINGS PER SHARE
Basic earnings per share Basic earnings per share is calculated by dividing the profit for the year by the weighted average number of equity shares outstanding during the year.
The weighted average number of ordinary equity shares for the comparative periods presented are adjusted for the issue of shares during the year without corresponding change in resources. Diluted earnings per share Diluted earnings per share is calculated by adjusting the weighted average number of ordinary shares outstanding to assume conversion of all dilutive potential ordinary shares. Potential ordinary shares are considered to be dilutive when, and only when, their conversion to ordinary shares would decrease earnings per share or increase the loss per share.
2016 2015 In thousands of shares Weighted average number of ordinary shares 2,263,094 2,215,119
In case of the legacy share options granted to employees prior to 2014, as the average market value of shares during the current year was lower than the assumed issue price of shares under the scheme, the share awards are not considered to be dilutive as at 31 December 2016. Accordingly, no adjustment for dilution has been made for the purposes of computation of diluted earnings per share except for those already discussed above.
27 ZAKAH AND SOCIAL RESPONSIBILITY Zakah is directly borne by the shareholders on distributed profits and investors in restricted investment accounts. The Bank does not collect or pay Zakah on behalf of its shareholders and investors in restricted investment accounts. Zakah payable by the shareholders is computed by the Bank on the basis of the method prescribed by the Bank’s Shari’a Supervisory Board and notified to shareholders annually. The zakah payable by shareholders for 31 December 2015 is US$ 0.00169/share and the current year calculations for zakah are yet to approved by the Group’s Shari’a Supervisory Board and will be provided for in the Bank’s website The Group discharges its social responsibilities through donations to charitable causes and social organisations.
GFH Financial Group BSC 49
NOTES TO THE CONSOLIDATED FINANCIAL STATEMENTS for the year ended 31 December 2016 US$ 000's
28 EARNINGS PROHIBITED BY SHARI’A The Group is committed to avoid recognising any income generated from non-Islamic sources. Accordingly, all non-Islamic income is credited to a charity account where the Group uses these funds for charitable means. Movements in non-Islamic funds are shown in the statement of sources and uses of charity funds. The Group receives interest from deposits placed with the Central Bank of Bahrain and other incidental or required deposits. These earnings are utilised exclusively for charitable purposes and amounts to US$ 95 thousand (2015: US$ 166 thousand).
29 SHARI’A SUPERVISORY BOARD
The Group’s Shari’a Supervisory Board consists of four Islamic scholars who review the Group’s compliance with general Shari’a principles and specific fatwas, rulings and guidelines issued. Their review includes examination of evidence relating to the documentation and procedures adopted by the Group to ensure that its activities are conducted in accordance with Islamic Shari’a principles.
30 MATURITY PROFILE The table below shows the maturity profile of the Group’s assets and unrecognised commitments on the basis of their expected realisation/ payment and the Group’s liabilities on the basis of contractual maturity. However, the contractual maturity and amount of cash flows on these instruments may vary from this analysis. For undiscounted contractual maturity of financial liabilities, refer note 35.
NOTES TO THE CONSOLIDATED FINANCIAL STATEMENTS for the year ended 31 December 2016 US$ 000’s 31 CONCENTRATION OF ASSETS, LIABILITIES AND EQUITY OF INVESTMENT ACCOUNT HOLDER (a) Industry sector
31 December 2016
Trading and
manufacturing
Banks and
financial
institutions
Development
Infrastructure Technology
Others
Total
Assets
Cash and bank balances - 151,965 1,138 - 3,345 156,448
Placements with financial institutions - 208,790 12 - 5,096 213,898
NOTES TO THE CONSOLIDATED FINANCIAL STATEMENTS for the year ended 31 December 2016 US$ 000’s 31 Concentration of assets, liabilities and equity of investment account holders (continued) (a) Industry sector (continued)
31 December 2015
Trading and
manufacturing
Banks and financial
institutions
Development Infrastructure Technology
Others
Total
Assets
Cash and bank balances - 122,162 - - 3 122,165
Placements with financial institutions - 122,348 - - - 122,348
NOTES TO THE CONSOLIDATED FINANCIAL STATEMENTS for the year ended 31 December 2016 US$ 000’s 31 Concentration of assets, liabilities and equity of investment account holders (continued) (b) Geographic region
31 December 2016
GCC
countries MENA Asia UK
Europe
(excluding UK) Others Total
Assets
Cash and bank balances 132,117 55 19 240 7,615 16,402 156,448
Concentration by location for assets is measured based on the location of the underlying operating assets, and not based on the location of the investment (which is generally based in tax efficient jurisdictions).
GFH FINANCIAL GROUP BSC 54
NOTES TO THE CONSOLIDATED FINANCIAL STATEMENTS for the year ended 31 December 2016 US$ 000’s 31 Concentration of assets, liabilities and equity of investment account holders (continued) (b) Geography sector (continued)
31 December 2015
GCC
countries MENA Asia UK
Europe
(excluding UK) Others Total
Assets
Cash and bank balances 95,528 3 101 320 4,239 21,974 122,165
NOTES TO THE CONSOLIDATED FINANCIAL STATEMENTS for the year ended 31 December 2016 US$ 000's
32 OPERATING SEGMENTS
The Group has four distinct operating segments, Real Estate Development, Asset Management, Private Equity and Commercial Banking, which are the Group’s strategic business units. The strategic business units offer different products and services, and are managed separately because they require different strategies for management and resource allocation within the Group. For each of the strategic business units, the Group’s Board of Directors (chief operating decision makers) review internal management reports on a quarterly basis. The following summary describes the operations in each of the Group’s operating reportable segments:
Real Estate Development: This business unit primarily is involved in origination and management
of large scale economic infrastructure projects. The business unit also covers the Group’s investment in real estate and related assets.
Investment Banking: The Banking segment of the Group is focused on private equity and asset management domains. The private equity activities include acquisition of interests in unlisted or listed businesses at prices lower than anticipated values. The asset management unit is responsible for identifying and managing investments in yielding real estate in the target markets of the GCC. The investment banking activities focuses on providing structuring capabilities in Islamic asset-backed and equity capital markets, Islamic financial advisory and mid-sized mergers and acquisition transactions.
Commercial Banking: These include commercial and corporate banking, retail banking, wealth management, structured investment products and project financing facilities of the Group’s commercial banking subsidiary.
The performance of each operating segment is measured based on segment results and are reviewed by the management committee and the Board of Directors on a quarterly basis. Segment results is used to measure performance as management believes that such information is most relevant in evaluating the results of certain segments relative to other entities that operate within these industries. Inter-segment pricing, if any is determined on an arm’s length basis.
The Group classifies directly attributable revenue and cost relating to transactions originating from respective segments as segment revenue and segment expenses respectively. Indirect costs is allocated based on cost drivers/factors that can be identified with the segment and/ or the related activities. The internal management reports are designed to reflect revenue and cost for respective segments which are measured against the budgeted figures. The unallocated revenues, expenses, assets and liabilities related to entity-wide corporate activities and treasury activities at the Group level.
The Group has primary operations in Bahrain and the Group does not have any significant independent overseas branches/divisions in the banking business. The geographic concentration of assets and liabilities is disclosed in note 35 (b) to the consolidated financial statements.
GFH FINANCIAL GROUP BSC 56
NOTES TO THE CONSOLIDATED FINANCIAL STATEMENTS for the year ended 31 December 2016 US$ 000's 32 OPERATING SEGMENTS (continued)
Information regarding the results of each reportable segment is included below:
Equity of investment account holders - - 943,247 1,668 944,915
Commitments 47,000 - 214,794 - 261,794
*Includes segment result of discontinued operations, net (refer note 25).
GFH FINANCIAL GROUP BSC 58
NOTES TO THE CONSOLIDATED FINANCIAL STATEMENTS for the year ended 31 December 2016 US$ 000's 33 FINANCIAL INSTRUMENTS
a) FAIR VALUES OF FINANCIAL INSTRUMENTS Fair value is an amount for which an asset could be exchanged, or a liability settled, between knowledgeable, willing parties in an arm’s length transaction. This represents the price that would be received to sell an asset or paid to transfer a liability in an orderly transaction between market participants at the measurement date. Underlying the definition of fair value is a presumption that an enterprise is a going concern without any intention or need to liquidate, curtail materially the scale of its operations or undertake a transaction on adverse terms. As at 31 December 2016 and 31 December 2015, the fair value of bank balances, placements with financial institutions, other financial assets, investors’ fund, placements from financial and other institutions and other financial liabilities are not expected to be materially different from their carrying values as these are short term in nature and are re-priced frequently to market rates, where applicable. Investment securities carried at fair value through income statement are carried at their fair values determined using quoted market prices and internal valuation models. Other investments are carried at cost in the absence of a reliable measure of fair value. Other than certain investments carried at cost of US$ 287,180 thousand (31 December 2015: US$ 326,991 thousand) (note 6), the estimated fair values of the Group’s other financial assets are not significantly different from their book values as at 31 December 2016.
Investments amounting to US$ 287,180 thousand (31 December 2015: US$ 326,991 thousand) in unquoted equity securities are carried at cost less impairment in the absence of a reliable measure of fair value. Such investments are either private equity investments managed by external investment managers or represent investments in development infrastructure projects promoted by the Group for which a reliable estimate of fair value cannot be determined. The Group intends to exit these investments principally by means of strategic sell outs, sale of underlying assets or through initial public offerings. As at 31 December 2016, the fair value of financing liabilities was estimated at US$ 159,545 thousand (carrying value US$ 168,992 thousand) (31 December 2015: fair value US$ 133,400 thousand (carrying value US$ 153,619 thousand)). These may not necessarily represent active market quotes. In a normal (and not stressed) scenario excluding adjustments for own credit risk, the carrying values would approximate fair value of financing liabilities as these are largely floating rate instruments which were re-priced recently as part of the debt restructuring process.
b) FAIR VALUE HIERARCHY
The table below analyses the financial instruments carried at fair value, by valuation method. The different levels have been defined as follows:
Level 1: quoted prices (unadjusted) in active markets for identical assets and liabilities
Level 2: inputs other than quoted prices included within Level 1 that are observable for the asset or liability, either directly (i.e.as prices) or indirectly (i.e. derived from prices)
Level 3: inputs for the asset or liability that are not based on observable market data (unobservable inputs).
GFH FINANCIAL GROUP BSC 59
NOTES TO THE CONSOLIDATED FINANCIAL STATEMENTS for the year ended 31 December 2016 US$ 000's 33 FINANCIAL INSTRUMENTS (continued)
b) FAIR VALUE HIERARCHY (continued)
31 December 2016 Level 1 Level 2 Level 3 Total
Investment securities carried at fair value through:
- income statement 377 - 40,180 40,557
- equity 103 - 1,973 2,076
480 - 42,153 42,633
31 December 2015 Level 1 Level 2 Level 3 Total
Investment securities carried at fair value through:
- income statement 377 - 60,347 60,724
- equity 15,242 - 1,973 17,215
15,619 - 62,320 77,939
The table below shows the reconciliation of movements in value of investments measured using Level 3 inputs:
34 COMMITMENTS AND CONTINGENCIES
The commitments contracted in the normal course of business of the Group are as follows:
31 December 2016
31 December 2015
Undrawn commitments to extend finance 174,527 161,788Financial guarantees 85,129 68,006Capital commitments for infrastructure development 20,000 32,000Commitment to investment 10,696 -
2016 2015
At 1 January 62,320 64,455
Purchases - -
Total gains or losses in income statement (2,050) (2,135)
Disposals during the year (18,117) -
At 31 December 42,153 62,320
GFH FINANCIAL GROUP BSC 60
NOTES TO THE CONSOLIDATED FINANCIAL STATEMENTS for the year ended 31 December 2016 US$ 000's 34 COMMITMENTS AND CONTINGENCIES (continued)
Performance obligations During the ordinary course of business, the Group may enter into performance obligations in respect of its infrastructure development projects. It is the usual practice of the Group to pass these performance obligations, wherever possible, on to the companies that own the projects. In the opinion of the management, no liabilities are expected to materialise on the Group at 31 December 2016 due to the performance of any of its projects.
Litigations, claims and contingencies Litigations and claims The Group has a number of claims and litigations filed against it in connection with projects promoted by the Bank in the past and with certain transactions. Further, claims against the Bank also have been filed by former employees. Based on the advice of the Bank’s external legal counsel, the management is of the opinion that the Bank has strong grounds to successfully defend itself against these claims. Appropriate provision have been made in the books of accounts. No further disclosures regarding contingent liabilities arising from any such claims are being made by the Bank as the directors of the Bank believe that such disclosures may be prejudicial to the Bank’s legal position.
35 FINANCIAL RISK MANAGEMENT
Overview Financial assets of the Group comprise bank balances, placements with financial and other institutions, investment securities and other receivable balances. Financial liabilities of the Group comprise investors’ funds, placements from financial and other institutions, financing liabilities and other payable balances. Accounting policies for financial assets and liabilities are set out in note 2.
The Group has exposure to the following risks from its use of financial instruments: credit risk; liquidity risk; market risks; and operational risk
This note presents information about the Group’s exposure to each of the above risks, the Bank’s objectives, policies and processes for measuring and managing risk, and the Group’s management of capital. The material subsidiaries consolidated in these financial statements have independent risk management frameworks which is monitored by the respective Board of Directors of the subsidiaries. Accordingly, such risk management policies, procedures and practices are not included in these consolidated financial statements.
GFH FINANCIAL GROUP BSC 61
NOTES TO THE CONSOLIDATED FINANCIAL STATEMENTS for the year ended 31 December 2016 US$ 000's 35 FINANCIAL RISK MANAGEMENT (continued)
Risk management framework The key element of our risk management philosophy is for the Risk Management Department (‘RMD’) to provide independent monitoring and control while working closely with the business units which ultimately own the risks. The Head of Risk Management reports to the Board Audit and Risk Committee. The Board of Directors has overall responsibility for establishing our risk culture and ensuring that an effective risk management framework is in place. The Board has delegated its authority to the Board Audit and Risk Committee (ARC), which is responsible for implementing risk management policies, guidelines and limits and ensuring that monitoring processes are in place. The RMD, together with the Internal Audit and Compliance Departments, provide independent assurance that all types of risk are being measured and managed in accordance with the policies and guidelines set by the Board of Directors.
The RMD submits a quarterly Risk Overview Report along with a detailed Liquidity Risk Report to the Board of Directors. The Risk Overview Report describes the potential issues for a wide range of risk factors and classifies the risk factors from low to high. The Liquidity Risk Report measure the Group’s liquidity risk profile against policy guidelines and regulatory benchmarks. An additional report is prepared by the respective investment units that give updated status and impairment assessment of each investment, a description of significant developments on projects or issues as well as an update on the strategy and exit plan for each project.
a) Credit risk Credit risk is the risk of financial loss to the Group if a customer or counterparty to a financial instrument fails to meet its contractual obligations, and arises principally from the Group’s, placements with financial institutions, financing assets and other receivables from project companies. For risk management reporting purposes, the Group considers and consolidates all elements of credit risk exposure (such as individual obligor default risk, country and sector risk). Management of investment and credit risk The Board of Directors has delegated responsibility for the management of credit risk to its Board Investment Committee (BIC). This committee establishes operating guidelines and reviews and endorses the Management Investment and Credit Committee recommendations for investment strategies, products and services. Its actions are in accordance with the investment policies adopted by the Board of Directors. The RMD is responsible for oversight of the Group’s credit risk, including: Ensuring that the Group has in place investment and credit policies, covering credit assessment,
risk reporting, documentary and legal procedures, whilst the Compliance Department is responsible for ensuring compliance with regulatory and statutory requirements.
Overseeing the establishment of the authorisation structure for the approval and renewal of investment and credit facilities. Authorisation limits are governed by the Board approved Delegated Authority Limits (DAL) Matrix.
Reviewing and assessing credit risk. Risk Management department assesses all investment and credit exposures in excess of designated limits, prior to investments / facilities being committed. Renewals and reviews of investments / facilities are subject to the same review process.
GFH FINANCIAL GROUP BSC 62
NOTES TO THE CONSOLIDATED FINANCIAL STATEMENTS for the year ended 31 December 2016 US$ 000's 35 FINANCIAL RISK MANAGEMENT (continued) a) Credit risk (continued)
Ongoing review of credit exposures. The risk assessment approach is used in determining where impairment provisions may be required against specific investment / credit exposures. The current risk assessment process classifies credit exposures into two broad categories “Unimpaired” and “Impaired”, reflecting risk of default and the availability of collateral or other credit risk mitigation. Risk is assessed on an individual basis for each investment / receivable and is reviewed at least once a year. The Group does not perform a collective assessment of impairment for its credit exposures as the credit characteristics of each exposure is considered to be different. Risk profile of exposures are subject to regular reviews.
Reviewing compliance of business units with agreed exposure limits, including those for selected industries, country risk and product types. Providing advice, guidance and specialist skills to business units to promote best practice throughout the Group in the management of investment / credit risk.
The Risk Management Department works alongside the Investment Department at all stages of the deal cycle, from pre-investment due diligence to exit, and provides an independent review of every transaction. A fair evaluation of investments takes place periodically with inputs from the Investment department. Quarterly updates of investments are presented to the Board of Directors or their respective committees. Regular audits of business units and Group credit processes are undertaken by Internal Audit.
GFH FINANCIAL GROUP BSC 63
NOTES TO THE CONSOLIDATED FINANCIAL STATEMENTS for the year ended 31 December 2016 US$ 000's 35 FINANCIAL RISK MANAGEMENT (continued)
a) Credit risk (continued) Exposure to credit risk
Past due but not impaired – carrying amount - - 141,024 - 20,138 33,644
Less : Collective impairment - - (9,241) - (1,852) - Total – carrying amount 104,863 122,348 859,421 168,523 179,870 246,133
GFH FINANCIAL GROUP BSC 64
NOTES TO THE CONSOLIDATED FINANCIAL STATEMENTS for the year ended 31 December 2016 US$ 000's 35 FINANCIAL RISK MANAGEMENT (continued)
a) Credit risk (continued)
Impaired receivables Impaired receivables are those for which the Group determines that it is probable that it will be unable to collect all or a portion of payments due according to the contractual terms of the receivables agreement(s). These exposures are graded “Impaired” in the Group’s assessment process. The Group establishes an allowance for impairment losses that represents its estimate of incurred losses in its receivables. This allowance is a specific loss component that relates to individually significant exposures based on individual assessment for impairment. The movement in the impairment allowances for investment securities is given in note 6. The movement in impairment allowance for other financial assets are as given below:
2016
Financing receivables
Financing to projects
Receivable from
investment banking services
Other receivables Total
At 1 January 2016 70,150 90,088 153,630 75,311 389,179Impairment charge for the year - 51,500 - 20,714 72,214 At 31 December 2016 70,150 141,588 153,630 96,025 461,393
2015
Financing receivables
Financing to projects
Receivable from
investment banking services
Other receivables Total
At 1 January 2015 70,150 85,588 153,630 75,311 384,679Impairment charge for the year - 4,500 - - 4,500 At 31 December 2015 70,150 90,088 153,630 75,311 389,179
Receivables with renegotiated terms During the year, the Group has renegotiated certain financing receivables and financing to projects due to changes in the financial position of the borrower. The financing receivables were renegotiated for terms and condition similar to original terms. Financing to projects represents working capital and other funding extended to projects managed and promoted by the Group. The financing is expected to be recovered from the operating cash flows of the underlying project assets. Financing to projects of US$ 6.44 million (31 December 2015: US$ 56.8 million) were renegotiated for an extended period and do not have specified terms of repayment. The Group assesses the recoverability and timing of collection based on underlying stream of cash flows that will be generated by its projects.
GFH FINANCIAL GROUP BSC 65
NOTES TO THE CONSOLIDATED FINANCIAL STATEMENTS for the year ended 31 December 2015 US$ 000's 35 FINANCIAL RISK MANAGEMENT (continued) a) Credit risk (continued)
Write-off policy The Group writes off a receivable (and any related allowances for impairment losses) when it is determined that the receivables are uncollectible and after obtaining approval from the CBB where required. This determination is reached after considering information such as the occurrence of significant changes in the payee / issuer’s financial position such that the payee / issuer can no longer pay the obligation, or that proceeds from collateral will not be sufficient to pay back the entire exposure. Concentration risk Concentration risk arises when a number of counterparties are engaged in similar economic activities or activities in the same geographic region or have similar economic features that would cause their ability to meet contractual obligations to be similarly affected by changes in economic, political or other conditions. The Group seeks to manage its concentration risk by establishing and constantly monitoring geographic and industry wise concentration limits.
The geographical and industry wise distribution of assets and liabilities are set out in notes 36 (a) and (b).
Collaterals The Group holds collateral against financing assets and receivables from assets acquired for leasing in the form of mortgage/ pledge over property, listed/ unlisted securities, other assets and guarantees. Estimates of fair value are based on the value of collateral assessed at the time of borrowing, and updated periodically, generally at annual intervals. Collateral generally is not held against exposure to other banks and financial institutions. An estimate of the fair value of collateral and other security enhancements held against financial assets is shown below. This includes the value of financial guarantees from banks, but not corporate and personal guarantees as the values thereof are not readily quantifiable. The collateral values considered for disclosure are restricted to the extent of the outstanding exposures.
GFH FINANCIAL GROUP BSC 66
NOTES TO THE CONSOLIDATED FINANCIAL STATEMENTS for the year ended 31 December 2016 US$ 000's 35 FINANCIAL RISK MANAGEMENT (continued) a) Credit risk (continued)
Total 462,870 260,209 723,079 407,178 185,915 593,093
The average collateral coverage ratio on secured facilities is 114.47% at 31 December 2016
(31 December 2015: 107.80%).
GFH FINANCIAL GROUP BSC 67
NOTES TO THE CONSOLIDATED FINANCIAL STATEMENTS for the year ended 31 December 2015 US$ 000's 35 FINANCIAL RISK MANAGEMENT (continued) a) Credit risk (continued)
An analysis of concentrations of credit risk of the commercial banking business at the reporting date is
shown below:
Concentration by As at 31 December 2016 As at 31 December 2015
b) Liquidity risk Liquidity risk is defined as the risk that an entity will encounter difficulty in meeting obligations associated with financial liabilities that are settled by delivering cash or another financial asset. Management of liquidity risk
The Group’s approach to managing liquidity is to ensure, as far as possible, that it will always have sufficient liquidity to meet its liabilities when due, under both normal and stressed conditions, without incurring unacceptable losses or risking damage to the Group’s reputation.
Treasury receives information from other business units regarding the liquidity profile of their financial assets and liabilities and details of other projected cash flows arising from projected future business. Treasury then aims to maintain a portfolio of short-term liquid assets, largely made up of short-term placements with financial and other institutions and other inter-bank facilities, to ensure that sufficient liquidity is maintained within the Group as a whole. The liquidity requirements of business units are met through treasury to cover any short-term fluctuations and longer term funding to address any structural liquidity requirements.
The daily liquidity position is monitored and regular liquidity stress testing is conducted under a variety of scenarios covering both normal and more severe market conditions. All liquidity policies and procedures are subject to review and approval by the Board of Directors. Daily reports cover the liquidity position of the Bank and is circulated to Executive Committee (ExComm). Moreover, quarterly reports are submitted to the Board of Directors on the liquidity position by RMD.
GFH FINANCIAL GROUP BSC 68
NOTES TO THE CONSOLIDATED FINANCIAL STATEMENTS for the year ended 31 December 2016 US$ 000's 35 FINANCIAL RISK MANAGEMENT (continued) b) Liquidity risk (continued)
The table below shows the undiscounted cash flows on the Group’s financial liabilities, including issued financial guarantee contracts, and unrecognised financing commitments on the basis of their earliest possible contractual maturity. For issued financial guarantee contracts, the maximum amount of the guarantee is allocated to the earliest period in which the guarantee could be called. The Group’s expected cash flows on these instruments vary significantly from this analysis. Refer note 34 for the expected maturity profile of assets and liabilities.
To manage the liquidity risk arising from financial liabilities, the Group aims to hold liquid assets comprising cash and cash equivalents, investment in managed funds and treasury shares for which there is an active and liquid market. These assets can be readily sold to meet liquidity requirements. Further, the Group is focussed on developing a pipeline of steady revenues and has undertaken cost reduction exercises that would improve its operating cash flows.
Gross undiscounted cash flows
Carrying
amount
31 December 2015
Up to 3
months
3 to 6
months
6 months
to 1 year
1 to 3
years
Over 3
years Total
Financial liabilities
Investors’ funds 27,728 - - - - 27,728 27,728
Placements from financial
institutions, other entities
and institutions 121,555 26,296 60,042 131,657 4,225 343,775 340,090
NOTES TO THE CONSOLIDATED FINANCIAL STATEMENTS for the year ended 31 December 2016 US$ 000's 35 FINANCIAL RISK MANAGEMENT (continued) b) Liquidity risk (continued)
Measures of liquidity The Group has recently introduced new measures of liquidity. These revised metrics are intended to better reflect the liquidity position from a cash flow perspective and provide a target for the Group. These are liquidity coverage ratio, net stable funding ratio and stock of liquid assets.
For this purpose, the liquidity coverage ratio identifies the amount of unencumbered, high quality liquid assets the Group holds that can be used to offset the net cash outflows it would encounter under an acute short-term stress scenario (30, 60 and 90 days time horizon). The net stable funding ratio measures the amount of long-term, stable sources of funding employed by an institution relative to the liquidity profiles of the assets funded and the potential for contingent calls on funding liquidity arising from off-balance sheet commitments and obligations.
Liquidity coverage ratio 2016 2015 30 days 4.54 2.14 60 days 2.94 4.87 90 days 2.81 1.91
The Group also holds certain listed equities and treasury shares which can be sold to meet the liquidity requirements.
2016 2015 Net stable funding ratio 0.89 1.02
Details of the ratio of liquid assets to total assets at the reporting date and during the year were as follows:
Liquid asset / Total asset 2016 2015 At 31 December 17.19% 17.07% Average for the year 12.32% 17.88% Maximum for the year 17.19% 20.36% Minimum for the year 9.44% 16.30%
c) Market risks Market risk is the risk that changes in market prices, such as profit rate, equity prices, foreign exchange rates and credit spreads (not relating to changes in the obligor’s / issuer’s credit standing) will affect the Group’s income, future cash flows or the value of its holdings of financial instruments. The objective of market risk management is to manage and control market risk exposures within acceptable parameters, while optimising the return on risk. Management of market risks As a matter of general policy, the Group shall not assume trading positions on its assets and liabilities, and hence the entire balance sheet is a non-trading portfolio. All foreign exchange risk within the Group is transferred to Treasury. The Group seeks to manage currency risk by continually monitoring exchange rates. Profit rate risk is managed principally through monitoring profit rate gaps and by having pre-approved limits for repricing bands. Overall authority for market risk is vested in the Board Audit and Risk Committee. RMD is responsible for the development of detailed risk management policies (subject to review and approval of the Board Audit & Risk Committee of Directors).
GFH FINANCIAL GROUP BSC 70
NOTES TO THE CONSOLIDATED FINANCIAL STATEMENTS for the year ended 31 December 2016 US$ 000's 35 FINANCIAL RISK MANAGEMENT (continued) c) Market risks (continued)
Exposure to profit rate risk The principal risk to which non-trading portfolios are exposed is the risk of loss from fluctuations in the future cash flows or fair values of financial instrument because of a change in market profit rates. Majority of the Group’s profit based asset and liabilities are short term in nature, except for certain long term liabilities which have been utilised to fund the Group’s strategic investments in its associates.
A summary of the Group’s profit rate gap position on non-trading portfolios is as follows:
Total assets 413,901 44,938 107,344 207,801 559,597 1,333,581Liabilities Investors’ funds 5,291 - - - - 5,291Placements from financial and other institutions 120,077 26,241 60,042 129,503 4,227 340,090Financing liabilities 4,120 4,716 39,293 105,490 - 153,619Customer current account 20,737 - - - - 20,737 Total liabilities 150,225 30,957 99,335 234,993 4,227 519,737 Equity of investment account holders 361,080 93,562 126,721 70,337 293,215 944,915 Profit rate sensitivity gap (97,404) (79,581) (118,712) (97,529) 262,155 (131,071)
GFH FINANCIAL GROUP BSC 71
NOTES TO THE CONSOLIDATED FINANCIAL STATEMENTS for the year ended 31 December 2016 US$ 000's 35 FINANCIAL RISK MANAGEMENT (continued) c) Market risks (continued)
The management of profit rate risk against profit rate gap limits is supplemented by monitoring the sensitivity of the Group’s financial assets and liabilities to various standard and non-standard profit rate scenarios. Standard scenarios that are considered include a 100 basis point (bp) parallel fall or rise in all yield curves worldwide. An analysis of the Group’s sensitivity to an increase or decrease in market profit rates (assuming no asymmetrical movement in yield curves and a constant statement of financial position) is as follows:
100 bps parallel increase / (decrease) 2016 2015 At 31 December ±1,888 ±1,495 Average for the year ±2,160 ±3,145 Maximum for the year ±2,773 ±4,173 Minimum for the year ±953 ±1,495
Overall, profit rate risk positions are managed by Treasury, which uses placements from / with financial institutions to manage the overall position arising from the Group’s activities.
The effective average profit rates on the financial assets, liabilities and unrestricted investment accounts are as follows:
2016 2015 Placements with financial institutions 3.99% 1.22%Financing assets 9.02% 5.72%Debt type investments 4.91% 4.55%
Placements from financial institutions, other entities and individuals
6.78%
3.61%
Financing liabilities 7.17% 6.95%Equity of investment account holders 2.10% 1.93%
Exposure to foreign exchange risk Currency risk is the risk that the value of a financial instrument will fluctuate due to changes in foreign exchange rates. The Groups major exposure is in GCC currencies, which are primarily pegged to the US Dollar. The Group had the following significant net exposures denominated in foreign currency as of 31 December from its financial instruments: 2016 2015 US$ ‘000 US$ ’000 Equivalent Equivalent
Sterling Pounds 20,680 37,370 Euro 9,710 13,644 Australian dollars 12,223 12,222 Kuwaiti dinar 19,822 22,634 Jordanian Dinar 3 2,131 India rupee 19 100 Other GCC Currencies (*) 27,918 115,537
(*) These currencies are pegged to the US Dollar.
GFH FINANCIAL GROUP BSC 72
NOTES TO THE CONSOLIDATED FINANCIAL STATEMENTS for the year ended 31 December 2016 US$ 000's 35 FINANCIAL RISK MANAGEMENT (continued) c) Market risks (continued)
The management of foreign exchange risk against net exposure limits is supplemented by monitoring the sensitivity of the Group’s financial assets and liabilities to various foreign exchange scenarios. Standard scenarios that are considered include a 5% plus / minus increase in exchange rates, other than GCC pegged currencies. An analysis of the Group’s sensitivity to an increase or decrease in foreign exchange rates (assuming all other variables, primarily profit rates, remain constant) is as follows: 2016 2015 US$ ‘000 US$’000 Equivalent Equivalent
Sterling Pounds ±1,034 ±1,869Euros ±485 ±682 Australian dollar ±611 ±611 Kuwaiti dinar ±991 ±1,131Jordanian Dinar ±0.15 ±106 Indian rupee ±0.95 ±5
Exposure to other market risks Equity price risk on quoted investments is subject to regular monitoring by the Group. The price risk on managed funds is monitored using specified limits (stop loss limit, stop loss trigger and overall stop loss limit cap) set within the portfolio management contract for fund managers. A 5% change in the underlying value of the managed funds would have an impact on the income statement and equity by US$ 99 thousand (2015: US$ 99 thousand). The Group’s equity type instruments carried at cost are exposed to risk of changes in equity values. The significant estimates and judgements in relation to impairment assessment of fair value through equity investments carried at cost are included in note 3 (ii). The Group manages exposure to other price risks by actively monitoring the performance of the equity securities.
d) Operational risk
Operational risk is the risk of loss arising from systems and control failures, fraud and human errors, which can result in financial and reputation loss, and legal and regulatory consequences. The Group manages operational risk through appropriate controls, instituting segregation of duties and internal checks and balances, including internal audit and compliance. The Risk Management Department facilitates the management of Operational Risk by way of assisting in the identification of, monitoring and managing of operational risk in the Group.
36 CAPITAL MANAGEMENT
The Group’s regulator Central Bank of Bahrain (CBB) sets and monitors capital requirements for the Group as a whole. In implementing current capital requirements CBB requires the Group to maintain a prescribed ratio of total capital to total risk-weighted assets. The total regulatory capital base is net of prudential deductions for large exposures based on specific limits agreed with the regulator. Banking operations are categorised as either trading book or banking book, and risk-weighted assets are determined according to specified requirements that seek to reflect the varying levels of risk attached to assets and off-balance sheet exposures. The Group does not have a trading book. The Group aims to maintain strong capital base so as to maintain investor, creditor and market confidence and to sustain the future development of the business.
GFH FINANCIAL GROUP BSC 73
NOTES TO THE CONSOLIDATED FINANCIAL STATEMENTS for the year ended 31 December 2016 US$ 000's 36 CAPITAL MANAGEMENT (continued)
The Central Bank of Bahrain (CBB) sets and monitors capital requirements for the Bank as a whole. In implementing current capital requirements CBB requires the Bank to maintain a prescribed ratio of total capital to total risk-weighted assets. Capital adequacy regulations of CBB is based on the principles of Basel III and the IFSB guidelines.
The Bank’s regulatory capital is analysed into two tiers:
Tier 1 capital: includes CET1 and AT1.
CET1 comprise of ordinary share capital that meet the classification as common shares for regulatory purposes, disclosed reserves including share premium, general reserves, legal / statutory reserve, common shares issued by consolidated banking subsidiaries of the Bank and held by third parties, retained earnings after regulatory adjustments relating to goodwill and items that are included in equity which are treated differently for capital adequacy purposes.
AT1 comprise of instruments that meet the criteria for inclusion in AT1, instruments issued by consolidated banking subsidiaries of the Bank held by third parties which meet the criteria of AT1, and regulatory adjustments applied in calculation of AT1.
Tier 2 capital, includes instruments issued by the Bank that meet the criteria for inclusion in Tier 2 capital, stock surplus resulting from issue of Tier 2 capital, instruments issued by consolidated banking subsidiaries of the Bank held by third parties that meet the criteria for inclusion in Tier 2, general provisions held against unidentified losses on financing and qualify for inclusion within Tier 2, asset revaluation reserve from revaluation of fixed assets and instruments purposes and regulatory adjustments applied in the calculation of Tier 2 capital.
The regulatory adjustments are subject to limits prescribed by the CBB requirements, these deductions would be effective in a phased manner through transitional arrangements from 2015 to 2018. The regulations prescribe higher risk weights for certain exposures that exceeds materiality thresholds. These regulatory adjustments required for certain items such as goodwill on mortgage service right, deferred tax assets, cash flow hedge reserve, gain on sale of related securitization transactions, defined benefit pension fund assets and liabilities, investment in own shares and reciprocal cross holdings in the capital of Banking and financial entities, investment in the capital of Banking and financial entities that are outside the scope of regulatory consolidation and where the Bank does not own more than 10% of issued common shares capital of the entity and significant investments in the capital of banking and financial entities that are outside the scope of regulatory consolidation. As at 31 December the Bank has made regulatory adjustments of US$ 340 thousand (2015: 4,053 thousand) in line with the CBB requirements. Banking operations are categorised as either trading book or banking book, and risk-weighted assets are determined according to specified requirements that seek to reflect the varying levels of risk attached to assets and off-balance sheet exposures.
GFH FINANCIAL GROUP BSC 74
NOTES TO THE CONSOLIDATED FINANCIAL STATEMENTS for the year ended 31 December 2016 US$ 000's 36 CAPITAL MANAGEMENT (continued)
The Bank’s regulatory capital position at 31 December was as follows:
2016 2015
Total risk weighted exposures 4,454,973 3,398,337
Tier 1 capital :
- CET 1 capital prior to regulatory adjustments 1,036,475 830,600
- Less: regulatory adjustments (340) (4,053)
CET 1 after regulatory adjustments 1,036,135 826,547
AT1 4,979 2,472
Tier 2 capital 17,909 14,405 Total regulatory capital 1,059,023
843,424
Total regulatory capital expressed as a percentage of total risk weighted assets 23.77% 24.68%
The allocation of capital between specific operations and activities is primarily driven by regulatory requirements. The Group’s capital management policy seeks to maximise return on risk adjusted capital while satisfying all the regulatory requirements. The Group’s policy on capital allocation is subject to regular review by the Board of Directors. The Group has complied with the externally imposed capital requirements set by the regulator for its consolidated capital adequacy ratio throughout the year.
37 SUBSEQUENT EVENTS
Subsequent to the year end, the Board of Directors approved a plan to acquire financial institutions and real estate infrastructure investments through issuance of new shares of the Bank upto 3.4 billion subject to regulatory and shareholders approvals. If the plan materialize, this will have a significant impact on Group’s consolidated financial statements going forward.
38 APPROPRIATIONS
The Board of Directors proposes the following appropriations subject to shareholders approval in annual general meeting. Remuneration of US$ 2.5 million to the Board of Directors; Dividend of 20% of the paid-up share capital amounting to US$ 120 million in the form of cash
(10%) and bonus shares (10%); Appropriation of US$ 2 million towards charity for the year; and Appropriation of US$ 1.5 million towards zakah for the year.
39 COMPARATIVES Certain prior year amounts have been regrouped to conform to the current year’s presentation. Such regrouping did not affect previously reported profit for the year or owners’ equity.